Article

Land Space Change Process and Its Eco-Environmental Effects in the Guanzhong Plain Urban Agglomeration of China

1
School of Geography and Tourism, Shaanxi Normal University, Xi’an 710119, China
2
Key Laboratory of Regional Sustainable Development Modeling, Institute of Geographic Sciences and Natural Resources Research, Chinese Academy of Sciences, Beijing 100101, China
3
College of Resources and Environment, University of Chinese Academy of Sciences, Beijing 100049, China
*
Author to whom correspondence should be addressed.
Land 2022, 11(9), 1547; https://doi.org/10.3390/land11091547
Submission received: 8 August 2022 / Revised: 3 September 2022 / Accepted: 8 September 2022 / Published: 12 September 2022
(This article belongs to the Special Issue The Eco-Environmental Effects of Urban Land Use)

Abstract

:
Urban agglomeration is the strategic core area of social–economic high-quality development in the world. However, high-density agglomeration and high-speed expansion have caused dramatic changes in land space, leading to prominent eco-environmental problems and, thus, threatening human well-being. How to solve the contradiction between urban agglomeration land expansion and eco-environment protection has become an urgent scientific problem. In this paper, we constructed a framework of assessing land space change and its eco-environmental effects in the urban agglomeration by using the Geo-informatic Graphic, eco-environmental quality index (EQI), and eco-environmental contribution rate. We then quantitatively analyzed the characteristics of land space transition as well as its eco-environmental effects in the Guanzhong Plain urban Agglomeration (GPUA) based on the land use data in 1990, 2000, 2010 and 2020. The results indicated that from 1990 to 2020, the production space of the GPUA continued to shrink, the living space continued to expand, and the ecological space showed a fluctuating increasing trend. There were significant regional differences in the land space change of the GPUA, with 92.2% of the counties showing a significant contraction in agricultural production space, 93.3% and 91.1% showing a significant expansion in urban and rural living space, and 64.4% showing an increase in woodland ecological space. Agricultural production space is transformed into ecological space and living space, and living space occupies ecological space and agricultural production space, which is the main mode of land space transition in the GPUA. With the continuous expansion of low-quality and high-quality areas of the eco-environment and the continuous contraction of medium-quality areas, the improvement and deterioration of the eco-environmental quality of the GPUA have coexisted, first showing a trend of deterioration and then improvement. The transition of agricultural production space into grassland and woodland ecological space improved the eco-environmental quality, while the transition of grassland ecological space into agricultural production space, and the occupation of agricultural production space by urban and rural living space as well as industrial and mining production space resulted in the deterioration of eco-environmental quality. The findings of this study may provide a theoretical basis for optimizing the allocation of land space resources in ecologically fragile urban agglomeration.

1. Introduction

Land space is an important support for human social and economic activities and the construction of the earth’s community [1,2]. Since the 1950s, with the rapid development of urbanization and industrialization, the spatial utilization pattern of the earth’s surface has undergone dramatic changes [3,4], resulting in a clash between human and land in the region, intensification of ecological–production–living spatial conflicts [5,6], and increasingly prominent problems of ecological destruction and environmental pollution. Research on the space change in national land and its eco-environmental effects is based on the regional human–land coupling system and has become a hot and frontier field of global change and sustainability science [7,8].
The development, utilization, and optimal allocation of land space are the key areas of concern to governmental organizations and academia [9]. Western developed countries, such as the United States, United Kingdom, and France, have responded to the development dilemma brought about by industrialization and urbanization by optimizing the spatial pattern of territory and strengthening environmental protection [10,11]. The Chinese government has also established the land space optimization goal of “intensive and efficient production space, moderate living space, and beautiful ecological space” [12], which provides scientific guidance for the construction of sustainable land space development and protection pattern [13]. Urban agglomeration is an important support for the strategic layout of urbanization and the pattern of ecological civilization in China. Under the influence of high-intensity human activities, the spatial pattern and form of regional land are undergoing profound reconstruction, and the resulting conflict between urbanization and the protection of the ecological environment is not compatible with the actual development of urban agglomeration in the period of accelerated urbanization [14,15,16]. Therefore, it is of great significance to scientifically recognize the process of land space transition and its ecological and environmental effects to resolve the conflict between land space development and protection in urban agglomeration areas, formulate land space optimization management and control strategies, and enhance the sustainability of land space utilization in urban agglomeration areas.
For a long time, a large number of problems, such as environmental pollution and ecological degradation, have occurred in the process of land space transition, and this has seriously affected the sustainable development of the social economy in regions, especially with regard to urban agglomerations [17,18]. Therefore, land space transition and its ecological and environmental effects have become the focus of attention of scholars at home and abroad [19,20]. Academic scholars have carried out extensive theoretical research and empirical exploration around the issues of land space development and utilization, the land space classification system, land space transition, and its impact on the ecological environment [21]. Domestic scholars have focused on the theory of land space function [22,23], theory and framework of land space function [24,25], process of land space pattern change [26,27], driving mechanism of land space transition [28,29], and ecological effects of land space transition [30,31]. For example, Liu et al. analyzed the driving mechanism of the evolution of the land space development and protection pattern from three perspectives, which included the carrying capacity of resources and the environment, geo-relations, as well as culture and institutional mechanisms [32]. Based on the perspective of multi-function of land use, Fan et al. delineated the basic pattern of land and space development and protection in China at the macro level [33]. Foreign scholars focus on land space utilization and ecological service value [34,35], ecological environment response of land space utilization [36,37], as well as land space planning practice [38] and other related issues. They carry out research work on land space development and land use model simulation in typical regions [39], which involves the identification of key obstacles to land space development [40]. For example, Morshed et al. simulated the trend change in the land spatial pattern of Jashore in Bangladesh and analyzed the land use pattern of the city [41]. Eziz et al. explored the coupling relationship between the change in the ecological environment and the conversion of land use in Keriya Oasis and revealed the response of ecological environment to the evolution of the land space pattern [42].
As the main area of new urbanization and the “center of gravity” of national economic development, urban agglomeration is the key area of world economic agglomeration. However, high-density agglomeration and high-speed expansion have brought about a drastic transformation of land space, which has led to serious ecological and environmental problems and is increasingly attracting global attention [43,44]. With the rapid improvement of the urbanization level, the development process of urban agglomeration and the rapid expansion of urban land have accelerated the conversion of natural ecological land to artificial construction land, which has brought great pressure on the ecological environment [45,46]. For example, Fang et al. studied the impact of urban agglomeration construction land expansion on the ecological environment on the northern slope of Tianshan Mountain, and they found that with the development of urbanization, the positive impact of urban agglomeration construction land change on the ecological environment was more obvious after 2000 [47]. Zhang and Gu believed that under the influence of factors such as high-speed urbanization and disorderly urban sprawl, the degree of land use conflict in urban agglomerations has intensified year by year, which is concentrated in the transformation of land use conflict hot spots from rural space to urban space [48]. However, the existing research mainly focuses on the analysis of the spatial evolution process of specific urban land in the rapid urbanization area. Besides, the law of land spatial transformation and its impact on the ecological environment of ecologically fragile urban agglomerations are still unclear.
The Guanzhong Plain Urban Agglomeration (GPUA) is the largest urban agglomeration in Northwest China and an important engine of economic growth in Northwest China, which has significant geographical advantages and a profound cultural and historical background [49]. However, in the process of rapid urbanization and industrialization in the region, the development and utilization of land space is extensive or even disorderly, and the ecological environment problems are becoming increasingly prominent, which seriously restricts the high-quality development of the regional social economy [50]. In recent years, with the improvement of the status of the GPUA in the overall strategic pattern of China, the impact of land use change of urban agglomeration on the ecological environment has gradually attracted the attention of academic circles. For example, Peng et al. simulated the impact of urban land spatial expansion of the GPUA on the supply and demand pattern of ecosystem services under different land use scenarios in the future [16]; Yang and Su explored the trade-off and synergy between different ecosystem services in the GPUA by using the PLUS model and ESV calculation method [51]. Ye et al. simulated the land use and habitat quality change pattern of the GPUA from 2000 to 2035 by using the FLUS and InVEST model [17]. These research results have laid a theoretical and methodological foundation for the in-depth study of land spatial transformation and ecological environment effects. However, existing studies have not paid enough attention to the process and pattern of land space transition in the GPUA for a long time. The contribution rate of land space transition of urban agglomerations to the eco-environment quality has not been scientifically determined. The research on the special evolution characteristics of land space transition of urban agglomerations and its impact on the fragile ecological environment is still weak [44,47]. Therefore, based on the theory of production–living–ecological spaces and with the support of GIS technology, we studied the spatial-temporal change process of land space and its ecological environment effect in the GPUA from 1990 to 2020. The purpose of this study was as follows: (1) to clarify the spatio-temporal pattern of land space change in the GPUA; (2) to determine the eco-environmental contribution rate of land space transition in the GPUA; and (3) to discuss the eco-environmental impact mechanism of land space change in the GPUA. The research findings may provide a scientific basis and policy enlightenment for addressing the conflict between land space development and protection in urban agglomeration areas, optimizing the allocation of land space resources in urban agglomerations and promoting the improvement of ecological environment quality in urban agglomerations.

2. Materials and Methods
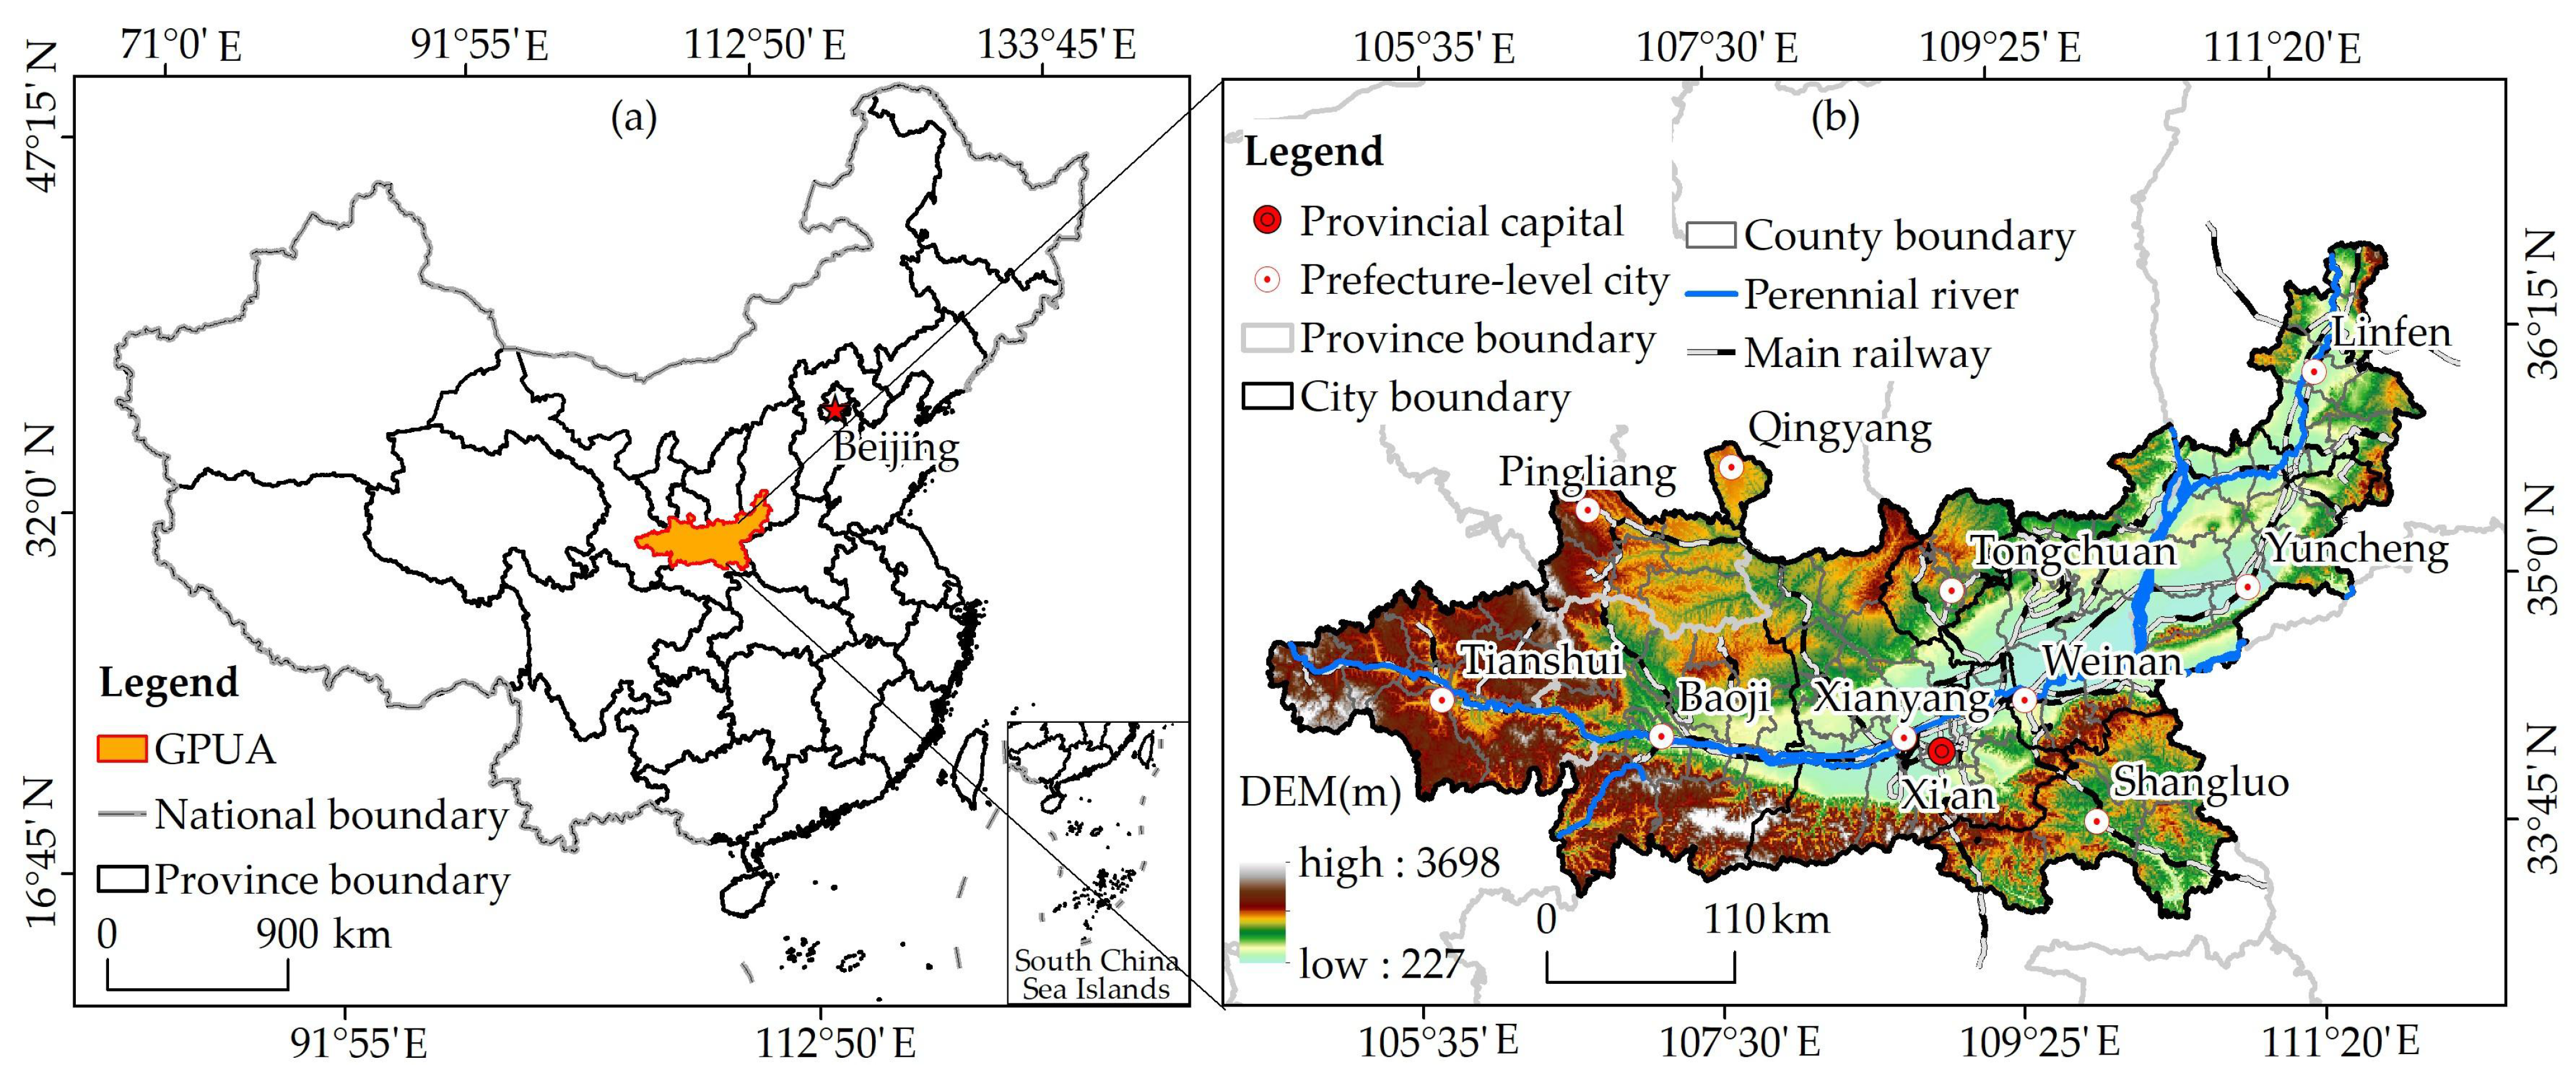
2.1. Study Area

The GPUA is located in the middle of the Yellow River Basin, between 33°57′~36°34′ N and 104°35′~113°13′ E, involving 91 counties and districts of 11 prefecture-level cities in Shaanxi, Gansu, and Shanxi provinces (Figure 1) and with a total area of about 107,100 square kilometers. It accounts for 1.12% of the national land area and is the second-largest urban agglomeration in western China. In 2019, the permanent population of the GPUA was 44.85 million, accounting for 10.4% of the population in the western region. The total GDP reached 289.60 billion USD, accounting for 9.7% of the western region and exceeding 2.2% of the whole country, and the urbanization rate was 61.34% [17]. The region is the center of economic growth in the western region of China, undertaking the mission of urbanizing the northwest and driving the social and economic development, as well as the eco-environmental protection, of the surrounding areas. Regional urbanization is in a period of accelerated development, with dramatic changes in the land space pattern; significant regional differences in the level of urbanization and the quality of the eco-environment; and increasingly prominent problems, such as ecological damage, environmental pollution, and resource consumption. These problems are caused by the unreasonable development of land space as well as increasing conflicts with regional ecological protection and high-quality development [50]. Therefore, how to solve the contradiction between urban agglomeration land space change and eco-environment protection has become an urgent need to meet the practical needs of national and regional development and achieve the goals of high-quality urbanization development and a high-value ecological environment of urban agglomerations.

2.2. Research Methods

The research framework of this study aimed to clarify the process of land space (production–living–ecological) pattern change and its eco-environmental effects in the GPUA (Figure 2), and this involved three steps: (1) determination of the land space pattern and its structural characteristics according to the land space classification system; (2) clarification of the process and mode of land space transition through the Geo-informatic Graphic; (3) analysis of the spatio-temporal variation of the regional ecological environmental quality through the ecological unit eco-environmental quality index (EQI) model and the use of the eco-environmental contribution rate model to reveal the eco-environmental effects of land space transition and clarify the dominant land space transition mode causing changes in the EQI.
Specifically, this paper adopted a trichotomy method based on production, living, and ecological land to cover different types of land, and it reflects the multi-dimensional objectives of regional social–economic development through economic production, ecological environment, and livable life [12,14]. Then, based on the subjective land use intentions of different actors, it constructed a classification scheme of land-space-leading functions of urban agglomerations, and it identified the spatial distribution pattern of the GPUA. The Geo-informatic Graphic is a land use atlas model integrating spatial, process, and attribute characteristics [52]. This model could effectively analyze the transition trend and quantitative relationship among the three types of land spaces in the GPUA and reveal the changing characteristics of the regional land space pattern. Due to the scale dependence of geospatial data, the analysis scale selected in the study directly affected the research results and main conclusions [53]. In order to obtain the most suitable research scale, this paper considered each land use patch as a sampling point, and the GPUA was sampled at equal intervals by using 2 km × 2 km fishing nets through multiple debugging to generate 27,803 sample areas (ecological units). Then, combined with the internal production–living–ecological spaces structure of each ecological unit and its eco-environment quality attributes, we comprehensively analyzed the eco-environment quality.

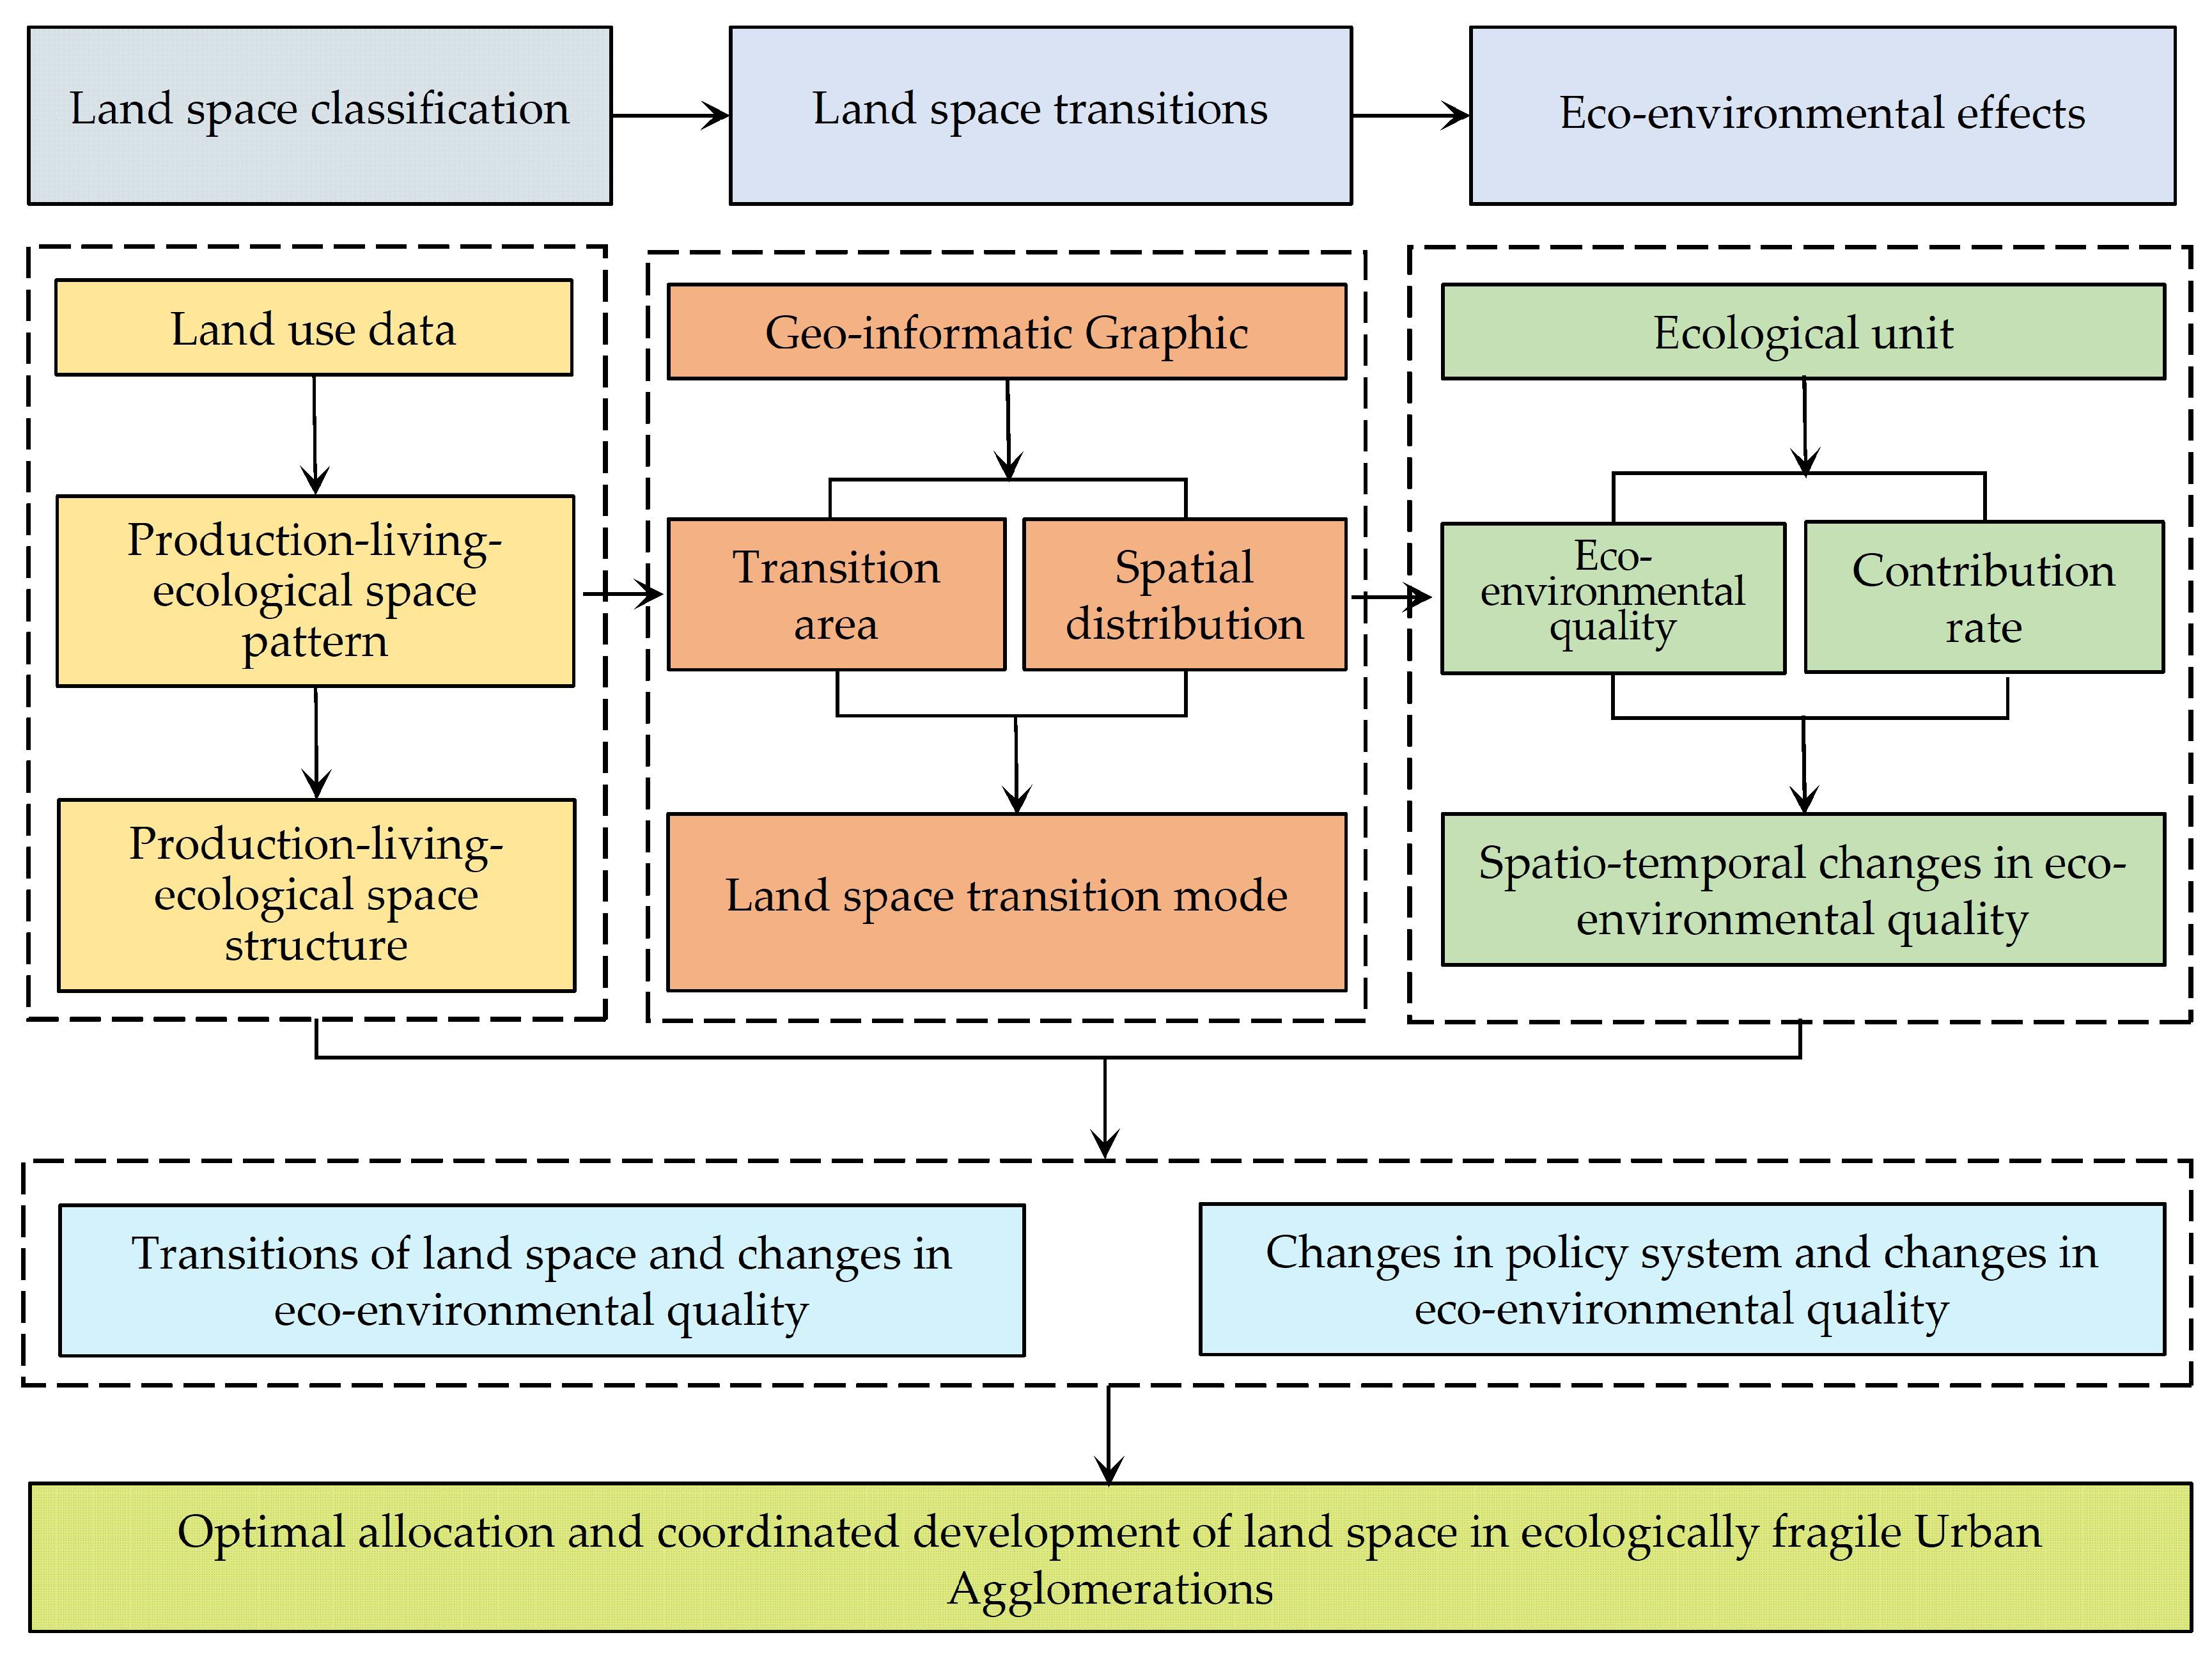
2.2.1. Geo-Informatic Graphic

The Geo-informatic Graphic is a model that reflects the spatial heterogeneity of land space transition and its time-series change process [52]. The calculation formula is as follows:
C l = C a × 10 + C b
where Cl is the total area of land space. Ca and Cb are the land space types at the beginning and end of the study, respectively. In this study, ArcGIS10.2 software was used to conduct a superposition analysis, perspective processing, and summary statistics of land spatial type data and obtain the transfer area of the land space area of the GPUA for each time period.

2.2.2. EQI of Ecological Unit

Considering the eco-environmental quality and the area proportion of production–living–ecological spaces in each ecological unit, the ecological environmental quality of each ecological unit in the region was calculated [54]. The calculation formula is as follows:
E V i = i = 1 N A k i A k R i
In the formula, EVi represents the EQI of the ith ecological unit; Aki and R,i represent the area of the ith land space type and its eco-environmental quality coefficient, respectively; Ak represents the total area of land space; N is the number of land space types. Using a GIS spatial analysis model, the EVi can be divided into five levels [54], namely low-quality area (EVi < 0.2), low–medium-quality area (0.2 ≤ EVi < 0.35), medium-quality area (0.35 ≤ EVi < 0.5), medium–high-quality area (0.50 ≤ EVi < 0.65), and high-quality area (EVi ≥ 0.65).

2.2.3. Eco-Environmental Contribution Rate of Land Space Change

The eco-environmental contribution rate of land space change refers to the change in the regional ecological environmental quality caused by the change in a certain type of land space [55]. The calculation formula is:
S G = S G I t + 1 S G I t × B M / Z M × 100  
In the formula, SG is the ecological contribution rate of land space change; SGIt and SGIt+1 are the ecological environment quality indexes of the land space at the beginning and end of a certain land space change type; BM is the area of changed land space; ZM is the total area of the GPUA. In this paper, using the support of ArcGIS10.2 software, the types and areas of land spatial transition were obtained, and the land spatial types affecting the changes in ecological environmental quality in the GPUA were statistically screened out. Furthermore, the dominant types of land spatial transition for the improvement or deterioration of the ecological environment in the urban agglomeration were determined.

2.3. Data Sources and Processing

Land use data (1990, 2000, 2010, and 2020) were obtained from the Data Center for Resources and Environmental Sciences, Chinese Academy of Sciences (http://www.resdc.cn), with a spatial resolution of 30 m × 30 m. The Landsat TM/ETM remote sensing image was used as the main data source. After the processing of band synthesis, geometric correction, image enhancement and other processing, we obtained the land use data through manual visual interpretation [4], which included six first-level land spatial types and 25 s-level land spatial types. The accuracy of first-level and second-level land use classification was >90% [56]. In order to evaluate the applicability of these data in the GPUA, this paper firstly superimposed the land use data in each period and then extracted the unchanged areas, from which 500 points were randomly selected in this area by computer, and it finally superimposed them with high-resolution satellite images from Google Earth for accuracy testing. The comprehensive evaluation accuracy of land use data in each period exceeded 86% [30], which was suitable for the analysis of changes of the land space pattern in urban agglomerations.
The administrative boundary data and traffic network data of the GPUA are from the National Basic Geographic Information Center (http://www.ngcc.cn, accessed on 15 May 2022). The DEM (Digital Elevation Model) data are from the Shuttle Radar Topography Mission of the Computer Network Information Center of the Chinese Academy of Sciences, with a spatial resolution of 90 m.

2.4. Land Space Classification System

There are many forms of land space classification, and the land classification based on production–living–ecological spaces focuses on the main role and function of various types of land in human production and life. From the perspective of the multi-function of land space, according to the land use classification system of the Chinese Academy of Sciences [57] and the classification of the second national land use survey (GB/T21010-2007), combined with the reality of land space development and protection of the GPUA, this paper adhered to the classification principle of giving priority to ecological functions and highlighting dominant functions, and it established the classification system of the “production–living–ecological” space of the Guanzhong Plain urban agglomeration. Therefore, we divided the land space of the GPUA into three first-class types and eight second-class types based on the perspective of “production–living–ecological” space and the leading function of land use. Furthermore, it formulated the ecological environmental quality values of different second-class land space types [58]. Finally, the area weighting method was used to assign the eco-environmental quality coefficients of various land spaces (Table 1).

3. Results

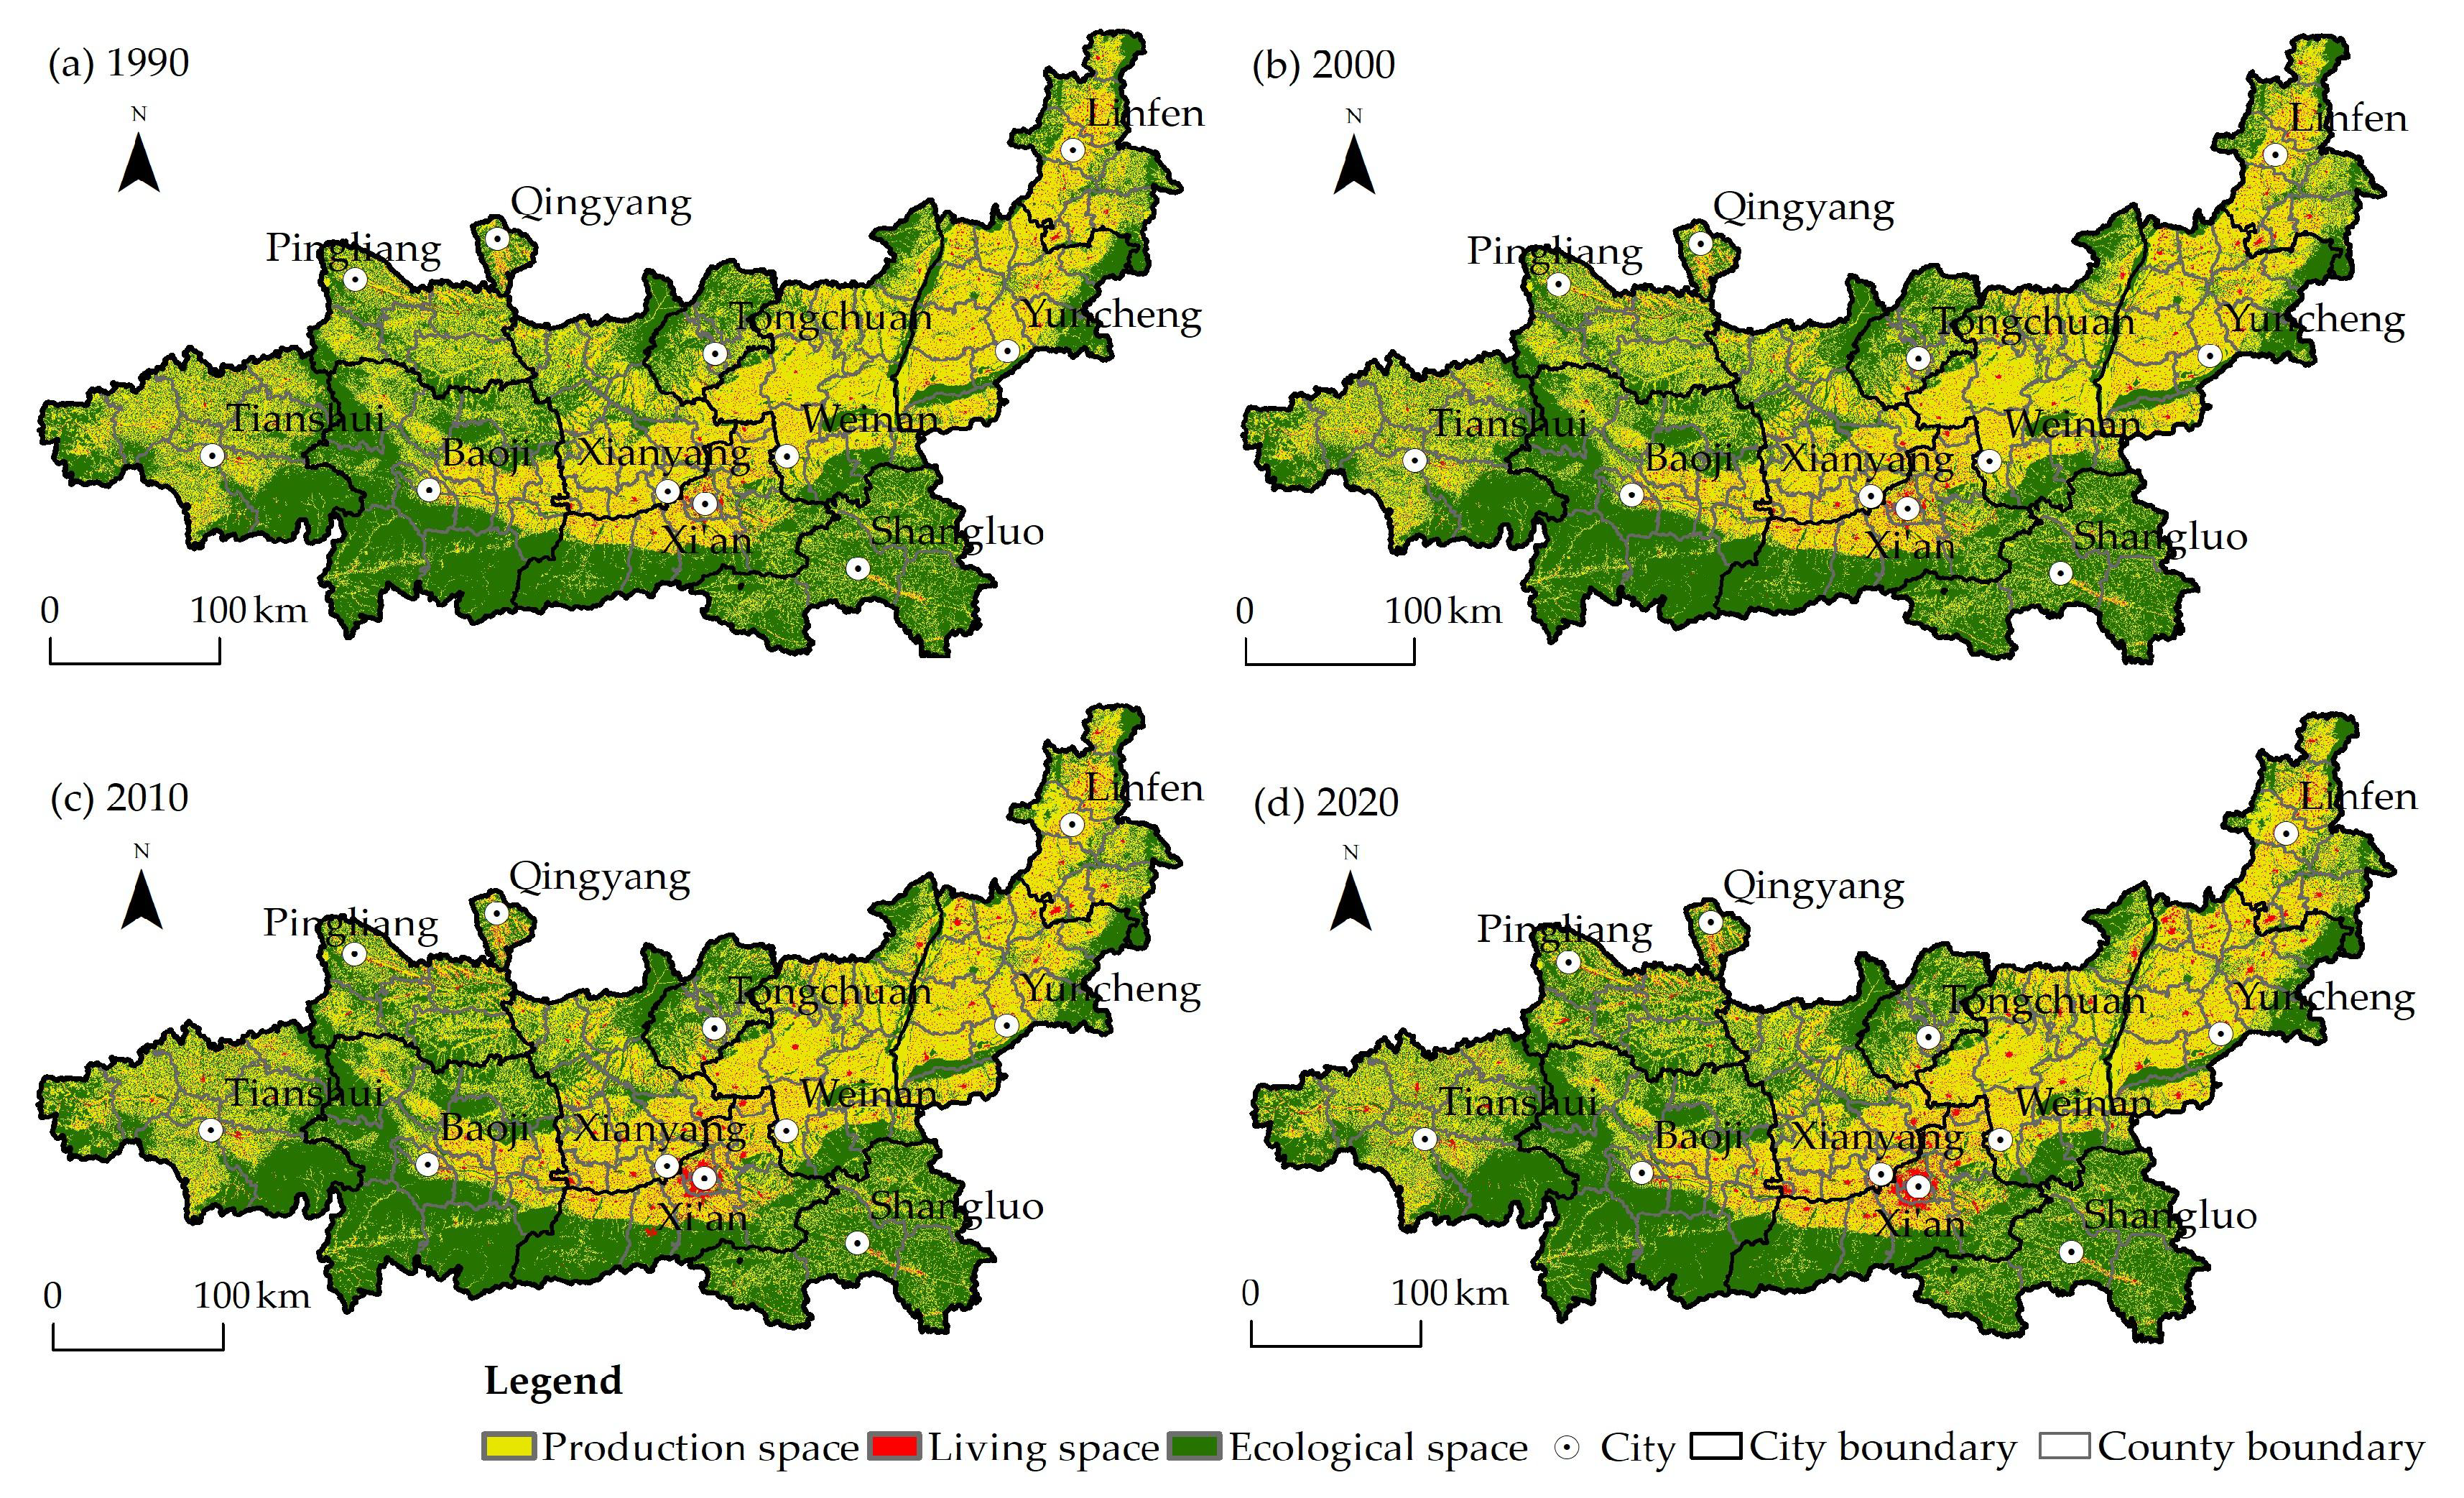
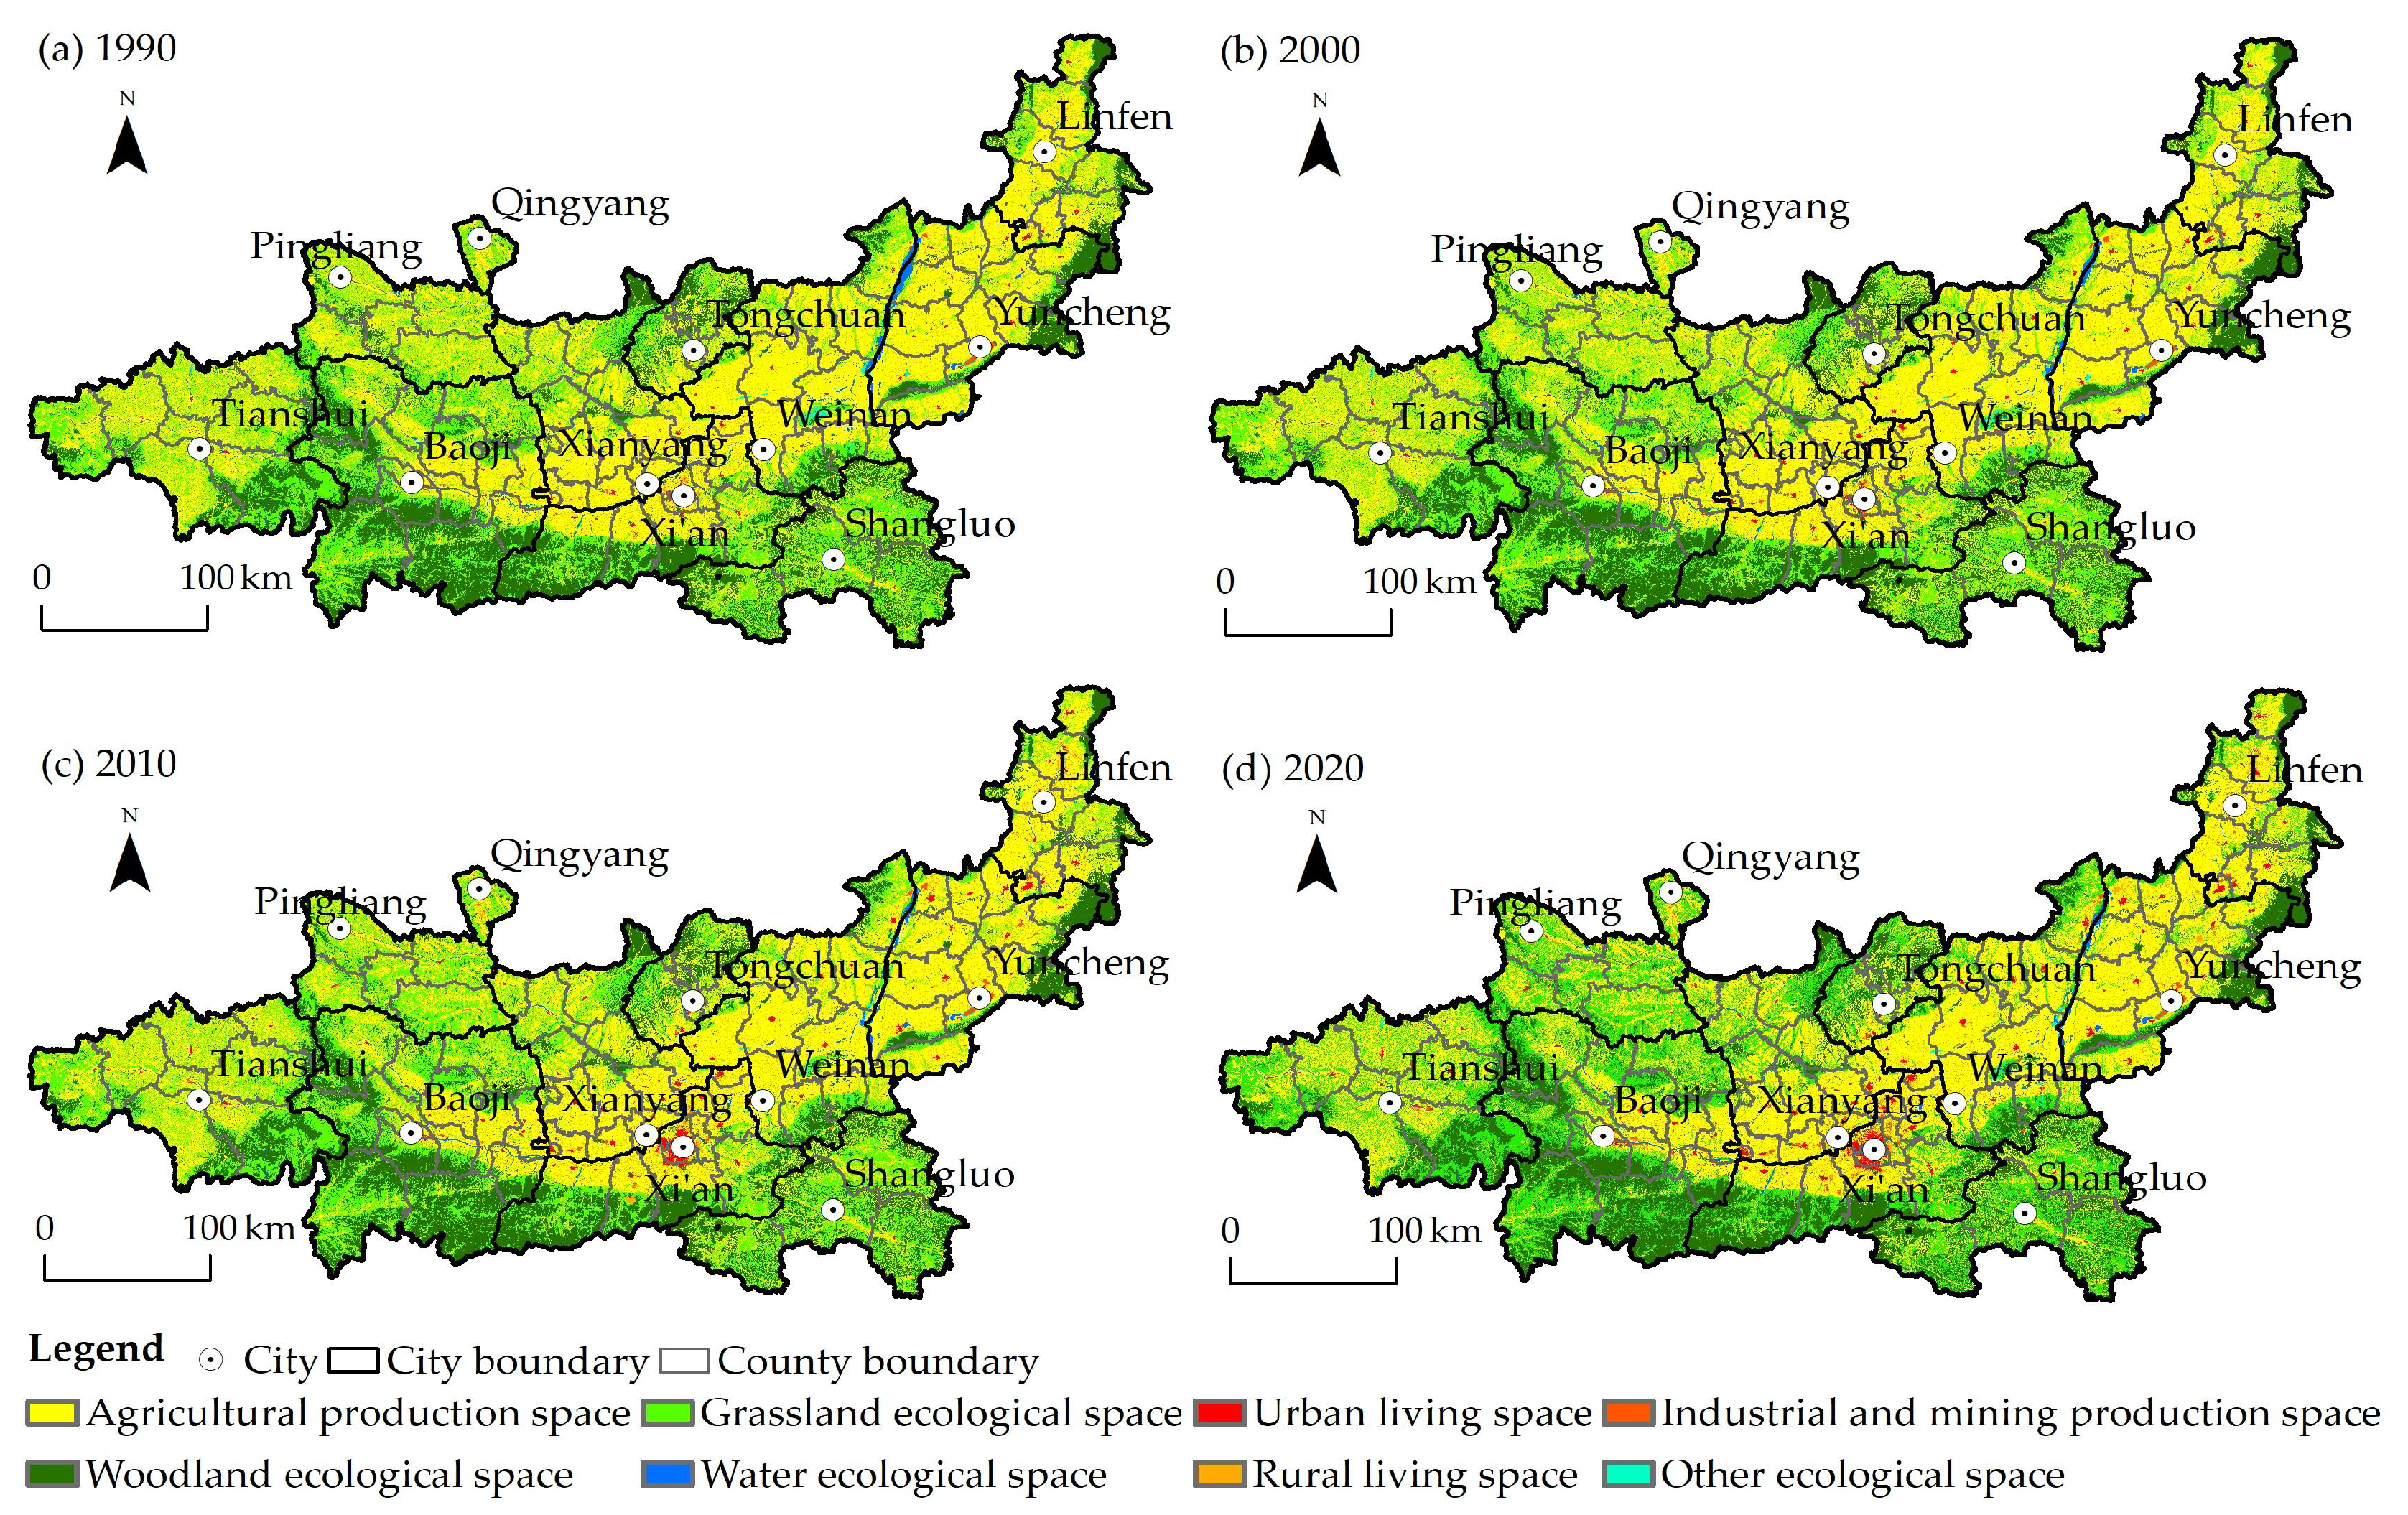
3.1. Characteristics of Changes in Land Space Structure

From 1990 to 2020, the production–living–ecological space area of the GPUA significantly changed (Figure 3). Over the past 30 years, the proportion of production space, living space, and ecological space in the GPUA changed from 46.66%, 3.51%, and 49.83% to 44.44%, 5.10%, and 50.47%, respectively. This indicated that with the expansion of urban space and the development of social economy, the production space of the GPUA significantly decreased, and the living space significantly increased. The ecological space has been dominant for a long time, showing a fluctuating increasing trend.
Specifically, the agricultural production space was continuously reduced from 49,760.16 km2 in 1990 to 46,832.51 km2 in 2020 (Table 2), indicating a reduction of 2927.65 km2, and the proportion of the total area decreased from 46.50% to 43.76%. The rate of change was the largest between 2000 and 2010 and was mainly in urbanized areas and ecologically fragile areas. This is closely related to the implementation of ecological protection projects, such as the expansion of urban and rural construction land and the project involving the return of farmland to forest (grassland). The industrial and mining production space increased continuously from 174.29 km2 (0.16%) in 1990 to 722.36 km2 (0.68%) in 2020, indicating an increase of 548.08 km2. This was mainly in the central part of the GPUA, which included Xi’an and Xianyang and parts of Linfen and Yuncheng. The area of living space showed a continuous increasing trend. The living space in urban and rural areas increased from 528.35 km2 (0.49%) and 3227.16 km2 (3.02%) in 1990 to 1237.72 km2 (1.16%) and 4211.93 km2 (3.94%) in 2020, with an increase of 709.36 km2 and 984.77 km2, respectively. The ecological space area showed a fluctuating increasing trend, with an increased area of 684.75 km2 in 30 years, of which the ecological space of woodland and grassland significantly increased from 23,095.32 km2 and 28,700.95 km2 in 1990 to 23,250.52 km2 and 29,314.26 km2 in 2020; the increase was 155.20 km2 and 613.30 km2, and the proportion of the total area increased from 21.58% and 26.82% to 21.73% and 27.39%, respectively. It is worth noting that there was a synergistic relationship between the change in the ecological space of woodland and grassland from 1990 to 2020, and the change in ecological space area of woodland had a trend of “first decreasing, increasing, and then decreasing”, while the ecological space of grassland has a trend of “first decreasing and then increasing”. However, the water ecological space and other ecological spaces generally showed a continuous decreasing trend and then increasing, with a decrease of 44.66 km2 and 39.09 km2, respectively, during the study period.

3.2. Characteristics of Regional Differences in Land Space Change

There was a significant difference in the spatial pattern of the GPUA. The production and living spaces were mainly concentrated in the urbanized areas, such as Xi’an, Xianyang, Baoji, and Weinan, in the central part of the GPUA; Linfen; and Yuncheng in the north, while the ecological space was mainly concentrated in Tongchuan, Shangluo, Tianshui, and the south of Baoji (Figure 4).
From 1990 to 2020, 92.2% of the counties in the GPUA had their agricultural production space contracted, and 6.7% of the counties had their agricultural production space expanded. Lingtai County, located in the northwest of the GPUA, had the largest reduction, with the reduction of agricultural production space reaching 282.15 km2. Yaodu District, located in the northeast of the GPUA, had a significant increase in agricultural production space, with an increase of about 125.75 km2. The counties with a contraction in the industrial and mining production space, stability, and expansion accounted for 2.2%, 2.2%, and 95.6%, respectively, of which Hejin City had the largest reduction, with an area reduction of 4.40 km2, and Salt Lake District and Pucheng County had the highest expansion of industrial and mining production space, with an increase of 31.99 km2 and 21.56 km2, respectively. The counties with a contracted urban living space only accounted for 6.7% of the total number of counties, while the living space of other counties had been expanded. Weiyang District of Xi’an City was the most typical, with an expansion area of 85.53 km2. The counties with expanded rural living space accounted for 91.1% of the total counties in the GPUA, while the counties with contraction mainly included Weiyang and Yanta Districts in Xi’an, Weibin District in Baoji, Yongji City in Yuncheng, and Houma City in Linfen. As key development areas of the GPUA, these counties showed markedly expanded urban space and occupied a large amount of rural living space.
The ecological space was mainly expanded, and the area of woodland ecological space increased in 64.4% of the counties and districts. The largest increase was in Dali and Jicheng Counties, reaching 46.34 km2 and 40.23 km2, respectively. The ecological space area of woodland in Chongxin and Yijun Counties decreased significantly by 74.25 km2 and 61.95 km2, respectively. The counties with expanded grassland ecological space accounted for 44.4% of the total counties in the GPUA. The largest increase was observed in Lingtai and Chongxin Counties, which were 271.58 km2 and 182.60 km2, respectively. The ecological space of grassland in Yaodu District and Dali County markedly reduced, reaching 202.39 km2 and 49.20 km2, respectively. The expansion of water ecological space was mainly concentrated in the areas where the Weihe River system and the Yellow River flow through. For example, the water expansion area of Lintong District in Xi’an City was 11.87 km2, and that of Yongji City in Yuncheng City was 16.26 km2. Wanrong and Linyi Counties has a serious reduction of water ecological space, which could be attributed to the over-exploitation of the Yellow, Fenhe, and Sushui Rivers and the soil erosion caused by the change in the natural geographical environment. Other counties and districts with reduced, stable, and expanded ecological space accounted for 17.8%, 34.4%, and 47.8%, respectively. Of these locations, Yongji City and Dali County had the largest reduction, Lingtai County and Kongtong District had the largest growth, and the ecological environmental quality significantly improved.

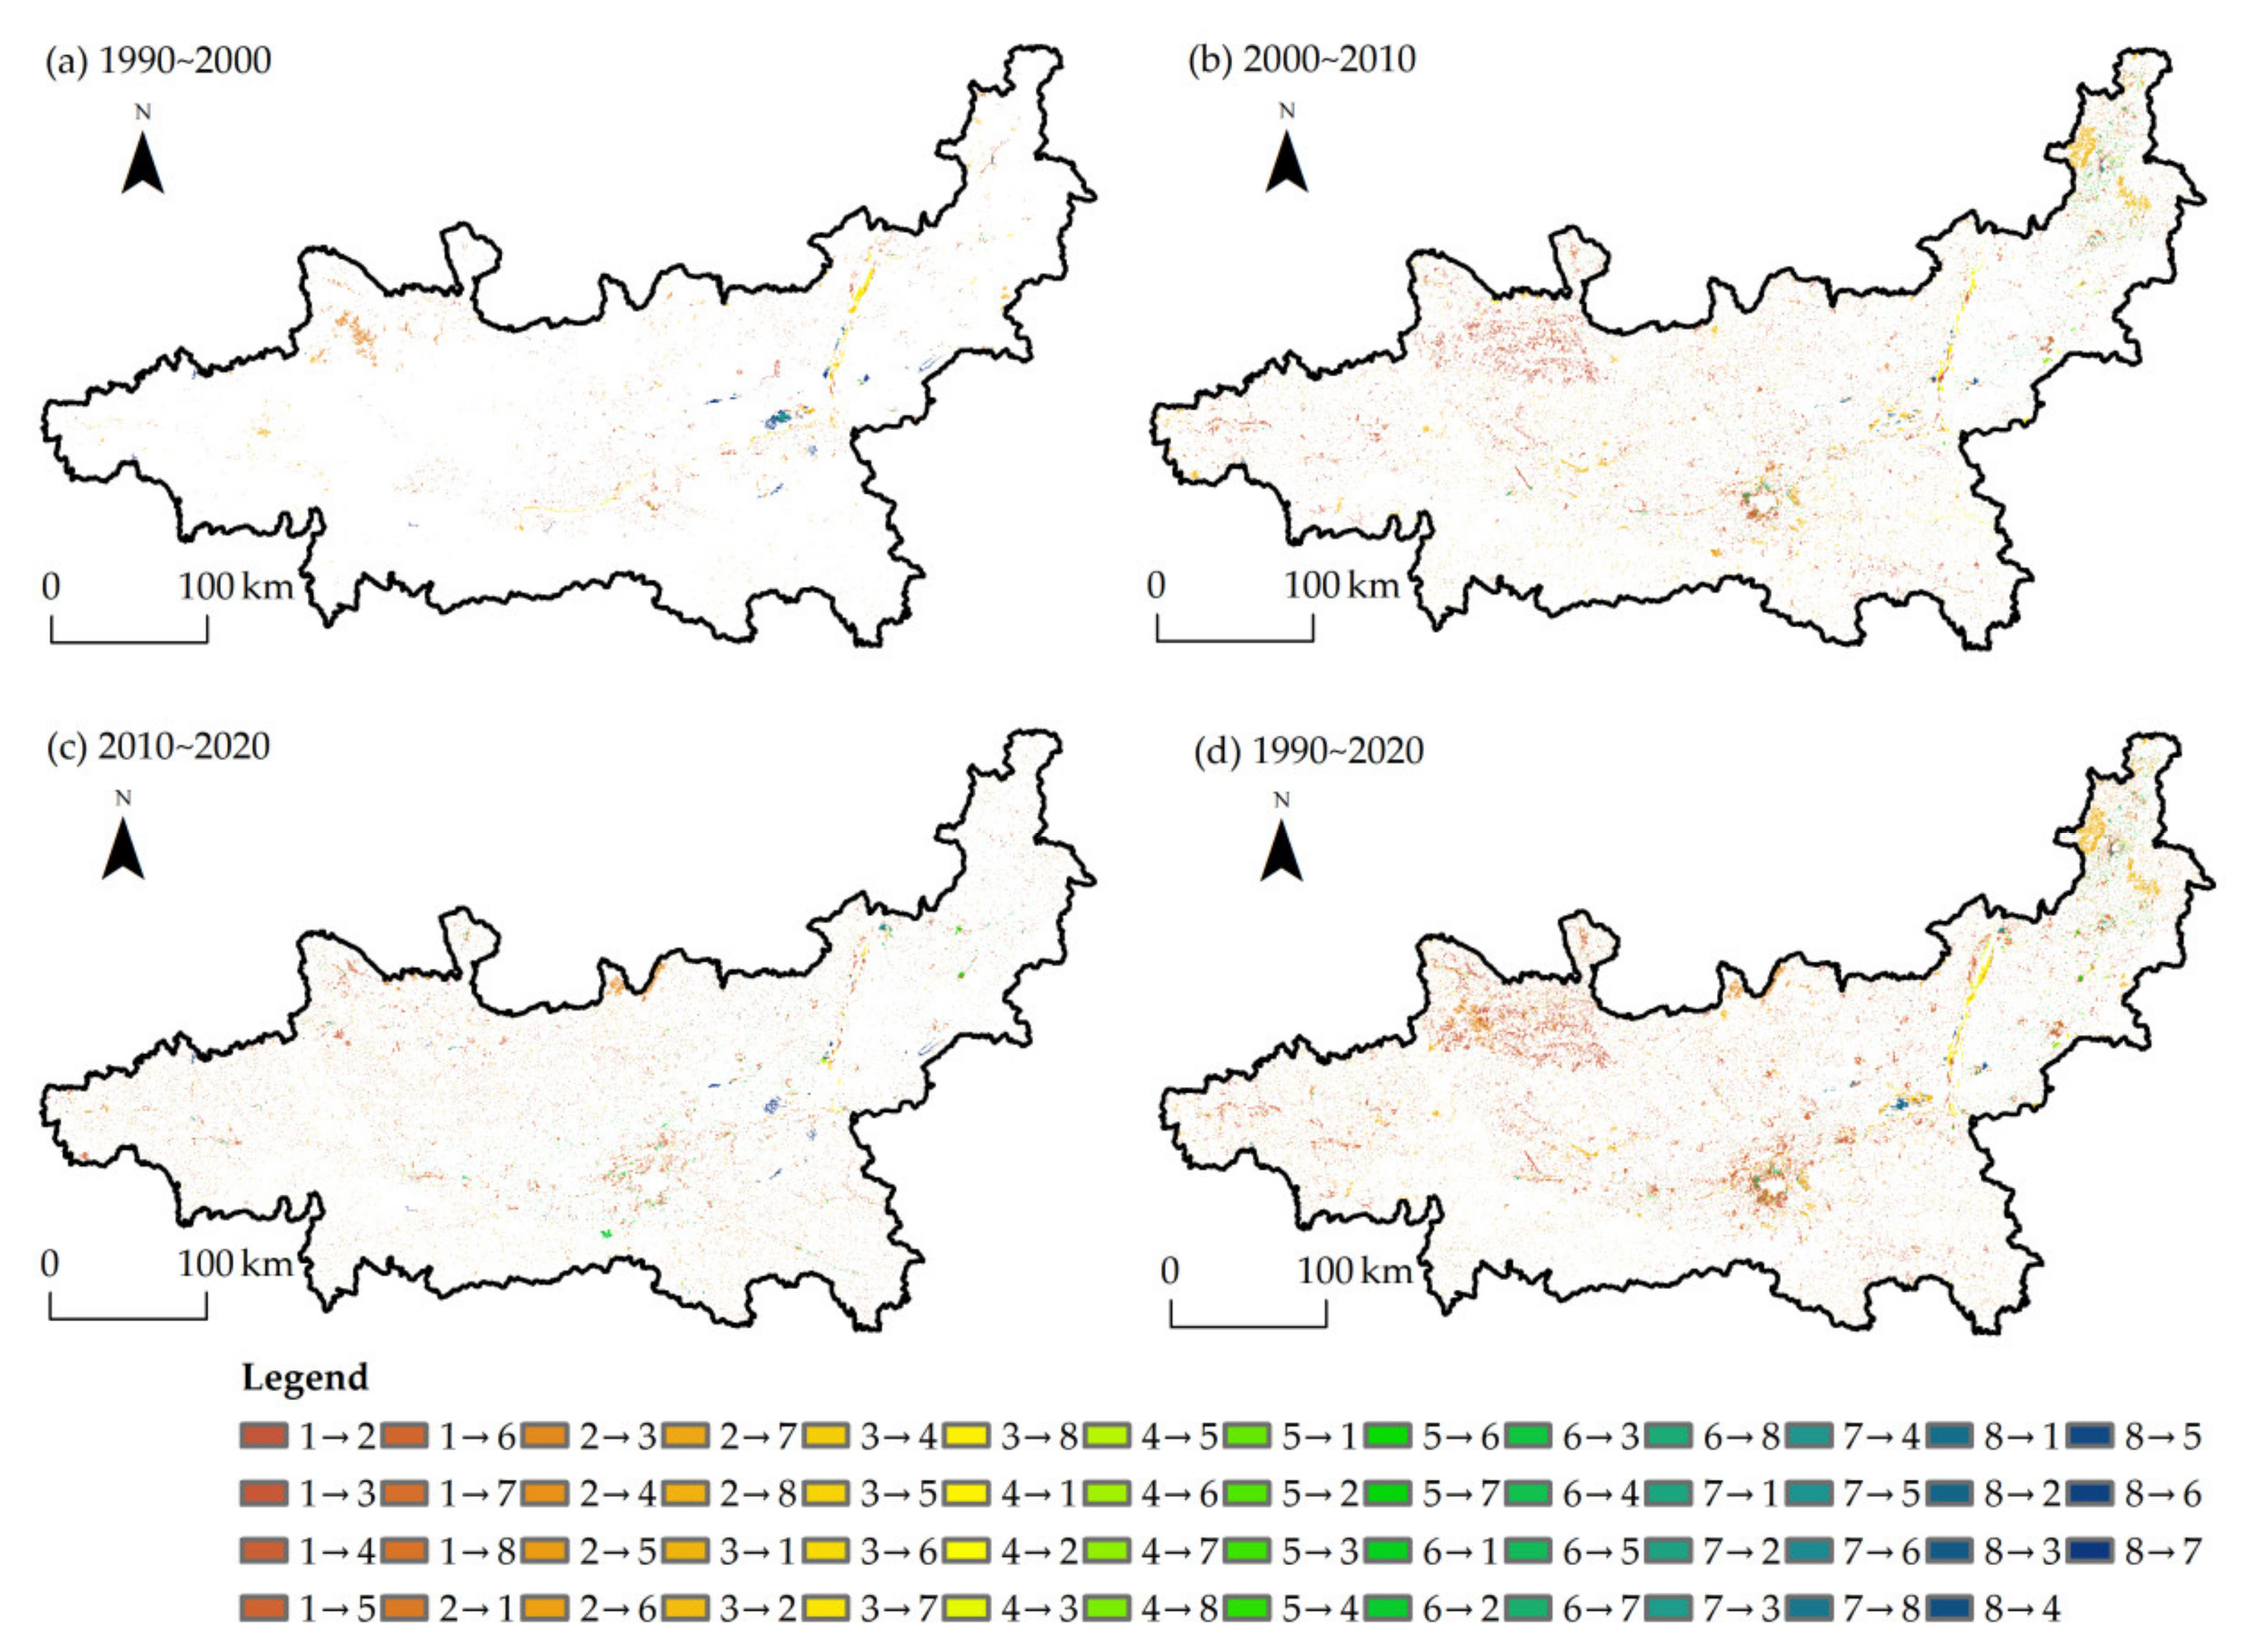
3.3. Transition Mode of Land Space

From 1990 to 2020, the land space of the GPUA markedly changed, the area of agricultural production space and grassland and water ecological space decreased, and the urban and rural living space significantly increased (Figure 5). In the past 30 years, most of the agricultural production space has been transformed into grassland ecological space and rural living space, with areas of 1754.88 km2 and 1230.80 km2, respectively. Industrial and mining production space has been mainly transformed into urban and rural living space, with the largest area of 13.36 km2 transformed into rural living space. The woodland ecological space was converted into grassland ecological space (544.17 km2) and agricultural production space (176.31 km2). The areas of grassland ecological space that were transformed into agricultural production space and woodland ecological space were 1158.77 km2 and 429.21 km2, respectively, and the transition rates were 4.3% and 1.6%, respectively. The transition from water ecological space to agricultural production space and grassland ecological space accounted for a large proportion, with transfer areas of 208.75 km2 and 54.31 km and transfer rates of 20.5% and 5.3%, respectively. Rural living space waas mostly converted into agricultural production space and urban living space, with conversion rates of 8.4% and 2.5%, respectively. Other ecological spaces were easily converted into agricultural production space, woodland, grassland, water body, and other ecological spaces, among which the area converted into woodland ecological space was the largest, reaching 34.75 km2, with a conversion rate of 30.8%.
With regard to different developmental stages, the transition from agricultural production space to rural living space was the largest from 1990 to 2000, with a transition area of 295.21 km2 and a transition rate of 0.6%, while the transition from industrial and mining production space and living space to other types of land space was small. Woodland ecological, grassland ecological, and water ecological spaces were mainly transformed into agricultural production space, and the transition of grassland ecological space was the most obvious at a transfer rate of 0.82% and a transfer area of 232.79 km2. Other ecological spaces were mainly converted into woodland ecological and water ecological spaces at transfer rates of 20.3% and 5.0%, respectively. From 2000 to 2010, the area of agricultural production space transformed into grassland ecological and rural living spaces significantly increased, and the area of transformed agricultural production space was 5.2-fold of the total area of agricultural production space in 1990~2000. The transformation of industrial and mining production space into other types of land space also showed an increasing trend, and the areas converted into agricultural production, urban living, and rural living spaces were 7.84 km2, 6.99 km2, and 2.91 km2, respectively. The transition of ecological space, such as woodland, grassland, and water areas, into agricultural production space has accelerated, and the transition area of production space and various ecological space into urban and rural living space has significantly increased, which is closely related to the rapid progress of regional urbanization and industrialization since 2000 and the spatial expansion of urban and rural construction land.
Compared with that observed from 2000 to 2010, the transition speed from ecological space, such as woodland and grassland, to agricultural production space slowed down from 2010 to 2020, which was 110.57 km2 and 463.95 km2, respectively, while the area transformed to living space showed a significant decreasing trend. The conversion of other land space types to woodland and grassland ecological space has been increasing. The conversion area of agricultural production space to urban and rural living space reduced, with conversion areas of 215.56 km2 and 384.59 km2, respectively, whereas the conversion area of living space to water ecological space and other ecological space increased. These changes could be attributed to the fact that, on the one hand, ecological protection policies, such as the return of farmland to forest (grassland), have effectively promoted regional ecological restoration. On the other hand, the promulgation and implementation of the national main functional area planning has effectively controlled the mode and intensity of land space development and utilization, providing scientific guidance for the development and utilization of land space in the GPUA.

3.4. Eco-Environmental Effects of Land Space Change

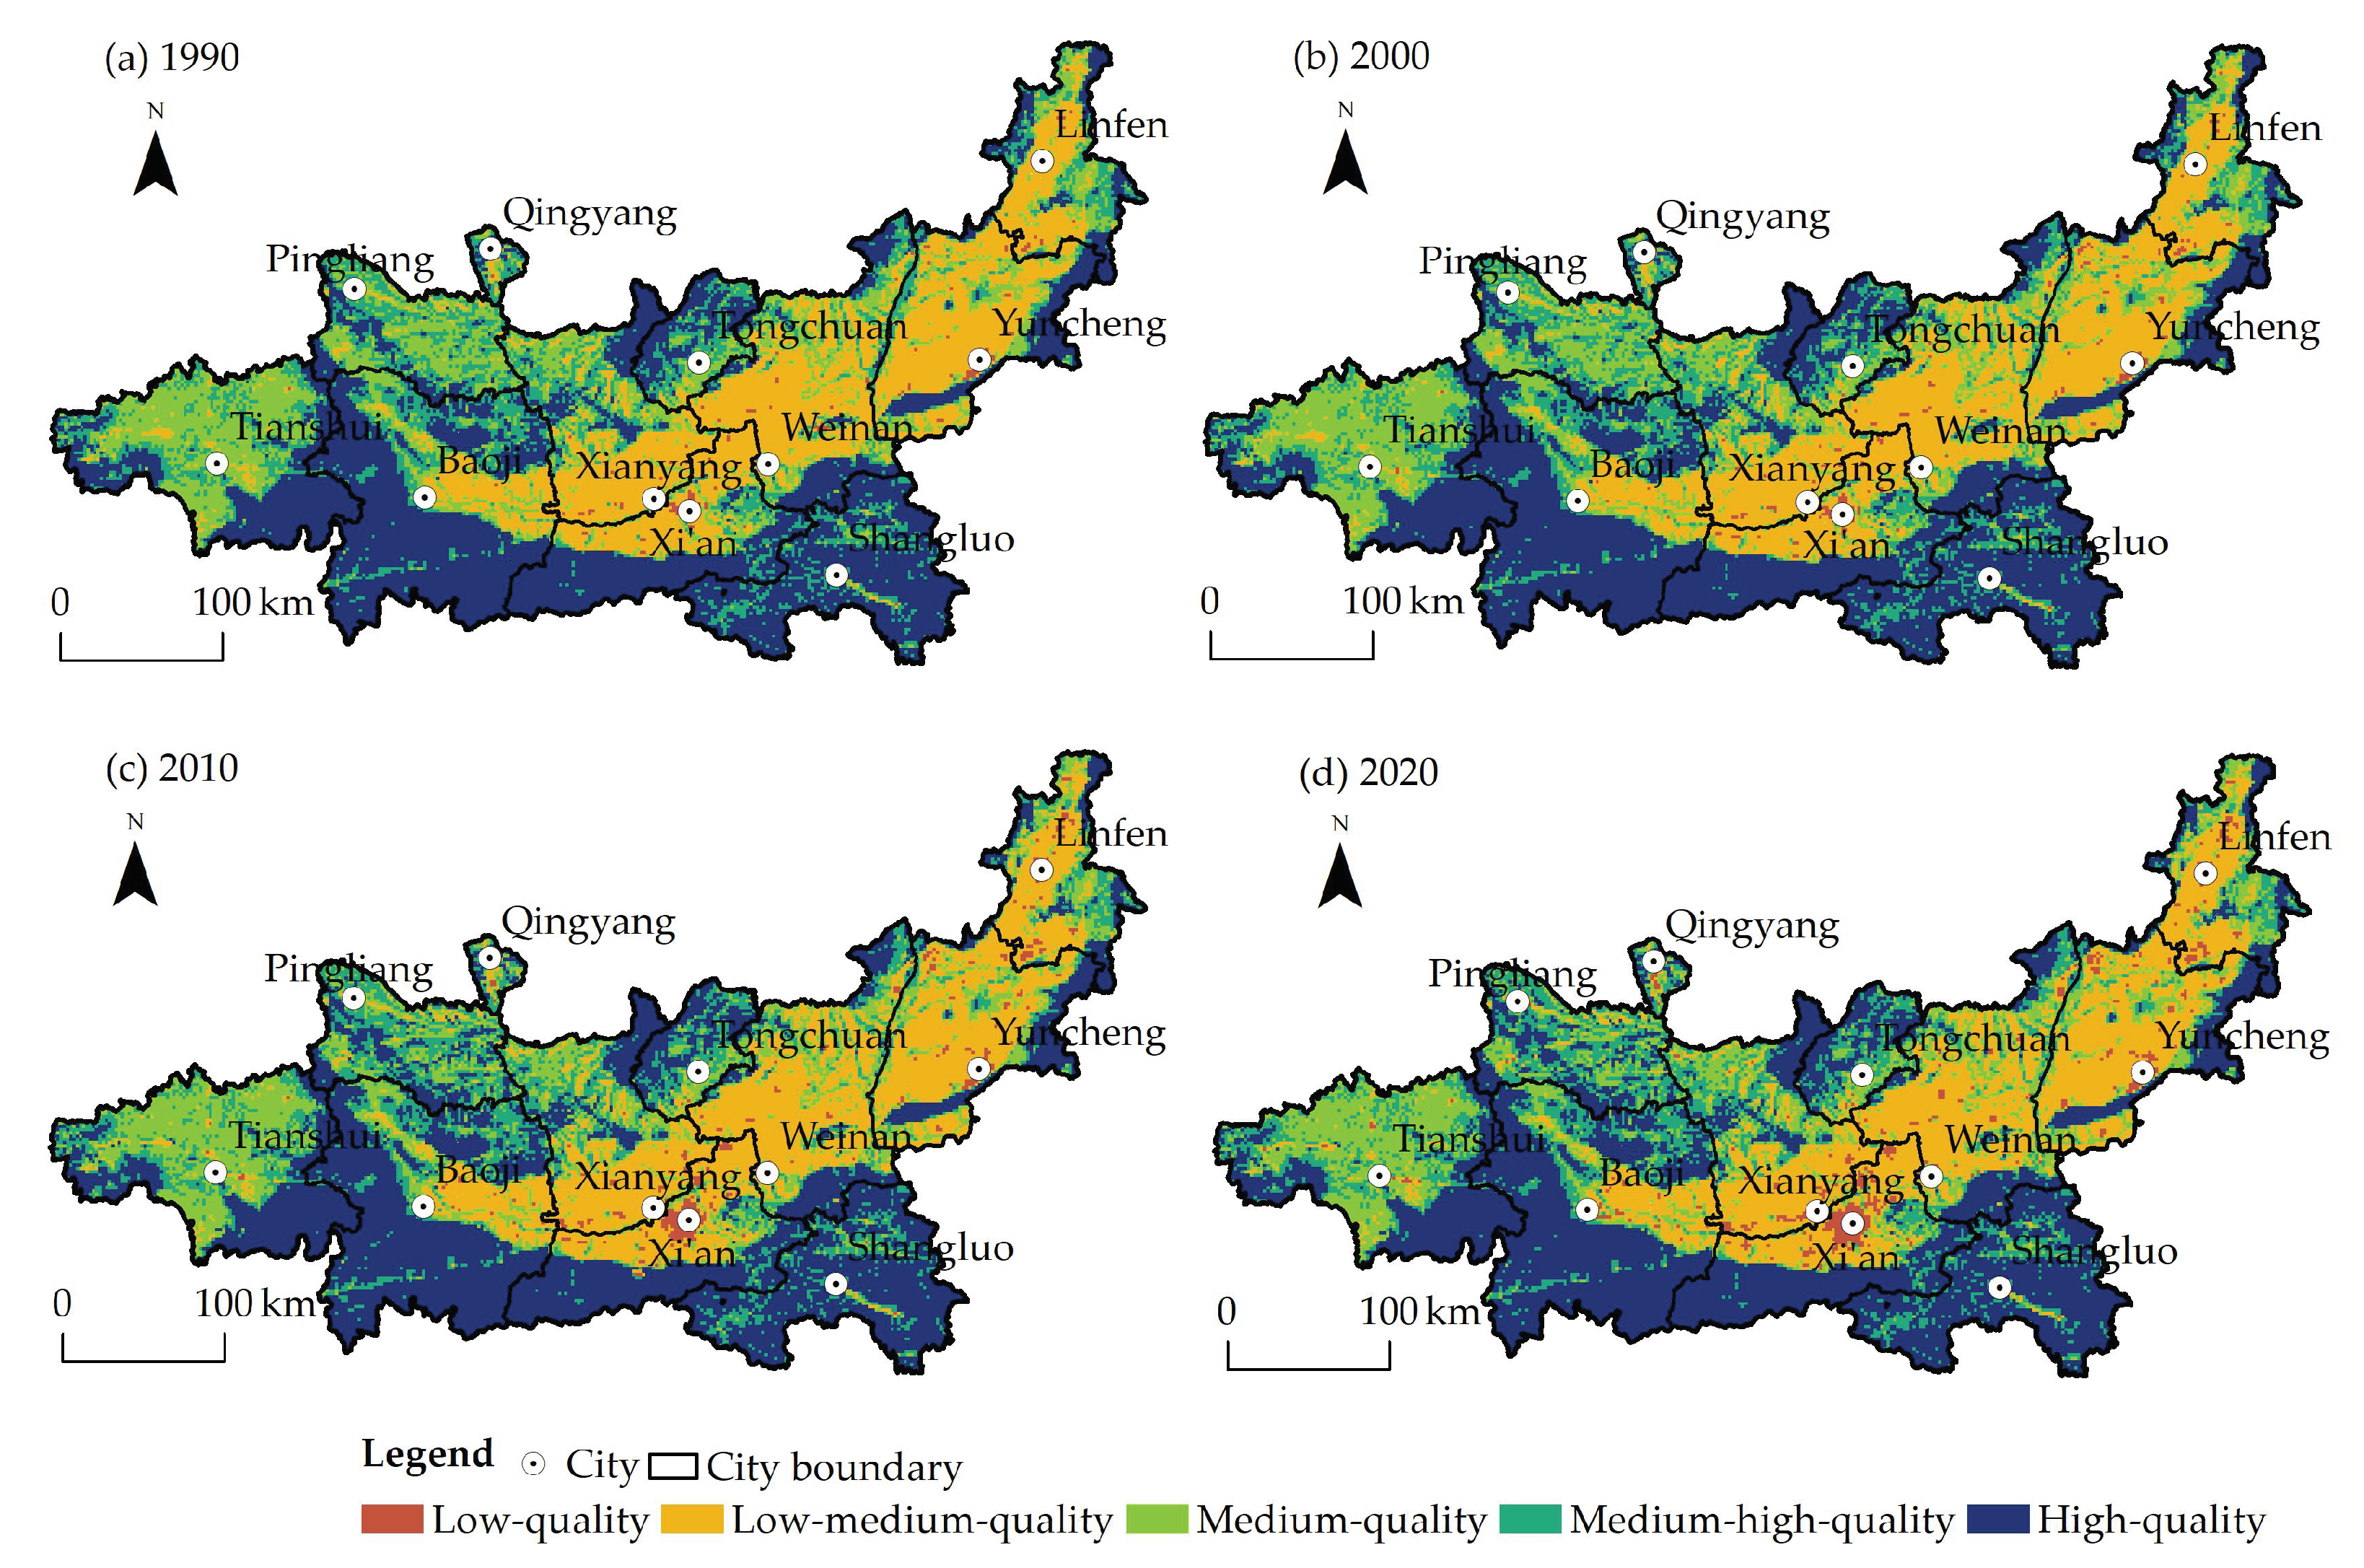
3.4.1. Spatial–Temporal Changes in the EQI

(1) Temporal change. The EQI of the GPUA decreased from 0.554 in 1990 to 0.551 in 2010, and then, it increased to 0.552 in 2020, indicating that the eco-environmental quality first experienced a process of deterioration before improvement, and the overall level of eco-environmental quality deteriorated. In the past 30 years, different grades of the EQI showed significant differences; the low-quality and high-quality EQI areas showed an overall expansion trend, and the area of other EQI areas showed a shrinking trend (Table 3).
Specifically, from 1990 to 2020, the proportion of high-quality areas remained at about 37%, which constituted the main body of the eco-environment of land space development and utilization in the GPUA. The areas of low–medium and medium–high quality were relatively stable, accounting for about 24% and 17%, respectively. However, the low-quality areas increased, showing a continuous expansion trend. In 1990, the area of the low-quality areas was 795.59 km2, accounting for only 0.74%. In 2020, it increased to 2658.51 km2, accounting for 2.48%, with an average annual growth rate of 4.1%. The medium-quality areas showed a shrinking trend, and the proportion continued to decline, with the most obvious shrinkage change from 2000 to 2010. This was closely related to the shrinkage of regional ecological space caused by rapid urbanization and industrialization, resulting in the decline of the EQI.
According to the results of the transfer matrix analysis of the EQI grade area in the GPUA (Table 4), the area of the EQI grade rising area was 4464.10 km2 and the area of the EQI grade declining area was 5476.30 km2 in the past 30 years.
From 1990 to 2000, the EQI grade decline area was 1518.89 km2, and the EQI grade rise area was 504.58 km2, accounting for 1.42% and 0.47% of the total area, respectively. From 2000 to 2010, the EQI grade decline area reached 4379.54 km2, accounting for 4.09% of the total area, which was 2.88-times that of the previous stage (1990~2000). This was mainly due to the transition from a medium-quality area to low–medium-quality area, with a transition area of 1199.99 km2. The EQI grade rising area was 4102.39 km2, accounting for 3.83% of the total area, which was mainly from the transition from a medium-quality area to medium–high-quality area and from a medium–high quality area to high-quality area, with the transition areas of 1671.56 km2 and 1593.08 km2 respectively. From 2010 to 2020, the area of the EQI grade decline area was 2019.81 km2, accounting for 1.88% of the total area of the region, mainly due to the transition from low–medium-quality areas to low-quality areas. The EQI grade rising area was 2253.88 km2, accounting for 2.10% of the total area, mainly due to the transition from medium-quality area to medium–high-quality area. This showed that the expansion of the area of low-grade ecological environmental quality areas was one of the important factors associated with the deterioration of the overall ecological environmental quality level of the GPUA.
(2) Spatial differentiation. The EQI of the GPUA generally presented a spatial pattern of “low in the central part and high in the north and south” (Figure 6). The low-quality areas of the ecological environment were expanding, and they were mainly distributed in big cities and their surrounding areas. In 1990, they were scattered in Xi’an, Weinan, Yuncheng, and other urban areas, with a small area of 795.59 km2. In 2020, the low-quality areas expanded to 2658.51 km2, showing a concentrated and contiguous distribution trend, with the central city as the core geographical space. This is basically consistent with the space expansion of urban construction land and the expansion of industrialization activities under the background of rapid urbanization. The low–medium-quality area was mainly concentrated in the Fenwei Plain in the middle of the GPUA, and its spatial distribution was relatively stable. The region was rich in water and soil resources, and it was an important population and economic gathering place and agricultural production base. Medium-quality areas were mainly distributed in the surrounding areas of Tianshui, Pingliang, Qingyang, Tongchuan, and other cities, with a significant decline in the area. These cities are located in the Loess hill and gully areas, with a fragile ecological environment, but urbanization was in a period of accelerated development. The superposition of urban living space and industrial and mining production space expansion has occupied part of the agricultural production space and ecological space, causing decline in the EQI. Medium–high-quality regions and high-quality areas were mainly distributed in the Qinling-Bashan Mountains in the south of the GPUA and the Loess Plateau in the north, accounting for about 54% of the total area. The land space was mainly woodland and grassland ecological space, which was affected by topography and geomorphology, limiting large-scale and high-intensity urbanization and industrialization activities, and the overall EQI was relatively high. Moreover, the ecological space area of the Qinling-Bashan Mountain ecological barrier area in the south was large, especially in the south of Baoji City and the north of Shangluo City. In the north of Pingliang, Qingyang, Tongchuan, and other Loess hill and gully areas, due to the implementation of the policy of returning farmland to forest (grassland) and the continuous construction of urban green space, the EQI has significantly increased.
From 1990 to 2020, the area of urban and rural living space and industrial and mining production space in the GPUA has been increasing, and the low-quality areas of the ecological environment has been expanding rapidly. From 1990 to 2000, the development and expansion of land space in the GPUA lagged behind, and industrial development and mining construction were slow. Moreover, the area of low-quality ecological environment areas increased slightly, with an average annual increase of 2.51%, forming a “hot spot” for the expansion of low-quality areas, with Xi’an as the core in the space. From 2000 to 2010, urbanization entered a period of rapid development, and the urbanization development mode dominated by spatial development and expansion resulted in the expansion of urban living space occupying the surrounding agricultural production space and ecological space. This resulted in the rapid spatial expansion of low-quality ecological environment areas, with an average annual growth rate of 6.30% and further expansion of low-quality areas. It has formed many low-quality space “hot spots”, such as Xi’an, Linfen, and Yuncheng. From 2010 to 2020, with the implementation of the Main Functional Zone Planning, the spatial expansion intensity of the GPUA reduced, and the expansion rate of the low-quality ecological environment area slowed down, with an average annual growth rate of 3.53%, but the hot spot pattern of low-quality area expansion was strengthened, forming a “one-pole and multi-core” hot spot distribution pattern of the low-quality area. One pole refers to Xi’an and Xianyang, the core cities of the GPUA, and multi-core refers to Baoji, Weinan, Yuncheng, Linfen, and other regional central cities. The expansion of urban living space as well as industrial and mining production space is mainly concentrated with the central cities as the core.

3.4.2. Eco-Environmental Contribution Rate of Land Space Change

From 1990 to 2020, the space change of land in the GPUA contributed significantly to the regional ecological environmental quality, and the improvement and deterioration of the regional ecological environment quality appeared alternately, with obvious stage change characteristics (Table 5).
From 1990 to 2000, the contribution rate of land space transition of the GPUA to the improvement of the ecological environment (99.07%) was higher than that to the deterioration of the ecological environment quality (93.68%). The transition of agricultural production space and other ecological space into woodland and grassland ecological space was the dominant driving force for the improvement of eco-environmental quality in the GPUA. Among them, the transition of agricultural production space into woodland ecological space was the primary driving factor for the improvement of eco-environment quality, accounting for 41.44% of the total improvement contribution rate. The transition of grassland ecological space into agricultural production space and the occupation of agricultural production space by urban and rural living space were the leading driving factors for the deterioration of eco-environmental quality in the GPUA, and the contribution rate of the three factors to the deterioration of the ecological environment reached 69.34%.
From 2000 to 2010, the contribution rate of land spatial transition to the improvement of eco-environmental quality in the GPUA was 97.05%, which was higher than that of the deterioration of ecological environment quality (92.15%). This could be mainly attributed to the transition of a large amount of agricultural production space into woodland and grassland ecological space, and the contribution rate reached 81.78%. The main reason for the deterioration of the ecological environment was that the agricultural production space occupied the ecological space of woodland and grassland, and the urban and rural living space occupied the agricultural production space, with a contribution rate of 77.51%. The impact of land space transition on the improvement and deterioration of ecological environment quality from 2010 to 2020 showed the same trend as that observed from 2000 to 2010.
Overall, both improvement and deterioration of ecological environmental quality have been noticed in the past 30 years, and the improvement trend of the ecological environment was less than the deterioration trend. The main driving factor for the improvement of eco-environmental quality in the GPUA was the transition of agricultural production space into woodland and grassland ecological space, while the transition of grassland ecological space into agricultural production space and the occupation of agricultural production space by urban and rural living space, as well as industrial and mining production space, were the important factors causing the deterioration of ecological environment quality.

4. Discussion

4.1. Transition of Land Space and Eco-Environmental Quality in Urban Agglomeration

Urban agglomerations are formed in the advanced stage of national industrialization and urbanization development. The transition of land space and the expansion of construction land within urban agglomerations have placed great pressure on the ecological environment [47,59]. The spatial transition of land in the GPUA has a profound impact on the structure and function of the regional ecosystem, thus causing the improvement or deterioration of regional eco-environmental quality [16]. This study found that the growth and decline of urban agglomeration production and living and ecological land affected the eco-environment quality. In the core area of urban agglomeration with Xi’an and other cities as the main body, the intensity of human activities is large, the transition of land space is intense, and the deterioration trend of the ecological environment quality is obvious [51]. However, in the Loess Plateau in the north and the Qinling Mountains in the south of the GPUA, the intensity of human social and economic activities gradually decreased under the siphon effect of the central city of Xi’an, and there was a marked improvement of ecological environmental quality [60,61]. Although the EQI of the GPUA was maintained at about 0.552 from 1990 to 2020, the overall EQI of the GPUA was still lower than 0.554, and the trend of eco-environmental quality deterioration was slightly higher than that of eco-environmental quality improvement, especially in the core cities and their surrounding areas within the GPUA [17].
Specifically, from 1990 to 2000, under the influence of domestic deflation and special urbanization development mode, the spatial development and expansion of the GPUA was slow, the transition of land spatial structure was small, and the ecological environmental quality was relatively stable [54]. From 2000 to 2010, with the establishment of a large number of development zones (high-tech zones, bonded zones, economic development zones, etc.) in the GPUA, the industrial and mining production space expanded rapidly [49], while the development of urbanization attracted a large number of rural surplus labor to work in cities, increased the demand for urban living land, caused the rapid expansion of urban agglomeration living space [20,43], and occupied a large number agricultural production and ecological spaces [13]. Consequently, the quality of the ecological environment rapidly declined, and the low-quality areas of the ecological environment rapidly expanded. From 2010 to 2020, with the continuous promotion of ecological civilization construction, the area of green ecological space in urban agglomerations significantly expanded, and the overall quality of ecological environment showed a trend of improvement [16,17]. However, it should also be noted that with the rapid development of the GPUA and the planning and construction of the Greater Xi’an Metropolitan Area, the demand for construction land caused by the sharp increase in the population and industrial development in Xi’an (Xianyang) has been increasing [49], resulting in a large number of agricultural production spaces and ecological spaces being transformed into urban living as well as industrial and mining production spaces. This caused a significant deterioration of ecological environmental quality in some areas of urban agglomerations. Zhang et al. also found that construction land expansion in urban agglomerations led to rapid changes in the land space pattern, and urban construction land occupied arable and ecological lands, resulting in a prominent regional ecological deficit that seriously threatened the eco-environment quality of urban agglomerations and the sustainability of ecosystems [16].

4.2. Government’s Policy System and Eco-Environmental Quality in Urban Agglomeration

The government’s policy system is an important driving factor for the formation and evolution of land space development and the protection pattern in urban agglomeration areas [62,63], and it has a profound impact on the deterioration or improvement trend of eco-environmental quality [64,65]. This study found that with the implementation and adjustment of national and local government policies, the eco-environmental quality of the GPUA showed marked stage change characteristics.
From 1990 to 2000, under the influence of the decentralized urbanization road, with small towns as the main part and its supporting policies, the urban development intensity of the GPUA was generally low [66], and the ecological environmental quality remained at a medium or above level. Since 2000, with the rapid development of the reform of the household registration system, the construction of a new socialist countryside, and the construction of urban development zones [54,67], the land space of urban and rural construction in the GPUA has shown a trend of disorderly expansion, resulting in a significant decline in the eco-environmental quality of the central cities and their surrounding areas in urban agglomerations. The continuous implementation of the policy of returning farmland to forest (grassland) has promoted the transition of a large number of agricultural production spaces in the Loess Plateau [60] in the north and Qinling Mountains [61] in the south of the GPUA into woodland and grassland ecological space, which has improved the regional eco-environmental quality. After 2010, with the implementation of the planning and system of the main functional areas [68] and its rise to a major national strategy, overall improvement, and not deterioration, has been observed in the ecological environmental quality of the GPUA [17]. In 2014, China’s New Urbanization Plan (2014~2020) put forward a new urbanization strategy to promote the coordinated development of large, medium, and small cities and towns with urban agglomerations as the main form [15,31]. Furthermore, it provides strict requirements for the green and intensive development of land and space in urban agglomerations, especially for the implementation of the ecological protection and high-quality development strategy of the Yellow River Basin in 2018 [69]. The pattern of land space development and protection in the GPUA has been continuously optimized, and the intensive use of production and living space has been continuously improved [14]. Moreover, the area of ecological space has been significantly expanded, and the quality of the ecological environment in the GPUA has been significantly improved.
Therefore, an important way to realize the orderly development and high-quality utilization of land space in the GPUA is by thoroughly implementing major national strategic systems; strengthening the conservation of ecological space; continuously optimizing the production, living, and ecological spatial pattern of urban agglomerations; and speeding up the construction of a sustainable geographical pattern of urban agglomeration.

4.3. Limitations and Prospects

The effect of land space pattern change on regional eco-environmental quality is complex, and the conversion between different land spatial types has different effects on the ecological environment [70,71]. This paper constructed a framework of assessing land space change and its eco-environmental effects in the urban agglomeration by using the Geo-informatic Graphic, EQI, and eco-environmental contribution rate from the perspective of the theory of “production–living–ecological space”; analyzed the characteristics of land space pattern change and the transition mode of land space types in the GPUA; and discussed the impact of land space transitions and policy system changes on the eco-environmental quality of the GPUA, which provided a new idea for scientific cognition of urban agglomeration land space and eco-environmental quality change. The findings further enriched the theoretical connotation of land space transition and contribute to the understanding of the eco-environmental effect of land space change, and they also provide a scientific basis for the optimization of land space of the GPUA. However, this study did not explore the driving mechanism of land space transition for urban agglomeration, which is very significant in the study of land spatial transition. Therefore, future research can deeply reveal the natural and socio-economic driving mechanism of the land space pattern change in different development stages of urban agglomeration. Moreover, it is necessary to investigate the ecological environment response mechanism of the land space transition of urban agglomeration for a deeper understanding of optimal allocation of land space in urban agglomeration areas.
In addition, based on land use data and eco-environmental quality coefficients of land space, this paper evaluated the changes of characteristics of eco-environmental quality in the GPUA. The results showed that the eco-environmental quality of the GPUA, based on the evaluation of land space development and utilization types, was generally maintained in a relatively stable state, which has some limitations and uncertainties. In fact, under the influence of rapid urbanization and industrialization, the structure of land spatial development and utilization and its eco-environmental quality of the GPUA have undergone tremendous changes [15,47]. In recent years, the population explosion and the expansion of urban production and living land caused by the planning and construction of the GPUA and Greater Xi’an Metropolitan Area have further aggravated the potential risk of deterioration of regional eco-environmental quality [17,49]. Therefore, a follow-up study can introduce the relevant models of eco-environmental quality assessment (such as In-VEST) and scientifically determine the eco-environmental quality coefficients of different land space types based on the high-resolution remote sensing data; simulate the change process, pattern, and mechanism of eco-environmental quality of urban agglomerations under different land space development and utilization scenarios; and continuously improve the quality of research results and conclusions.

5. Conclusions

Using the GIS software and based on the theory of “production–living–ecological space”, this paper explored the spatial–temporal change characteristics of land space in the GPUA from 1990 to 2020 and revealed the eco-environmental effects of land space transition. The main conclusions are as follows:
(1)
From 1990 to 2020, the area of production–living–ecological spaces in the GPUA has significantly changed; the production space has been shrinking, the living space has been expanding, and the overall ecological space has shown a fluctuating and increasing trend. About 92.2% of the counties’ agricultural production space significantly contracted, 93.3% and 91.1% of the counties’ urban and rural living space significantly expanded, and 64.4% of counties’ woodland ecological space area increased.
(2)
The transition of land space in the GPUA is intense. Agricultural production space was transitioned into ecological space and living space, and living space occupied ecological space and agricultural production space, which was the main mode of land space transition in the GPUA. Located in the ecological barrier area of the Loess Plateau in the north of the GPUA, the ecological belt along the Fen and Wei River in the middle, and the Qinba Mountains in the south, the agricultural production space showed a marked shrinkage trend, whereas the urban and rural living space and ecological space showed an expansion trend.
(3)
The eco-environmental quality of the GPUA first experienced a process of deterioration and then improvement, showing a spatial pattern of “low in the central part and high in the north and south” in geographical space. The EQI decreased from 0.554 in 1990 to 0.551 in 2010 and then increased to 0.552 in 2020. The low-quality and high-quality areas of eco-environment quality generally showed an expanding trend, whereas other areas generally showed a shrinking trend, and the proportion of high-quality areas remained at about 37%, which constituted the main body of the ecological environment quality of land space development and utilization.
(4)
In the past 30 years, the two trends of improvement and deterioration of ecological environmental quality of the GPUA have coexisted. The trend of improvement of the ecological environment has been less than that of deterioration, but the trend of improvement is gradually emerging. The transition of grassland ecological space into agricultural production space and the occupation of agricultural production space by urban and rural living space, as well as industrial and mining production space, were the main driving factors for the deterioration of eco-environmental quality. The transition of agricultural production space into woodland and grassland ecological spaces was the main factor that drove the improvement of eco-environmental quality in the GPUA.

Author Contributions

Conceptualization, Y.S. and S.X.; methodology, S.L. and L.Z.; software, L.Z. and D.W.; formal analysis, Y.S., S.L. and D.X.; investigation, D.W. and L.Z; writing—original draft preparation, Y.S. and S.X.; writing—review and editing, Y.S. and S.X.; visualization, S.L.; supervision, S.X. and D.X.; project administration, Y.S.; funding acquisition, Y.S. All authors have read and agreed to the published version of the manuscript.

Funding

This research was funded by the “National Natural Science Foundation of China”, grant number “42001251”; the “Fundamental Research Funds for the Central Universities”, grant number “GK202103139”; and by “China Postdoctoral Science Foundation”, grant number “2021M692003”.

Data Availability Statement

Not applicable.

Acknowledgments

The authors would like to thank the anonymous reviewers for their comments and suggestions.

Conflicts of Interest

The authors declare no conflict of interest.

References

  1. Foley, J.A.; DeFries, R.; Asner, G.P.; Barford, C.; Bonan, G.; Carpenter, S.R.; Chapin, F.S.; Coe, M.T.; Daily, G.C.; Gibbs, H.K.; et al. Global consequences of land use. Science 2005, 309, 570–574. [Google Scholar] [CrossRef] [PubMed]
  2. Moran, E.; Ojima, D.; Buchmann, N.; Canadell, J.; Coomes, O.; Graumlich, L.; Jackson, R.; Jaramillo, V.; Lavorel, S.; Leadley, P.; et al. Global Land Project: Science Plan and Implementation Strategy; IGBP Secretariat: Stockholm, Sweden, 2005. [Google Scholar]
  3. Güneralp, B.; Reba, M.; Hales, B.U.; Wentz, E.A.; Seto, K.C. Trends in urban land expansion, density, and land transitions from 1970 to 2010: A global synthesis. Environ. Res. Lett. 2020, 15, 044015. [Google Scholar] [CrossRef]
  4. Ning, J.; Liu, J.Y.; Kuang, W.H.; Xu, X.L.; Ning, J. Spatiotemporal patterns and characteristics of land-use change in China during 2010–2015. J. Geog. Sci. 2018, 28, 547–562. [Google Scholar] [CrossRef]
  5. Zhou, D.; Xu, J.; Lin, Z. Conflict or coordination? assessing land use multi-functionalization using production-living-ecology analysis. Sci. Total Environ. 2016, 577, 136. [Google Scholar] [CrossRef] [PubMed]
  6. Yang, Y.Y.; Bao, W.K.; Liu, Y.S. Coupling coordination analysis of rural production-living- ecological space in the Beijing-Tianjin-Hebei region. Ecol. Ind. 2020, 117, 106512. [Google Scholar] [CrossRef]
  7. Meyfroidt, P.; Chowdhury, R.R.; De Bremond, A.; Ellis, E.C.; Erb, K.-H.; Filatova, T.; Garrett, R.D.; Grove, J.M.; Heinimann, A.; Kuemmerle, T.; et al. Middle-range theories of land system change. Global Environ. Chang. 2018, 53, 52–67. [Google Scholar] [CrossRef]
  8. Fu, B.J.; Stafford-Smith, M.; Wang, Y.F.; Wu, B.F.; Yu, X.B.; Lv, N.; Ojima, D.S.; Lv, Y.H.; Fu, C.; Liu, Y. The Global-DEP conceptual framework-research on dryland ecosystems to promote sustainability. Curr. Opin. Environ. Sustain. 2021, 48, 17–28. [Google Scholar] [CrossRef]
  9. Long, H.L. Explanation of Land Use Transitions. China Land Sci. 2022, 36, 1–7. [Google Scholar]
  10. Batten, D.F. Network cities: Creative urban agglomerations for the 21st century. Urban Stud. 1995, 32, 313–327. [Google Scholar] [CrossRef]
  11. Burke, G.L. Greenheart Metropolis: Planning the Western Netherlands; Macmillan: London, UK, 1966; pp. 91–96. [Google Scholar]
  12. Liu, J.L.; Liu, Y.S.; Li, Y.R. Classification evaluation and spatial-temporal analysis of "production-living-ecological" spaces inChina. Acta Geogr. Sin. 2017, 72, 1290–1304. [Google Scholar]
  13. Song, Y.M.; Chen, B.; Kwan, M.-P. How does urban expansion impact peopleG’s exposure to green environments? A comparative study of 290 Chinese cities. J. Clean. Prod. 2020, 246, 119018. [Google Scholar] [CrossRef]
  14. Song, Y.Y.; Xue, D.Q.; Xia, S.Y.; Mi, W.B. Change characteristics and formation mechanism of the territorial spatial pattern in the Yellow River Basin from 1980 to 2018, China. Geogr. Res. 2021, 40, 1445–1463. [Google Scholar]
  15. Fang, C.L.; Zhou, C.H.; Gu, C.L.; Chen, L.D.; Li, S.C. A proposal for the theoretical analysis of the interactive coupled effects between urbanization and the eco-environment in mega-urban agglomerations. J. Geogr. Sci. 2017, 27, 1431–1499. [Google Scholar] [CrossRef]
  16. Peng, L.X.; Zhang, L.W.; Li, X.P.; Wang, Z.Z.; Wang, H.; Jiao, L. Spatial expansion effects on urban ecosystem services supply-demand mismatching in Guanzhong Plain Urban Agglomeration of China. J. Geogr. Sci. 2022, 32, 806–828. [Google Scholar] [CrossRef]
  17. Ye, H.; Song, Y.Y.; Xue, D.Q. Multi-Scenario Simulation of Land Use and Habitat Quality in the Guanzhong Plain Urban Agglomeration, China. Int. J. Environ. Res. Public Health 2022, 19, 8703. [Google Scholar] [CrossRef] [PubMed]
  18. Ren, Q.; He, C.Y.; Huang, Q.X.; Shi, P.J.; Zhang, D.; Güneralp, B. Impacts of urban expansion on natural habitats in global drylands. Nat. Sustain. 2022. [Google Scholar] [CrossRef]
  19. Long, H.L.; Zhang, Y.N.; Ma, L.; Tu, S.S. Land use transitions: Progress, challenges and prospects. Land 2021, 10, 903. [Google Scholar] [CrossRef]
  20. Long, H.L.; Kong, X.B.; Hu, S.G.; Li, Y. Land use transitions under rapid urbanization: A perspective from developing China. Land 2021, 10, 935. [Google Scholar] [CrossRef]
  21. Long, H.L. Land Use Transitions and Rural Restructuring in China; Springer: Singapore, 2020; pp. 3–29. [Google Scholar]
  22. Fan, J.; Wang, Y.F.; Wang, C.S.; Jin, F.J.; Zhang, W.Z.; Li, L.J.; Xu, Y.; Dai, E.F.; Tao, A.J.; Zhou, K.; et al. Reshaping the sustainable geographical pattern: A major function zoning model and its applications in China. Earth’s Future 2019, 7, 25–42. [Google Scholar] [CrossRef]
  23. Fan, J. Draft of major function oriented zoning of China. Acta Geogr. Sin. 2015, 70, 186–201. [Google Scholar]
  24. Geng, S.; Zhu, W.; Shi, P. A functional land use classification for ecological, production and living spaces in the taihang mountains. J. Res. Ecol. 2019, 10, 246–255. [Google Scholar]
  25. Wei, L.; Zhang, Y.; Wang, L.; Mi, X.; Wu, X.; Cheng, Z. Spatiotemporal evolution patterns of "production-living-ecological" spaces and the coordination level and optimization of the functions in jilin province. Sustainability 2021, 13, 13192. [Google Scholar] [CrossRef]
  26. Chen, G.Q.; Han, M.Y. Virtual land use change in china 2002–2010: Internal transition and trade imbalance. Land Use Pol. 2015, 47, 55–56. [Google Scholar] [CrossRef]
  27. He, C.Y.; Zhang, J.X.; Liu, Z.F.; Huang, Q.X. Characteristics and progress of land use/cover change research during 1990–2018. J. Geogr. Sci. 2022, 32, 537–559. [Google Scholar] [CrossRef]
  28. Ji, Z.M. Mechanism of Land-Use Changes in Yuqi Township, Wuxi City, China. Geogr. Rev. Japan 2004, 77, 827–837. [Google Scholar] [CrossRef] [Green Version]
  29. Li, Z.; Jiao, L.; Zhang, B.; Xu, G.; Liu, J. Understanding the pattern and mechanism of spatial concentration of urban land use, population and economic activities: A case study in Wuhan, China. Geo-Spat. Inf. Sci. 2021, 24, 678–694. [Google Scholar] [CrossRef]
  30. Song, Y.Y.; Xue, D.Q.; Dai, L.H.; Wang, P.T.; Huang, X.G.; Xia, S.Y. Land cover change and eco-environmental quality response of different geomorphic units on the Chinese Loess Plateau. J. Arid Land 2020, 12, 29–43. [Google Scholar] [CrossRef]
  31. Li, G.D.; Fang, C.L.; Li, Y.J.; Wang, Z.B.; Sun, S.A.; He, S.W.; Qi, W.; Bao, C.; Ma, H.T.; Fan, Y.P.; et al. Global impacts of future urban expansion on terrestrial vertebrate diversity. Nat. Commun. 2022, 13, 1628. [Google Scholar] [CrossRef]
  32. Fan, J.; Liu, H.C.; Wang, Y.F.; Zhao, Y.N.; Chen, D. “The Northeast China Phenomenon” and Prejudgment on Economic Revitalization in Northeast China: A Primary Research on Stable Factors to Impact National Spatial Development and Protection Pattern. Sci. Geogr. Sin. 2016, 36, 1445–1456. [Google Scholar]
  33. Fan, J. Research on the Optimal Allocation of Spatial Development and Protection Pattern in Guangdong Province; Science Press: Beijing, China, 2016; pp. 2–10. [Google Scholar]
  34. Blanco, V.; Holzhauer, S.; Brown, C.; Lagergren, F.; Vulturius, G.; Lindeskog, M.; Rounsevella, M.D.A. The effect of forest owner decision-making, climatic change and societal demands on land-use change and ecosystem service provision in sweden. Ecosyst. Serv. 2017, 23, 174–208. [Google Scholar] [CrossRef]
  35. Donnison, C.; Holland, R.A.; Harris, Z.M.; Eigenbrod, F.; Taylor, G. Land-use change from food to energy: Meta-analysis unravels effects of bioenergy on biodiversity and cultural ecosystem services. Environ. Res. Lett. 2021, 16, 113005. [Google Scholar] [CrossRef]
  36. Wende, W.; Huelsmann, W.; Marty, M.; Penn-Bressel, G.; Bobylev, N. Climate protection and compact urban structures in spatial planning and local construction plans in Germany. Land Use Pol. 2010, 27, 864–868. [Google Scholar] [CrossRef]
  37. Ramankutty, N.; Mehrabi, Z.; Waha, K.; Jarvis, L.; Kremen, C.; Herrero, M.; Rieseberg, L.H. Trends in Global Agricultural Land Use: Implications for Environmental Health and Food Security. Annu. Rev. Plant Biol. 2018, 69, 789–815. [Google Scholar] [CrossRef] [PubMed]
  38. Hersperger, A.M.; Langhamer, D.; Dalang, T. Inventorying human-made objects: A step towards better understanding land use for multi-functional planning in a periurban Swiss landscape. Landsc. Urban Plann 2012, 105, 307–314. [Google Scholar] [CrossRef]
  39. Xiong, J.H.; Yue, W.Z.; Chen, Y.; Liao, R.; Fang, K. Multi-scenario urban expansion simulation for SDGs: Taking the Central Asian region along the Belt and Road as an example. J. Nat. Resour. 2021, 36, 841–853. [Google Scholar] [CrossRef]
  40. Ulasi, J.O.; Uwadiegwu, B.O.; Okoye, C.O. Assessment of the Level of Compliance of Petroleum Filling Stations to Development Control Standards on Land Space/Size and Setbacks in Anambra State. Civil Environ. Res. 2020, 12, 77–87. [Google Scholar]
  41. Morshed, S.R.; Fattah, M.A.; Hoque, M.M.; Islam, M.R.; Sultana, F.; Fatema, K.; Rabbi, M.F.; Rimi, A.A.; Sami, F.Y.; Rezvi Amin, F.M.; et al. Simulating future intra-urban land use patterns of a developing city: A case study of Jashore, Bangladesh. GeoJournal 2022, 1–24. [Google Scholar] [CrossRef]
  42. Eziz, M.; Yimit, H.; Mohammad, A.; Huang, Z.F. Oasis land-use change and its effects on the oasis eco-environment in Keriya Oasis, China. Int. J. Sustain. Dev. World Ecol. 2010, 17, 244–252. [Google Scholar] [CrossRef]
  43. Kalnay, E.; Cai, M. Impact of urbanization and land-use change on climate. Nature 2003, 423, 528–531. [Google Scholar] [CrossRef]
  44. Grimm, N.B.; Faeth, S.H.; Golubiewski, N.E.; Redman, C.L.; Wu, J.G.; Bai, X.M.; Briggs, J.M. Global change and the ecology of cities. Science 2008, 319, 756–760. [Google Scholar] [CrossRef]
  45. Kuang, W.H.; Chi, W.F.; Lu, D.S.; Dou, Y.Y. A comparative analysis of megacity expansions in china and the U.S.: Patterns, rates and driving forces. Landsc. Urban Plann 2014, 132, 121–135. [Google Scholar] [CrossRef]
  46. Fang, C.L.; Liu, H.M.; Li, G.D. International progress and evaluation on interactive coupling effects between urbanization and the eco-environment. J. Geogr. Sci. 2016, 26, 1081–1116. [Google Scholar] [CrossRef]
  47. Fang, C.L.; Gao, Q.; Zhang, X.L.; Cheng, W.G. Spatiotemporal characteristics of the expansion of an urban agglomeration and its effect on the ecoenvironment: Case study on the northern slope of the Tianshan Mountains. Sci. China Earth Sci. 2019, 62, 1461–1472. [Google Scholar] [CrossRef]
  48. Zhang, X.; Gu, R.X. Spatio-temporal pattern and multi-scenario simulation of land use conflict: A case study of the Yangtze River Delta urban agglomeration. Geogr. Res. 2022, 41, 1311–1326. [Google Scholar]
  49. Zheng, H.L.; Cao, X.S. Impact of high-speed railway construction on spatial relationships in the Guanzhong Plain urban agglomeration. Reg. Sustain. 2021, 2, 47–59. [Google Scholar] [CrossRef]
  50. Yang, Y.; Cai, Z.X. Ecological security assessment of the Guanzhong Plain urban agglomeration based on an adapted ecological footprint model. J. Clean. Prod. 2020, 260, 120973. [Google Scholar] [CrossRef]
  51. Yang, S.; Su, H. Multi-Scenario simulation of ecosystem service values in the Guanzhong Plain Urban Agglomeration, China. Sustainability 2022, 14, 8812. [Google Scholar] [CrossRef]
  52. Tang, C.H.; Li, Y.P. Geo-information process of land use/cover change in polycentric urban agglomeration: A case study of Changsha-Zhuzhou-Xiangtan urban agglomeration. Geogr. Res. 2020, 39, 2626–2641. [Google Scholar]
  53. Sudhira, H.S.; Ramachandra, T.V.; Jagadish, K.S. Urban sprawl: Metrics, dynamics and modelling using GIS. Int. J. Appl. Earth Obs. Geoinf. 2004, 5, 29–39. [Google Scholar] [CrossRef]
  54. Yang, Q.K.; Duan, X.J.; Wang, L.; Jin, Z.F. Land Use Transformation Based on Ecological-production-living Spaces and Associated Eco-environment Effects: A Case Study in the Yangtze River Delta. Sci. Geogr. Sin. 2018, 38, 97–106. [Google Scholar]
  55. Oliver, M.A.; Webster, R. A tutorial guide to geostatistics: Computing and modelling variograms and kriging. Catena 2014, 113, 56–69. [Google Scholar] [CrossRef]
  56. Kuang, W.H.; Zhang, S.W.; Du, G.M.; Yan, C.Z.; Wu, S.X.; Li, R.D.; Lu, D.S.; Peng, T.; Ning, J.; Guo, C.Q.; et al. Remotely sensed mapping and analysis of spatio-temporal patterns of land use change across China in 2015–2020. Acta Geogr. Sin. 2022, 77, 1056–1071. [Google Scholar]
  57. Liu, J.Y.; Ning, J.; Kuang, W.H.; Xu, X.L.; Zhang, S.W.; Yan, C.Z.; Li, R.D.; Wu, S.X.; Hu, Y.F.; Du, G.M.; et al. Spatio-temporal patterns and characteristics of land-use change in China during 2010–2015. Acta Geogr. Sin. 2018, 73, 789–802. [Google Scholar]
  58. Li, X.W.; Fang, C.L.; Huang, J.C.; Mao, H.Y. The urban land use transformations and associated effects on eco-environment in northwest China arid region: A case study in Hexi Region, Gansu Province. Quat. Sci. 2003, 23, 280–290. [Google Scholar]
  59. Li, K.; Zhang, B.; Xiao, W.; Lu, Y. Land Use Transformation Based on Production−Living−Ecological Space and Associated Eco-Environment Effects: A Case Study in the Yangtze River Delta Urban Agglomeration. Land 2022, 11, 1076. [Google Scholar] [CrossRef]
  60. Zhao, A.Z.; Liu, X.F.; Zhu, X.F.; Pan, Y.Z.; Chen, S.C. Spatiotemporal analyses and associated driving forces of vegetation coverage change in the Loess Plateau. China Environ. Sci. 2016, 36, 1568–1578. [Google Scholar]
  61. Liu, X.F.; Pan, Y.Z.; Zhu, X.X.; Li, S. Spatiotemporal variation of vegetation coverage in Qinling-Daba Mountains in relation to environmental factors. Acta Geogr. Sin. 2015, 70, 705–716. [Google Scholar]
  62. Sun, Y.; Li, Y.; Gao, J.; Yan, Y. Spatial and Temporal Patterns of Urban Land Use Structure in Small Towns in China. Land 2022, 11, 1262. [Google Scholar] [CrossRef]
  63. Kuang, W.H. 70 years of urban expansion across China: Trajectory, pattern, and national policies. Sci. Bull. 2020, 65, 1970–1974. [Google Scholar] [CrossRef]
  64. Kuang, W.H.; Liu, J.Y.; Tian, H.Q.; Shi, H.; Dong, J.W.; Song, C.Q.; Li, X.Y.; Du, G.M.; Hou, Y.L.; Lu, D.S.; et al. Cropland redistribution to marginal lands undermines environmental sustainability. Natl Sci. Rev. 2022, 9, 66–78. [Google Scholar] [CrossRef]
  65. Dang, X.W.; Zhou, L.; Hu, F.L.; Yuan, B.; Tang, J.J. The multi-scale direct and indirect effects of urban extension of Guanzhong Plain urban agglomeration on ecologic land. Acta Ecol. Sin. 2022, 42, 3020–3032. [Google Scholar]
  66. Song, Y.Y.; Ma, B.B.; Dai, L.H.; Xue, D.Q.; Xia, S.Y.; Wang, P.T. Spatial-temporal pattern and formation mechanism of county urbanization on the Chinese Loess Plateau. J. Mount. Sci. 2012, 18, 1093–1111. [Google Scholar] [CrossRef]
  67. Wang, Z.H.; Kong, X.S.; Cheng, P. Spatiotemporal evolution of national development zones and their impact on urban land growth in China. J. Geogr. Sci. 2022, 32, 1451–1470. [Google Scholar] [CrossRef]
  68. Fan, J. The Strategy of Major Function Oriented Zoning and the Optimization of Territorial Development Patterns. Bull. Chin. Acad. Sci. 2013, 28, 193–206. [Google Scholar]
  69. Chen, Y.; Zhang, K.Y.; Chen, X.; Liao, Y.; Song, B.; Huang, H.; Wang, X. Ecological protection and high-quality development in the Yellow River Basin. Reg. Econ. Rev. 2020, 1, 12–17. [Google Scholar]
  70. Meyfroidt, P.; de Bremond, A.; Ryan, C.M.; Archer, E.; Aspinall, R.; Chhabra, A.; Camara, G.; Corbera, E.; DeFries, R.; Díaz, S.; et al. Ten facts about land systems for sustainability. Proc. Natl. Acad. Sci. USA 2022, 119, e2109217118. [Google Scholar] [CrossRef]
  71. Newbold, T.; Hudson, L.N.; Hill, S.L.L.; Contu, S.; Lysenko, I.; Senior, R.A.; Börger, L.; Bennett, D.J.; Choimes, A.; Collen, B.; et al. Global effects of land use on local terrestrial biodiversity. Nature 2015, 520, 45–50. [Google Scholar] [CrossRef] [Green Version]
Figure 1. Geographical location (a), administrative divisions and elevation (b) in the Guanzhong Plain Urban Agglomeration (GPUA).
Land 11 01547 g001
Figure 2. Research framework of land space change and its eco-environmental effects.
Land 11 01547 g002
Figure 3. Distribution pattern of the production–living–ecological space in the Guanzhong Plain Urban Agglomeration from 1990 to 2020.
Land 11 01547 g003
Figure 4. Spatial difference of county land space changes in the Guanzhong Plain Urban Agglomeration from 1990 to 2020.
Land 11 01547 g004
Figure 5. Distribution of land space transition in the Guanzhong Plain Urban Agglomeration from 1990 to 2020. Note: Symbol ‘→’ represents the transition of land space change.
Land 11 01547 g005
Figure 6. Spatio-temporal pattern of the eco-environmental quality index (EQI) in the Guanzhong Plain Urban Agglomeration from 1990 to 2020.
Land 11 01547 g006
Table 1. Connection between land space classification and the land use classification system.
Land Space ClassificationLand Use ClassificationEco-Environmental Quality Coefficients
First-Class Land SpaceCodeSecond-Class Land SpaceFirst-Class Land TypesSecond-Class Land Types
Production space1Agricultural production spaceCroplandPaddy field, Dry land0.293
7Industrial and mining production spaceUrban and rural, industrial and mining, residential landOther construction land0.010
Living space5Urban living spaceUrban construction land0.010
6Rural living spaceRural settlement land0.010
Ecological space2Woodland ecological spaceWoodlandClosed woodland, Shrub woodland, Open woodland, Other woodland0.883
3Grassland ecological spaceGrasslandHigh coverage grassland, Medium coverage grassland, Low coverage grassland0.798
4Water ecological spaceWater bodyCanals, Lake, Reservoir pond, Permanent glacier snow, Tidal flat, Beach0.521
8Other ecological spaceUnused landSand, Gobi, Saline-alkali land, Wetlands, Bare earth, Bare rock texture, Other0.025
Note: The codes are the same as in Figure 5 and Table 5.
Table 2. Changes in the production–living–ecological space structure in the Guanzhong Plain Urban Agglomeration from 1990 to 2020.
Land Space Types1990200020102020
Area (km2)Area (km2)Area (km2)Area (km2)
Agricultural production space49,760.1649,548.0548,063.8046,832.51
Woodland ecological space23,095.3222,978.3223,455.2323,250.52
Grassland ecological space28,700.9528,684.7828,680.0729,314.26
Water ecological space1326.591241.571151.621281.93
Urban living space528.35683.031039.061237.72
Rural living space3227.163519.704048.454211.93
Industrial and mining production space174.29196.55446.37722.36
Other ecological space198.86159.74128.31159.78
Table 3. Areas of eco-environmental quality index (EQI) grade areas in the Guanzhong Plain Urban Agglomeration from 1990 to 2020 (km2).
Area of EQI Grade1990200020102020
Low795.591019.591878.762658.51
Low–medium26,391.6326,376.4726,434.2325,630.55
medium21,643.9121,678.5520,376.5119,794.92
Medium–high19,065.9219,098.9618,544.218,663.45
High39,264.3638,987.8939,928.9440,413.14
Table 4. Transition area of the eco-environmental quality index (EQI) grade types from 1990 to 2020 (km2).
19902000
LowLow–MediumMediumMedium–HighHigh
Low743.8515.868.024.0423.82
Low–medium259.6425,893.55214.3820.083.98
Medium16.10442.9221,029.47147.368.08
Medium–high0.0024.12404.8518,577.9958.96
High0.000.0021.77349.4938,893.10
20002010
LowLow–mediumMediumMedium–highHigh
Low971.2232.1815.800.390.00
Low–medium863.4724,951.38508.6243.769.22
Medium32.131200.0018,547.041671.56227.78
Medium–high3.92206.471183.9516,111.541593.08
High8.0244.10120.73716.7838,098.32
20102020
LowLow–mediumMediumMedium–highHigh
Low1786.8080.020.003.928.02
Low–medium867.6725,102.65447.850.0015.94
Medium4.04443.8518,950.98920.6456.62
Medium–high0.004.08384.0217,435.07720.86
High0.000.0012.06304.0939,612.24
Table 5. Contribution rate of the land space transition to the ecological environment quality in the Guanzhong Plain urban Agglomeration from 1990 to 2020.
Eco-Environmental Effect1990~20002000~2010
Type of TransitionChange of the EQIContribution Rate/%Type of TransitionChange of the EQIContribution Rate/%
Improvement of the EQI1→24.74 × 10−441.441→36.47 × 10−362.49
8→22.55 × 10−422.291→22.00 × 10−319.29
1→31.41 × 10−412.336→15.94 × 10−45.74
1→41.04 × 10−49.063→23.71 × 10−43.58
4→39.10 × 10−57.941→42.87 × 10−42.78
8→43.60 × 10−53.148→31.22 × 10−41.18
3→22.20 × 10−51.944→31.10 × 10−41.07
4→21.10 × 10−50.938→49.50 × 10−50.92
Total1.13 × 10−399.07Total1.00 × 10−297.05
Deterioration of the EQI3→1−1.10 × 10−334.453→1−4.77 × 10−343.93
1→6−7.81 × 10−424.481→6−1.99 × 10−318.32
1→5−3.32 × 10−410.412→1−9.36 × 10−48.62
4→1−2.89 × 10−49.071→5−7.21 × 10−46.64
2→3−1.75 × 10−45.471→7−6.07 × 10−45.59
2→1−1.30 × 10−44.074→1−4.43 × 10−44.08
2→5−1.06 × 10−43.333→6−2.83 × 10−42.61
3→4−7.70 × 10−52.402→6−2.57 × 10−42.37
Total−2.99 × 10−393.68Total−1.00 × 10−292.15
Eco-environmental effect2010~20201990~2020
Type of transitionChange of the EQIContribution rate/%Type of transitionChange of the EQIContributionrate/%
Improvement of the EQI1→34.13 × 10−360.351→38.28 × 10−363.07
1→29.55 × 10−413.961→22.63 × 10−320.04
6→15.64 × 10−48.246→16.42 × 10−44.89
1→43.18 × 10−44.651→43.47 × 10−42.64
6→22.13 × 10−43.113→23.41 × 10−42.60
3→21.49 × 10−42.188→22.79 × 10−42.12
6→31.29 × 10−41.894→31.41 × 10−41.07
5→17.80 × 10−51.148→41.02 × 10−40.78
Total6.54 × 10−395.50Total1.28 × 10−297.22
Deterioration of the EQI3→1−2.19 × 10−333.893→1−5.47 × 10−335.73
1→6−1.02 × 10−315.741→6−3.26 × 10−321.27
1→7−7.72 × 10−411.951→5−1.57 × 10−310.28
2→1−6.10 × 10−49.431→7−1.32 × 10−38.65
1→5−5.70 × 10−48.822→1−9.72 × 10−46.35
2→3−3.64 × 10−45.634→1−4.45 × 10−42.91
3→7−1.62 × 10−42.512→3−4.32 × 10−42.82
3→6−1.13 × 10−41.753→6−3.44 × 10−42.25
Total−5.80 × 10−389.71Total−1.38 × 10−290.26
Publisher’s Note: MDPI stays neutral with regard to jurisdictional claims in published maps and institutional affiliations.

