Abstract
The unique high/cold environment of the Qinghai–Tibet Plateau (QTP) limits the natural distribution of the population living there and threatens local residents’ health. Thus, exploring the quality of human settlements in this area is of great significance. In this study, 5 first-level indicators and 25 second-level indicators were initially selected, and the entropy TOPSIS method was used to determine the weight of each indicator and evaluate the quality of the human settlements in each county of the QTP. Then, the coefficient of variation and spatial autocorrelation were used to analyze the spatial differences in human settlement quality. Finally, the obstacle degree model was used to identify those obstacles that affect the quality of the human settlements in the QTP. This study has gathered important findings. (1) The human settlement quality in these counties can be divided into 18 high-level areas, 45 mid- and high-level areas, 44 mid-level areas, 79 mid- and low-level areas, and 28 low-level areas. (2) In terms of spatial patterns, the north is higher than the south, the east is slightly higher than the west, and the surrounding area is higher than the interior. (3) In the clustering model, the high–high clustering trend is mainly concentrated in the north of the QTP, whereas the south-central part of the QTP and the zone where Tibet, Qinghai, and Sichuan meet exhibit obvious low–low clustering. (4) The variability of human settlement quality occurs in the order of Sichuan < Yunnan < Gansu < Xinjiang Autonomous Region < Tibet Autonomous Region < Qinghai. (5) The main first-level obstacles affecting human settlement quality in the counties of the QTP are living conditions, construction level of public service facilities, and infrastructure. The main second-level obstacles are the number of living service facilities, the number of residential districts, and the density of the road networks.
1. Introduction
Human settlements are the environment which forms the basis for human beings to survive in nature, and it is a space for human beings to work, live, and socialize [1,2,3]. Since the 20th century, accelerated urbanization and industrialization have brought superior material civilization and broad living and production spaces to mankind, but it has also led to a series of problems, such as excessive reclamation of resources, climate warming, the deterioration of the ecological environment, and the continuous compression of human living space [4,5,6]. Furthermore, the rise in population has led to the increasing demand for environmental resources, causing the human settlement problem to become more prominent [7]. The human settlement environment is a multi-level, open, and complex massive system, and scholars have initiated many discussions on human settlements [8,9,10,11]. Urban planning started the research on human settlements [12]. In the 1950s, the Greek scholar Doxiadis [8] proposed Ekistics, which laid the theoretical foundation for the science of human settlements. Since then, the science of human settlements has developed rapidly, as depicted by the Habitat I–Habitat III conferences held by the United Nations and the shift from the Habitat Agenda to the New City Agenda [13,14,15,16,17]. A good human settlement environment has become the common development direction for many countries. In China, the science of human settlements started in the 1990s and remains in the development stage. The work entitled “Introduction to Science of Human Settlements” by Wu [11] marks the initial formation of the theoretical system of human settlements in China.
A human settlement environment is a multi-level surface space system that is closely related to human living activities [11,18,19,20]. Human settlements comprise an artificial environment that is built based on the natural environment. It is the space for human settlement activities and the place for residents to live [21]. It has evolved from five systems, namely, nature, society, human beings, residence, and support [11,22]. Given the constituent hierarchical and extensive features of the human settlement environment, this topic has become a hot issue in urban planning, architecture, geography, environmental science, and other disciplines [19,22,23,24]. Human settlements directly affect the suitability of residents living conditions and further influences the population distribution in regions or cities [25]. Creating a good, livable, and sustainable human living environment has become one of the necessary tasks to meet the growing needs of a better quality of life and promote high-quality development [22,26,27,28]. The issue of human settlement is of great importance and has attracted the close attention of international institutions. Building a high-quality human settlement environment has become 1 of the 17 sustainable development goals of the United Nations [29,30]. The government has taken the lead in building a “Beautiful China” as an important means to promote the harmonious development between humans and nature [31,32,33,34].
Scholars have initiated extensive studies on human settlements. The research on human settlement mainly focuses on the natural suitability [4,35,36], comprehensive suitability or adaptability [18,20,23,37,38], quality [5,6,39,40], sustainability [41,42], satisfaction [43,44], livability [22,45,46,47,48], vulnerability [49,50,51], and internal coupling coordination of the system [2,52,53]. The research on the natural suitability of human settlements has earned widespread attention. Remote sensing and other technical approaches have been used to evaluate the suitability of human settlements. By analyzing terrains, climate, and other factors, the human settlement index, at a corresponding scale, can be used to explore the spatial relationship between the natural environment and human settlement distributions [7]. For example, the suitability of human settlements was evaluated in Kastamonu, Turkey, from the perspective of the climate [54]. Scholars have also studied the impact of urban traffic, landscape, and infrastructure on the livability of cities [47,55,56,57,58]. The comprehensive evaluation of human settlement quality has also attracted wide attention. Human settlement quality evaluation requires the obtainment of quantitative and qualitative information on the quality of a specific human settlement environment. The aim of the quality evaluation is to improve the capability of identifying changes in human settlements, ensuring that the human settlement quality remains in a range that is necessary for human living and development, and accordingly, adjusting human social behavior. With these goals, the quality of human settlements will likely develop towards a direction that is more conducive to the survival and development of human society under the action of human social behavior. The study scale of human settlement mainly includes the macroscale, with regions and provinces as the basic units, and the microscale, where cities and counties act as the basic units [5,6,39,40,59,60]. The study methods mainly include the analytic hierarchy process, principal component analysis, the Delphi method, the entropy method, and other related approaches [61,62,63,64]. Gu and Liu [62] evaluated the human settlement quality in Jianghuai of the Anhui Province by using the entire-array-polygon composite index. Their results showed that human settlement quality in Jianghuai is high in the east and low in the west, and water resources, infrastructure, and other factors presented the most significant impact. You et al. [63] took Ganzhou as a case study and found that the social and cultural environments had the largest weight in the system of the human settlements, using entropy TOPSIS (i.e., a technique for order preference by similarity to the ideal solution). Rong and Jia [64] found that the quality of rural human settlements in Inner Mongolia has a spatial pattern in the order of agricultural area > forest area > pastoral area. Xie et al. [5] studied the influencing factors on human settlement quality in Beijing using the panel data model. Bin et al. [65] looked at the county scale as a research unit and discussed the influencing factors on human settlements in the Guangdong Province using the spatial regression model. Zhou et al. [66] constructed an index system of human settlements with 10 index factors and explored the spatial aggregation and differentiation of human settlement quality. Li et al. [67] evaluated and analyzed the differentiation and controls of human settlement in Jinan using multisource data, spatial density analysis, and a gravity model. Zhu et al. [68] took downtown Fuzhou as a research area and found that convenient transportation and complete service facilities had a greater impact on human settlement quality using TOPSIS.
The aforementioned studies have enriched the developments in human settlement science in China; however, most of them are concentrated in the developed or low-altitude regions of China, leaving the depth of research on the impoverished, high-altitude and fragile regions relatively scarce. Most of the current research on human settlements focuses on the large-scale comparative analysis of cities and regions. The evaluation of human settlements at the county scale is scarce. The socioeconomic development of the inner space in the same region is not completely similar, and human settlements differ in numerous aspects. Human settlement analyses have shown that development problems abound at the county level. In addition, existing data are mainly gathered from statistical data or questionnaires, which entail a large workload and certain subjectivity. The Qinghai–Tibet Plateau (QTP), which is known as the “roof of the world”, covers an area of about 2,581,300 km2, with an average altitude of about 4400 m, and is the home of more than 10 million people [20]. With significant climate differences, an uneven precipitation distribution, and a strong solar radiation factor in the QTP, the daily and annual temperature differences are large, but the accumulated temperature is small. With poor natural environmental conditions and facing massive development and utilization challenges, the area is unattractive for human beings. Therefore, the social and economic development of the QTP is relatively backward, and the contradiction between economic development and environmental protection is prominent. For the Qinghai–Tibet Plateau (QTP), with its large area and low population density, statistical data are scarce. The quality of human settlements in the plateau is also difficult to evaluate using previous research methods. Therefore, the comprehensive evaluation of human settlement quality still needs to be comprehensively and systematically studied. Reasonably evaluating the current human settlement quality is of great significance. The obstacles restricting the improvement of the human settlement environment should be explored as a means of optimizing population distribution, coordinating development at the regional level, and promoting rational urban and rural planning.
With a vast territory, the QTP is the birthplace of many rivers in Asia; its glaciers and permafrost are widespread, and its ecological environment is fragile [69,70]. The service value provided by the ecosystems of the QTP accounts for 17.68% of the whole country annually [71]. Moreover, its existence is of great significance to neighboring regions and the world. Since the 21st century, the construction infrastructure represented by the QTP Railway and Sichuan–Tibet Railway has become a “booster” for the development of the QTP, providing the region with new economic opportunities. However, for a long time, the QTP has shown particularities and difficulties related to human–land relationships, topographic features, resource endowment, history and culture, and regional development that differ from those of other regions. Its unique high-frigid and natural conditions inflict limitations on population distribution and social and economic development [72,73]. The intensity of human activities has been continuously increasing, and the frequency of climate change has accelerated in recent years, leading to large-scale vegetation degradation, with the largest “no man’s land” formed in China [7,72]. Consequently, the contradiction between economic development and environmental protection has become acute. Ecological fragility, population poverty, and economic backwardness under topoclimate constraints present long-term problems [74]. The uniquely high and cold environments in the QTP have limited the natural distribution and orderly development of its population [72]. Moreover, the backward infrastructure construction, high incidence of plateau-endemic diseases, and poor medical services in the QTP seriously threaten the local residents’ health and human settlement quality. The average life expectancy for the QTP inhabitants is lower than the national average of China [20]. Thus, identifying the human settlement quality and its obstacles in the QTP have great importance for the improvement of local human settlements.
This study used the QTP as the research area, with the county acting as the basic research unit, to design a quality evaluation system for human settlements using five dimensions: natural environment, infrastructure, economic development, living conditions, and public services. Remote sensing data, point-of-interest (POI) data, meteorological data, statistical data, and other types of data were integrated into the research design. The weight of each index was calculated via the entropy method, and the quality of human settlements in the QTP was quantified using TOPSIS. With the help of the visualization function of ArcGIS10.7, the natural discontinuous point rating method (Jenks) was adopted to divide the human settlement quality of the counties in the QTP into five levels: high-level area, mid- and high-level area, mid-level area, mid- and low-level area, and low-level area. Spatial autocorrelation and a coefficient of variation were used in the cluster analysis and spatial variability analysis. Then, aiming to further reveal the main factors that hinder human settlement quality, an obstacle degree model was used to identify the obstacles and their influencing degrees. Finally, reasonable suggestions were gathered to provide a scientific basis for the sustainable and healthy development of the QTP.
2. Materials and Methods
2.1. The Study Area
The QTP is located on the third step in the southwest part of China, from the West Kunlun–Qilian Mountains in the north to the Himalayas in the south and from the Hindu Kush Mountains and Pamir Plateau in the west to the Hengduan Mountains in the east (Figure 1). The area covers six provinces: Tibet, Qinghai, Gansu, Sichuan, Yunnan, and Xinjiang [75,76]. The terrain within the plateau fluctuates greatly. The soil, which is still in the early stage of the soil-forming process, with weak erosion resistance, is permafrost, high-cold, and arid soil [77]. The vegetation mainly includes alpine meadow, grassland, and desert vegetation, and animal and plant resources are scarce. The uplift of the QTP exerts an important impact on the climate and ecological environment of China and even the world. The boundary of the QTP has constantly changed in recent years. Thus, we utilized the administrative scope defined by the national QTP Scientific Data Center, which includes 26 county-level units in Gansu, 41 county-level units in Qinghai, 46 counties in Sichuan, 78 counties in Tibet, 14 counties in Xinjiang and 9 counties in Yunnan, totaling 214 county-level units.
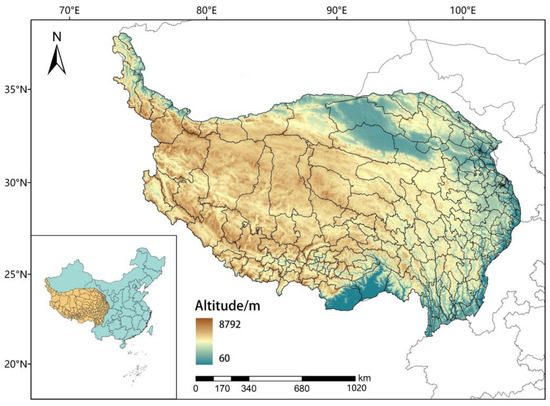
Figure 1.
Geographic location of the study area.
2.2. Data Sources
The vector range and remote sensing images of the QTP used in the study corresponded to the administrative scope defined by the national Qinghai–Tibet Plateau Scientific Data Center (http://data.tpdc.ac.cn/zh-hans/, accessed on 8 February 2022), with the number of county-level units totaling 214. Albers’ equal-area projection was adopted for the uniform preprocessing of the spatial data. The geographic reference used in this research was the WGS84 coordinate system.
The relief and average altitude of each county in the QTP were calculated via digital elevation modeling (DEM) with a 30 m resolution. Then, by referring to the relative humidity and average temperature shown in the surface climate data provided by National Meteorological Information Center (https://data.cma.cn/, accessed on 10 March 2021), the temperature and humidity indices of the QTP were calculated [25,78]. The vegetation coverage data were calculated based on the normalized difference vegetation index, which was derived from the Resource and Environment Science and Data Center (https://www.resdc.cn/, accessed on 8 February 2022). The surface water coverage rate is calculated using the land use data of the QTP with 30 m resolution, which was derived from the Resource and Environment Science and Data Center (https://www.resdc.cn/, accessed on 8 February 2022). After extracting the water body, the surface water coverage rate of each county was obtained by dividing the surface water coverage area of the county by the area of the county. The soil erosion data were obtained from the National Qinghai–Tibet Plateau Scientific Data Center (http://data.tpdc.ac.cn/zh-hans/, accessed on 8 February 2022).
The road network data were collected from Open Street Map Data (https://download.geofabrik.de/, accessed on 8 February 2022). The density of road networks was obtained by dividing the length of the county road by the area of the county. The data on registered residence population, administrative area, GDP, added value of three industries, the number of beds in medical institutions, and the number of primary and secondary school students were gathered from the County Statistical Yearbook of China of 2021. The numbers of road facilities, companies, residential quarters, health facilities, and living service facilities and other POI points were gathered from the Resource and Environment Science and Data Center (https://www.resdc.cn/, accessed on 8 February 2022). The number of POI points per capita for each county was calculated based on the unit of 1/10,000 people.
All data indicators involved data acquired for 2020, and lacking data, such as DEM and soil erosion degree, were represented by the nearest-year data.
2.3. Methods
The quality evaluation system for human settlements in the QTP was constructed from five dimensions: natural environment, infrastructure, economic development, living conditions, and public services (Figure 2). On this basis, the entropy method was used to determine the weight of each index, while the TOPSIS method was adopted to evaluate the quality of human settlements in each county. After obtaining the results via entropy TOPSIS, the natural discontinuous point-rating method was used to divide the quality of human settlements in the counties into five levels: high-level area, mid- and high-level area, mid-level area, mid- and low-level area, and low-level area. Furthermore, spatial autocorrelation and coefficient of variation were used to analyze the respective spatial characteristics. The obstacle evaluation model was used to analyze the obstacles at different levels and the overall obstacles. Finally, the policy recommendations were conceptualized.
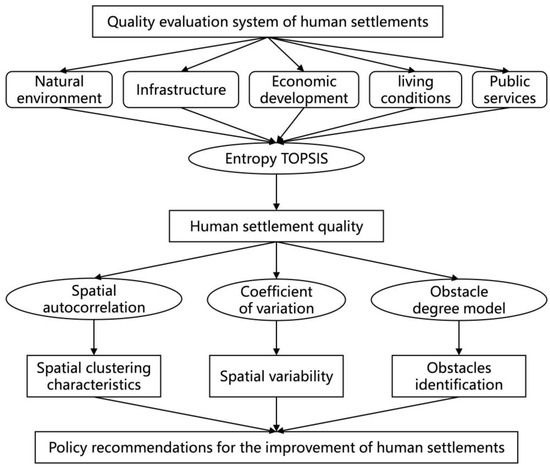
Figure 2.
Research technology road map.
2.3.1. Establishment of the Evaluation Indices
The human settlement environment is a space for human settlement activities and where residents live, and is divided into five aspects: natural environment, economic environment, living environment, infrastructure environment, and public service environment [5,11]. Drawing lessons from previous research results on the quality evaluation of human settlements [5,6,11,39,40] and following the scientific principles of standardization and accessibility to data, this study selected five first-level indicators (i.e., natural environment, infrastructure, economic development, living conditions, and public services), which were combined with information on the unique natural environment and social development of the QTP. Natural environment is the basic guarantee of human settlement quality [6,11]. Considering the unique natural environment of the QTP, six fundamental factors affecting the natural environment [5,20,21,22,23,37,79] were selected to express the natural environment (Table 1). Infrastructure is not only the material basis for improving human settlement but is also the carrier of economic, social, and cultural activities [5,80]. Furthermore, infrastructure provides the premise and an important support for social and economic development. Concerning the accessibility of the data and other scientific principles, four indicators [5,20,21,30,59,60,68] were chosen to quantify the infrastructure level (Table 1). The economic development level is the driving force for the development of human settlements and provides financial support [5]. In the QTP, the economic development level is directly related to human settlement quality in the QTP. By combining the information from the POI data and statistical data, four indicators [20,21,30,39,40,65,68] were selected to reflect economic development (Table 1). Living conditions are the core component of the evaluation of human settlement quality [5,59]. More importantly, living conditions account for the highest weight among the first-level indicators. Considering the accessibility of POI data and scientificity, four indicators [20,21,30,39,40,60,68] were selected to express the living conditions (Table 1). Public services are the material guarantees of human settlements [5]. The higher the quality of public services, the more conducive it is to alleviate various social contradictions and improve the government’s management ability and the overall allocation efficiency of public resources. To achieve the sustainable development of human settlements, public services are essential [81]. There were many factors affecting the public services, and we chose seven indicators [5,20,21,30,39,60,65,68] to evaluate public service level, which were combined with information on the actual situation of social development in the QTP (Table 1).

Table 1.
Quality evaluation index system for human settlements in the Qinghai–Tibet Plateau.
For the natural environment factor, the explanations of the distinction between positive and negative indicators are as follows. For relief degree of land surface, the rugged topography constrains agricultural development and population distribution [20], so relief degree of land surface is a negative indicator. The temperature and humidity indices represent the humidity-corrected temperature [82]. It reflects the human body’s perception of the comfort level of the climate and is a positive indicator [20]. High vegetation and surface water coverage degree could improve the environmental quality of QTP inhabitants. High-altitude may increase the incidence of some diseases and soil erosion can increase the risk of natural disasters. Thus, these two indicators are negative indicators [5,22]. For infrastructure, economic development, living conditions, and public services, all the relevant indicators are positive.
2.3.2. Determination of Index Weight via Entropy
The weights of the indicators on the quality evaluation index system for human settlements in the QTP were assigned using the entropy method.
(1) Assuming m evaluated objects and n indicators for each object to be evaluated, a judgment matrix is constructed as follows:
(2) The judgment matrix is standardized: According to the positive and negative attributes of the indicators, the data are standardized using the range method. The formula is given by
where refers to the standardized value of raw data; refers to the initial value of j indicator in i county; refers to the maximum value of j indicator; and refers to the minimum value of j indicator.
(3) The entropy values for the indicators calculated using the standardized numerical value are expressed as
where refers to the entropy values of the indicators, and refers to the proportion of the standardized indicators in the total index data.
(4) The weight of the indicator calculated using the entropy value of the indicator is given by
where refers to the weight of the indicator, i.e., , and .
2.3.3. TOPSIS Method
TOPSIS is an effective method that is commonly used in multi-objective decision analysis. First, the weights of the evaluation indicators are determined via the entropy method. Then, the rankings of the evaluation objects are determined based on techniques for approximating the ideal solutions [83]. In the alternative scheme set, the optimal value of a group of indicator data is taken as the positive ideal scheme, whereas the worst value of another group of indicator data is taken as the negative ideal scheme. The evaluated scheme is judged by comparing the distance of the scheme to the positive and negative ideal points. If a scheme is closest to the positive ideal solution and far away from the negative ideal solution, then it is the best one among the alternatives; otherwise, it is not the optimum.
(1) Multiply the standardized decision matrix by the weight of each index to obtain the weighted decision matrix R:
(2) Calculate the optimal solution and the inferior solution .
(3) Calculate the Euclidean distance U between the optimal solution and the inferior solution of each scheme.
(4) Calculate the closeness between the schemes and the ideal .
The larger the , the better the evaluation scheme. Here, .
2.3.4. Spatial Autocorrelation Analysis
Spatial autocorrelation is a mathematical representation of spatial dependence which describes the correlation between a variable at a location in space and the same variable at its neighboring location [84,85]. Moreover, spatial autocorrelation includes global and local spatial autocorrelation. Moran’s I index is adopted in this work. The global Moran’s I index is used to assess whether the spatial element distribution is in an aggregated, discrete, or random pattern. This index can be calculated by using the spatial autocorrelation tool in ArcGIS. A greater than zero Moran’s I index indicates a positive spatial autocorrelation, while a less than zero situation denotes a negative spatial autocorrelation. When Moran’s I index tends to zero, it indicates no spatial autocorrelation (i.e., completely spatial random process). The local Moran’s I index can be used to analyze the correlation between local elements and adjacent units, and the local indicators of spatial association (LISA) cluster map can be obtained through the clustering and outlier analysis tools in ArcGIS. The LISA map can reflect the “high–high”, “high–low”, “low–high”, and “low–low” aggregation in local areas and insignificant situations. The global Moran index was adopted to explore the agglomeration characteristics of human settlement quality in the counties of the QTP. The ideal solution distance for human settlement quality calculated by the TOPSIS method is selected to calculate the Moran’s index of human settlement quality and reveal the spatial clustering characteristics of human settlements in the QTP.
2.3.5. Coefficient of Variation
The coefficient of variation is a statistic used to measure the variation degree of each observed value in a group of data. In this study, variation analysis was conducted on the evaluation results of the counties in the QTP by referring to the situation of the different provinces. In this manner, the variation degree of human settlements in the counties of the different provinces could be explored.
2.3.6. Obstacle Degree Model
An important prerequisite for promoting sustainable human settlement is to minimize system vulnerability [50,86]. In this study, which is aimed at further revealing the main hindering factors, the obstacle degree model was adopted to analyze the hindering factors affecting human settlements in the QTP and their degree. The obstacle degree of each index to the overall goal in the different level areas and overall QTP was calculated as follows:
where refers to the index deviation degree, which represents the gap between the single index and the maximum target; it is selected as the gap between the standardized value of the index and 1. refers to the obstacle degree of the index in the criteria layer.
3. Results
3.1. Spatial Patterns of the First-Level Indicators of Human Settlements
The weights of the first-level indicators for the quality evaluation of human settlements in the QTP were obtained via the entropy method. The values were determined as follows: natural environment (0.1404), infrastructure (0.1932), economic development (0.1429), living conditions (0.2937), and public services (0.2298).
3.1.1. Natural Environment
In the QTP, the natural environment index decreases in a ring form from the outside to the central and southern parts (Figure 3). In the Ngari Prefecture and the Xinjiang Region, in the west of the QTP, the natural environment index is low. In these areas, the surface water coverage, temperature, humidity indices, and vegetation coverage are low. Surface water coverage accounts for the largest weight of all factors affecting the natural environment, further indicating that the water environment has the greatest impact among natural environmental factors. The quality of the natural environment is poor, as depicted by the low natural environment index.
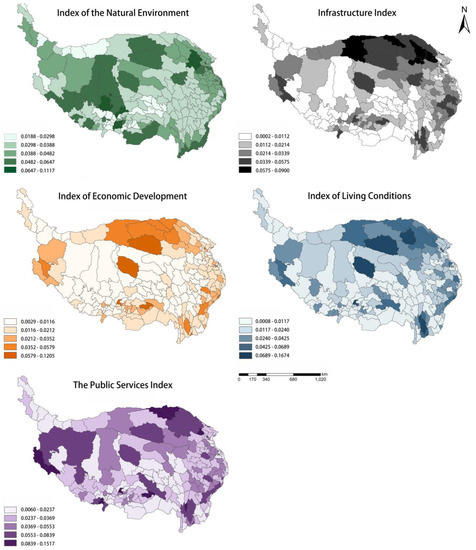
Figure 3.
Spatial distribution of first-level indicators for human settlement quality in the Qinghai–Tibet Plateau.
3.1.2. Infrastructure
Except for some areas in Lhasa, the infrastructure level in the QTP gradually decreases from east to west, depicting a crescent moon-shaped pattern. The five districts with the highest level of transport infrastructures are Chengxi District, Chengdong District, Chengbei District, Central District, and Chengguan District, which are all located in urban areas, with perfect scores for infrastructure and high traffic accessibility. By contrast, in the northwestern and southeastern areas of the QTP, the traffic conditions are poor. This situation can be attributed to terrain factors, such as the presence of Kunlun Mountains and Tanggula Mountains. Meanwhile, the areas with high-level health facilities are mainly concentrated in the northeastern part of Qinghai province, the Lhasa–Nyingchi area, and some areas in the east of the QTP.
3.1.3. Economic Development
The overall economic development level of the QTP is low, with a great difference in the development pattern. The regions with a high economic development index are generally concentrated in the north and the eastern edge of the QTP, in Doilungdeqen of Lhasa in the south, and in Nyingchi County of Nyingchi City. From the perspective of GDP, the most relevant indicative indicator, the per capita GDP of each county in the QTP, varies greatly. Take the per capita GDP in 2020, in which 72400 yuan is the demarcation line. Only 15% of the counties in the QTP reached the domestic per capita level, whereas 85% of them have a per capita GDP below the average level.
3.1.4. Living Conditions
The overall living conditions of the QTP are not consistently high, and the living conditions in most areas still need to be improved. In the QTP, the living condition index is higher in the east than in the west, higher in the north than in the south, and higher in the urban areas than in the counties. As a concentrated area of nationalities with a long history, the QTP is influenced by diverse cultures, reflecting different living habits. The regions with a high residential district index are mostly concentrated in Dujiangyan City, Chengdong District, Delingha City, Doilungdeqen District, and other urban areas. The influence of national culture on these regions with a high level of urbanization is relatively weak, and their numbers of residential communities are large. The regions with a high living facility index are similarly distributed in Doilungdeqen District, Old Town, Dujiangyan City, and other urban areas. In general, the living conditions are positively correlated with the level of urbanization.
3.1.5. Public Services
Except for the counties in Xinjiang, in the northwestern corner of the QTP, the level of public services generally appears as a ring form, decreasing from the outside to the inside. A comparison of public service levels in counties in the entire QTP indicates high levels in Mongolian Autonomous County in the north of Gansu, Doilungdeqen District, Aksai Kazakh Autonomous County, and other counties and low levels in Jiangda County, Hotan County, and Lhunze County.
3.2. Spatial Characteristics of Human Settlements
3.2.1. Spatial Patterns
The average evaluation score of the whole region is 0.1525. The number of counties with scores above this line is 75, whereas the number of counties with scores below the average value is 139. The counties with scores above the average value are generally distributed in a ring form around the edge of the QTP, with a low average elevation (Figure 4). The counties with scores below the average value are concentrated and contiguously distributed in the middle and southern, and northwest regions of the QTP. The quality of human settlement in the QTP generally decreases from the outside to the inside. Among the 214 counties of the QTP, 18 of them are high-level areas (0.2800–0.4404), in which Doilungdeqen District has the highest score (0.4404), followed by Dujiangyan, Chengxi District, Derong County, Chengdong District, etc. These high-level areas are mostly located in urban areas or the counties around the urban areas with a low elevation, such as those at the edge of the plateau. The mid- and high-level areas (0.1798–0.2799) are represented by 45 counties, most of which are located around the high-level areas. The mid-level areas (0.1263–0.1797) are represented by 44 countries, and they are scattered in the middle and south of the QTP, showing a fan-shaped radial distribution. The mid- and low-level areas (0.0864–0.1262) are represented by 79 counties, and they are concentrated in the east of the QTP and the south of Xinjiang, depicting a scattered distribution in Tibet. The low-level areas (0.0521–0.0863) are represented by 28 countries, and they are concentrated in the south of the middle-eastern part, depicting a scattered distribution in the south of Tibet and the south of Xinjiang.
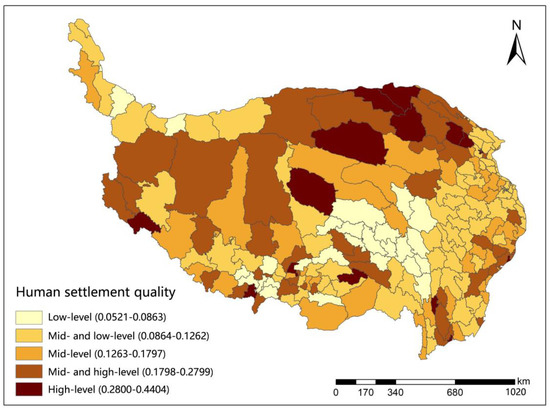
Figure 4.
Spatial distribution of human settlement quality in the Qinghai–Tibet Plateau.
3.2.2. Spatial Clustering Characteristics
The global Moran’s I index of human settlement quality in the QTP is 0.34581, which is significantly positive (Table 2). Furthermore, the test result is relatively significant, indicating that human settlements in counties of the QTP have obvious spatial clustering characteristics.
Table 2.
Global Moran’s I index of human settlement quality in the Qinghai–Tibet Plateau.
The clustering of human settlements in the counties of the QTP was analyzed visually using a local Moran’s I index. The clustering was divided into high–high clustering, high–low clustering, low–high clustering, and low–low clustering. A trend of high–high clustering is apparent in the counties in the north of the QTP, while it is sporadically distributed in the southern part of the QTP (Figure 5). In these areas, the human settlement quality is generally high-level or mid- and high-level. In south-central QTP, and the zone where Tibet, Qinghai, and Sichuan meet, a low–low clustering trend is apparent. The quality of human settlements in this area is generally low-level.
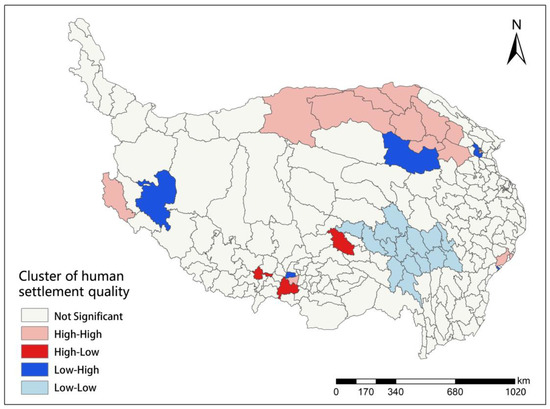
Figure 5.
Cluster distribution of human settlement quality in the Qinghai–Tibet Plateau.
3.2.3. Spatial Variability
The variation coefficient of human settlement quality is in the order of Sichuan Province < Yunnan Province < Gansu Province < Xinjiang Autonomous Region < Tibet Autonomous Region < Qinghai Province (Figure 6). The smallest coefficient of variation is for Sichuan, and the counties belonging to this province have the smallest difference in terms of human settlement quality. The Sichuan Province has the highest level of social and economic development among the six provinces in the QTP. The coefficients of variation are small but similar between the provinces of Yunnan and Gansu, which have been increasing their investment in improving human settlements since the 12th Five-Year Plan to reduce the regional development difference. The coefficients of variation are higher in the provinces of Xinjiang, Tibet, and Qinghai. Especially in Tibet and Qinghai, the coefficients of variation are the highest, indicating that the quality of the regional human settlements varies greatly. Tibet and Qinghai constitute the main body of the QTP. Their coefficients of variation can better reflect the overall difference in human settlement quality in the QTP.
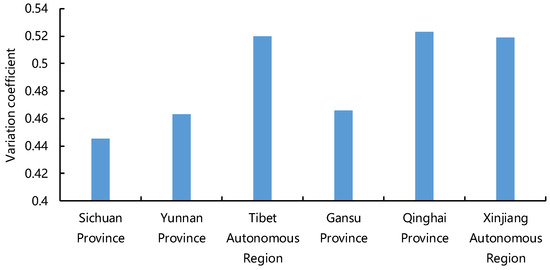
Figure 6.
Spatial variation coefficients for human settlement quality in different provinces of the Qinghai–Tibet Plateau.
3.3. Obstacles of Human Settlements
3.3.1. The Obstacles of Human Settlements across Different Regional Levels
In the high-level area, the high-degree obstacles are the number of living service facilities, the density of the road networks, surface water coverage, the number of companies, and the number of government agencies and social groups (Table 3). The cumulative obstacle degree of these five items is 45.61%. In the mid- and high-level area, the high-degree obstacles are the density of road networks, the number of living service facilities, the number of residential districts, the number of parking lots, and the number of companies. The cumulative obstacle degree of these five items is 43.78%. In the mid-level area, the high-degree obstacles are the number of living service facilities, the number of residential districts, the density of the road networks, the number of parking lots, and the number of government agencies and social groups. The cumulative obstacle degree of these five items is 43.58%. In the mid- and low-level area, the high-degree obstacles are the number of living service facilities, the number of residential districts, the density of the road networks, the number of parking lots, and the number of government agencies and social groups. The cumulative obstacle degree of these five items is 42.91%. In the low-level area, the high-degree obstacles are the number of living service facilities, the number of residential districts, the number of parking lots, the density of the road networks, and the number of government agencies and social groups. The cumulative obstacle degree of these five items is 41.95%.
Table 3.
Obstacle degree against human settlement quality across different regional levels in the Qinghai–Tibet Plateau.
3.3.2. The Obstacles of Human Settlements in the Whole Qinghai–Tibet Plateau
According to the results, the first-level indicators could be ranked in descending order based on the obstacle degree as follows: living conditions, public services, infrastructure, and economic development, and natural environment (Table 4). The high-degree obstacles to human settlements quality in the second-level indicators are the number of living service facilities, the number of residential districts, the density of the road networks, the number of parking lots, the number of companies, the number of government agencies and social organizations, surface water coverage, the number of supermarkets and malls, the number of sport and leisure service facilities, the number of transport hub facilities. The cumulative obstacle degree of these 10 items is 73.29%.
Table 4.
Obstacle degree against human settlement quality for the whole Qinghai–Tibet Plateau.
4. Discussion
Human settlement quality can be regarded as a large, complex, and dynamic system involving numerous factors. Evaluating the quality of human settlements in counties of the QTP entails many difficulties and barriers due to data acquisition problems. This study investigated the spatial characteristics of the quality of human settlements in the counties of the QTP using multi-source data (i.e., an integration of remote sensing data, POI data, meteorological data, statistical data, and other types of data). This study can reflect the distribution characteristics of human settlement quality in the QTP, forming a sample case of different areas where data are scarce while constructing a technical framework that is applicable to these areas. Furthermore, the findings of this research can serve as a reference for improving the study of the science of human settlements, especially for the west of China, where research is seldom conducted.
Our results have shown that the average evaluation score for human settlement quality in the whole of the QTP is 0.1525, which is lower than that of Beijing (>0.403) [5] and Chongqing (0.53) [59]. For the spatial distribution, there are 79 mid- and low-level counties and 28 low-level counties. Moreover, the human settlement scores of 65% of the counties are below the average value in the QTP. This reflects that there is an urgent need to improve the human settlements of the QTP. The spatial clustering characteristics and spatial variability of human settlement quality in the QTP showed obvious spatial differences and regional imbalances, which is a combined effect of natural conditions and social development [4,5,7]. Our study sheds light on the main obstacle affecting the quality of the human settlements in the counties of the QTP, which is the living condition, followed by the construction level of public services and infrastructure. The results are consistent with the study in Tibet by Ding et al. [20], yet these show differences when compared with other studies [3,59,63]. “Living conditions” is the leading factor causing the differences in the quality of the human settlements of the QTP. Moreover, living conditions are an important reflection of urban and rural growth and of peoples’ living standards. Thus, in the QTP, it is crucial that the government improves the living conditions of the local inhabitants, including the residential district and overall residential facilities. Public services are involved in many elements, and the efficiency of these services is very important considering the low population density of the QTP. To achieve the sustainable development of human settlements, the QTP should focus on the improvement of education, health care, and other public services [81]. Infrastructure is the lifeline for improving human settlements. With the promotion of policies such as China Western Development, the infrastructure of the QTP is being gradually improved. Considering the natural conditions of the QTP, improving transportation holds priority because the transport infrastructure reshapes the regional spatial pattern by changing the location conditions [87,88]. On the basis of the study of Gao et al. [89], the regional connectivity of the QTP has gradually increased via a “mesh” transport network. Nonetheless, related problems can still be observed [90], including delays in the overall construction and an insufficient comprehensive synergy, which both need to be improved urgently.
Based on the results of human settlement quality, we suggest that the government should improve the future quality of the human settlements in the QTP via the following aspects. Firstly, the local government should pay attention to the reduction in the differences in human settlement quality across the counties. On the basis of the unique resource endowment of the QTP, the government should capture appropriate economic development models, strengthen the infrastructure construction of the human settlements, maximize the advantages of the high-level counties, promote the exchange and flow of various factors among the counties, form complementary advantages and reasonably allocate resource elements, and promote the steady improvement of the quality of the human settlements in the QTP. Secondly, the government should increasingly improve the projects, policies, and regulations related to human settlement construction in the QTP to ensure that support for the human settlements is gradually enhanced and that human settlement quality grows. Among all factors, implementing projects is key, including the projects of rural and urban living environment improvement, industrial and mining pollution prevention and control, and environmental protection projects related to integrated watershed management. Especially in recent years, the increasing intensity of human activity has led to increased eco-environmental stress [91], and natural environment quality in the QTP has been influenced by this. The fragile sensitivity of the QTPs own natural environment has become an important factor restricting the improvement of the human settlement quality. Thus, environmental protection projects are also necessary. Thirdly, based on the results of the obstacle degree model, the government should focus on resolving the main obstacles. Human settlement quality can be regarded as a large, complex, and dynamic system. The factors influencing human settlement quality include many aspects, such as natural environment, social development, economic development, and the supporting systems. The natural environment is not easy to change, but living conditions, public services, and infrastructure are [20,92] and form the main obstacles of human settlement quality in the QTP. Based on the evaluation results, there are similar spatial patterns among the levels of living conditions, public services, and infrastructure. Thus, it is necessary to establish an overall concept and increase cooperation efforts in resolving different obstacles to the quality of human settlements, including living conditions, public services, and infrastructure.
There are still some limitations in our study. Our study applied multi-source data for assessing the quality of human settlements, and the factors of human settlements were selected from five aspects: natural environment, infrastructure, economic development, living conditions, and public services. Some negative elements (e.g., crime rate and unemployment rate) were relevant to the quality of the human settlements [5], but these data could not be obtained. Thus, those elements were not put into the evaluation system. Moreover, there is a difference in the number of indicators under the five aspects of human settlements because of the differences in the availability of the data. Although the objective weighting method applied in our paper has weakened the impact of the different numbers, the incomplete indicators still need attention. In subsequent research, we will conduct studies to improve these evaluation indicators. The human settlements were evaluated by objective indicators, but this does not mean that the local residents are satisfied with the quality in their human settlement. In future research, field surveys or questionnaires are needed to analyze residents’ satisfaction with their human settlement from a subjective perspective so as to test the objective evaluation results.
5. Conclusions
On the basis of the remote sensing data, POI data, meteorological data, statistical data, and other types of data, this study calculated human settlement quality via entropy TOPSIS methodology. Then, by implementing spatial autocorrelation analysis and a coefficient of variation, this study analyzed the spatial distribution patterns of human settlements in the counties of the QTP. Finally, the hindering factors were identified via obstacle degree modeling. The main conclusions can be summarized as follows:
(1) The quality of the human settlements in the counties of the QTP was calculated using the entropy TOPSIS method, and then five levels were determined via the Jenks natural breakpoint method. The classification results are as follows: 18 high-level areas, 45 mid- and high-level areas, 44 mid-level areas, 79 mid- and low-level areas, and 28 low-level areas. The average score of the whole region is 0.1525. A total of 65% of the counties are below the average value.
(2) From the perspective of spatial patterns, the quality of the human settlements in the QTP varies greatly, and the overall score is relatively low. The quality of the human settlements generally takes a ring form, declining from the outside to the inside. The distribution pattern can be described as follows: the north is higher than the south, the east is slightly higher than the west, and the surrounding area is higher than the interior.
(3) The high–high clustering trend is significant among counties in the north of the QTP, whereas sporadic high-value distribution is apparent among the southern counties. By contrast, the low–low clustering trend is obvious in the south-central QTP and the zone where Tibet, Qinghai, and Sichuan meet.
(4) According to the variation coefficient, the variability of the human settlements in the QTP is in the order of Sichuan < Yunnan < Gansu < Xinjiang Autonomous Region < Tibet Autonomous Region < Qinghai.
(5) The main first-level obstacles affecting the quality of the human settlements in the QTP are living conditions, with a high obstacle degree of 31.46%, followed by public services and infrastructure. The cumulative obstacle degree of these three items is high (73.75%). The top three factors with the highest obstacle degree among the second-level indicators are the number of living service facilities, the number of residential districts, and the density of road networks.
(6) In our study, there are some limitations regarding the selection of the measurement indicators. In subsequent research, we will improve the evaluation indicators. Moreover, we also will conduct field surveys or questionnaires on residents’ satisfaction with the human settlements to test the objective evaluation results.
Author Contributions
Conceptualization, L.L., X.D. and Q.M.; Data curation, Y.G., Q.H. and M.L.; Formal analysis, Y.G.; Funding acquisition, H.W.; Investigation, M.L.; Visualization, Q.H.; Writing—original draft, H.W. and Y.G.; Writing—review & editing, H.W. and Q.M. All authors have read and agreed to the published version of the manuscript.
Funding
This research was funded by the Second Tibetan Plateau Scientific Expedition and Research Program (2019QZKK0608) and National Natural Science Foundation of China (41901259).
Institutional Review Board Statement
Not applicable.
Informed Consent Statement
Not applicable.
Data Availability Statement
Not applicable.
Conflicts of Interest
The authors declare no conflict of interest.
References
- Doxiadis, C.A. Ekistics, the Science of Human Settlements. Science 1970, 170, 393–404. [Google Scholar] [CrossRef] [PubMed]
- Tian, S.; Yang, B.; Liu, Z.; Li, X.; Zhang, W. Coupling Coordination of Urban Pseudo and Reality Human Settlements. Land 2022, 11, 414. [Google Scholar] [CrossRef]
- Xia, X.; Chen, H.; Gao, Q.; Shao, H.; Cao, Z.; Zhao, Y. A Study on Temporal and Spatial Variations of Suitability of Urban Living Environment in Jiangsu Province based on a Geographical Detector. Bull. Soil Water Conserv. 2020, 40, 289–296. [Google Scholar]
- Feng, Z.; Yang, Y.; Zhang, D.; Tang, Y. Natural environment suitability for human settlements in China based on GIS. J. Geogr. Sci. 2009, 19, 437–446. [Google Scholar] [CrossRef]
- Xie, T.; Liu, X.; Nie, P. Study on Spatial–Temporal Patterns and Factors Influencing Human Settlement Quality in Beijing. Sustainability 2022, 14, 3752. [Google Scholar] [CrossRef]
- Tang, L.; Ruth, M.; He, Q.; Mirzaee, S. Comprehensive evaluation of trends in human settlements quality changes and spatial differentiation characteristics of 35 Chinese major cities. Habitat Int. 2017, 70, 81–90. [Google Scholar] [CrossRef]
- Xu, C.; Jin, S.; Wang, Y. Natural Suitability Evaluation of Human Settlements in Qinghai-Tibet Plateau based on GIS. Ecol. Sci. 2020, 39, 93–103. [Google Scholar]
- Doxiadis, C.A. An Introduction to the Science of Human Settlements; Oxford University Press: Oxford, UK, 1968. [Google Scholar]
- Choguill, C. Toward sustainability of human settlements. Habitat Int. 1996, 20, 5–8. [Google Scholar] [CrossRef]
- Gilbert, A. An urbanizing world: Global report on human settlements. Habitat Int. 1998, 22, 75–77. [Google Scholar] [CrossRef]
- Wu, L. Introduction to Sciences of Human Settlements; China Architecture and Building Press: Beijing, China, 2001. [Google Scholar]
- Zhao, X.; Sun, H.; Chen, B.; Xia, X.; Li, P. China’s rural human settlements: Qualitative evaluation, quantitative analysis and policy implications. Ecol. Indic. 2018, 105, 398–405. [Google Scholar] [CrossRef]
- United Nations (UN). The United Nations Conference on the Human Environment (The Stockholm Conference). Stockholm, Sweden, 5–16 June 1972. Available online: https://www.un.org/en/conferences/environment/stockholm1972 (accessed on 9 March 2022).
- United Nations (UN). The United Nations Conference on Human Settlements (Habitat I). Vancouver, BC, Canada, 31 May–11 June 1976. Available online: http://habitat1.org/ (accessed on 9 March 2022).
- United Nations (UN). The Second United Nations Conference on Human Settlements (Habitat II). Istanbul, Turkey, 3–14 June 1996. Available online: http://habitat2.org/ (accessed on 9 March 2022).
- United Nations (UN). The United Nations Conference on Housing and Sustainable Urban Development (Habitat III). Quito, Ecuador, 17–20 October 2016. Available online: https://habitat3.org/ (accessed on 9 March 2022).
- Mao, Q. Theory and practice of the science of human settlements in China. Urban Plan. Int. 2019, 34, 54–63. [Google Scholar] [CrossRef]
- Guan, Y.; Li, X.; Yang, J.; Li, S.; Tian, S. Spatial Differentiation of Comprehensive Suitability of Urban Human Settlements Based on GIS: A Case Study of Liaoning Province, China. Environ. Dev. Sustain. 2022, 24, 4150–4174. [Google Scholar] [CrossRef]
- Xiong, Y. Uncertainty evaluation of the coordinated development of urban human settlement environment and economy in Changsha city. J. Geogr. Sci. 2011, 21, 1123–1137. [Google Scholar] [CrossRef]
- Ding, Y.; Shi, B.; Su, G.; Li, Q.; Meng, J.; Jiang, Y.; Qin, Y.; Dai, L.; Song, S. Assessing Suitability of Human Settlements in High-Altitude Area Using a Comprehensive Index Method: A Case Study of Tibet, China. Sustainability 2021, 13, 1485. [Google Scholar] [CrossRef]
- Cong, X.; Li, X.; Gong, Y. Spatiotemporal Evolution and Driving Forces of Sustainable Development of Urban Human Settlements in China for SDGs. Land 2021, 10, 993. [Google Scholar] [CrossRef]
- Wei, Y.; Wang, H.; Tan, B.; Xue, M.; Yin, Y. Analysis of the Spatial Differentiation and Development Optimization of Towns’ Livable Quality in Aksu, China. Sustainability 2022, 14, 7728. [Google Scholar] [CrossRef]
- Luo, X.; Yang, J.; Sun, W.; He, B. Suitability of human settlements in mountainous areas from the perspective of ventilation: A case study of the main urban area of Chongqing. J. Clean. Prod. 2021, 310, 127467. [Google Scholar] [CrossRef]
- Hu, Q.; Wang, C. Quality Evaluation and Division of Regional Types of Rural Human Settlements in China. Habitat Int. 2020, 105, 102278. [Google Scholar] [CrossRef]
- Halik, W.; Mamat, A.; Dang, J.; Deng, B.; Tiyip, T. Suitability analysis of human settlement environment within the Tarim Basin in Northwestern China. Quat. Int. 2013, 311, 175–180. [Google Scholar] [CrossRef]
- Wu, L. High-Quality Development of Human Settlements and Modernization of Urban and Rural Governance. Hum. Habitat 2019, 4, 3–5. [Google Scholar]
- Kyttä, M.; Broberg, A.; Haybatollahi, M.; Schmidt-Thomé, K. Urban Happiness: Context-Sensitive Study of the Social Sustainability of Urban Settings. Environ. Plan. B Plan. Des. 2016, 43, 34–57. [Google Scholar] [CrossRef]
- Wang, Y.; Jin, C.; Lu, M.; Lu, Y. Assessing the suitability of regional human settlements environment from a different preferences perspective: A case study of Zhejiang Province, China. Habitat Int. 2017, 70, 1–12. [Google Scholar] [CrossRef]
- United Nations Transforming Our World: The 2030 Agenda for Sustainable Development. Available online: https://www.un.org/ga/search/view_doc.asp?symbol=A/RES/70/1&Lang=E (accessed on 9 March 2022).
- Xiao, Y.; Chai, J.; Wang, R.; Huang, H. Assessment and Key Factors of Urban Liveability in Underdeveloped Regions: A Case Study of the Loess Plateau, China. Sustain. Cities Soc. 2022, 79, 103674. [Google Scholar] [CrossRef]
- Hu, J. Unswervingly Advance along the Road of Socialism with Chinese Characteristics, and Strive to Build a Moderately Prosperous Society in an All-Round Way: A Report at the 18th National Congress of the Communist Party of China; Beijing People’s Press: Beijing, China, 2012. [Google Scholar]
- Chen, M.; Liang, L.; Wang, Z.; Zhang, W.; Yu, J.; Liang, Y. Geographical thoughts on the relationship between ‘Beautiful China’ and land spatial planning. J. Geogr. Sci. 2020, 30, 705–723. [Google Scholar] [CrossRef]
- Zhang, Z.; Hu, Z.; Zhong, F.; Cheng, Q.; Wu, M. Spatio-Temporal Evolution and Influencing Factors of High Quality Development in the Yunnan–Guizhou, Region Based on the Perspective of a Beautiful China and SDGs. Land 2022, 11, 821. [Google Scholar] [CrossRef]
- Fang, C.L.; Wang, Z.B.; Liu, H.M. Beautiful China Initiative: Human-nature harmony theory, evaluation index system and application. J. Geogr. Sci. 2020, 30, 691–704. [Google Scholar] [CrossRef]
- Yang, X.; Ma, H. Natural environment suitability of China and its relationship with population distributions. Int. J. Environ. Res. Public Health 2009, 6, 3025–3039. [Google Scholar] [CrossRef]
- Luo, J.; Zhou, T.; Du, P.; Xu, Z. Spatial-temporal variations of natural suitability of human settlement environment in the Three Gorges Reservoir Area—A case study in Fengjie County, China. Front. Earth Sci. 2019, 13, 1–17. [Google Scholar] [CrossRef]
- Li, W.; Li, P.; Feng, Z.; Xiao, C. GIS-Based Modeling of Human Settlement Suitability for the Belt and Road Regions. Int. J. Environ. Res. Public Health 2022, 19, 6044. [Google Scholar] [CrossRef]
- Chen, W.; Zhu, K.; Wu, Q.; Cai, Y.; Lu, Y.; Wei, J. Adaptability evaluation of human settlements in Chengdu based on 3S technology. Environ. Sci. Pollut. Res. 2021, 29, 5988–5999. [Google Scholar] [CrossRef]
- Li, S.; Wei, H.; Ni, X.L.; Gu, Y.W.; Li, C.X. Evaluation of urban human settlement quality in Ningxia based on AHP and entropy method. J. Appl. Ecol. 2014, 25, 2700–2708. [Google Scholar]
- Li, X.; Li, S.; Gao, J.; Zhao, P.; Hang, L. Human Settlement Quality Evaluation Based on Air Quality in Major Cities of China. Adv. Meteorol. 2018, 2018, 4914760. [Google Scholar] [CrossRef]
- Chi, W.; Jia, J.; Pan, T.; Jin, L.; Bai, X. Multi-Scale Analysis of Green Space for Human Settlement Sustainability in Urban Areas of the Inner Mongolia Plateau, China. Sustainability 2020, 12, 6783. [Google Scholar] [CrossRef]
- Nazmfar, H.; Alavi, S.; Feizizadeh, B.; Eshgi, A. An integrated approach of the analytic network process and barometer model mapping of human settlement sustainability in Ardebil Province, Iran. Appl. Geomat. 2022, 14, 237–252. [Google Scholar] [CrossRef]
- Wang, P.; Qin, X.; Li, Y. Satisfaction Evaluation of Rural Human Settlements in Northwest China: Method and Application. Land 2021, 10, 813. [Google Scholar] [CrossRef]
- Li, X.; Liu, H. The Influence of Subjective and Objective Characteristics of Urban Human Settlements on Residents’ Life Satisfaction in China. Land 2021, 10, 1400. [Google Scholar] [CrossRef]
- Zhu, L.; Guo, Y.; Zhang, C.; Meng, J.; Ju, L.; Zhang, Y.; Tang, W. Assessing Community-Level Livability Using Combined Remote Sensing and Internet-Based Big Geospatial Data. Remote Sens. 2020, 12, 4026. [Google Scholar] [CrossRef]
- Ma, L.; Liu, S.; Tao, T.; Gong, M.; Bai, J. Spatial reconstruction of rural settlements based on livability and population flow. Habitat Int. 2022, 126, 102614. [Google Scholar] [CrossRef]
- Tang, J.; Sui, L. Geodetector-Based Livability Analysis of Potential Resettlement Locations for Villages in Coal Mining Areas on the Loess Plateau of China. Sustainability 2022, 14, 8365. [Google Scholar] [CrossRef]
- Liang, X.; Liu, Y.; Qiu, T. Livability assessment of urban communities considering the preferences of different age groups. Complexity 2020, 2020, 8269274. [Google Scholar] [CrossRef]
- Penjor, U.; Wangdi, S.; Tandin, T.; Macdonald, D.W. Vulnerability of mammal communities to the combined impacts of anthropic land-use and climate change in the Himalayan conservation landscape of Bhutan. Ecol. Indic. 2021, 121, 107085. [Google Scholar] [CrossRef]
- Sarthak, K.; Ripple, V.; Sanyukta, M.; Manthan, T. A vulnerability assessment of human settlement on river banks: A case study of Vishwamitri River, Vadodara, India. J. Environ. Res. Dev. 2015, 9, 1015–1023. [Google Scholar]
- Sanyal, J.; Lu, X. Remote sensing and GIS-based flood vulnerability assessment of human settlements: A case study of Gangetic West Bengal, India. Hydrol. Proc. 2005, 19, 3699–3716. [Google Scholar] [CrossRef]
- Tian, S.; Qi, A.; Li, Z.; Pan, X.; Liu, Y.; Li, X. Urban “Three States” Human Settlements High-Quality Coordinated Development. Buildings 2022, 12, 178. [Google Scholar] [CrossRef]
- Li, X.M.; Guo, Y.J.; Tian, S.Z.; Bai, Z.Z.; Liu, H. The Spatio-temporal pattern evolution and driving force of the coupling coordination degree of urban human settlements system in Liaoning province. Sci. Geogr. Sin. 2019, 39, 1208–1218. [Google Scholar]
- Cetin, M. Determining the bioclimatic comfort in Kastamonu City. Environ. Monit. Assess. 2015, 187, 640. [Google Scholar] [CrossRef]
- Parker, J.; Simpson, G.D. Public Green Infrastructure Contributes to City Livability: A Systematic Quantitative Review. Land 2018, 7, 161. [Google Scholar] [CrossRef]
- Reiner, M.; Rouse, D. Dependency model: Reliable infrastructure and the resilient, sustainable, and livable city. Sustain. Resilient Infrastruct. 2017, 9689, 103–108. [Google Scholar] [CrossRef]
- Saeed, U.; Ahmad, S.R.; Mohey-ud-din, G.; Butt, H.J.; Ashraf, U. An Integrated Approach for Developing an Urban Livability Composite Index—A Cities’ Ranking Road Map to Achieve Urban Sustainability. Sustainability 2022, 14, 8755. [Google Scholar] [CrossRef]
- Wang, W.; Gong, J.; Wang, Y.; Shen, Y. The Causal Pathway of Rural Human Settlement, Livelihood Capital, and Agricultural Land Transfer Decision-Making: Is It Regional Consistency? Land 2022, 11, 1077. [Google Scholar] [CrossRef]
- Tang, N.; Wang, C.; Du, X. Evaluation of Rural Human Settlements Quality and Its Differentiated Optimization in Chongqing Municipality. Econ. Geogr. 2018, 38, 160–165, 173. [Google Scholar]
- Tang, N.; Wang, C. Comprehensive evaluation and spatial distribution of rural human settlement environment in Chongqing City. Res. Soil Water Conserv. 2018, 25, 315–321. [Google Scholar]
- Lv, W.; Li, Y. Evaluation of Urban Human Settlement Ecological Environment Quality in Beijing Under the New Normal Background. Environ. Dev. 2018, 30, 9–12. [Google Scholar]
- Gu, K.; Liu, X. Quality Assessment and spatial differentiation of rural human settlements in the counties in Jianghuai Region of Anhui. J. Ecol. Rural Environ. 2018, 34, 385–392. [Google Scholar]
- You, X.; Dai, Q.; Guo, C. Evaluation of Rural Human Settlement in Hill Area in Southern China Based on Entropy TOPSIS Model—A Case Study of Ganzhou. Mt. Res. 2017, 35, 899–907. [Google Scholar]
- Rong, L.; Jia, Y. Evaluation of Rural Human Settlement Quality and Its Spatial Pattern in Inner Mongolia Autonomous Region. J. Human Settle. West China 2019, 34, 112–120. [Google Scholar]
- Bin, J.; Tang, X.; Chen, S. Spatial Distribution and Influencing Factors of Rural Human Settlement Quality in Guangdong Province. Ecol. Econ. 2021, 37, 203–209, 223. [Google Scholar]
- Jiaxing, Z.; Lin, L.; Hang, L.; Pei, D. Evaluation and analysis on suitability of human settlement environment in Qingdao. PLoS ONE 2021, 16, e0256502. [Google Scholar] [CrossRef]
- Li, X.; Bai, Z.; Tian, S.; Yang, J.; Guo, Y. Human settlement assessment in Jinan from a facility resource perspective. SAGE Open 2020, 10, 1–16. [Google Scholar] [CrossRef]
- Zhu, Y.; Yao, X.; Chen, W.; He, Z.; Chen, L.; Yang, L.; Chen, S.; Chi, T. Evaluation of the quality of human settlement in downtown Fuzhou based on multi-source data. Chin. J. Appl. Ecol. 2020, 31, 2721–2730. [Google Scholar]
- Zheng, D.; Zhao, D. Characteristics of natural environment of the Tibetan Plateau. Sci. Technol. Rev. 2017, 35, 13–22. [Google Scholar]
- Xia, M.; Jia, K.; Zhao, W.; Liu, S.; Wei, X.; Wang, B. Spatio-temporal changes of ecological vulnerability across the Qinghai-Tibetan Plateau. Ecol. Indic. 2021, 123, 107274. [Google Scholar] [CrossRef]
- Xie, G.; Lu, C.; Leng, Y.; Zheng, D.; Li, S. Ecological Assets Valuation of the Tibetan Plateau. J. Nat. Resour. 2003, 18, 189–196. [Google Scholar]
- Li, W.; Li, P.; Feng, Z.; You, Z.; Xiao, C. Spatial Definition of “Unpopulated Areas (UPAs)” based on the Characteristics of Human Settlements in the Qinghai-Tibet Plateau, China. Acta Geogr. Sin. 2021, 76, 2118–2129. [Google Scholar]
- Cheng, S.; Shen, L. Approach to dynamic relationship between population, resources, environment and development of the Qinghai-Tibet Plateau. J. Nat. Resour. 2000, 15, 297–304. [Google Scholar]
- Gao, Q.; Miao, Y.; Song, J. Research progress on the sustainable development of Qinghai–Tibet Plateau. Geogr. Res. 2021, 40, 1–17. [Google Scholar]
- Zhang, Y.; Li, B.; Zheng, D. A discussion on the boundary and area of the Tibetan Plateau in China. Geogr. Res. 2002, 21, 1–8. [Google Scholar]
- Zhang, Y.; Li, B.; Liu, L.; Zheng, D. Redetermine the region and boundaries of Tibetan Plateau. Geogr. Res. 2021, 40, 1543–1553. [Google Scholar]
- Luo, J.; Chen, Q.; Liu, F.; Zhang, Y.; Zhou, Q. Methods for reconstructing historical cropland spatial distribution of the Yellow River-Huangshui River valley in Tibetan Plateau. Prog. Geogr. 2015, 34, 207–216. [Google Scholar]
- Song, F.; Yang, X.; Wu, F. Suitable Pattern of the Natural Environment of Human Settlements in the Lower Reaches of the Yangtze River. Atmosphere 2019, 10, 200. [Google Scholar] [CrossRef]
- Ma, R.F.; Wang, T.F.; Zhang, W.Z.; Yu, J.H.; Wang, D.; Chen, L.; Jiang, Y.P.; Feng, G.Q. Overview and progress of Chinese geographical human settlement research. J. Geogr. Sci. 2016, 26, 1159–1175. [Google Scholar] [CrossRef]
- Parikh, P.; Parikh, H.; McRobie, A. The role of infrastructure in improving human settlements. Proc. Inst. Civ. Eng.-Urban Des. Plan. 2013, 166, 101–118. [Google Scholar] [CrossRef] [Green Version]
- Zhu, B.; Ma, X. Quality Evaluation of Rural Human Settlements in Jiangsu Province based on Entropy Method. Yunnan Geogr. Environ. Res. 2011, 23, 44–51. [Google Scholar]
- Naversnik, K.; Jurecic, R. Humidity-corrected Arrhenius equation: The reference condition approach. Int. J. Pharm. 2016, 500, 360–365. [Google Scholar] [CrossRef]
- Du, T.; Xie, X.J.; Liang, H.Y.; Huang, A.; Han, Q.F. County economy comprehensive evaluation and spatial analysis in Chongqing city based on entropy weight-TOPSIS and GIS. Econ. Geogr. 2014, 34, 40–47. [Google Scholar]
- Ji, Z.; Xu, Y.; Wei, H. Identifying Dynamic Changes in Ecosystem Services Supply and Demand for Urban Sustainability: Insights from a Rapidly Urbanizing City in Central China. Sustainability 2020, 12, 3428. [Google Scholar] [CrossRef]
- Ji, Z.; Wei, H.; Xue, D.; Liu, M.; Cai, E.; Chen, W.; Feng, X.; Li, J.; Lu, J.; Guo, Y. Trade-Off and Projecting Effects of Land Use Change on Ecosystem Services under Different Policies Scenarios: A Case Study in Central China. Int. J. Environ. Res. Public Health 2021, 18, 3552. [Google Scholar] [CrossRef]
- Su, F.; Chu, Y.; Zhang, P. Analysis of economic vulnerability and obstacle factors of typical tourism cities in China. Econ. Geogr. 2013, 33, 189–194. [Google Scholar]
- Jin, F.; Wang, C.; Li, X.; Wang, J.E. China’s regional transport dominance: Density, proximity, and accessibility. J. Geogr. Sci. 2010, 20, 295–309. [Google Scholar] [CrossRef]
- Chen, Y.; Jin, F.; Lu, Y.; Chen, Z.; Yang, Y. Development history and accessibility evolution of land transportation network in Beijing-Tianjin-Hebei region over the past century. J. Geogr. Sci. 2018, 28, 1500–1518. [Google Scholar] [CrossRef]
- Gao, X.; Cao, X.; Li, T.; Lv, M. Evolution of accessibility spatial pattern of the Qinghai-Tibet Plateau in 1976-2016. Acta Geogr. Sin. 2019, 74, 1190–1204. [Google Scholar]
- Wang, Z.; Fan, H.; Wang, D.; Xing, T.; Wang, D.; Guo, Q.; Xiu, L. Spatial Pattern of Highway Transport Dominance in Qinghai–Tibet Plateau at the County Scale. ISPRS Int. J. Geo-Inf. 2021, 10, 304. [Google Scholar] [CrossRef]
- Wei, W.; Li, W.; Song, Y.; Xu, J.; Wang, W.; Liu, C. The Dynamic Analysis and Comparison of Emergy Ecological Footprint for the Qinghai–Tibet Plateau: A Case Study of Qinghai Province and Tibet. Sustainability 2019, 11, 5587. [Google Scholar] [CrossRef]
- Zhang, T.; Ding, B.Y.; Hu, Q.N.; Liu, Y.Y.; Zhou, D.; Gao, W.J.; Fukuda, H. Research on Regional System Planning Method of Rural Habitat in Gully Regions of the Loess Plateau, under the Background of Rural Vitalization Strategy in China. Sustainability 2020, 12, 3317. [Google Scholar] [CrossRef] [Green Version]
Publisher’s Note: MDPI stays neutral with regard to jurisdictional claims in published maps and institutional affiliations. |
© 2022 by the authors. Licensee MDPI, Basel, Switzerland. This article is an open access article distributed under the terms and conditions of the Creative Commons Attribution (CC BY) license (https://creativecommons.org/licenses/by/4.0/).