Article

Spatio-Temporal Characteristics and Influencing Factors of Basic Public Service Levels in the Yangtze River Delta Region, China

1
Center for Modern Chinese City Studies, East China Normal University, Shanghai 200062, China
2
School of Urban and Regional Science, East China Normal University, Shanghai 200241, China
*
Author to whom correspondence should be addressed.
Land 2022, 11(9), 1477; https://doi.org/10.3390/land11091477
Submission received: 27 July 2022 / Revised: 20 August 2022 / Accepted: 26 August 2022 / Published: 4 September 2022
(This article belongs to the Special Issue Supporting Assessment and Planning Processes for a Good Anthropocene)

Abstract

:
Basic public services are essential to ensure regional social equity and promote regional integrated development. As the Yangtze River Delta region (YRDR) is an example of integrated regional development in China, the integration of basic public services plays a crucial role in promoting regions’ integrated development. However, little studies provide evidence of the characteristics and influencing factors of basic public services in the YRDR. Taking the YRDR as the study area, this paper constructed a comprehensive evaluation index system for the basic public services level (BPSL) in the YRDR from 2010 to 2020. Then, it measured and analyzed its spatio-temporal dynamic evolution characteristics using entropy-weighted TOPSIS and exploratory spatial data analysis methods, as well as analyzed the spatio-temporal heterogeneity of its influencing factors using a geographically and temporally weighted regression model. The results show that: (1) The BPSL in the YRDR generally improved during the study period. There was a huge variation within and between provinces in the BPSL. Over time, the BPSL gradually transitions from unipolar polarization to multipolar differentiation and a flattening trend. (2) Spatial differentiation of the BPSL was evident, with a decreasing gradient from east to west with an inverted U-shape distribution in the north–south direction. The overall spatial circle structure was characterized as being high in the east and low in the west, high in the center, and low in the north and south, forming a spatial distribution pattern of high-level and higher-level grades mainly in Shanghai, southern Jiangsu, and northern Zhejiang. The global spatial correlation characteristics became increasingly significant with time, while the local spatial correlation showed the trend of “spatial club convergence”. (3) Various factors influenced the spatial and temporal evolution of the BPSL, including the urbanization level, the economic development level, the industrial structure level, the degree of external openness, the government action capacity, and the regional population size, each of which had evident spatial and temporal heterogeneity.

1. Introduction

The coordinated development of regional integration is essential for promoting China’s sustainable regional economic and social development. In order to guarantee people’s livelihood and civil rights and to achieve fairness and justice, basic public services are an efficient instrument to achieve coordinated regional development and to promote integrated regional development, reflecting people-oriented values and policy principles [1]. Additionally, the ultimate goal of regional integration is guaranteeing regional social equity, maintaining the regional development gap within a moderate range, ensuring that all people in the region have access to basic education, health care, social security, and other basic public services, and eliminating all labels of difference among different people and regions [2,3,4]. China’s Central Committee of the Communist Party of China and the State Council issued the “Outline of the Yangtze River Delta Regional Integrated Development Plan” in December 2019, which sought to facilitate the sharing of basic public services, build a platform for basic public services in the Yangtze River Delta region (YRDR), and enhance the integration of public services. In January 2022, the National Development and Reform Commission and 21 other departments jointly released the “14th Five-Year Plan for Public Services”, which emphasized the need to improve the institutional arrangements that facilitate the sharing of public services in urban agglomerations and to promote major urban agglomerations such as the Yangtze River Delta to lead in providing basic public services to residents. Considering that the YRDR is the pioneer region for integrated regional development in China, improving the basic public services level (BPSL) becomes a vital path to promote regional integration in the YRDR and improve public service planning.
A public goods theory provides a theoretical basis and guidance for basic public services research. As early as the 18th century, Adam Smith argued that the state has a responsibility to provide fair public services to citizens [5]. Samuelson defined a public good as “one which all enjoy in common in the sense that each individual’s consumption of such a good leads to no subtraction from any other individual’s consumption of that good” [6]. As public goods are non-exclusive and non-competitive, these qualities have become an essential theoretical basis for determining whether a product can be considered public. From a Marxist perspective, public goods have been examined from holistic and supply aspects [7], it has been believed that the means of production are the basic guarantee of social progress and productivity is the determining force of social advancement. As a result, productivity plays a crucial role in determining the output of the total social product and the demand for social goods in society. In other words, at the low-productivity stage, public goods are mainly concerned with maintaining the most basic needs of life. When the degree of social productivity development reaches a certain level, the common needs of society also expand, along with the more and more diversified means of supplying public goods and services [8]. Additionally, the public goods theory provides a basis for defining “basic public services” and building the index system, functioning as a referent for explaining spatial variation in the BPSL.
Studies of public services originate from economics and fiscal science, in which the research focus is mainly on fiscal reform [9], management systems [10], and social governance [11]. Previous studies have focused on a particular area of public service [12,13,14,15,16], minority or special groups [17,18], the accessibility of public services [19,20], and public service motivations [21,22,23,24]. For example, Mhlanga et al. investigated the racial differences in demand for public health care in South Africa [12]. Simson examined the issue of racial equality in public services [17]. Osborne et al. examined the framework for sustainable public services and public service organizations [25]. Vandenabeele et al. discussed the history, present, and future directions of research on public service motivation [22,23]. Berman et al. examined the process of allocating public services to different types of people and the problems and contradictions involved [26].
“Basic public service” is a particular term widely used by Chinese scholars. Unlike developed countries, China has still been undergoing rapid urbanization, with gradual but prominent unbalanced development and more significant regional differences in public services. The integration of basic public services has become an essential means of regional integration, especially in pioneer areas such as the YRDR. Thus, exploring basic public services can enhance our understanding of coordinated regional development, with the notion that improving basic public services can help narrow the development gap between regions and thus promote coordinated regional development. Among them, relevant research topics include quantitative measurement and the spatial differentiation of basic public service levels [27,28,29,30], equalization of basic public service levels [31,32,33,34,35], accessibility of basic public service levels [36], and the interaction between the basic public service level and urbanization [37,38,39,40] and between the basic public service level and socio-economic development [41,42,43]. There have also been studies focusing specifically on basic education [44,45], health care [46,47], social security [48], and other specific basic public services. As for the research scales, the BPSL and its spatial pattern have been mostly studied at the national scale [28,32,33], regional scale [30,49], and provincial scale [27,29,50,51,52], which has accumulated empirical research results for this study. As for the research methods, most studies have been conducted to quantitatively measure the level and efficiency of basic public services by using the entropy-weighted method [27,32], set-pair analysis [53], and TOPSIS [54] to examine the spatial patterns using the coefficient of variation [29] and spatial autocorrelation analysis [50], and to investigate the spatial patterns by using spatial econometric models [51], geodetector [55], and other methods. Additionally, some new topics, regions, and perspectives have emerged in the research on basic public services in recent years. For example, Zhao Lin et al. proposed the concept of the basic public service mismatch degree and conducted an empirical analysis usingnortheast China [30], Han Zenglin et al. explored the spatio-temporal characteristics of basic public service equalization in Chinese island counties [53], Yin Peng et al. investigated the spatio-temporal coupling relationship between basic public service efficiency and urbanization quality [56], and Wang et al. examined the spatio-temporal dynamic characteristics of basic public service levels in the Beijing–Tianjin–Hebei region from the perspective of COVID-19 [57], which opened up new opportunities for research on basic public services.
To summarize, the existing studies have strengthened the research connotation and methodological system of basic public services and laid the foundation for this paper and future research, but there still is a need for further investigation. Firstly, most studies have been concerned with portraying the BPSL at the national and provincial scales, while little attention has been given to basic public services from a cross-regional perspective, especially for integrated regions such as the YRDR. Secondly, few studies have applied newer research methods, such as entropy-weighted TOPSIS and geographically and temporally weighted regression, to study basic public services. Thirdly, most existing studies have examined the factors affecting the level of basic public services from a static perspective rather than a dynamic perspective over time, so it is necessary to explore this issue in more depth.
Based on these, this paper identifies the BPSL as an essential indicator of regional integrated development from the perspective of the integration of the Yangtze River Delta region, combines public service planning strategies, comprehensively constructs an evaluation index system for the BPSL within the YRDR, and quantitatively measures the BPSL within the YRDR from 2010 to 2020 using the entropy-weighted TOPSIS method. The second step is to examine the spatio-temporal dynamic evolution characteristics of the BPSL using exploratory spatial data analysis methods and spatial econometric analysis methods. Lastly, a spatially and temporally weighted regression model is introduced to investigate the factors influencing the evolution of the BPSL and their change processes in the YRDR with regards to spatio-temporal heterogeneity and dynamicity. In this study, we aim to provide a reference for improving the BPSL in the YRDR, promoting the integration of basic public services in the YRDR, and facilitating the development of regional integration in the YRDR.

2. Materials and Methods
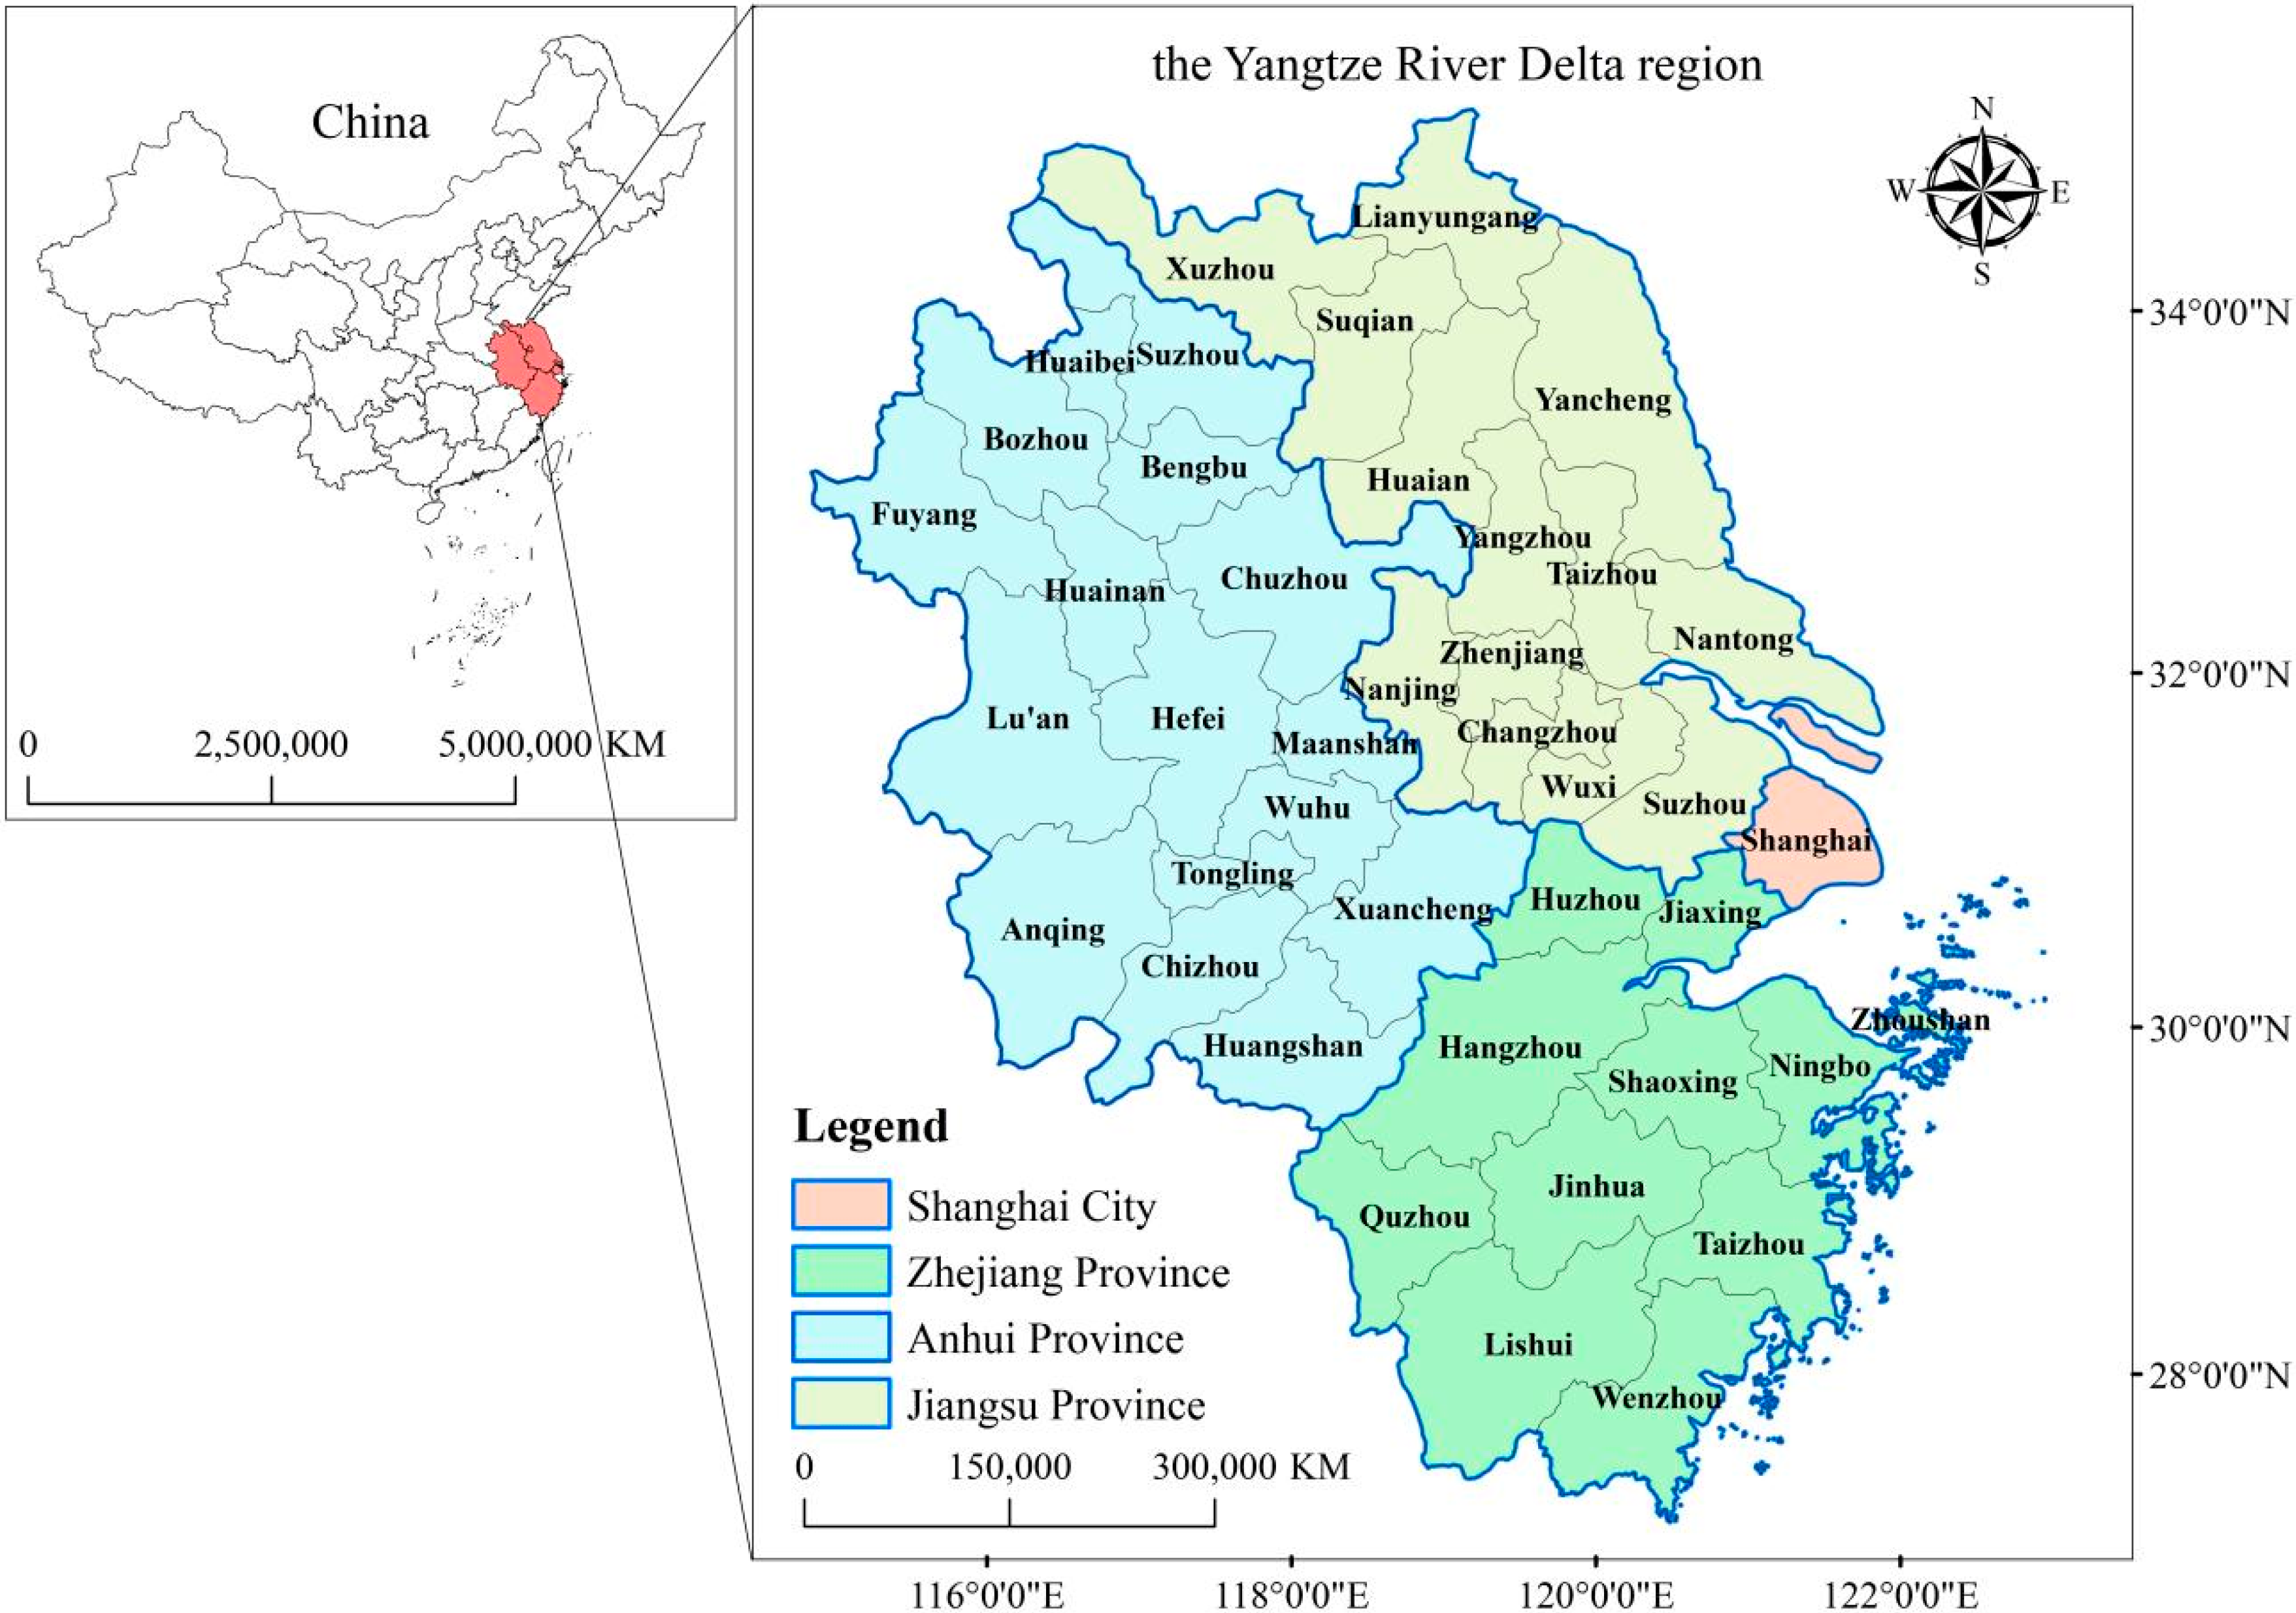
2.1. Study Area

The YRDR is located in East China, encompassing four provincial administrative units of Shanghai, Jiangsu, Zhejiang, and Anhui, with a total of 41 prefecture-level cities or municipalities directly under the central government (Figure 1), covering a total area of 358,000 km2. This area is the “T” intersection of the horizontal development strategy of the Yangtze River Economic Belt and the vertical development strategy of the coastal economic axis. In recent years, the YRDR has achieved remarkable achievements in basic public services due to its continuous regional social and economic development and the gradual promotion of regional coordination. For example, a cross-regional collaborative education group and a city hospital cooperative development alliance have been established, a consultative and collaborative mechanism for elderly care services has been preliminarily set up, and cross-regional social security facilitation has been significantly improved. As a result of these initiatives, the basic public service system in the YRDR has gradually improved, making it an ideal area for studying the evolution of basic public services. In addition, based on the analysis of the Yangtze River Delta integration policies, the “Regional Planning of Yangtze River Delta” proposed in 2010 established specific development goals for the synergistic development of the YRDR in nine aspects, including urban–rural integration, industrial layout, public services, and infrastructure construction, which serves as a programmatic document for the development of the YRDR from 2010 to 2020 and provides a solid foundation for developing relevant plans [58]. Considering the availability of relevant data and excluding the influence of time, this study uses 2010 as the research time base to examine the spatial and temporal evolution of the BPSL in the YRDR from 2010 to 2020 and analyze its influence mechanisms dynamically.

2.2. Indicator System and Data Sources

Based on the requirements of the “National Basic Public Service Standards (2021 Edition)” and the “14th Five-Year Plan for Public Services”, as well as current research results [29,30,32,50,51,52,53,59,60], and taking into account the rationality, representativeness, and accessibility of data, we developed the BPSL evaluation index system in the YRDR. It is composed of seven dimensions, including basic education services, medical and health services, social security services, public culture services, information and communication services, ecological and environmental services, and infrastructure services. There are 30 specific indicators in this study, including the number of general primary and secondary schools per 10,000 people, the number of hospitals per 10,000 people, and the number of unemployment insurance participants per 10,000 people (Table 1).
Vector spatial data, such as administrative divisions and base maps of the YRDR involved in the study, were obtained from the standard map service website of the National Bureau of Surveying, Mapping, and Geographic Information (http://bzdt.ch.mnr.gov.cn/browse.html?picId=%224o28b0625501ad13015501ad2bfc0421%22, accessed on 15 March 2022). As far as socio-economic development data are concerned, they were obtained from the “China Urban Statistical Yearbook” (https://data.cnki.net/yearbook/Single/N2022040095, accessed on 15 March 2022), the “China Urban Construction Statistical Yearbook” (https://data.cnki.net/yearbook/Single/N2021110010, accessed on 15 March 2022), the “China Regional Economic Statistical Yearbook” (https://data.cnki.net/yearbook/Single/N2015070200, accessed on 15 March 2022), and the statistical yearbooks (https://tjj.sh.gov.cn/tjnj/20220309/0e01088a76754b448de6d608c42dad0f.html, http://tj.jiangsu.gov.cn/2021/indexc.htm, http://tjj.zj.gov.cn/col/col1525563/index.html, http://tjj.ah.gov.cn/ssah/qwfbjd/tjnj/index.html, accessed on 15 March 2022) and national economic and social development statistical bulletins (http://www.tjcn.org/tjgbsy/nd/36944.html, accessed on 15 March 2022) of the provinces and cities in the YRDR in the corresponding years, and any missing data were supplemented by the method of interpolation.

2.3. Methods

2.3.1. Entropy-Weighted TOPSIS Method

The entropy-weighted method is an objective method of assigning weights based on the degree of variability in the values of each evaluation index as a measure of information. The entropy-weighted method is appropriate for evaluating objective data and diverse and comprehensive indicators, which could eliminate the subjectivity issues of the Delphi method and the repetitive nature of attributes caused by excessive indicators in complex giant systems [61].
The Technique for Order Preference by Similarity to Ideal Solution (TOPSIS) method was proposed by Hwang and Yoon in 1981 [62] and is also referred as the “ranking method of approximating ideal solutions”. This method is based on the concept of ranking preferences by calculating the relative distances between alternative solutions and positive and negative ideal solutions. It is neither restrained by special requirements for the sample amount nor influenced by interference from the reference, and is superior in intuitive geometric meaning, low distortion, flexible operation, and wide application.
The entropy-weighted TOPSIS method improves upon the TOPSIS method, combining the entropy-weighted method and the TOPSIS method. The entropy-weighted TOPSIS method combines the objective assignment of the entropy-weighted method and the multi-objective effective decision making of the TOPSIS method, which avoids the influence of extreme values for the number of samples, increases the objectivity of the TOPSIS method assignment, and eliminates the limitation that the TOPSIS method cannot be ranked [63,64]. Thus, this paper adopts the entropy-weighted TOPSIS method for a more comprehensive evaluation of the BPSL. Following are the steps involved in the calculation.
  • Construct the evaluation index system matrix (M).
Assuming that there are m evaluated objects and n indicators for each evaluated object, the evaluation indicator system matrix is:
M = ( x i j ) m × n     ( i = 1 , 2 , , m ; j = 1 , 2 , , n )
where: i is the evaluated object; j is the evaluation index.
2.
The index matrix was standardized using the polar difference method.
R = ( r i j ) m × n     ( i = 1 , 2 , , m ; j = 1 , 2 , , n )
where: R is the standardized evaluation index system matrix; r i j is the standard value of the ith evaluated object on the jth evaluation index; m is the total number of evaluation objects; n is the total number of evaluation indexes.
3.
Calculate the entropy value.
E j = k i m p i j ln p i j
where: E j is the entropy value; k is the constant term, k = 1 / ln m ; p i j = r i j / i = 1 m r i j , is the weight of the index value under the jth evaluation index of the ith evaluated object of the matrix Y.
4.
Determination of indicator weights.
w j = 1 E j j = 1 n ( 1 E j )
where: w j is the weight of indicator j; E j is the entropy value of indicator j.
5.
Calculate the normalized entropy weight matrix (O).
O = ( o i j ) m × n , o i j = w j r i j     ( i = 1 , 2 , , m ; j = 1 , 2 , , n )
where: o i j is the value of the ith evaluated object after the jth evaluated index is normalized.
6.
Determine the positive ideal solution and the negative ideal solution.
Y + = max { ( y i j | i = 1 , 2 , , m ) } ( j = 1 , 2 , , n ) = { y 1 + , y 2 + , , y n + } Y = min { ( y i j | i = 1 , 2 , , m ) } ( j = 1 , 2 , , n ) = { y 1 , y 2 , , y n }
where: Y + denotes the maximum value of the jth indicator in year i, and Y + is the positive ideal solution, i.e., the most ideal solution to choose; Y denotes the minimum value of the jth indicator in year i, and Y is the negative ideal solution, i.e., the worst solution.
7.
Calculate the distance of each indicator to the positive ideal solution and the negative ideal solution.
D j + = i = 1 m ( y j + y i j ) 2 ; D j = i = 1 m ( y j y i j ) 2
where: D j + denotes the distance between the jth indicator and y j + ; D j denotes the distance between the jth indicator and y j .
8.
Calculate the comprehensive evaluation index.
C j = D j D j + + D j
where: C j ∈ [0, 1], which can reflect the stability state of the evaluation object reflected by the two distance indicators of D j + and D j comprehensively. The larger the value of C j , the closer the evaluation object is to the ideal solution and the higher the BPSL.

2.3.2. Exploratory Spatial Data Analysis

Exploratory Spatial Data Analysis (ESDA) is a method for describing and visualizing the spatial distribution pattern of data and identifying clustering and anomalies of spatial data [65]. It is widely used in geographic research and mainly involves global spatial autocorrelation and local spatial autocorrelation [66].
Generally, global spatial autocorrelation is used to identify the spatial correlation characteristics of a study object by determining whether there is statistical clustering or dispersion in the distribution of the attribute data of the elements, which is usually expressed by Moran’s I. An autocorrelation of local area units in a nearby space is usually expressed as Local Moran’s I. The calculation formula is as follows.
M o r a n s   I = n i n j n w i j ( y i y ¯ ) ( y j y ¯ ) i n j n w i j i n ( y j y ¯ ) 2
L o c a l   M o r a n s   I = z i i w i j z j     ( z i = y i y ¯ ; z j = y j y ¯ )
where: n is the total number of spatial units in the study area; y i and y j denote the attribute values within spatial units i and j; y ¯ is the mean of the attribute values; z i and z j are the normalized values of the observations of spatial units i and j, respectively; w i j is the spatial weight matrix. Moran’s I ∈ [−1, 1], Moran’s I > 0 indicates a positive spatial correlation, Moran’s I < 0 indicates a negative spatial correlation, and Moran’s I = 0 indicates the absence of spatial correlation. Local Moran’s I > 0 indicates that areas with the same element attribute values are nearby, while Local Moran’s I < 0 indicates that areas with different element attribute values are nearby.

2.3.3. Geographically and Temporally Weighted Regression

A valuable tool for studying spatial heterogeneity is the Geographically Weighted Regression (GWR) model developed by Brunsdon et al. [67]. This model can be used to estimate the degree of influence of drivers on different regions. However, this model does not examine the temporal dimension and only considers the spatial dimension. As an extension of the GWR model, Huang et al. [68] proposed the Geographically and Temporally Weighted Regression (GTWR) model, which adds the temporal component to the GWR model. The traditional GWR model does not include the time dimension, with fixed spatial coordinates of the analyzed object. However, the GTWR model requires different spatial coordinates at different time stages of analysis object [69,70], which can accurately reflect the spatio-temporal non-stationarity of the change of the studied object. Given this, this paper adopts the GTWR model to analyze the spatio-temporal heterogeneity of the drivers of the BPSL. The model’s expression is as follows.
Y i = β 0 ( u i , v i , t i ) + k = 1 p β k ( u i , v i , t i ) X i k + ε i     ( i = 1 , 2 , , n )
where: Y is the explained variable; X is the explanatory variable; i is the sample region; u and v are the latitude and longitude of the sample region; t is the time; β 0 ( u i , v i , t i ) is the intercept; β k ( u i , v i , t i ) is the estimated coefficient; k is the explanatory variable ordinal number; p is the total number of explanatory variables; β > 0 is the positive correlation between the explanatory variable and the explained variable, and the opposite is the negative correlation; ε i is the residual of the model function.

3. Spatial and Temporal Evolutionary Characteristics of the BPSL

3.1. Analysis of Temporal Evolution Characteristics

3.1.1. Analysis of Overall Level Change

To analyze the time change characteristics of the BPSL in the YRDR from 2010 to 2020, we used the entropy-weighted TOPSIS method to measure the BPSL in the YRDR from 2010 to 2020 (Table 2 and Figure 2). Limited by the length of the paper, only four representative years, 2010, 2013, 2016, and 2020, are selected for presentation. Table 2 and Figure 2 indicated that the BPSL in the YRDR has been improving year by year, and the average value of the BPSL for 41 cities increased from 0.190 in 2010 to 0.275 in 2020. The average annual growth rate of Zhejiang Province and Jiangsu Province is comparable, at 0.049% and 0.048%, respectively, followed by Shanghai with an average annual growth rate of 0.036% and Anhui Province with a 0.018% growth rate. The average annual growth rate of the BPSL in 41 cities is 0.038%, which is a relatively fast growth rate overall.

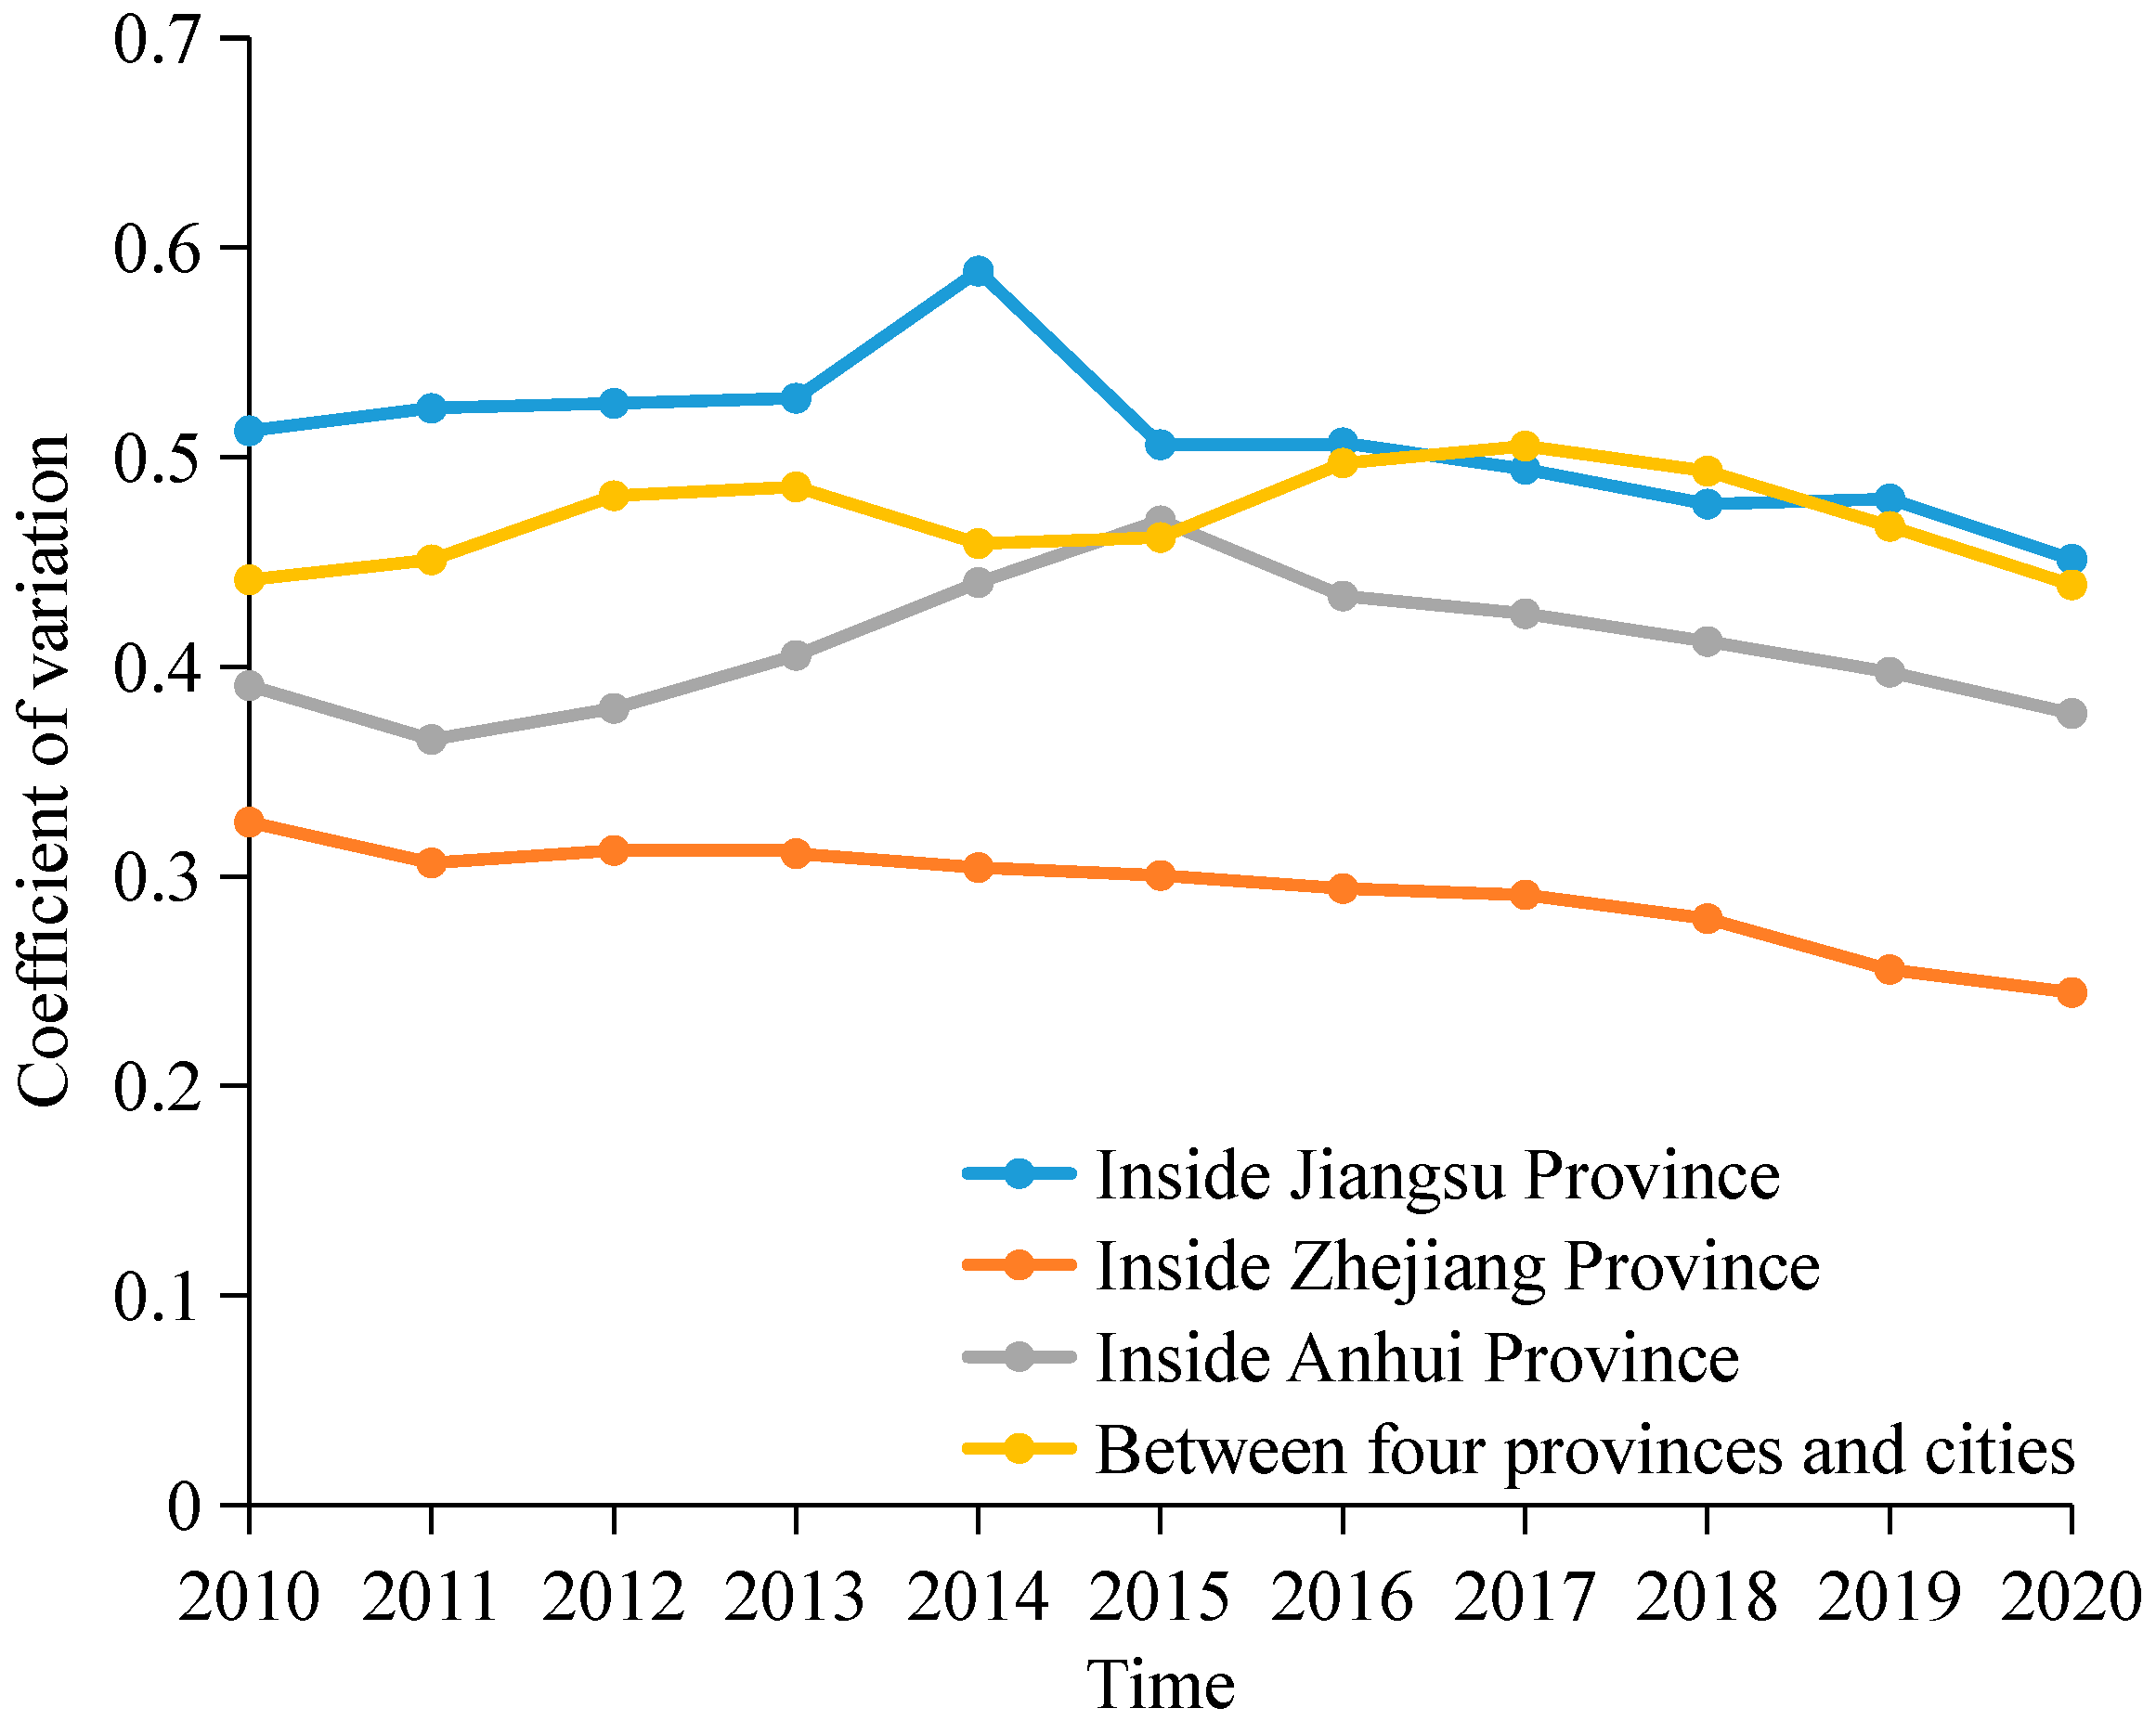
3.1.2. Analysis of Internal Variation Change

In terms of the coefficient of variation, intra-provincial and inter-provincial variations are quite different (Figure 3). Regarding intra-provincial differences, Jiangsu province shows the most significant variation, with a mean coefficient of variation of 0.509, peaking at 0.589 in 2014 and slowly declining after that, followed by Anhui province, with a mean coefficient of variation of 0.409; intra-provincial variation tends to increase first and then decrease, peaking at 0.470 in 2015 and then decreasing gradually thereafter. In Zhejiang Province, the coefficient of variation decreased from 0.326 in 2010 to 0.244 in 2020, with a mean value of 0.293, indicating that BPSL is relatively equal among municipalities. Regarding inter-provincial differences, the average BPSL between the four provinces and cities in the YRDR reveals an “M”-shaped trend with an “increasing–decreasing” pattern twice, with two peaks appearing in 2013 and 2017, respectively. It is noteworthy that the coefficient of variation of the BPSL among the four provinces and cities rapidly decreased from 0.505 to 0.439 between 2017 and 2020, and the inter-provincial differences in the BPSL significantly decreased, resulting from the promulgation and implementation of the “Yangtze River Delta Urban Agglomeration Development Plan” in 2016, which accelerated the integration of Anhui Province into the YRDR. Meanwhile, the “Outline of the Yangtze River Delta Regional Integrated Development Plan” in 2019 explicitly proposes the universal sharing of public services and other areas, which accelerates the integration of the YRDR and contributes to the narrowing of the BPSL gap between the four provinces and cities in the YRDR.

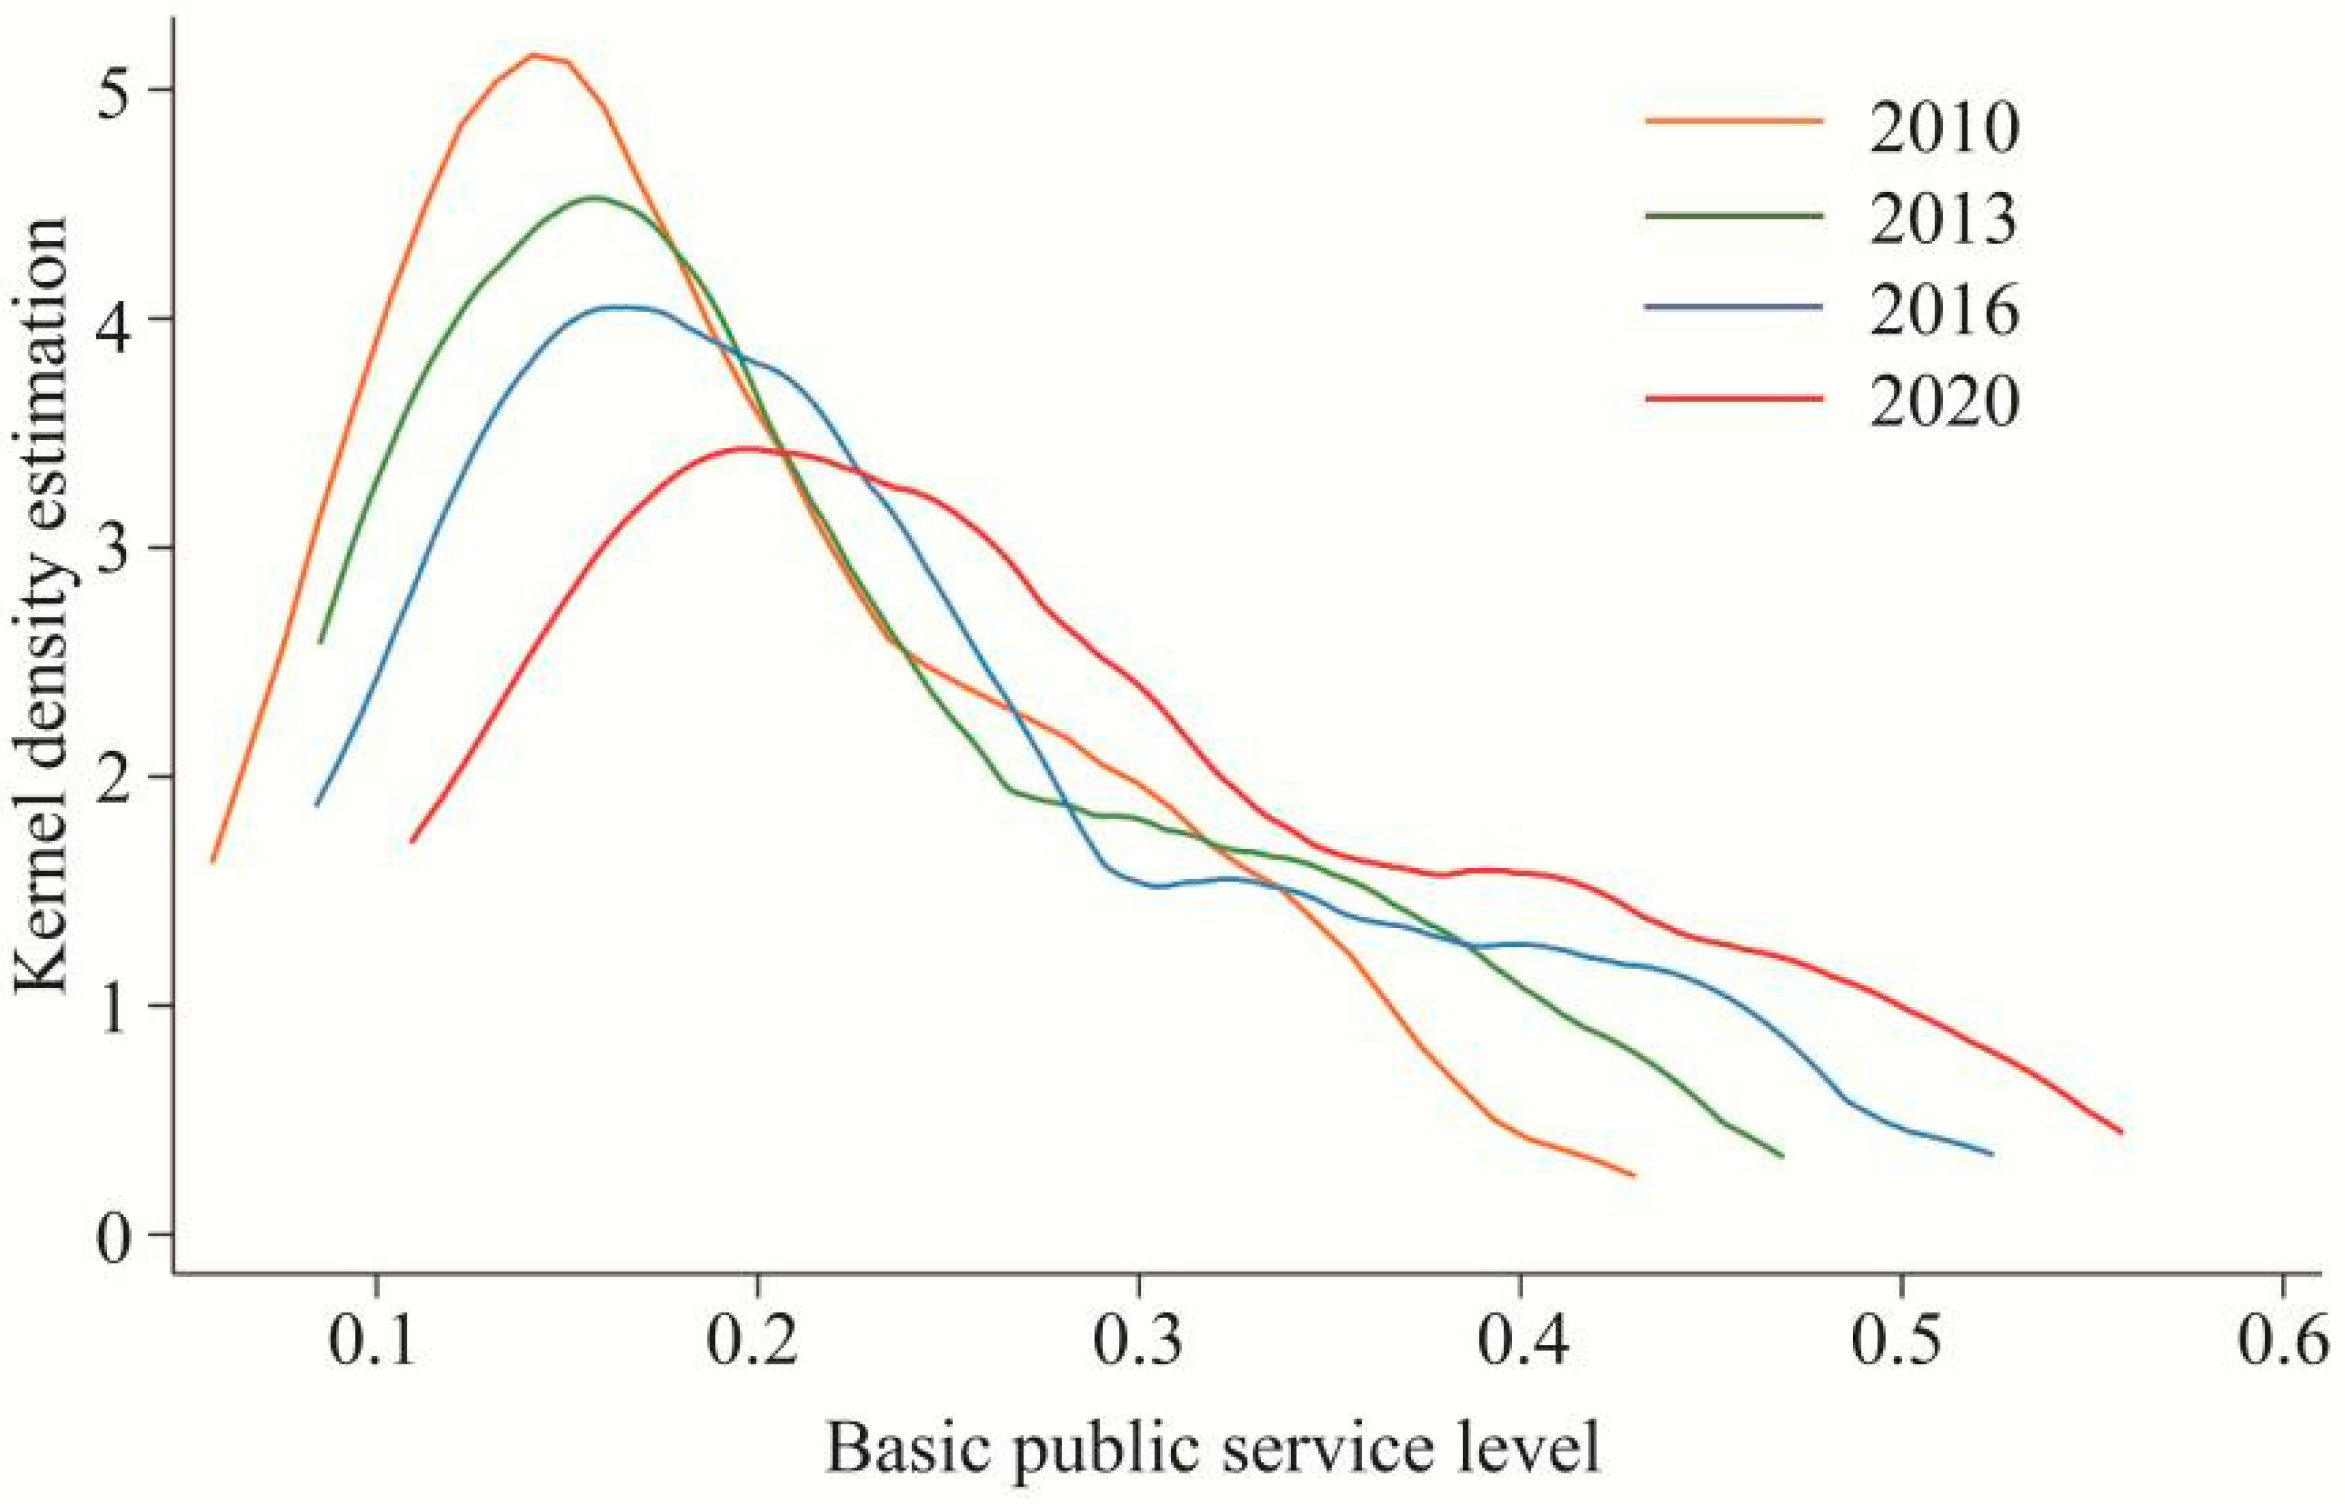
3.1.3. Analysis of Time-Series Evolution Laws

Combined with the measurements in Table 2, the kernel density curve is used to examine changes in the overall distribution shape, peak location, and extensibility of the BPSL in the YRDR, and to describe the temporal evolution pattern of the BPSL (Figure 4). In terms of shape, the kernel density curve evolves from a single peak to a slightly multi-peaked peak between 2010 and 2020, indicating that the BPSL in the YRDR moves from unipolar polarization to multipolar differentiation with a flattening trend. Considering kurtosis, the overall height of the primary wave peak shows a continuous downward trend, with the highest and lowest values in 2010 and 2020, respectively, indicating that the spatial polarization effect of the BPSL in the YRDR gradually decreases, and the diffusion effect gradually increases. The reason is that under the effective guidance of the Yangtze River Delta regional integrated development policy and basic public service development plan, the differences between the regional BPSL gradually narrow and the degree of integration gradually increases. In terms of position and extension, as the vertical height of the kernel density curve crest decreases, the right trailing tail becomes significantly longer, and the waveform shifts to the right, indicating that the BPSL in the YRDR is improving. This is mainly due to the guiding effect of the “12th Five-Year Plan of the National Basic Public Service System”, the “13th Five-Year Plan to Promote Equalization of Basic Public Services”, and the basic public service policies in each region, each being guiding factors. Moreover, the BPSL in the YRDR has been continuously improved due to increased investments in education and health care resources, increased access to social security, improved public culture and infrastructure, improved information and communication services, and the continuous improvement of the ecological environment in each city.

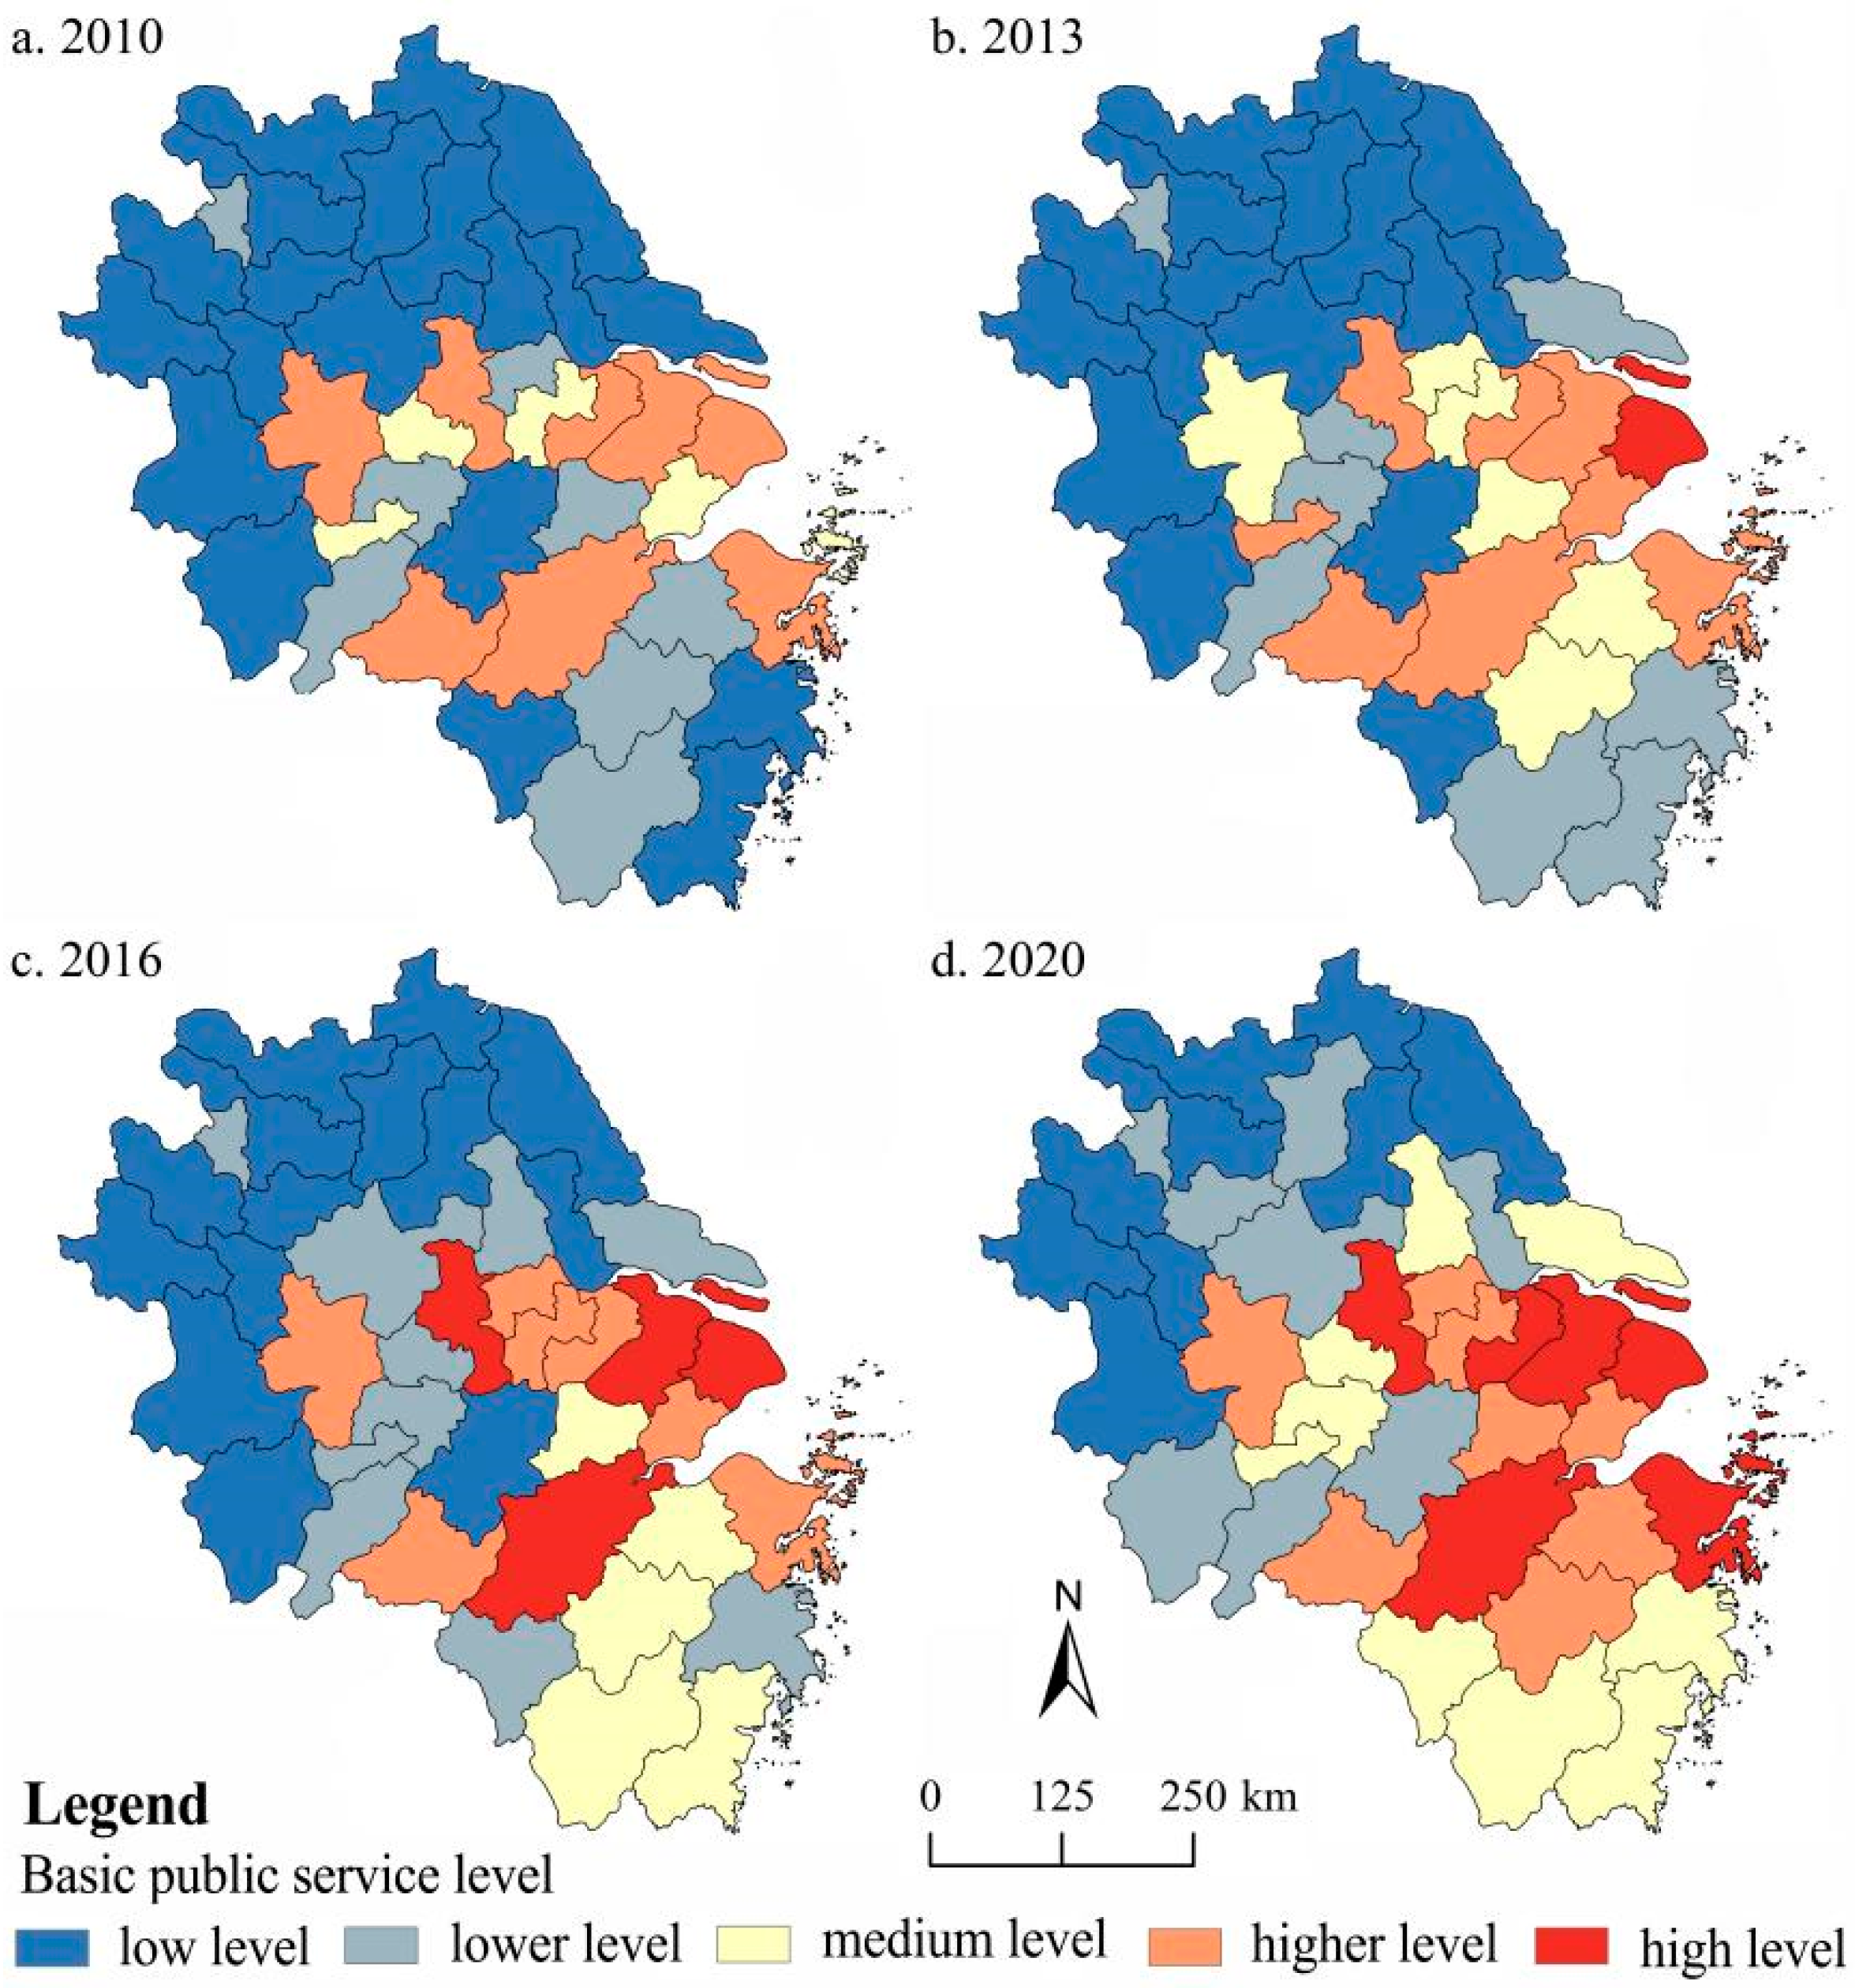
3.2. Analysis of Spatial Evolution Characteristics

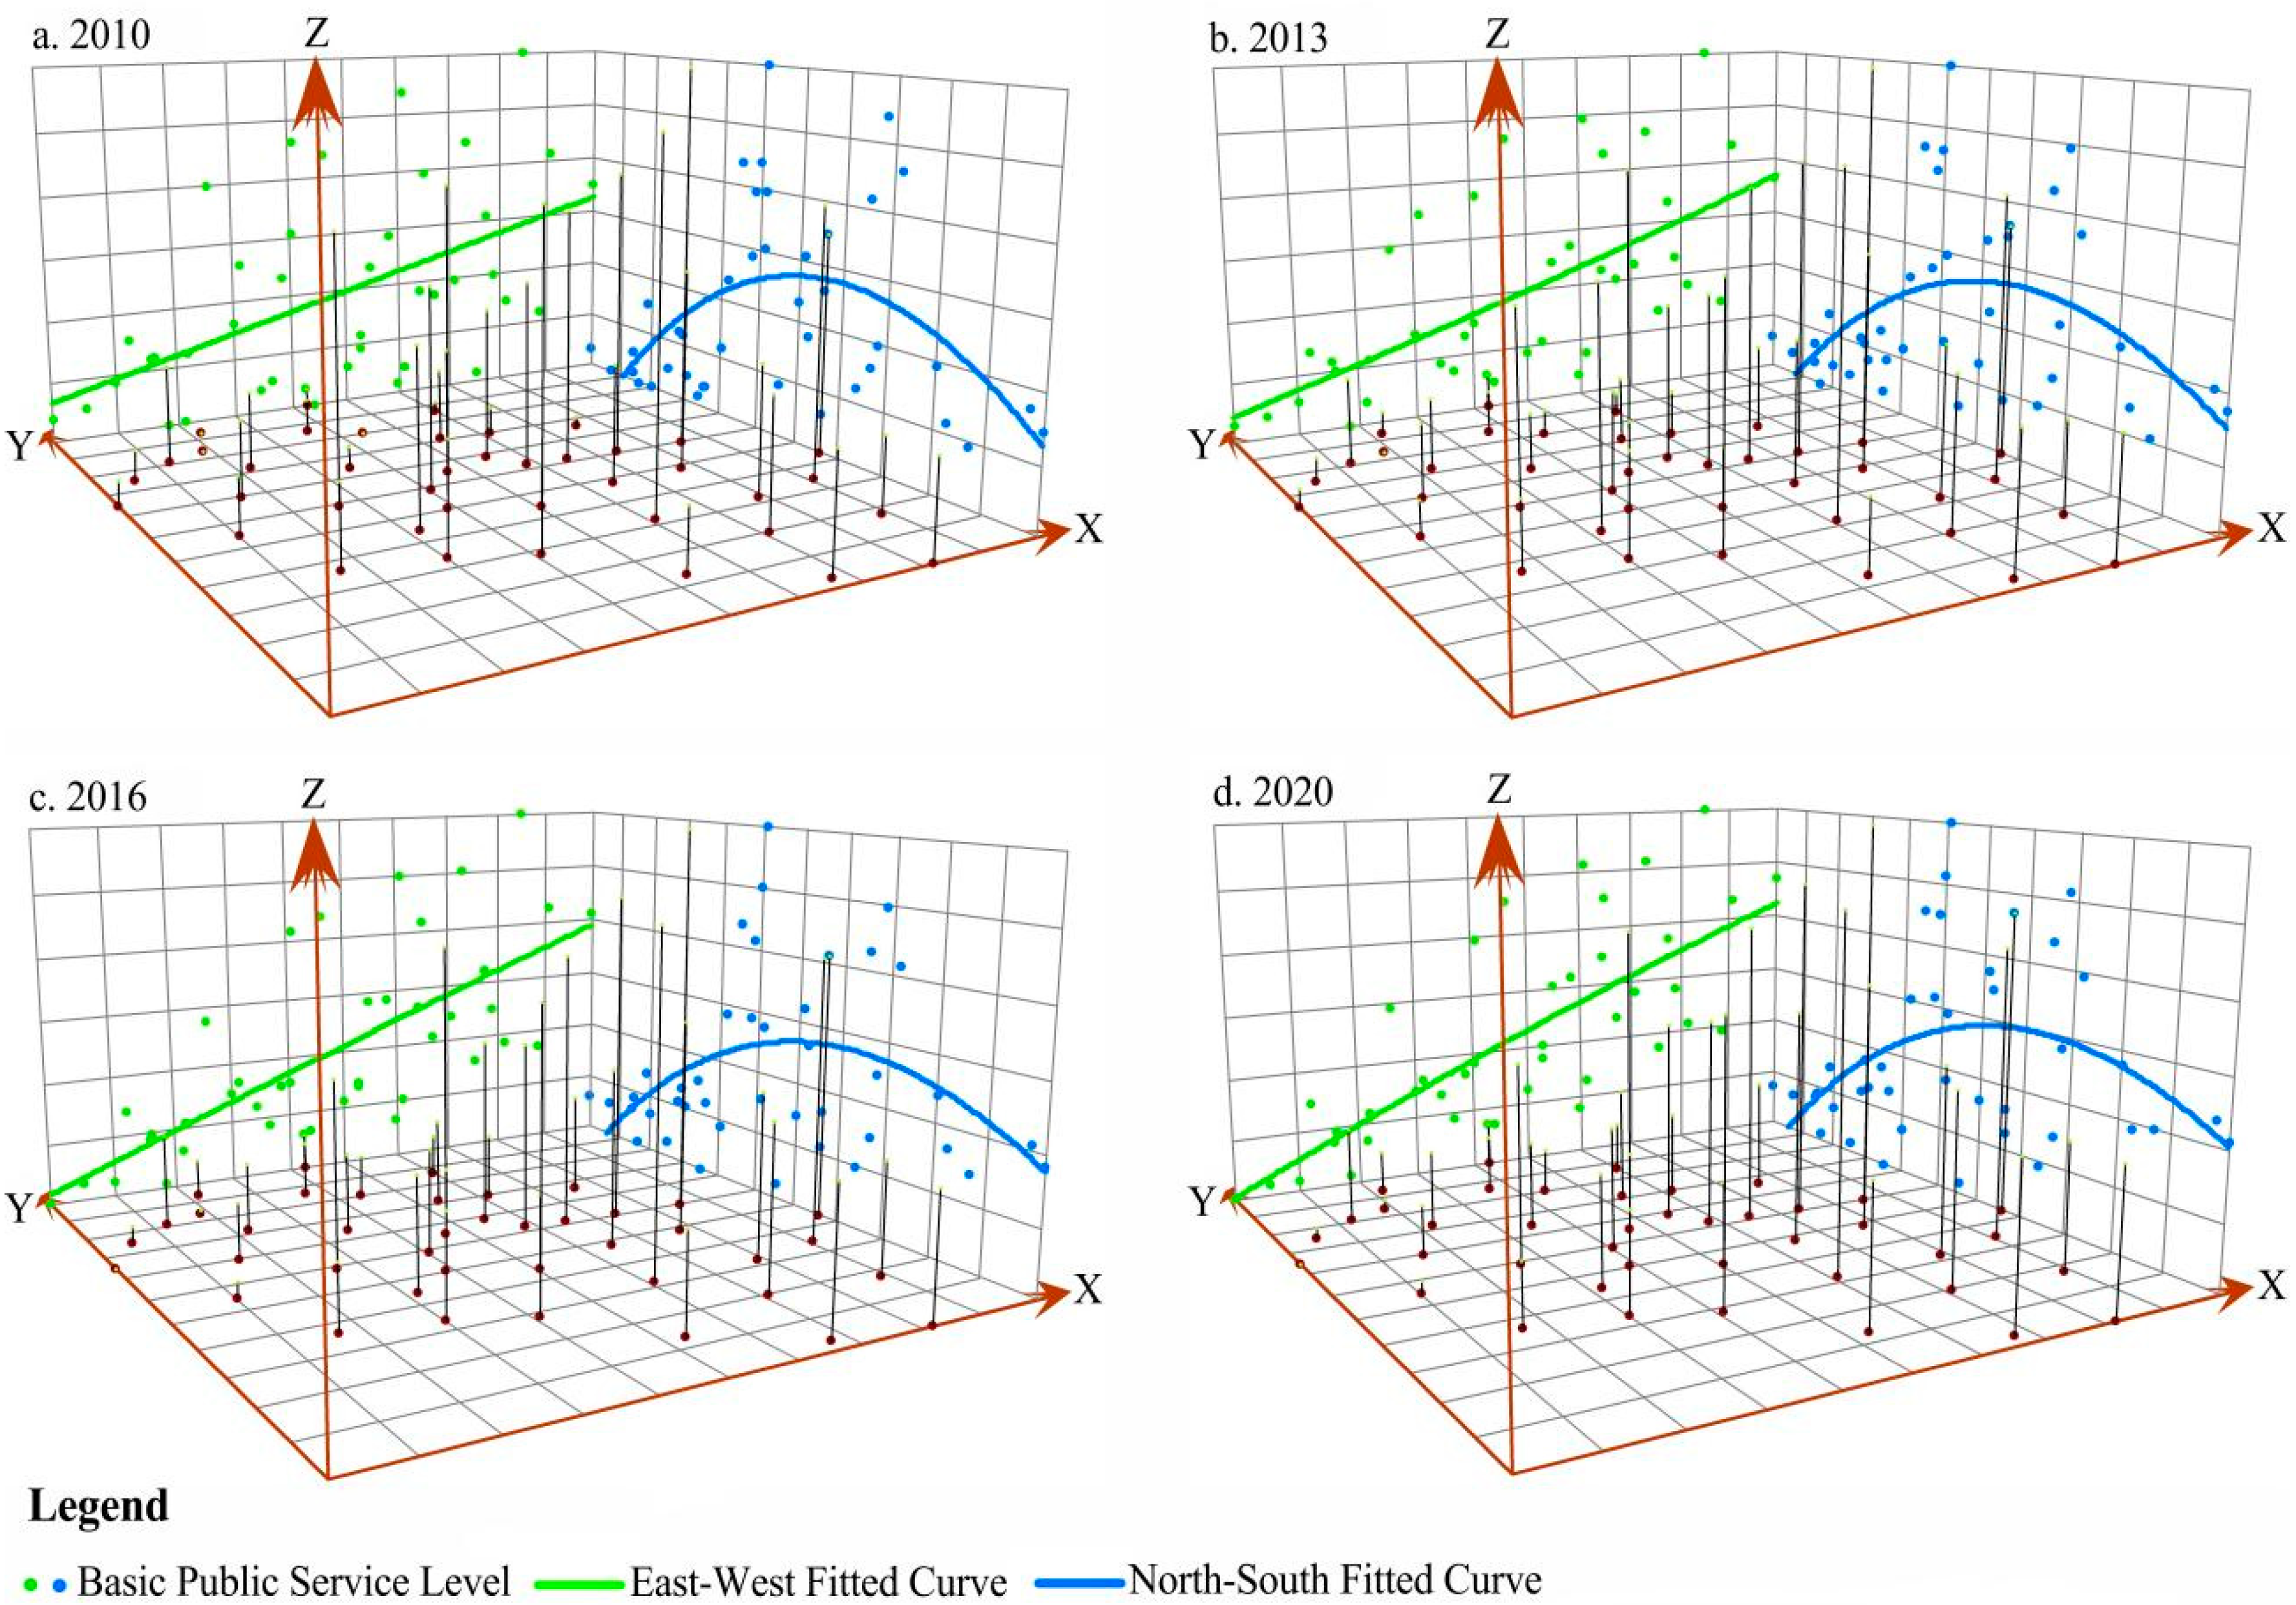
3.2.1. Spatial Trend Analysis

As the spatial differences of the BPSL in the YRDR are significant, it is necessary to analyze the trend surface. By using the ArcGIS platform, the attribute values of the BPSL in the YRDR were visualized by 3D spatial fitting, resulting in the spatial trend surface, where the Z-axis represents the attribute values of the BPSL, while the X-axis and Y-axis represent the due east and due north directions, respectively (Figure 5).
Regarding the general trend of the BPSL, the spatial divergence of the BPSL in the YRDR from 2010 to 2020 is evident, with a gradient of decreasing from east to west with increasing geographical distance, and an inverted “U” shape distribution in the north–south direction. Specifically, the BPSL in the YRDR shows a decreasing trend from east to west with increasing geographical distance, meaning that the BPSL in Jiangsu, Zhejiang, and Shanghai gradually decreases to that of the Anhui region, and the BPSL in the east is significantly higher than that in the west. Additionally, the slope of the fitted curve is more significant in the east–west direction than in the north –south direction, suggesting that the east–west direction is the main direction of divergence in the BPSL in the YRDR. In the north–south direction, the BPSL exhibits an inverted “U” pattern, indicating transitions from northern Anhui and northern Jiangsu to central Anhui, central Jiangsu, southern Jiangsu, and Shanghai, gradually transitioning southward to southern Anhui and southern Zhejiang. Among them, the highest attribute values of the BPSL are found in the valley of the inverted “U” shape in the southern Jiangsu, Shanghai, and northeastern Zhejiang regions, showing a spatial locking effect, thus indicating that these regions are the dominant regions in the YRDR, where the BPSL is highly developed.

3.2.2. Spatial Pattern Analysis

By analyzing the temporal evolution characteristics, four time nodes of 2010, 2013, 2016, and 2020 were chosen to spatially visualize the BPSL for each city within the YRDR, using the natural breakpoint method to classify the BPSL into five levels—low level, lower level, medium level, higher level, and high level—and to map the spatial distribution of BPSL in the YRDR from 2010 to 2020 using ArcGIS software (Figure 6). The BPSL shows a spatial circle structure with highs in the east, lows in the west, highs in the center, and lows in the north and south. The high-level and higher-level areas are mainly concentrated in Shanghai, southern Jiangsu, northern Zhejiang, and Hefei, and gradually migrate to the peripheral areas. The low-level and lower-level areas are primarily concentrated in peripheral circles, such as northern Jiangsu, northern Anhui, and part of southern Anhui. The medium-level areas are mainly located in the vicinity of the high-level and higher-level areas, and serve as a buffer zone between the low-level and lower-level areas.
Specifically, in 2010, the BPSL was relatively low in general, with no high-level cities distributed, and the higher-level areas were mainly municipalities directly under the central government, provincial capitals, and economically developed cities such as Suzhou, Wuxi, and Ningbo. In 2013, Shanghai was promoted to the high-level grade, Jiaxing, Zhoushan, and Tongling were promoted from the medium level to the higher level, and the number of medium-level cities decreased. In 2016, Nanjing, Suzhou, and Hangzhou were promoted from the higher level to the high level, Hefei, Zhenjiang, and Changzhou were promoted from the medium level to the high level, and the rest had relatively minor changes. In 2020, Wuxi, Ningbo, and Zhoushan were promoted to the high level, and Huzhou, Shaoxing, and Jinhua were promoted from the medium level to the high level. So far, the BPSL in the YRDR has formed a spatial distribution pattern of higher-level and high-level cities, primarily in Shanghai, southern Jiangsu, and northern Zhejiang, with the number of high-level, higher-level, and medium-level cities increasing, and low-level and lower-level cities decreasing, indicating that the BPSL in each city is gradually improving.

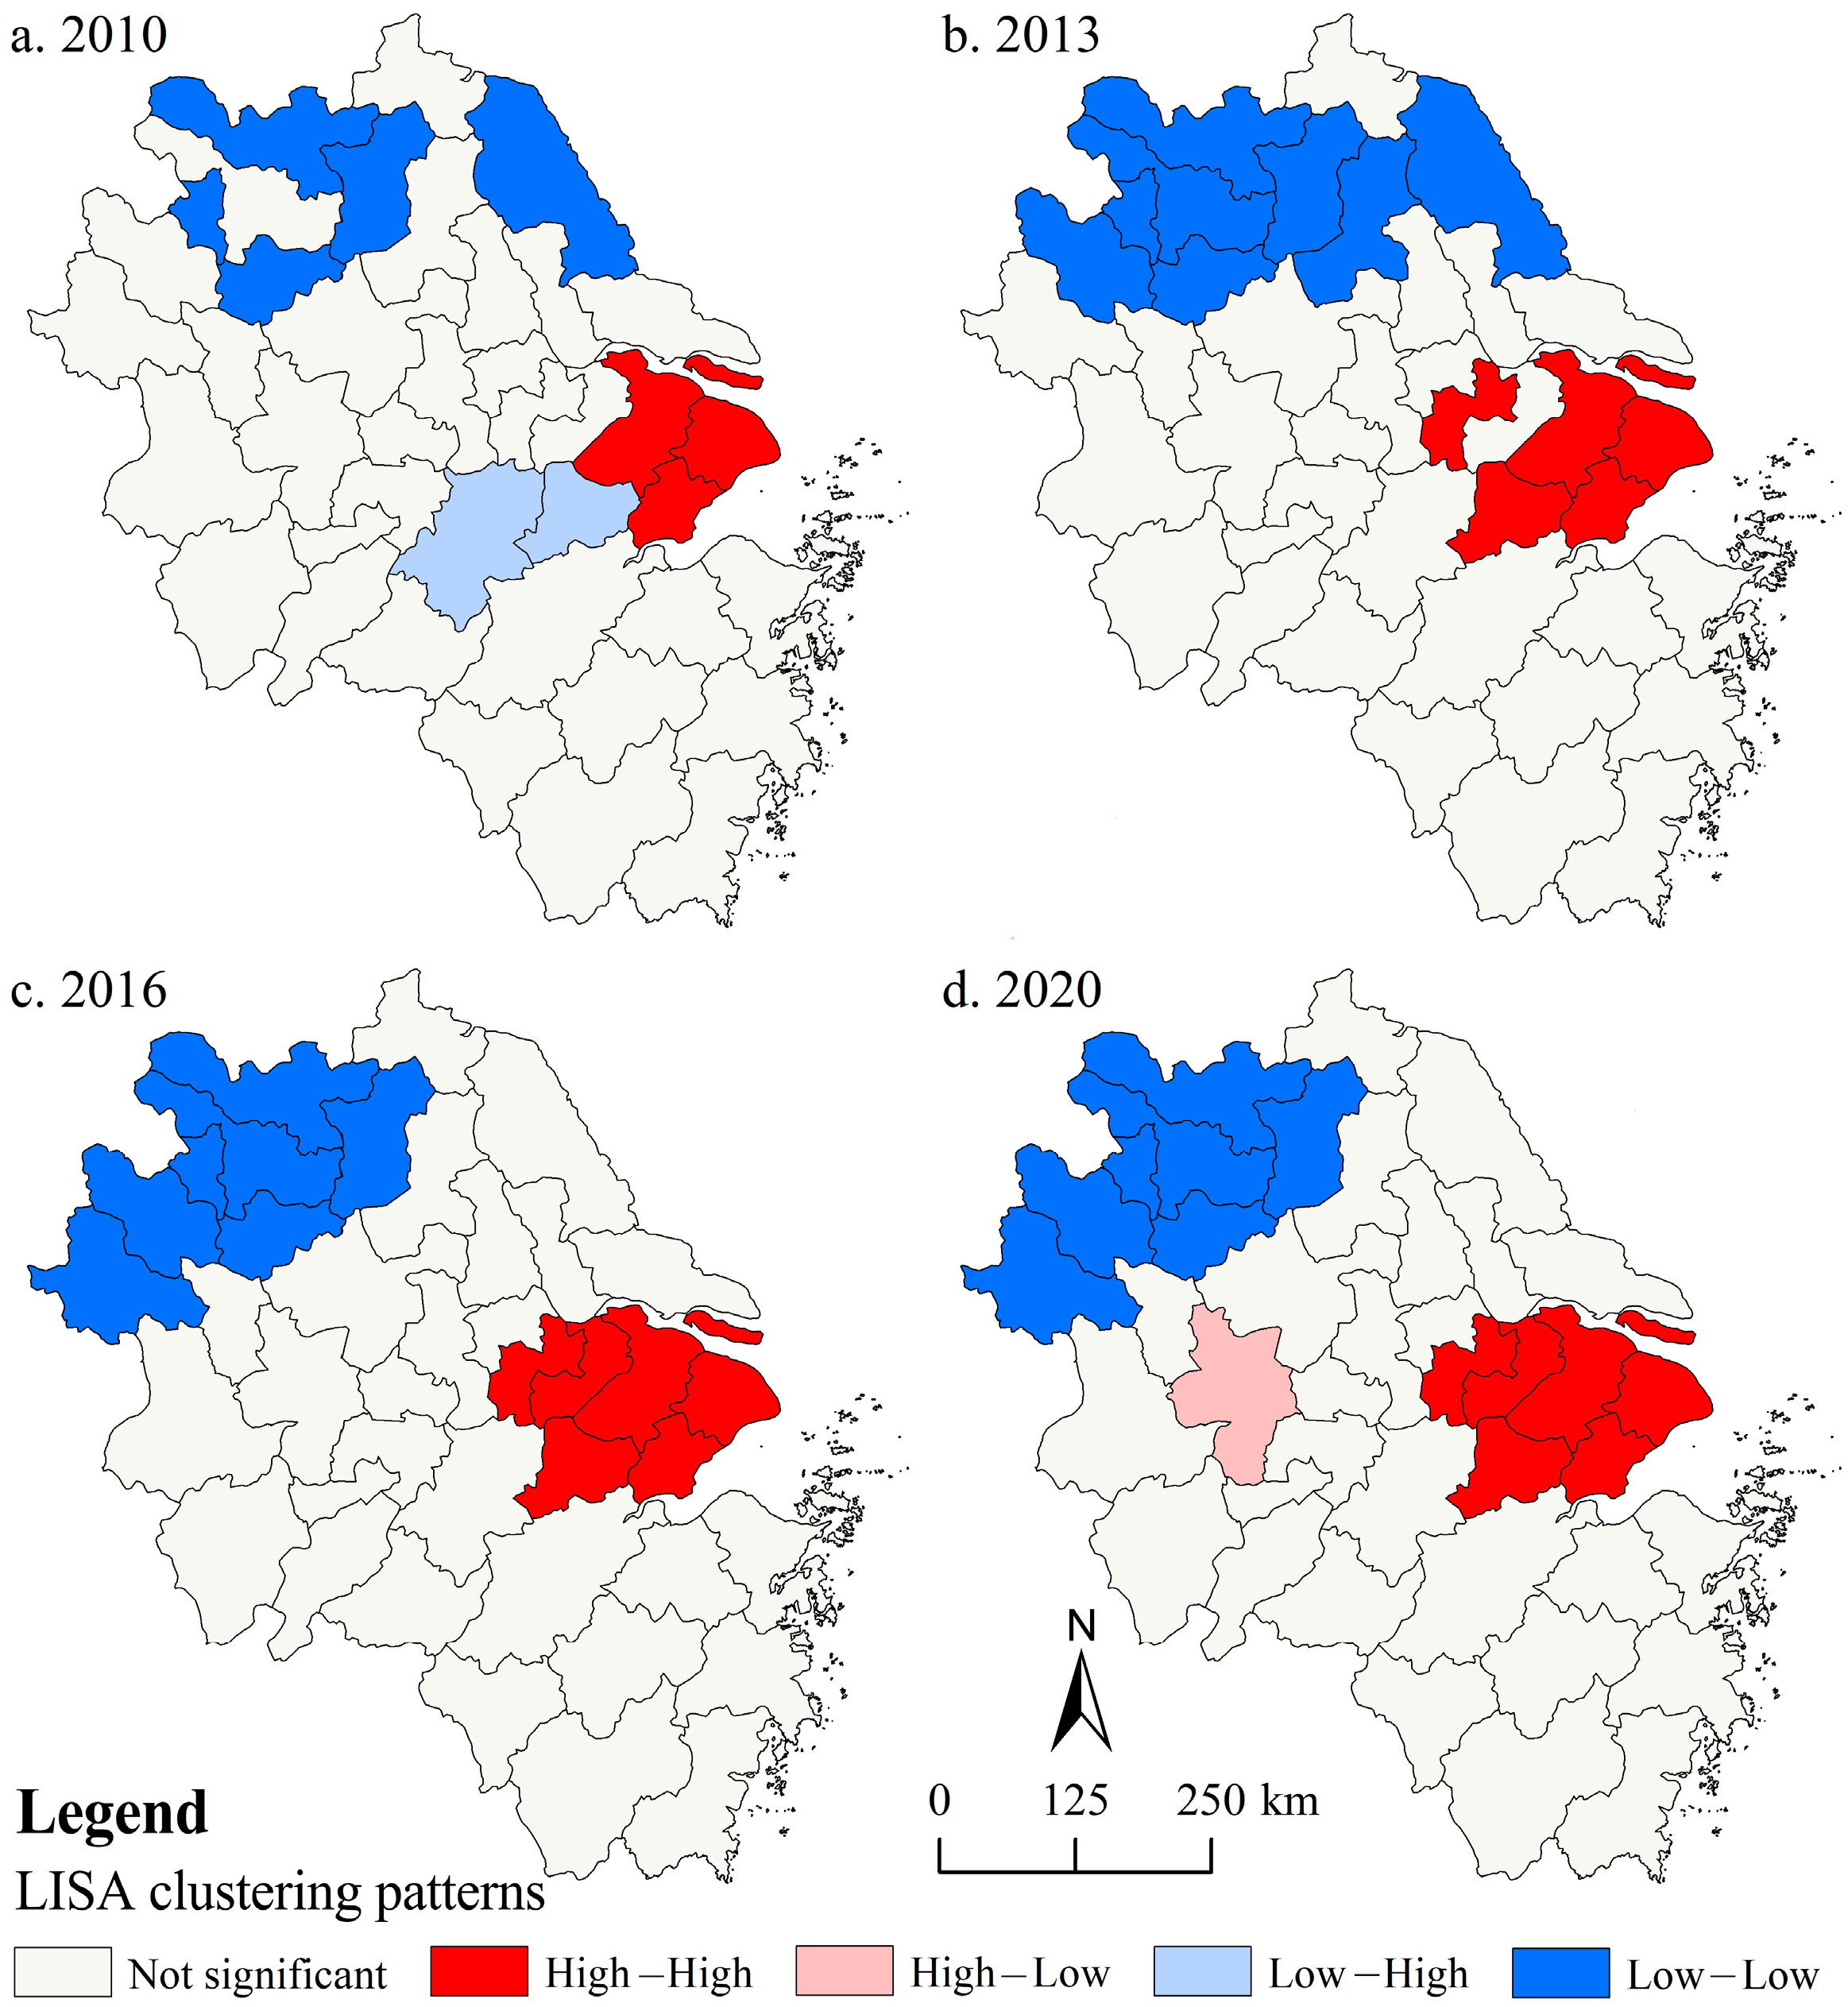
3.2.3. Spatial Association Analysis

In order to reflect the overall correlation degree of the BPSL among cities in the YRDR and to analyze its global spatial autocorrelation characteristics, the global Moran’s I index of the BPSL in the YRDR from 2010 to 2020 was calculated by using GeoDa software (Table 3). Table 3 shows that Moran’s I is positive throughout the study period, and the p-values all pass the significance test of less than 0.01. Moran’s I increased from 0.2967 in 2010 to 0.5562 in 2020, indicating that the BPSL in the YRDR has strong spatial correlation characteristics, and this correlation becomes more significant over time.
The Local Indicators of Spatial Association (LISA) significant clustering map of the BPSL in the YRDR from 2010 to 2020 was developed to identify the spatial correlation areas of the BPSL in the YRDR in each period (Figure 7). Among them, high –high clustering (H–H) indicates that the BPSL of a city in the region and its surrounding cities are both high, indicating a positive radiation effect in the spatial association. High–low clustering (H–L) indicates that a city in the region has a high BPSL, but its surrounding cities have a low BPSL, suggesting a polarization effect in the spatial association. Low–high clustering (L–H) indicates that the BPSL of the city is lower than the surrounding cities, and it is a transitional region. Low–low clustering (L–L) indicates that the BPSL of a city in the region is lower than that of its surroundings, indicating a negative radiation effect [71].
In general, all four clustering patterns of the BPSL were distributed during the study period, and a “spatial club convergence” phenomenon was observed. Specifically, the number of the H–H-type cities was three in Shanghai, Suzhou, and Jiaxing in 2010, increased gradually to six in 2020, and is distributed in clusters in Shanghai, southern Jiangsu, and northern Zhejiang. This indicates that these regions positively impact the BPSL in the YRDR, which has a significant impact on the BPSL in the surrounding cities. The H–L-type cities appeared in Hefei in 2020, reflecting that some cities in Anhui province have gradually benefitted from the Yangtze River Delta Regional Development Policy, and the provincial capital Hefei has clearly developed its BPSL, becoming a high-value local area. The L–H-type cities were found in Huzhou and Xuancheng in 2010, indicating that Huzhou and Xuancheng were surrounded by Hangzhou, Jiaxing, Suzhou, and Wuxi, forming a hollow pattern of association. The L–L-type cities changed relatively little over four periods, with an average number of 6.7. Following 2013, the cities were clearly clustered in northern Jiangsu and northern Anhui, indicating that the BPSL still has a negative spatial spillover effect within these regions.

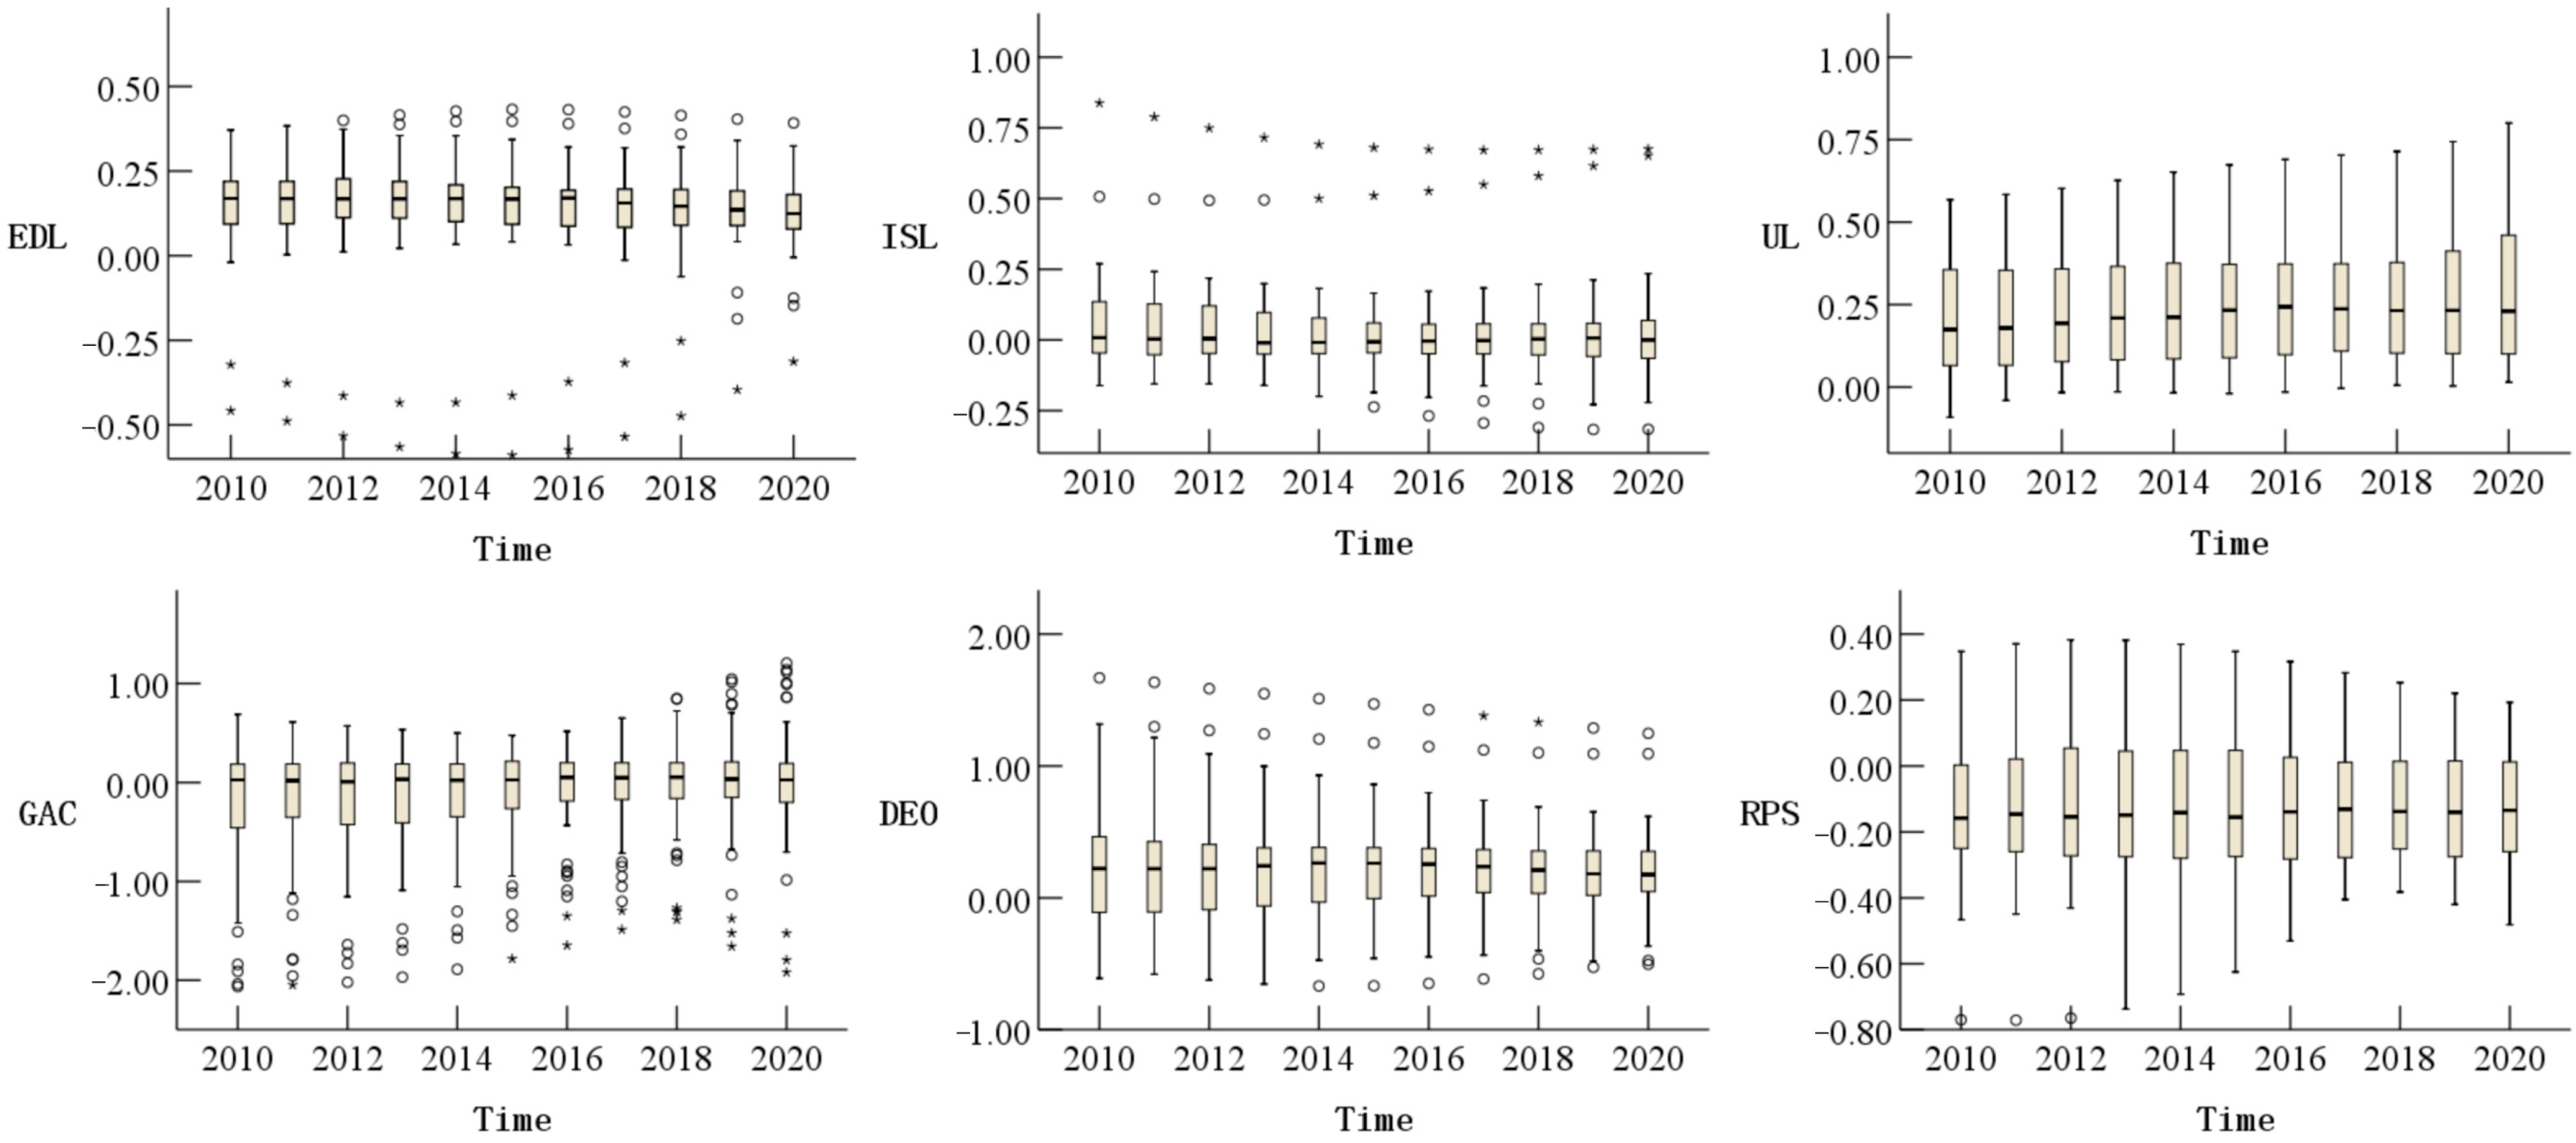
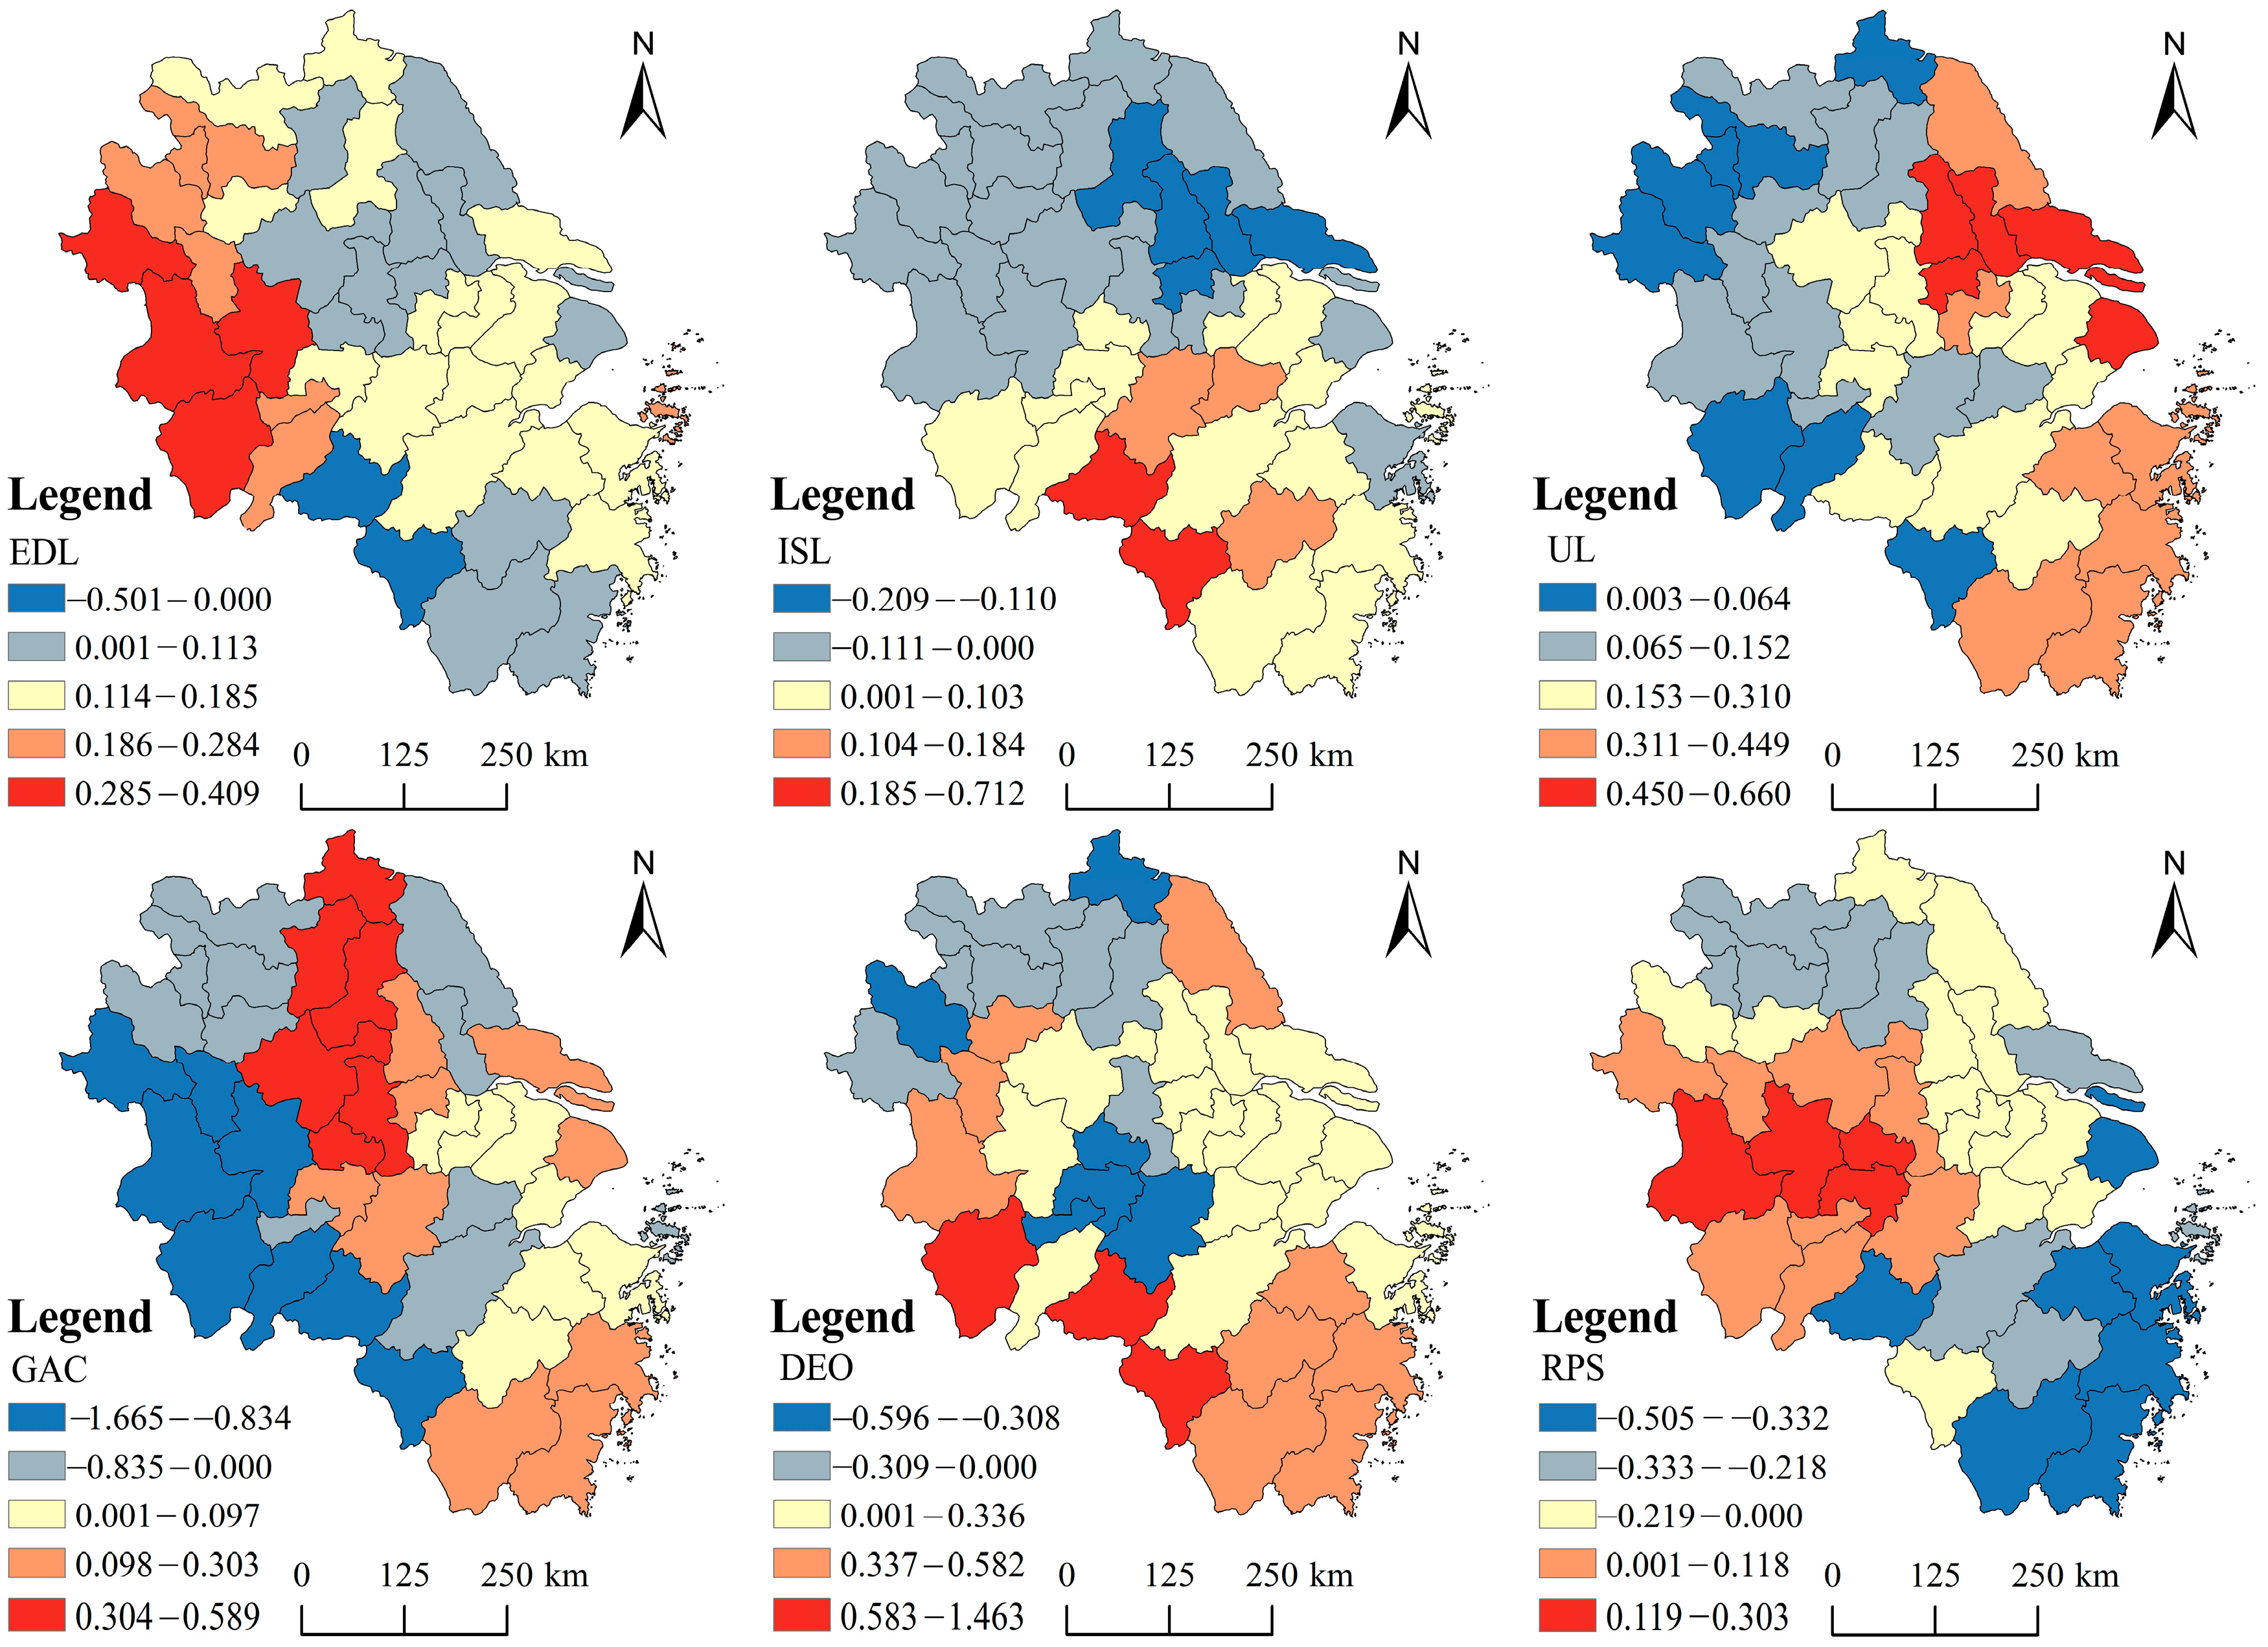
4. Analysis of the Factors Influencing Spatio-Temporal Divergence

4.1. Variables and Model Selection

Basic public services involve many social and economic fields, and their contents are diverse and causes are complex. To investigate the influencing factors of the spatial differentiation of the BPSL in the YRDR quantitatively, we constructed explanatory variables based on the references from previous studies [51,52,72,73,74] and the actual situation in the YRDR. Seven control variables are included in this analysis, including the economic development level, the industrial structure level, the urbanization level, the government action capacity, the degree of external openness, the regional population size, and the degree of marketization. Among them, the economic development level (EDL, X1), industrial structure level (ISL, X2), urbanization level (UL, X3), government action capacity (GAC, X4), degree of external openness (DEO, X5), regional population size (RPS, X6), and degree of marketization (DM, X7) are expressed by the GDP per capita, proportion of added value of tertiary industries to GDP, urbanization rate, public finance expenditures, foreign direct investment, resident population, and total retail sales of social consumer goods, respectively. In order to eliminate the influence of the dimensions, all data are normalized and analyzed.
Before model selection, cointegration tests were first conducted for each driver, and the results indicated that X7 had a variance inflation factor (VIF) value greater than ten and showed multicollinearity, so it was excluded. In a second cointegration test, all six remaining factors were found to have a VIF of less than ten, indicating no significant multicollinearity. Therefore, X1 ~ X6 were selected for analysis. The GTWR model regression results were compared with those of the OLS, TWR, and GWR models (Table 4), and the results showed that the GTWR model had a higher R2 (0.965) and adjusted R2 (0.964), a lower AICc (−2033.480), and a lower RSS (0.186) in comparison to the other three models. This indicates that the GTWR model, which considers both the temporal and spatial dimensions, is more advantageous. Therefore, the GTWR model was selected to analyze the factors affecting the BPSL in the YRDR.

4.2. Analysis of GTWR Results

Box plots of the fitted coefficients were drawn to examine the evolution of each influence factor measured by the GTWR model over time (Figure 8). In the meantime, the regression results for each factor were obtained using ArcGIS software and the GTWR plug-in. Limited by the length of the paper, only the mean values of the regression coefficients for the six impact factors from 2010 to 2020 are presented (Figure 9). Figure 8 and Figure 9 demonstrates that there is an apparent spatial and temporal heterogeneity in the influence of economic development level, industrial structure level, urbanization level, governmental action capacity, degree of external openness, and regional population size on BPSL in the YRDR, which needs to be analyzed individually.
The EDL has a positive effect on the BPSL in general, with relatively small interannual variations in time and a significant spatial promotion effect in the western and northern Anhui regions. In terms of time, the effect of the EDL on the BPSL is generally balanced, with the regression coefficient decreasing slightly but not significantly between 2010 and 2020, maintaining a relatively flat trend, indicating that the effect of the EDL on the BPSL is relatively stable and fluctuates slightly within a relatively flat interval. Regarding space, there are clearly positive and negative regions in the regression coefficients of the EDL. The positive effect areas are primarily concentrated in the west and north of Anhui, especially in the cities of Hefei, Luan, Anqing, and Fuyang. It shows that the higher the EDL in such areas, the more capable they are of investing in the construction of public service facilities and related infrastructure and improving the BPSL through the construction of public service facilities. In particular, along with the significant increase in the EDL of cities such as Hefei and Anqing in recent years, for example, since the implementation of the Yangtze River Delta synergistic development policy, the economic development of Hefei has benefited significantly, and the cumulative increase of Hefei’s GDP during the decade 2011–2021 was 213.83%, which ranked first among all cities in China in terms of growth rate, confirming its economic development achievements [76], which has a positive effect on improving its BPSL. In contrast, the overall negative impact of the EDL on the BPSL in Huangshan and Quzhou can be attributed to their relatively low level of economic development and the lack of funds for the construction of basic public services, as well as the “threshold effect” resulting from the small urban population.
The ISL has a positive effect on the BPSL in general. The inter-annual changes in time show a gentle inverted “U” shape trend, with the spatial characteristics of “positive south and negative north” generally being present. In terms of time, the regression coefficient of the ISL decreases from 0.057 in 2010 to 0.019 in 2016, and then rises to 0.029 in 2020, with a coefficient of 0.031 on average, indicating that the ISL has a positive effect on the improvement of the BPSL as a whole. It is worth noting that the regression coefficient of the ISL showed a gradual increase since 2016, which is mainly because of the “Yangtze River Delta Urban Agglomeration Development Plan” promulgated in 2016, which has a greater effect on the adjustment of the ISL in the YRDR. It has accelerated the optimization of the industrial structure in the YRDR and promoted the improvement of basic public service facilities, thus improving the overall BPSL in the region. In terms of space, there is heterogeneity in the impact of the ISL on the BPSL, with the positive effects occurring primarily in cities south of the Yangtze River, and the negative effects occurring primarily in cities north of the Yangtze River. Among them, Huangshan and Quzhou are particularly notable for their positive effects, since economic development and industrial structures in Huangshan and Quzhou are relatively backward. The upgrade and transformation of industrial structures has the potential for regional economic development, guiding the construction of public service facilities towards promoting the BPSL. The negative effects are most prevalent in central Jiangsu and certain cities, such as Zhenjiang and Huai’an. Industrial structures in these cities were adjusted a long time ago, and the function of industrial structure upgrading for guiding the construction of public service facilities tends to be saturated, resulting in the non-significant impact of industrial structure adjustments on improving BPSL.
The UL plays a positive role in promoting the BPSL, whose intensity tends to increase year by year, with a spatially decreasing tendency from east to west. In terms of time, the regression coefficients of the UL are all positive during the study period, and their positive effects become more significant as time goes by. The regression coefficient increases from 0.213 in 2010 to 0.277 in 2020, with an average coefficient of 0.245, which is the highest among the six influencing factors, indicating that urbanization has a significant positive effect on the improvement of the BPSL. Infrastructure and public services must be built to match the improvement in the UL, and the transfer of the non-agricultural population and the concentration of the non-agricultural industries create higher demands for infrastructure and public services, forcing the construction and improvement of the basic public service system, which in turn facilitates the improvement of the BPSL. In terms of space, although the impact of the UL on BPSL is generally positive, spatial heterogeneity in the intensity of its effect still exists. Overall, the UL in the eastern region of the YRDR is higher than that in the western region, and urbanization has also contributed to the rise in BPSL in the eastern region. A strong effect is observed in Shanghai, Yangzhou, Taizhou, Nantong, Zhenjiang, and other cities along the Yangtze River and along the coast. In contrast, a weaker effect can be found in the peripheral cities of the YRDR such as Fuyang, Huangshan, and Quzhou.
The GAC has a negative impact on the BPSL in general. However, the negative impact gradually changes to a positive one over time, resulting in a more apparent strip-like clustering feature in space. In terms of time, the regression coefficient of the GAC increases from −0.252 in 2010 to 0.004 in 2020, with an average coefficient of −0.141, while the coefficient of the GAC is negative; the influence of the GAC on the BPSL has generally shown an increasing trend and turned positive in 2020. In terms of space, a large spatial divergence is evident in the average regression coefficient of the GAC, particularly in the positive effect areas, which are mainly concentrated in Nanjing, Maanshan, Chuzhou, Suqian, Huaian, and Lianyungang. The GAC has a strong driving effect on the BPSL in these regions. Governments can significantly improve the quality of basic public services such as basic education, health care, and social security by investing in public finance. The GAC’s influence on the BPSL is more evident in the western peripheral areas of the YRDR, especially in the southern Anhui cities of Lu’an, Anqing, and Huangshan. Due to differences in regulatory capacity between regions, there may not be enough fiscal revenue generated in these regions, and there may not be sufficient investments in public services, resulting in a lack of basic public services being provided and thus a relatively insignificant impact on improving the BPSL.
The DEO has a positive impact on the BPSL in general, whose intensity tends to weaken over time, with significant spatial heterogeneity. In terms of time, the mean value of the regression coefficient of the DEO is positive during the study period, decreasing from 0.229 in 2010 to 0.181 in 2020, with an average coefficient of 0.207. The effect intensity of DEO is second only to the UL among these six factors. As the DEO of cities increases, a more liquid tax base is absorbed, resulting in an increase in local tax revenue and an increase in the fiscal capacity of local governments, in turn leading to the expansion of basic public services and an improvement in BPSL. In terms of space, the regions with significant positive effects are concentrated in cities such as Anqing, Huangshan, and Lishui. This is primarily due to the relatively weak economic development capabilities of these cities and weaker external ties compared to the core cities of the YRDR, while an increase in foreign direct investment could significantly improve the local external opening pattern, increase local fiscal revenues, accelerate the construction of regional basic public services, and improve the BPSL. Conversely, for regions such as Shanghai, southern Jiangsu, and northern Zhejiang, the DEO has little impact on the BPSL. There may be a reason for this: these regions, with their superior location and policy advantages, have opened up earlier and at a higher level, and the spillover effects from the DEO tend to be saturated, so the effect on the improvement of the BPSL is not significant.
The RPS has an overall negative effect on the BPSL, which tends to increase gradually over time, presenting a circling pattern spatially. In terms of time, the regression coefficient of the RPS decreased from −0.118 in 2010 to −0.130 in 2020, with an average coefficient of −0.119, indicating that the RPS has a generally negative effect on the BPSL. Generally speaking, the larger a region’s population, the greater the demand people have for basic public services and the lower the quality of basic public services per capita, which in turn affects the level and quality of basic public services. Therefore, the RPS should be kept within a reasonable range to ensure the quality of basic public services. In terms of space, the regression coefficient of the RPS shows certain circling characteristics with Lu’an, Hefei, Wuhu, and Maanshan as the central regions, decreasing towards the north and south. Specifically, the RPS has a strong positive effect on the BPSL for most cities in Anhui Province, probably due to the higher demand for basic public services as the population size has expanded, and basic public service facilities that match the population size are necessary to meet the daily public service needs of the people. Thus, the expansion of the population size forces the improvement of basic public services, which in turn improves the BPSL. It should be noted, however, that in most areas of Jiangsu, Zhejiang, and Shanghai, where basic public services and infrastructure are already relatively well developed, the expansion of the population will lead to competition for basic public services, resulting in a decline in the quality and level of basic public services, which will negatively affect them, especially in Shanghai and Ningbo.

5. Conclusions

Basic public services play a critical role in ensuring regional social equity and promoting coordinated regional development The development and evolution of the BPSL acts as the prism to evaluate coordinated regional development. This paper constructed a system of evaluation indexes of regional integrated development, analyzed the spatio-temporal dynamic characteristics of the BPSL in the YRDR from 2010 to 2020, and examined the influencing factors of the BPSL and its dynamic changes in the YRDR from the perspective of spatio-temporal non-stationarity. The main conclusions are as follows.
(1)
From 2010 to 2020, the BPSL in the YRDR generally improved, demonstrating a gradual upward trend. Intra-provincial and inter-provincial differences in the BPSL vary greatly, with intra-provincial differences being Jiangsu Province > Anhui Province > Zhejiang Province. The inter-provincial differences show an “M”-shaped trend with an “increasing–decreasing” pattern twice. Over time, the BPSL in the YRDR gradually shifted from unipolar polarization to multipolar differentiation and a flattening trend, with the spatial polarization effect gradually weakening, and the diffusion effect gradually increasing.
(2)
In terms of spatial trends, the BPSL displays a decreasing gradient from east to west with increasing geographical distance, presenting an inverted “U” shape distribution in the north–south direction. In general, the BPSL shows a spatial circle structure of high in the east and low in the west, and high in the center and low in the north and south, forming a spatial distribution pattern of high-level and higher-level grades mainly in Shanghai, southern Jiangsu, and northern Zhejiang. The BPSL shows a strong global spatial correlation, which becomes more significant over time. The four clustering patterns are distributed across the local spatial correlation, and a “spatial club convergence” phenomenon can be observed.
(3)
The spatial and temporal heterogeneity of the BPSL in the YRDR results from the combined effect of various influencing factors, all of which have apparent spatial and temporal heterogeneities. Among them, the UL has a noticeable positive influence on the BPSL, while the other five factors have both positive and negative influences: the EDL, the ISL, and the DEO have positive influences on the BPSL in general, and the GAC and the RPS have negative influences on the BPSL in general. It should be noted, however, that the influence of each factor varies from region to region over time.
The YRDR has emerged as an important strategic region for China’s economic and social development. The integrated development of the YRDR has now been elevated to the level of a national strategy, the further promotion of which is vital for coordinated regional development. Basic public services are the centralized reflection of regional social equity and coordinated development. Promoting the integration of basic public services in the YRDR has become a necessary support and guarantor in the process of the integrated development of the YRDR. This study measured and evaluated the BPSL in the entire YRDR using an integrated perspective and analyzed its spatial and temporal patterns and influencing factors over time to contribute to studies of basic public services. Moreover, it provides experiences for the key regions and key areas to improve the BPSL in the YRDR. In addition, the study of the YRDR reveals that basic public services play an essential role in enhancing regional integration. Therefore, other regions, such as the Guangdong–Hong Kong–Macao Greater Bay Area, Beijing–Tianjin–Hebei region, and Chengdu–Chongqing twin-city region, can also learn from the development experience of the YRDR to increase regional investment in basic public services, improve basic public service facilities, and enhance the BPLS, thus promoting the regional integration process.
However, although the BPSL in the YRDR has considerably improved in recent years, there are still some unsettled issues such as uneven regional development and a lack of prominence in key fields of basic public services in the YRDR. In order to break the barriers to developing basic public services in the YRDR and improve its BPSL, it is necessary to propose appropriate countermeasures. In this regard, we should draw upon the development experiences of the other five world-class urban agglomerations, pay attention to the heterogeneity of the YRDR, and gradually and orderly expand the coverage of basic public services for the residents. Referring to the principle of radiation circle theory, the relative equalization of development among the central cities should be achieved first to drive the development of the surrounding areas, followed by the orderly promotion work among the prefecture-level cities, and then serving the entire province and region and gradually expanding the radiation circle. Meanwhile, priority will be given to infrastructure services, information and communication services, basic education, health care, social security, and other areas closely related to peoples’ daily lives. Standardization, specialization, and integration should be upgraded by areas, fields, and steps, following the basic principle of starting with the easy ones first, deepening gradually, and advancing progressively, so as to eventually realize the integration of basic public services in the YRDR and promote regional socio-economic and comprehensive human development.
Additionally, through examining the factors affecting the spatial and temporal heterogeneity of the BPSL in the YRDR, this study finds that although government action capacity has a weaker effect than several other types of factors on improving the BPSL, the diachronic analysis indicates that its strength increases rapidly and becomes more significant over time. It can be found that, as regional development policies have gradually been introduced and implemented in the Yangtze River Delta, local governments have become more influential in the development of basic public services. This phenomenon is closely related to the policies of integrated regional development that have been implemented continuously in the YRDR in recent years, and once again reflects the mutual promotion relationship between integrated development and regional basic public services. Furthermore, this study also found a solid interactive relationship between the urbanization level and the BPSL. The increase in the urbanization level can effectively promote the improvement of the BPSL, and the improvement of basic public services can further promote and enhance the urbanization level. In the process of interaction and coupling, the two promote each other, which is consistent with the findings of Yin Peng et al. [56].
It should be noted that, due to the scope and perspective of the study, this article primarily examined the spatial and temporal dynamics of the BPSL in the YRDR and the influencing factors from the regional and municipal scales. However, basic public services are also affected by the market supply and demand in both directions. Therefore, examining the effectiveness and adaptability of basic public services based on the perspective of supply and demand is also worthy of attention. Furthermore, the cooperation between the Yangtze River Delta cities in basic public services such as education, health care, social security, and infrastructure is still unclear and needs to be examined. Meanwhile, the effective connection between the development of basic public services and the high-quality development of the YRDR is still worthy of in-depth discussion in follow-up studies.

Author Contributions

Conceptualization, T.L. and X.K.; methodology, T.L.; software, Y.Z.; validation, X.K.; formal analysis, T.L.; investigation, T.L.; resources, X.K.; data curation T.L.; writing—original draft preparation, T.L.; writing—review and editing, Y.Z.; supervision, X.K.; project administration, X.K.; funding acquisition, X.K. All authors have read and agreed to the published version of the manuscript.

Funding

This research was funded by the National Natural Science Foundation of China (Grant No. 42130510 and 41771156) and the Major Project of National Social Science Foundation of China (Grant No. 19ZDA087).

Institutional Review Board Statement

Not applicable.

Informed Consent Statement

Not applicable.

Data Availability Statement

The data presented in this study are available on request from the first author.

Conflicts of Interest

The authors declare no conflict of interest.

References

  1. Fan, J.; Zhao, Y.N. China’s Regional Development Pattern Oriented toward Modernization: The Scientific Connotation and Strategic Priorities. Econ. Geogr. 2021, 41, 1–9. [Google Scholar]
  2. Chen, W.; Sun, W.; Liu, C.G.; Liu, W. Regional Integration and High-quality Development in the Yangtze River Delta Region. Econ. Geogr. 2021, 41, 127–134. [Google Scholar]
  3. Cao, W.D.; Zeng, G.; Zhu, S.J.; Cao, Y.X.; Sun, B.D.; Cao, B.R.; Cui, C.; Duan, X.J.; Zhang, J.X.; Sun, W.; et al. High-quality integrated development in the Yangtze River Delta region: Problems and solutions. J. Nat. Resour. 2022, 37, 1385–1402. [Google Scholar] [CrossRef]
  4. Chen, W.; Lan, M.H.; Sun, W.; Liu, W.; Liu, C.G. Integrated high-quality development of the Yangtze River Delta: Connotation, current situation and countermeasures. J. Nat. Resour. 2022, 37, 1403–1412. [Google Scholar] [CrossRef]
  5. Smith, A. An Inquiry into the Nature and Causes of the Wealth of Nations. University Of Chicago Press: Chicago, IL, USA, 1977. [Google Scholar]
  6. Samuelson, P.A. The pure theory of public expenditure. Rev. Econ. Stat. 1954, 36, 387–389. [Google Scholar] [CrossRef]
  7. Zhou, M.H.; Jia, K.J. Marxist theory of public goods and its practical significance. Probe 2009, 5, 146–151. [Google Scholar]
  8. Yang, J. Critical Interpretation of Western Public Goods Theory in the Marxist Perspective. Teach. Res. 2009, 8, 17–22. [Google Scholar]
  9. Arends, H. The dangers of fiscal decentralization and public service delivery: A review of arguments. Politische Vierteljahr. 2020, 61, 599–622. [Google Scholar] [CrossRef]
  10. Gibson, A.; Asthana, S. A tangled web: Complexity and inequality in the English local government finance settlement. Local Gov. Stud. 2012, 38, 301–319. [Google Scholar] [CrossRef]
  11. Elg, M.; Wihlborg, E.; Örnerheim, M. Public quality–for whom and how? Integrating public core values with quality management. Total Qual. Manag. Bus. Excell. 2017, 28, 379–389. [Google Scholar] [CrossRef]
  12. Mhlanga, D.; Garidzirai, R. The influence of racial differences in the demand for healthcare in South Africa: A case of public healthcare. Int. J. Environ. Res. Public Health 2020, 17, 5043. [Google Scholar] [CrossRef]
  13. Jabur, S.D.; Khalil, S.M. Spatial variation of primary education services in Iraq for the academic year 2018–2019. Basic Educ. Coll. Mag. Educ. Humanit. Sci. 2020, 48, 1261–1273. [Google Scholar]
  14. Macharia, P.M.; Ouma, P.O.; Gogo, E.G.; Snow, R.W.; Noor, A.M. Spatial accessibility to basic public health services in South Sudan. Geospat. Health 2017, 12, 510. [Google Scholar] [CrossRef]
  15. Viriyathorn, S.; Phaiyarom, M.; Rueangsom, P.; Suphanchaimat, R. Spatial Panel Data Analysis on the Relationship between Provincial Economic Status and Enrolment in the Social Security Scheme amongst Migrant Workers in Thailand, 2015–2018. Int. J. Environ. Res. Public Health 2021, 19, 181. [Google Scholar] [CrossRef]
  16. van den Heever, A.M. The role of insurance in the achievement of universal coverage within a developing country context: South Africa as a case study. BMC Public Health 2012, 12, S5. [Google Scholar] [CrossRef] [Green Version]
  17. Simson, R. Ethnic (in) equality in the public services of Kenya and Uganda. Afr. Aff. 2019, 118, 75–100. [Google Scholar] [CrossRef]
  18. Saidi, A.; Hamdaoui, M.; Moussa, W. Assessing policy effectiveness in reducing inequality of opportunity in access to public services and education among Tunisian children. J. Knowl. Econ. 2021, 12, 993–1018. [Google Scholar] [CrossRef]
  19. Vaishar, A.; Šťastná, M. Accessibility of Services in Rural Areas: Southern Moravia Case Study. Sustainability 2021, 13, 9103. [Google Scholar] [CrossRef]
  20. Gazzeh, K.; Abubakar, I.R. Regional disparity in access to basic public services in Saudi Arabia: A sustainability challenge. Util. Policy 2018, 52, 70–80. [Google Scholar] [CrossRef]
  21. Kim, S.; Vandenabeele, W.; Wright, B.E.; Andersen, L.B.; Cerase, F.P.; Christensen, R.K.; Desmarais, C.; Koumenta, M.; Leisink, P.; Liu, B.C.; et al. Investigating the structure and meaning of public service motivation across populations: Developing an international instrument and addressing issues of measurement invariance. J. Public Adm. Res. Theory 2013, 23, 79–102. [Google Scholar] [CrossRef]
  22. Vandenabeele, W.; Brewer, G.A.; Ritz, A. Past, present, and future of public service motivation research. Public Adm. 2014, 92, 779–789. [Google Scholar] [CrossRef]
  23. Perry, J.L.; Vandenabeele, W. Public service motivation research: Achievements, challenges, and future directions. Public Adm. Rev. 2015, 75, 692–699. [Google Scholar] [CrossRef]
  24. Van Loon, N.; Kjeldsen, A.M.; Andersen, L.B.; Vandenabeele, W.; Leisink, P. Only when the societal impact potential is high? A panel study of the relationship between public service motivation and perceived performance. Rev. Public Pers. Adm. 2018, 38, 139–166. [Google Scholar] [CrossRef] [PubMed]
  25. Osborne, S.P.; Radnor, Z.; Kinder, T.; Vidal, I. The SERVICE framework: A public-service-dominant approach to sustainable public services. Br. J. Manag. 2015, 26, 424–438. [Google Scholar] [CrossRef]
  26. Berman, E.M.; Bowman, J.S.; West, J.P.; Van Wart, M.R. Human Resource Management in Public Service: Paradoxes, Processes, and Problems; CQ Press: Washington, DC, USA, 2021. [Google Scholar]
  27. Shi, W.D.; Zhao, L. The Measure of the Quality of Basic Public Services in Shandong Province and Its Spatial Patterns. Econ. Geogr. 2015, 35, 32–37. [Google Scholar]
  28. Ma, H.Q.; Han, Z.L.; Jiang, H.X. The Characteristics and Spatial Differences of Basic Public Services of Cities at Prefecture Level and above in China. Econ. Geogr. 2011, 31, 212–217. [Google Scholar]
  29. Li, B.; Han, Z.L.; Ma, H.Q. Temporal and Spatial Analysis of Differences of the Quality of Basic Public Service of Cities in Liaoning Province. Hum. Geogr. 2015, 30, 111–117. [Google Scholar]
  30. Zhao, L.; Zhang, Y.S.; Zhang, M.; Wu, D.T. The Spatio-Temporal Evolution and Formation Mechanism of Basic Public Service Mismatch in Northeast of China. Econ. Geogr. 2015, 35, 36–44. [Google Scholar]
  31. Li, S.; Yang, Y.X. Equalization of Basic Public Services for Common Prosperity: Action Logic and Path Selection. China Ind. Econ. 2022, 2, 27–41. [Google Scholar]
  32. Han, Z.L.; Li, B.; Zhang, K.L. Evaluation and spatial analysis of the equalization of basic public service in urban and rural areas in China. Geogr. Res. 2015, 34, 2035–2048. [Google Scholar]
  33. Li, H.; Dong, Y.L. The Equalization Measurement and Trend Evolution of China’s Basic Public Service—A Study Based on High Quality Development. China Soft Sci. 2020, 10, 74–84. [Google Scholar]
  34. Yang, G.; Xue, Y.; Ma, Y. Social organization participation, government governance and the equalization of basic public services: Evidence from China. Int. J. Environ. Res. Public Health 2019, 16, 2996. [Google Scholar] [CrossRef] [PubMed] [Green Version]
  35. Zeng, S.; Xia, F.; Yang, P. The Equalization Gap of Basic Public Services Supply in China: An Empirical Study on Education, Health Care and Social Security. China Financ. Econ. Rev. 2018, 7, 24–51. [Google Scholar]
  36. Han, X. Ways to Improve the Accessibility of Rural Basic Public Services under the Background of Rural Revitalization. Int. J. Intell. Inf. Manag. Sci. 2021, 10, 132–135. [Google Scholar]
  37. Yin, P.; Li, C.G.; Chen, C.; Duan, P.L. Relationship between Population Urbanization and Basic Public Service in the Context of the New Urbanization—Take Jilin Province for Example. Econ. Geogr. 2015, 35, 61–67. [Google Scholar]
  38. Zeng, F.R.; Li, L.W.; He, Z.C.; Wang, Z.K. Research on the Dynamic Relationship between Basic Public Service Level and New -type Urbanization. China Soft Sci. 2019, 12, 150–160. [Google Scholar]
  39. Xu, G.Y. The Conjunction and Horizon of Common Wealth and Equalization of Basic Public Services in Urban and Rural Areas. J. Public Policy Adm. 2022, 6, 56–61. [Google Scholar]
  40. Li, Z.F.; Wei, F.Q. Research on Coupling and Coordinating Development of Urbanization Quality and Basic Public Services at Large Regional Scale: Take Shanxi Province as an example. Aussie-Sino Stud. 2019, 5, 71–74. [Google Scholar]
  41. Lin, L.Y.; Zhu, Y.; Ke, W.Q.; Wang, J.S. The impact of migrants’ access to urban public services on their urban settlement intentions: A study from the perspective of different-sized cities. Acta Geogr. Sin. 2019, 74, 737–752. [Google Scholar]
  42. Yang, L.; Chau, K.W.; Wang, X. Are low-end housing purchasers more willing to pay for access to basic public services? Evidence from China. Res. Transp. Econ. 2019, 76, 100734. [Google Scholar] [CrossRef]
  43. Fan, B.; Yang, W.; Han, T. Impact of basic public service level on pro-environmental behavior in China. Int. Sociol. 2018, 33, 738–760. [Google Scholar] [CrossRef]
  44. Wang, F.; Bai, Y.P.; Zhou, L.; Ji, X.P.; Xu, Z.B.; Qiao, F.W. Spatial pattern and influencing factors of the equalization of basic education public service in China. Geogr. Res. 2019, 38, 285–296. [Google Scholar]
  45. Wang, W.; Zhao, Z.J. Spatial decomposition of funding inequality in China’s basic education: A four-level Theil index analysis. Public Financ. Manag. 2014, 14, 416–436. [Google Scholar]
  46. Guo, L.; Bao, Y.; Li, S.; Ma, J.; Sun, W. Quality analysis and policy recommendations on the utilization of community basic public health services in urban and suburban Shanghai from 2009 to 2014. Environ. Sci. Pollut. Res. 2018, 25, 28206–28215. [Google Scholar] [CrossRef]
  47. Zhao, Y.; Cui, S.; Yang, J.; Wang, W.; Guo, A.; Liu, Y.; Liang, W. Basic public health services delivered in an urban community: A qualitative study. Public Health 2011, 125, 37–45. [Google Scholar] [CrossRef]
  48. Shi, T.; Zhao, E.Y.; Liu, D.X. Provincial Differences of Equalization and the Spatial Pattern of Urban Social Security in China. Popul. Econ. 2015, 2, 87–97. [Google Scholar]
  49. Ma, H.Q.; Wang, Q.; Gong, Z.G. The spatio-temporal evolution of basic public services equalization in Beijing–Tianjin–Hebei region. J. Arid. Land Resour. Environ. 2016, 30, 64–69. [Google Scholar]
  50. Zhao, L.; Zhang, Y.S.; Jiao, X.Y.; Wu, D.; Wu, D.T. The Spatial Pattern and Effect of Basic Public Service Quality in Henan Province. Sci. Geogr. Sin. 2016, 36, 1495–1504. [Google Scholar]
  51. Liu, X.J.; Xia, S.Y.; Li, D.; Zheng, C.R.Y.; Wei, X.C. Spatial and Temporal Differentiation and Influencing Factors of Basic Public Service Quality in Hunan Province. Resour. Environ. Yangtze Basin 2020, 29, 1535–1544. [Google Scholar]
  52. Cao, S.; Liu, S.Q.; Peng, L.; Xu, D.D. Spatial pattern and mechanisms of basic public services in Sichuan. J. Univ. Chin. Acad. Sci. 2017, 34, 351–361. [Google Scholar]
  53. Han, Z.L.; Zhu, J.; Zhong, J.Q.; Yan, X.L. Spatio-Temporal Characteristics and Evolution Mechanism for the Equalization of Basic Public Service in Island Counties of China. Econ. Geogr. 2021, 41, 11–22. [Google Scholar]
  54. Cui, L.; Zhou, H. Spatial feature analysis of rural basic public service supply based on TOPSIS model and Data aggregation algorithm. J. Intell. Fuzzy Syst. 2020, 39, 5623–5634. [Google Scholar] [CrossRef]
  55. Liu, H.L.; Hu, X.H.; Guo, Z.S.; Li, M. Spatio-temporal Evolution and Influencing Factors of the Coordinated Development of Basic Public Services and Urbanization in Zhongyuan Urban Agglomeration. J. Nat. Sci. Hunan Norm. Univ. 2021, 44, 71–80. [Google Scholar]
  56. Yin, P.; Wang, F.X.; Duan, P.L. Spatial-temporal Coupling Relationship Between Basic Public Service Efficiency and Urbanization Quality in China. Sci. Geogr. Sin. 2021, 41, 571–579. [Google Scholar]
  57. Wang, L.; Rong, X.; Mu, L. The spatial pattern and dynamic evolution of basic public service level in Beijing-Tianjin-Hebei region from the perspective of COVID-19. Eng. Constr. Archit. Manag. 2022; ahead-of-print. [Google Scholar]
  58. Guo, Y.; Cao, X.Z.; Wei, W.D.; Zeng, G. The impact of regional integration in the Yangtze River Delta on urban carbon emissions. Geogr. Res. 2022, 41, 181–192. [Google Scholar]
  59. Li, B.; Li, T.; Zhu, Y. Equalization of Public Services, Financial Expenditure on People’s Livelihood and Urbanization—An Empirical Study Based on Dynamic Spatial Econometrics Models by Use of Panel Data from 286 Cities of China. China Soft Sci. 2015, 6, 79–90. [Google Scholar]
  60. Liu, C.M.; Zhang, C.M.; Ren, Q.L.; Song, J.; Shen, Q. Coupling Mechanism and Spatiotemporal Evolution Between the Basic Public Services and the Economic Development: The Case of 13 Cities in Jiangsu Province. Econ. Geogr. 2019, 39, 26–33. [Google Scholar]
  61. Sahoo, M.M.; Patra, K.C.; Swain, J.B.; Khatua, K.K. Evaluation of water quality with application of Bayes’ rule and entropy weight method. Eur. J. Environ. Civ. Eng. 2017, 21, 730–752. [Google Scholar] [CrossRef]
  62. Hwang, C.L.; Yoon, K.P. Multiple Attribute Decision Making: Methods and Applications; Springer: New York, NY, USA, 1981; pp. 124–130. [Google Scholar]
  63. Elsayed, E.A.; Dawood, A.S.; Karthikeyan, R. Evaluating alternatives through the application of TOPSIS method with entropy weight. Int. J. Eng. Trends Technol. 2017, 46, 60–66. [Google Scholar] [CrossRef]
  64. Kim, A.R. A study on competitiveness analysis of ports in Korea and China by entropy weight TOPSIS. Asian J. Shipp. Logist. 2016, 32, 187–194. [Google Scholar] [CrossRef]
  65. Anselin, L. Spatial Econometrics: Methods and Models; Springer Science & Business Media: New York, NY, USA, 1988. [Google Scholar]
  66. Haining, R.; Wise, S.; Ma, J. Exploratory spatial data analysis. J. R. Stat. Soc. Ser. D (Stat.) 1998, 47, 457–469. [Google Scholar] [CrossRef]
  67. Brunsdon, C.; Fotheringham, A.S.; Charlton, M.E. Geographically weighted regression: A method for exploring spatial nonstationarity. Geogr. Anal. 1996, 28, 281–298. [Google Scholar] [CrossRef]
  68. Huang, B.; Wu, B.; Barry, M. Geographically and temporally weighted regression for modeling spatio-temporal variation in house prices. Int. J. Geogr. Inf. Sci. 2010, 24, 383–401. [Google Scholar] [CrossRef]
  69. Fotheringham, A.S.; Crespo, R.; Yao, J. Geographical and temporal weighted regression (GTWR). Geogr. Anal. 2015, 47, 431–452. [Google Scholar] [CrossRef]
  70. Garang, Z.; Wu, C.; Li, G.; Zhuo, Y.; Xu, Z. Spatio-Temporal Non-Stationarity and Its Influencing Factors of Commercial Land Price: A Case Study of Hangzhou, China. Land 2021, 10, 317. [Google Scholar] [CrossRef]
  71. Anselin, L. Local indicators of spatial association—LISA. Geogr. Anal. 1995, 27, 93–115. [Google Scholar] [CrossRef]
  72. Bai, Y.N. Research on the Measurement of Basic Public Service Efficiency and Its Influencing Factors in the Yangtze River Delta. Master’s thesis, Zhejiang Gongshang University, Hangzhou, China, 2022. [Google Scholar]
  73. Yuan, D.; Ou, X.J.; Tang, Z.Q. Spatial Characteristics and Driving Factors between Population Urbanization and Public Service in the Eastern Coastal Areas. Econ. Geogr. 2017, 37, 32–39. [Google Scholar]
  74. Peng, Y.L.; Sun, P.J.; Luo, N.; Liu, J. Spatial-temporal Characteristics and Causes of Equalization of Basic Public Services in Chengdu-Chongqing Urban Agglomeration. Areal Res. Dev. 2022, 41, 32–37. [Google Scholar]
  75. Chen, Y.E.; Yin, X.; Jin, R.C. Spatio-temporal Heterogeneity and Factors Influencing of China’s Rural Inclusive Finance. J. Quant. Tech. Econ. 2020, 37, 44–59. [Google Scholar]
  76. The Paper. With 213% Economic Growth, Hefei Is the Most Improved City in China in the Past 10 Years [EB/OL]. 4 March 2022. Available online: https://www.thepaper.cn/newsDetail_forward_16961130 (accessed on 6 July 2022).
Figure 1. Overview of the study area.
Land 11 01477 g001
Figure 2. Changes of the BPSL in the Yangtze River Delta provinces and cities, 2010–2020.
Land 11 01477 g002
Figure 3. Coefficient of variation of the BPSL in the Yangtze River Delta provinces and cities, 2010–2020.
Land 11 01477 g003
Figure 4. Kernel density estimation curve of the BPSL in the YRDR, 2010–2020.
Land 11 01477 g004
Figure 5. Spatial trend surface of basic public service levels in the YRDR, 2010–2020.
Land 11 01477 g005
Figure 6. Spatial distribution pattern of the BPSL in the YRDR, 2010–2020.
Land 11 01477 g006
Figure 7. LISA Significance Clustering of the BPSL in the YRDR, 2010–2020.
Land 11 01477 g007
Figure 8. Time series change of regression coefficients of each impact factor from 2010 to 2020.
Land 11 01477 g008
Figure 9. Spatial distribution of mean values of regression coefficients for each impact factor, 2010–2020.
Land 11 01477 g009
Table 1. The evaluation index system of the BPSL.
Target LayerDimensional LayerIndicator LayerWeights
Basic Public ServicesBasic Education ServicesFinancial expenditure on education per 10,000 people0.0351
Number of general higher education schools per 10,000 people0.0603
Number of general primary and secondary schools per 10,000 people0.0413
Number of full-time teachers in primary and secondary schools per 10,000 people0.0143
Medical and Health ServicesFinancial expenditure on medical care per 10,000 people0.0269
Number of hospitals per 10,000 people0.0273
Number of hospital beds per 10,000 people0.0240
Number of practicing (assistant) physicians per 10,000 people0.0248
Social Security ServicesFinancial expenditure on social security per 10,000 people0.0447
Number of urban workers’ basic pension insurance participants per 10,000 people0.0468
Number of urban workers’ basic medical insurance participants per 10,000 people0.0497
Number of unemployment insurance participants per 10,000 people0.0542
Public Cultural ServicesFinancial expenditure on culture and sports per 10,000 people0.0572
Number of public libraries per 10,000 people0.0463
Public library book collections per 10,000 people0.0748
Number of theaters and cinemas per 10,000 people0.0488
Number of museums per 10,000 people0.0749
Information and Communication ServicesNumber of Year-end fixed-line subscribers per 10,000 people0.0386
Number of Year-end cell phone subscribers per 10,000 people0.0368
Number of Internet broadband access users per 10,000 people0.0401
Number of post offices per 10,000 people0.0276
Eco-environmental ServicesGreening coverage rate of built-up areas0.0028
Comprehensive utilization rate of general industrial solid waste0.0027
Centralized treatment rate of the sewage treatment plant0.0065
Harmless treatment rate of domestic waste0.0047
Infrastructure ServicesUrban road area per capita0.0205
Number of buses per 10,000 people0.0281
Length of drainage pipes per 10,000 people0.0340
Urban water penetration rate0.0042
Gas penetration rate0.0021
Table 2. Estimation results of the BPSL in the YRDR from 2010 to 2020.
City2010201320162020City2010201320162020
Shanghai0.3950.4690.5240.558Quzhou0.1380.1520.1880.259
Nanjing0.3130.3820.4050.449Zhoushan0.2680.3170.3870.461
Wuxi0.2900.3590.3890.447Taizhou0.1500.1740.2080.251
Xuzhou0.0930.1090.1290.160Lishui0.1790.2130.2370.285
Changzhou0.2370.2570.2930.345Hefei0.2930.2730.2860.327
Suzhou0.3160.3810.4520.494Wuhu0.2090.1690.1930.232
Nantong0.1010.1720.1980.237Bengbu0.1530.1560.1620.197
Lianyungang0.1070.1210.1280.161Huainan0.1510.1580.1470.165
Huai’an0.0920.1120.1320.161Ma’anshan0.2460.1820.1980.245
Yancheng0.1000.1070.1320.167Huaibei0.1690.1710.1860.217
Yangzhou0.1500.1510.1810.241Tongling0.2230.3070.2060.230
Zhenjiang0.2110.2410.2910.335Anqing0.1530.1470.1540.177
Taizhou0.1150.1320.1580.205Huangshan0.3250.3230.3890.404
Suqian0.1190.1300.1470.174Chuzhou0.1110.1410.1730.208
Hangzhou0.3640.4010.4490.492Fuyang0.1110.1030.0840.109
Ningbo0.3010.3600.3980.435Suzhou0.0920.0850.0890.119
Wenzhou0.1650.1970.2190.266Lu’an0.1350.1190.1010.122
Jiaxing0.2470.2990.3200.388Bozhou0.1160.1090.1030.122
Huzhou0.1830.2260.2790.368Chizhou0.1730.1780.1930.216
Shaoxing0.1920.2320.2660.319Xuancheng0.1230.1410.1640.202
Jinhua0.1900.2280.2610.317Average value0.1900.2120.2340.275
Table 3. Changes in global Moran’s I index of the BPSL in the YRDR, 2010–2020.
YearMoran’s IZ Scorep-Value
20100.29673.33560.003
20110.35673.96740.002
20120.40044.39490.001
20130.40414.44230.001
20140.43024.56160.001
20150.42154.57730.001
20160.47435.16450.001
20170.48745.31300.001
20180.51685.61310.001
20190.53205.75960.001
20200.55625.96560.001
Table 4. Comparison of regression results of the OLS, TWR, GWR, and GTWR models.
OLSTWRGWRGTWR
R20.7280.7680.9600.965
Adjusted R20.7250.7650.9600.964
AICc−1298.335−1337.640−2028.250−2033.480
RSS1.4391.2310.2120.186
Bandwidth-0.2310.1150.115
Note: The R2 and the Adjusted R2 both indicate the goodness of fit of the regression equation, and a higher value indicates a better fit. The Akaike information criterion, or AICc, refers to the modified Akaike information criterion, and its lower value indicates a better fit of the observed data, and if the difference between the AICc values of two models is greater than three, the model with the lower value is the superior model. RRS represents the residual sum of squares, and a lower value indicates that the model can better match the observed data. Bandwidth refers to the amount of bandwidth used for each local estimation in the model, and it determines the degree of smoothing applied to the model [75].
Publisher’s Note: MDPI stays neutral with regard to jurisdictional claims in published maps and institutional affiliations.

