Article

Hierarchical Structure and Organizational Model of County Tourism Network of the Tibetan Plateau

1
Key Laboratory of Regional Sustainable Development Modeling, Institute of Geographic Sciences and Natural Resources Research, Chinese Academy of Sciences, Beijing 100101, China
2
University of Chinese Academy of Sciences, Beijing 100049, China
*
Author to whom correspondence should be addressed.
Land 2022, 11(11), 1880; https://doi.org/10.3390/land11111880
Submission received: 29 September 2022 / Revised: 17 October 2022 / Accepted: 20 October 2022 / Published: 23 October 2022

Abstract

:
Hierarchical structures and organizational models highly affect the sustainable operation of the spatial network of tourism destinations. This paper adopted the modified tourism gravity model and social network analysis method to reveal the spatial characteristics of the tourism network on the Tibetan Plateau based on tourism flow data in 2019. The results are as follows: (1) the spatial organization of tourism flows was unbalanced, showing the characteristics of “high in the east and low in the west”; (2) The county tourism flow formed a multidimensional system of spatial hierarchy with Chengguan District of Lhasa, Golmud City, and Pengzhou City as the top nodes, the spatial polarization characteristics, and zonal distribution differences were evident; (3) The inter-county tourism linkage conformed to the law of distance decay, and the multiple network structure hierarchy features highlighted the complex linkage pattern; (4) The tourism network had a more distinctive dominant flow and was influenced by county-level administrative divisions; (5) The tourism linkage network formed eight subgroups with significant geographical characteristics. This study provides recommendations for optimizing the spatial structure of the Tibetan Plateau county tourism network for the government.

1. Introduction

Counties are not spatially isolated individuals; they are interdependent through various links with different functional divisions of labor and levels of scale. Along with the advancement of globalization, post-industrialization, and the rapid development of tourism, the structure, functions, and relationships of county networks constructed by the flow of people, capital, and information have received increasing attention. As the roof of the world, the water tower of Asia, and the third pole of the earth, the Tibetan Plateau has rich tourism boutique resources, including six world natural heritage sites, three world cultural heritage sites, 16 5A-level scenic spots, and eight excellent tourism cities in China. Additionally, the total tourism revenue of Qinghai Province and Tibet Autonomous Region reached yuan 60 billion (18.85% of GDP) and yuan 56 billion (31.8% of GDP) in 2019, respectively. The tourism industry in the study area has been developing faster in recent years, the tourism transportation conditions and service facilities have improved, and the construction of the world tourism destination has begun to bear fruit. However, based on the perspective of counties, it is true that the tourism economic development on the Tibetan Plateau is very uneven due to different resource endowments, convenient transportation conditions, and ecological security risks, with some even caught in a development “bottleneck”.
Researchers gradually replaced “geospatial flow” with “space of flow” when examining regional spatial relations [1]. As a result, the interpretation of tourism relations from various dimensions through the “flow” data that portrays the connection has become more vivid. In recent years, a considerable amount of literature has been published. These studies have conducted many valuable explorations concerning the spatial network structure of tourism destinations, including stakeholder networks [2], tourism cooperation networks [3], and environmental governance collaboration networks [4]. Tourism networks, as an essential reflection of tourism quality development in spatial layout, are significant for tourism destination performance [5,6,7], and the structural state also affects the healthy development of tourism [8,9,10]. Zhong et al. [11] pointed out that studying tourism network flows can better reveal the spatial relevance of tourism nodes. From the perspective of research objects, current studies primarily focused on tourist attractions [9,12,13,14], tourism economic belts and economically developed provinces [15,16,17,18,19], and countries [20,21], while few have addressed the unique and much-needed spatial scale of counties. Éber et al. [22] dedicated an in-depth analysis to improve the effectiveness and efficiency of the tourism system. In addition, Tao [23], Miao, and Zeng [24] explored the structural characteristics and spatio-temporal evolution of the tourism economic linkage network for Hunan counties in the Wuling Mountains area and Hubao-Egyu city cluster counties, respectively. From the research methods perspective, anchor point theory [25], gravity model [26,27], social network analysis [28,29,30,31,32], and tourists’ digital footprint [33,34] were mainly used. Gan et al. [35] combined the tourism gravity model and social network analysis to study the tourism economic network in the middle reaches of the Yangtze River urban agglomeration in China, found that the spatial network structure was looser, and made suggestions for optimization. Based on the modified gravity model, Zhou and Wang [27] found that China’s spatial network structure of inter-provincial tourist flows is hierarchical. So far, there has been little discussion about the tourism flow in Tibetan Plateau.
Theoretical studies and practical applications on tourism destinations at home and abroad involve many fields, from early tourism destination image, positioning, and marketing [36,37,38,39,40], gradually expanding to competitiveness, life cycle, conflict of interest, management, and development [41,42,43,44,45], while the study of the tourism destination network spatial structure has been receiving attention in this development process [46,47,48]. Regarding the tourism development on the Tibetan plateau, several attempts have been made concerning traditional areas, such as development models, environmental effects, tourism safety risk assessment, and tourist activity patterns [49,50,51,52,53]. In addition, the study area has become a typical objective for large-scale tourism destinations and complex spatial network structures with advantageous conditions such as rare tourism resources and rapid development of self-drive tourism. Chen et al. [54] studied the tourism flow network and its driving factors on the Tibetan Plateau municipal spatial scale. Zhu et al. [55] took the inbound tourism flow network as the research object and, from the perspective of comparative analysis of group tours and self-guided tours, revealed the structural characteristics and organizational patterns of Tibetan networks. Chen et al. [56] proposed that the Tibetan Plateau includes two primary ecotourism network systems and eight secondary ecotourism network systems based on resource surveys. However, more detailed studies at the county level are still to be filled out.
The construction of a world tourism destination is an important strategic goal for the Tibetan Plateau. This paper selected counties as the entry point based on the fact that the Tibetan Plateau in China accounts for more than 1/4 of the total land and has unique features compared with traditional tourism destinations, which are reflected in the spatial large-scale scenic area based on natural and humanistic environment, iconic tourism landscape as the core attraction, counties as tourism service bases, and tourism corridors as string guides. World-class scenic areas and counties with better tourism infrastructure and transportation conditions have become regional tourism distribution centers and spatial network nodes. As the basic spatial unit, counties’ tourism network structure and spatial organization mode need to be explored. What is the status of the tourism network in the county? What are the tourism links between counties? Is the tourism spatial layout model appropriate? It is crucial to answer these questions.
It is also beneficial to grasp the law of tourism economic development in counties, actively promote the construction of the world tourism destination, and achieve sustainable tourism development. Furthermore, the county tourism industry is a crucial carrier of regional economic development. A correct understanding of structural characteristics can provide helpful information for strengthening the exchange and cooperation of tourism economic activities between counties and improving performance management. Thus, we adopted the social network analysis method and the tourism gravity model to sort out the spatial structure characteristics, organization pattern laws, the differences of roles in the county tourism network, and the spatial interaction of tourism links between counties, aiming to provide a reference for effectively promoting the construction of the world tourism destination on the Tibetan Plateau, and dedicated to enriching the county tourism network system.
This paper is composed of five parts. It begins by laying out an introduction and literature review. The second part concerns the study area, data source, and research methods. The third part presents the empirical results of the study. The fourth part discusses the findings, and the final part draws upon the paper and presents future recommendations.

2. Materials and Methods
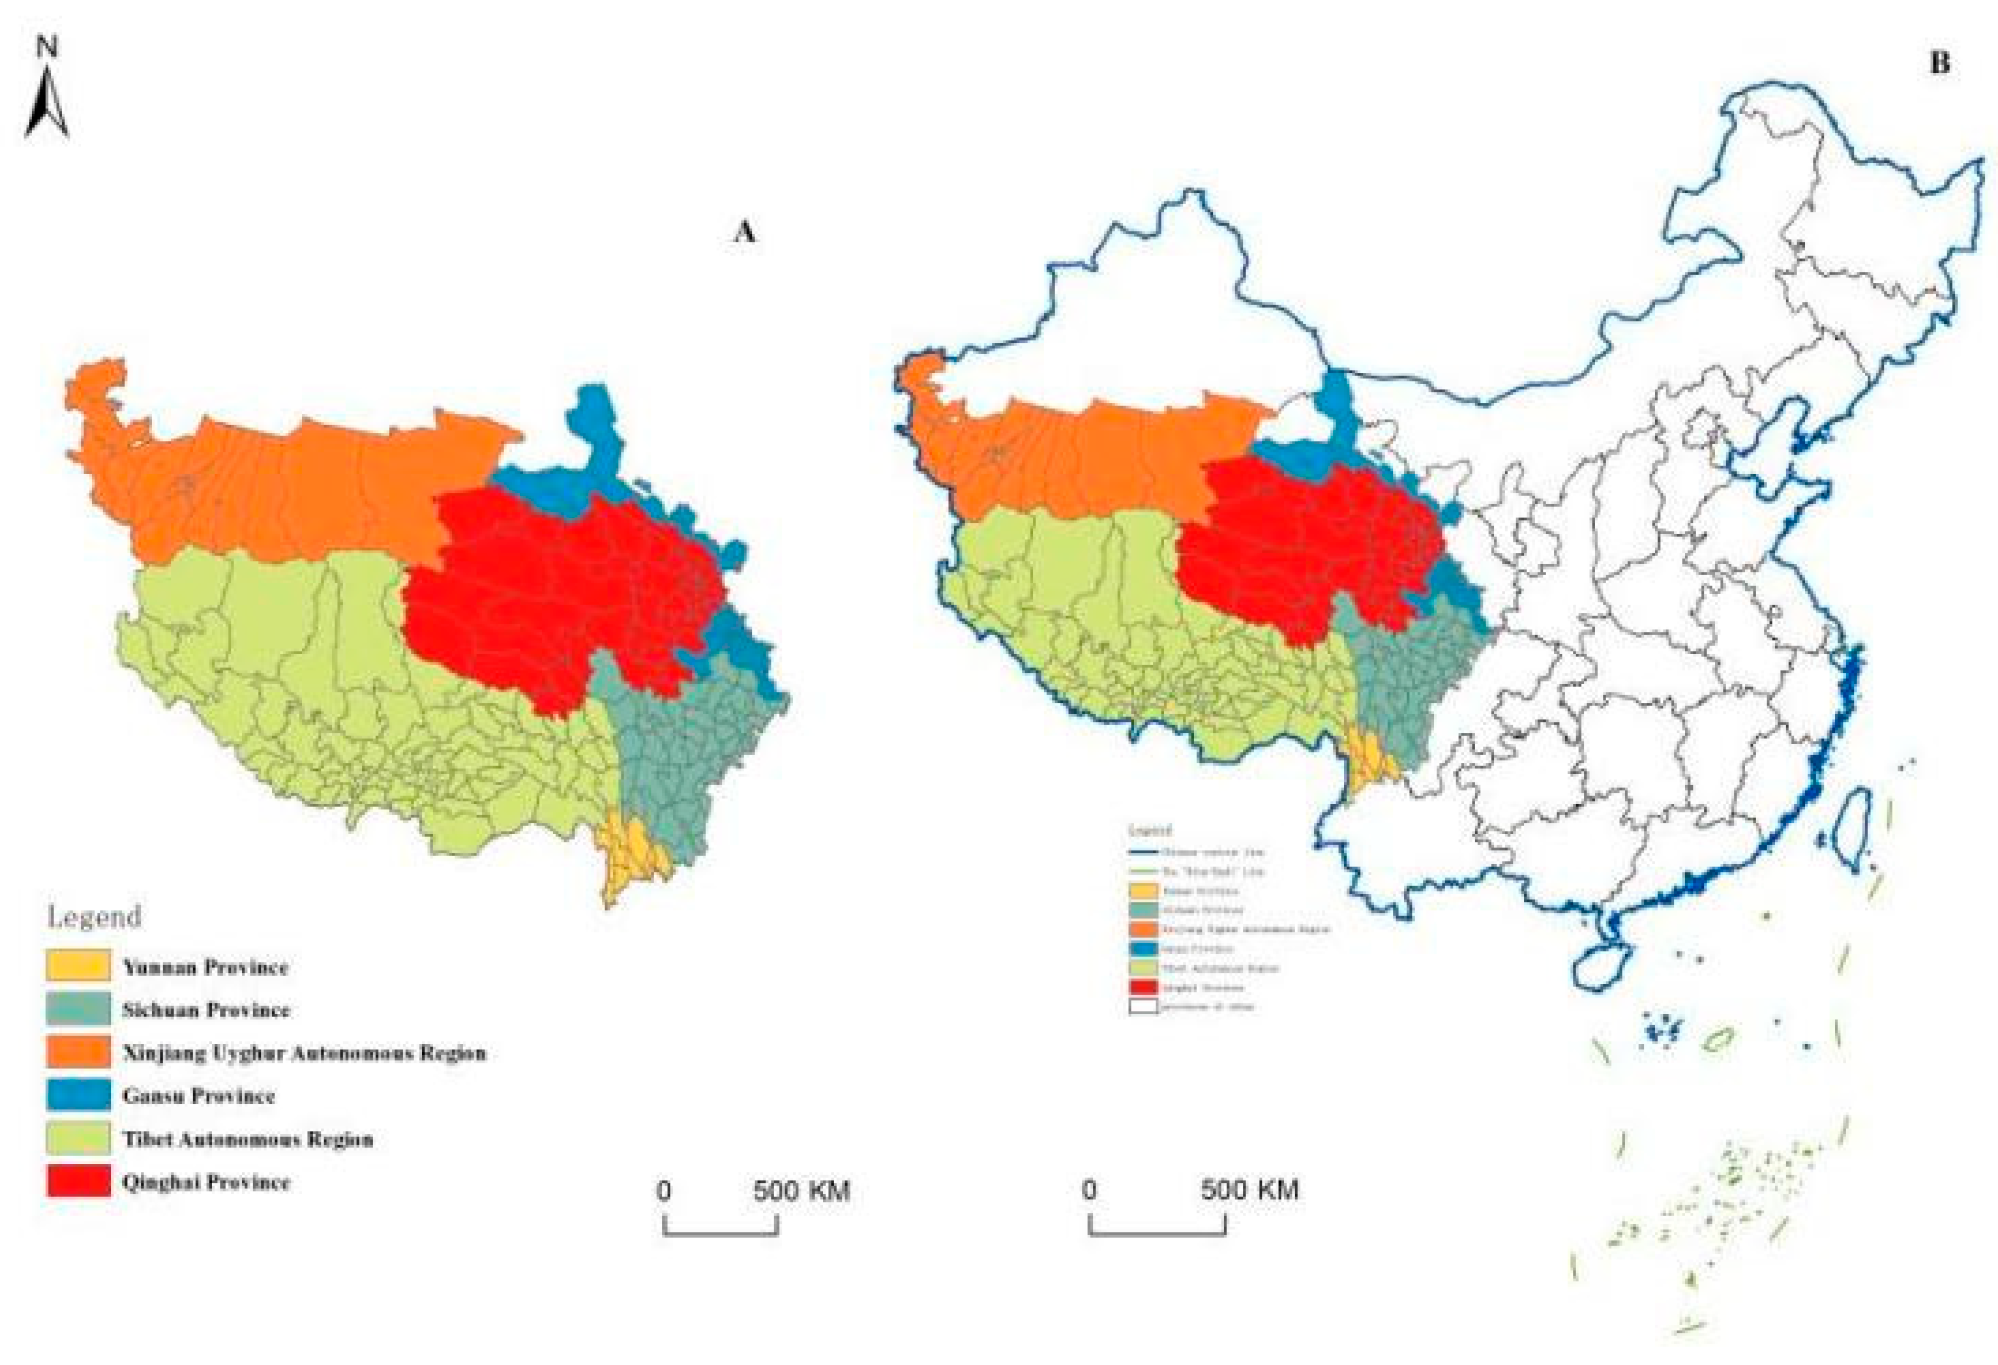
2.1. Study Area

The study area is the Tibetan Plateau, located in the southwestern part of China, with an area of about 2,580,900 km2 and an average altitude of about 4400 m. It is distributed into six provinces, including the Tibet Autonomous Region, Qinghai Province, Gansu Province, Sichuan Province, Yunnan Province, and Xinjiang Uyghur Autonomous Region [57]. Considering the integrity of administrative divisions, comprehensive tourism activities, and non-overlap of socioeconomic data with primary geographic data, counties on the edge of the Tibetan Plateau were also included, which contain a total of 214 counties, including 74 in Tibet, 47 in Sichuan, 45 in Qinghai, 23 in Gansu, 15 in Xinjiang, and 10 in Yunnan (Figure 1). Since China’s county-level administrative regions include multiple types, this paper is used 1 for municipal districts, 2 for county-level cities, 3 for counties, and 4 for autonomous counties.

2.2. Data Source

In this paper, 214 counties on the Tibetan Plateau are taken as research objects to explore the structure and organization model of the tourism network with the modified tourism gravity model. The required data are mainly tourism revenue, number of visitors, geographical distance, and GDP. The tourism data came from “The National Economic and Social Development Statistical Bulletin (2019)”, “The Government Work Report (2020)”, and “The Second Tibetan Plateau Scientific Expedition”. The data on regional GDP was obtained from the “China County Statistical Yearbook (2020)”. The shortest geographical distance between counties was retrieved through the open platform of Baidu Map (https://map.baidu.com/, accessed on 20 June 2022). The primary geographic data were derived from the National Tibetan Plateau Third Pole Environment Data Center (http://data.tpdc.ac.cn/, accessed on 11 March 2022).

2.3. Research Methods

2.3.1. Tourism Gravity Model

The gravity model was based on Newton’s classical law of gravity and has been widely used by academics as a model of spatial interactions. Zipf [31] first proposed the primitive gravity model with Rij = (Mi × Mj)/Dbij, and Crampon [58] introduced the gravity model into tourism research to measure tourism flows between two places. Geographers have since modified it and applied it to the study of tourism economic linkages [59]. To serve this study, a modified tourism gravity model was used to construct the tourism economic linkage intensity (Rij) and total tourism linkage (Ti) concerning existing studies [18,23], and a 214 × 214 directed binary matrix was built to study the county tourism linkage network in 2019 on the Tibetan Plateau.

2.3.2. Social Network Analysis

The social network analysis method seeks to describe the network interactions among actors by modeling the relationships between objects and has been widespread in studying the formation, evolution, connections, and interactions of spatial tourism structures [9,28,60,61,62]. With the UCINET 6.645 software, following the principles of retaining valid information and comparability and combining with the requirements of relationship data needed for social network analysis, the degree centrality (CD), betweenness centrality (CB), and network density (D) indicators were selected to examine the spatial structure characteristics of the tourism network in the Tibetan Plateau counties. Also, the Concor algorithm was applied to construct cohesive subgroups. It could better identify tourism linkage network ties by depicting clustering patterns and functional structures and reveal the formation of small group clusters with strong or “reciprocal” tourism ties in the region. Table 1 presents these formulas.

2.3.3. Dominant Flow

Dominant flow is often used in the study of city network organization patterns [64,65]. Specifically, at the county level, it refers to the linkage between the counties with the enormous interactive tourism flow with a county and is used to reflect the backbone linkage of county tourism. The dominant flow intensity is defined as the ratio of the dominant tourism flow of a county to its total throughput, reflecting the dependence of each county on its first county.

3. Results

3.1. Hierarchical Structure of Tourism Network on the Tibetan Plateau

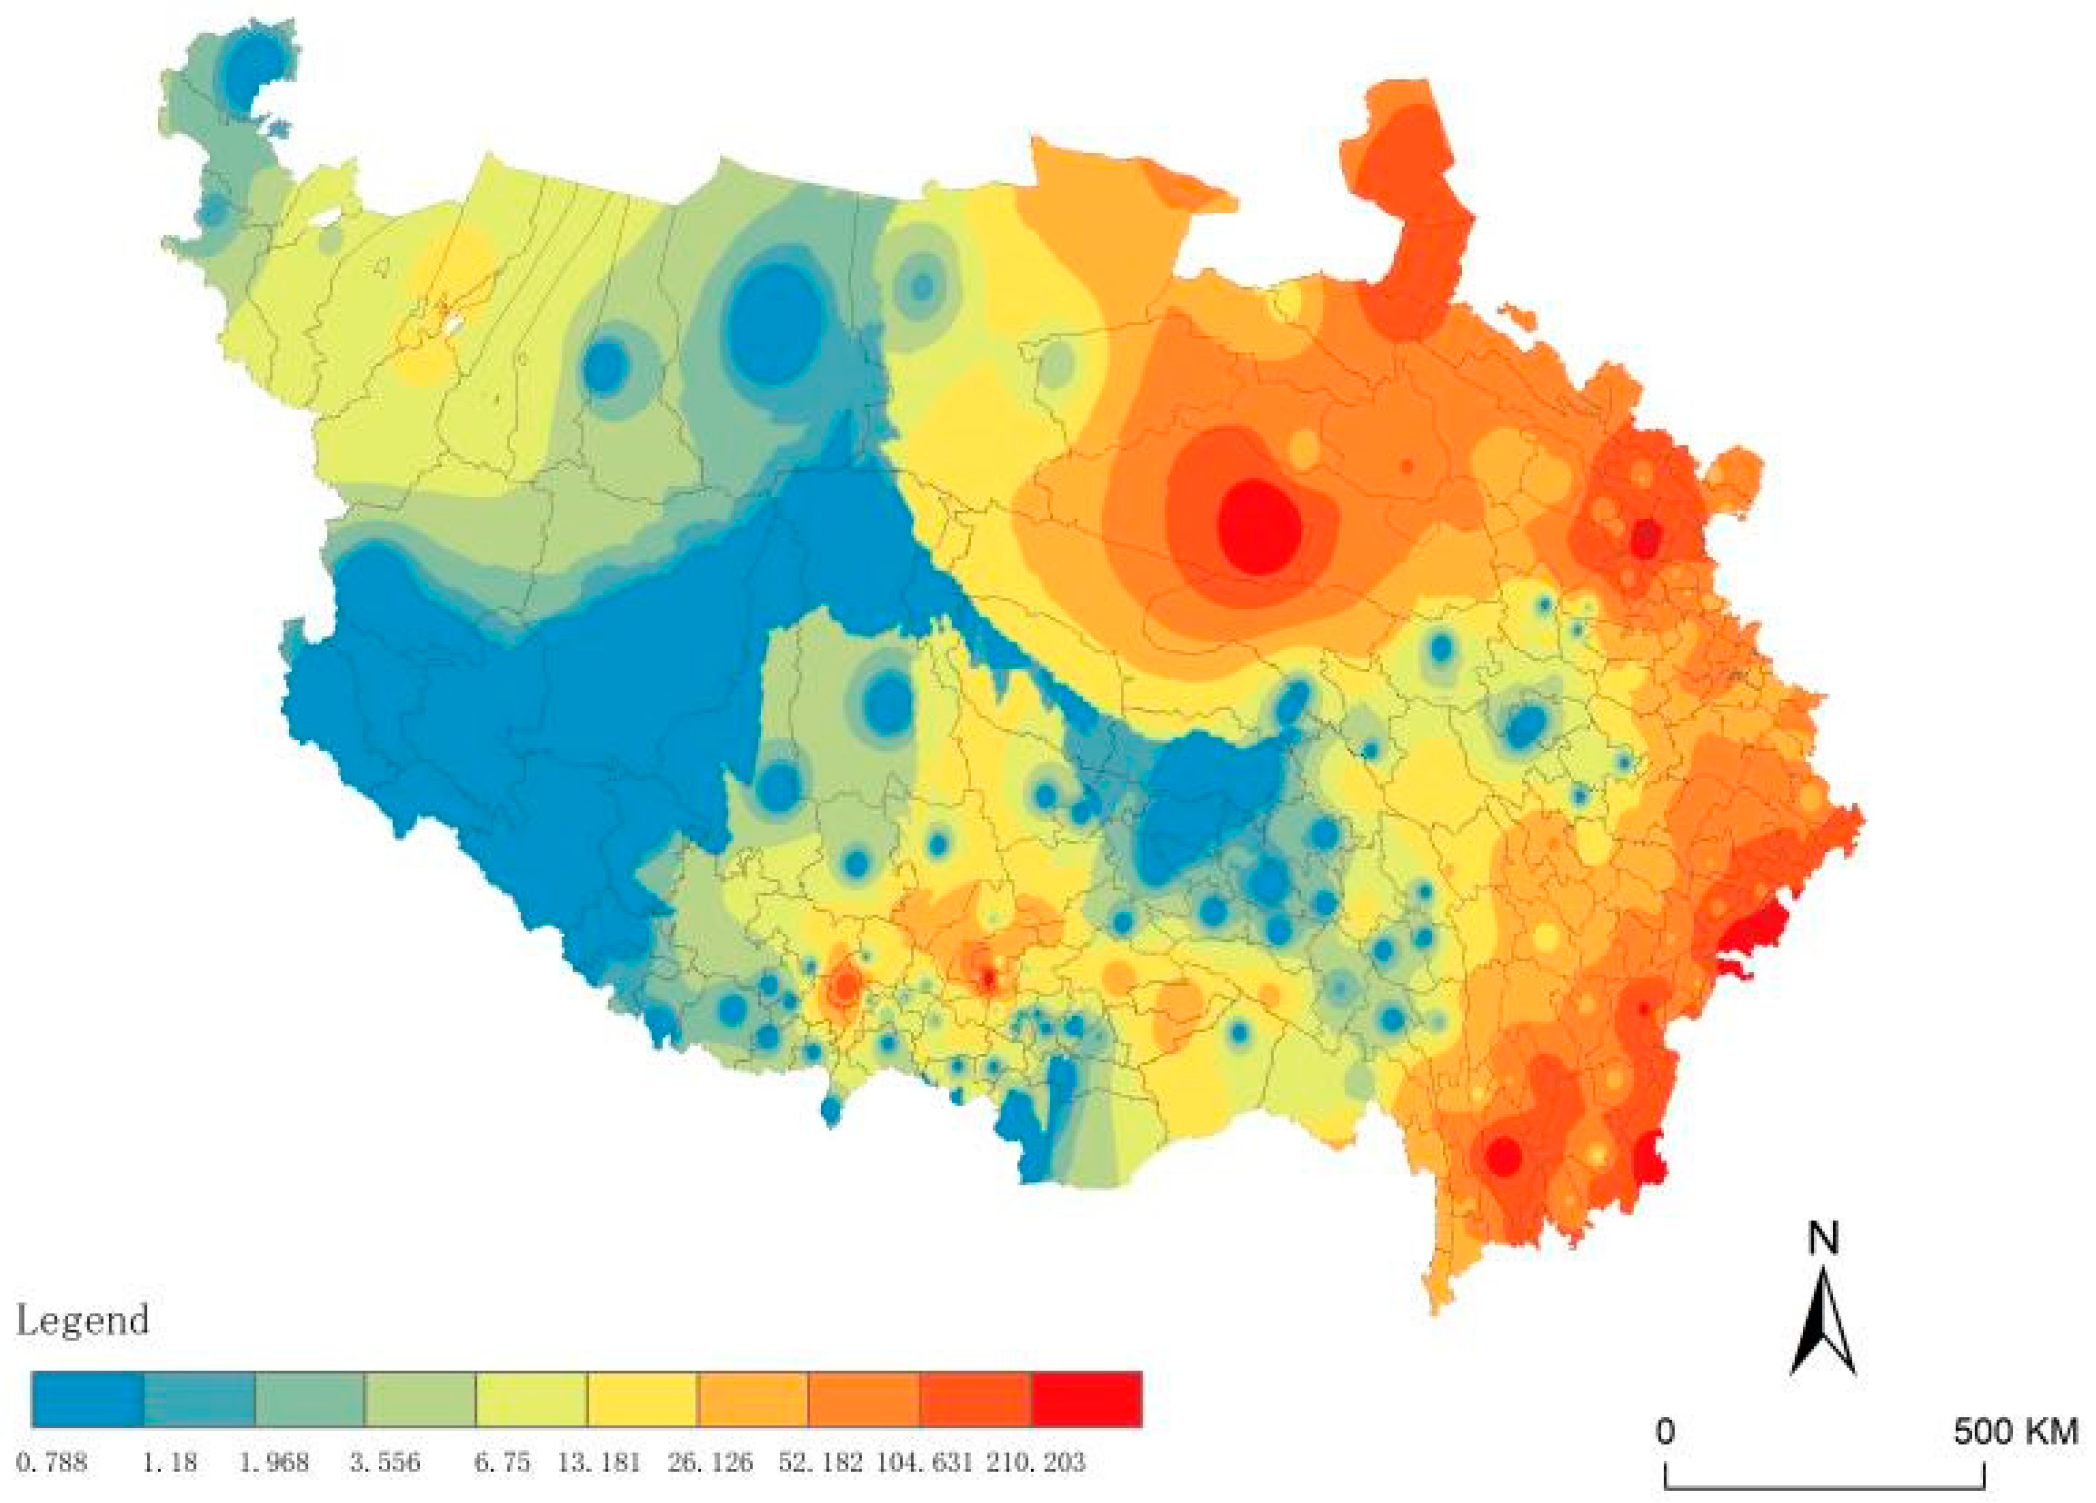
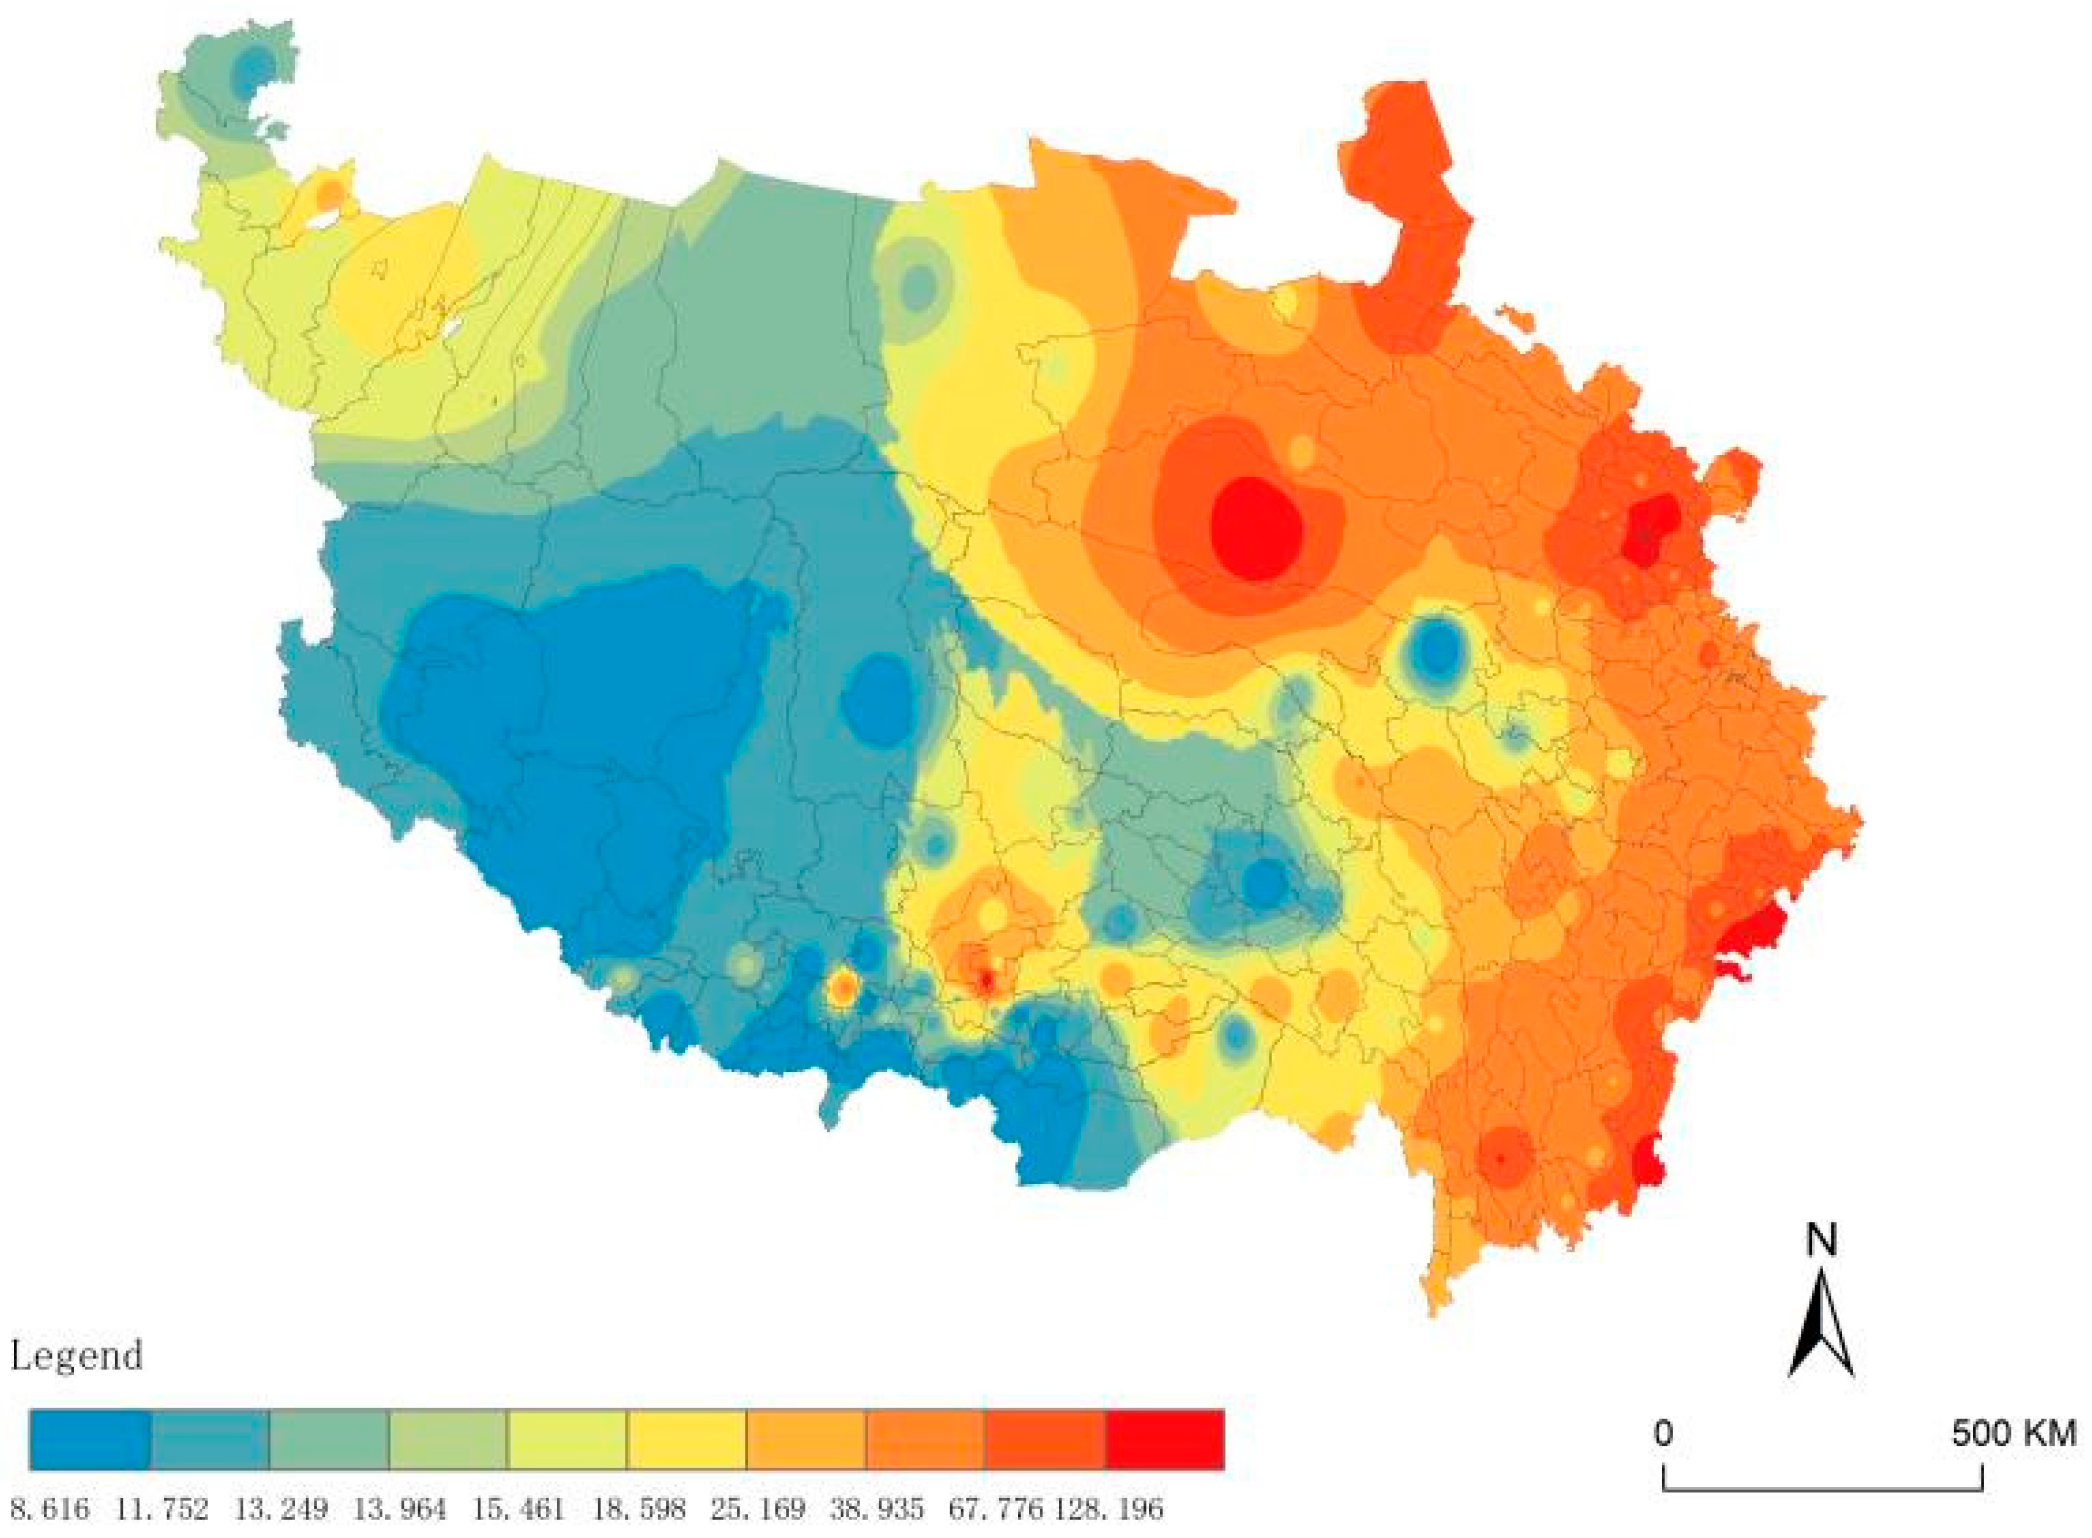
3.1.1. County Tourism Nodes

(1) Individual Network Characteristics
(i) Degree Centrality
Using the inverse distance weight spatial interpolation method, the clustering and diffusion characteristics of nodes in the Tibetan Plateau county tourism network in 2019 were expressed visually. As can be seen from Figure 2, the high-value nodes of out-degree centrality were concentrated in Xichang 2, Dujiangyan 2, Pengzhou 2, Chengguan 1 of Lhasa, Golmud 2, Dayi 3, Shifang 2, Chengxi 1 of Xining, Mianzhu 2, Shangri-La 2. The low-value nodes were mainly distributed in Tibet and counties under the jurisdiction of Golog and Yushu Tibetan Autonomous Prefecture, presenting a “bow-and-arrow” pattern with the urban areas of cities and traditional counties of tourism development as the center, driving the geographically adjacent counties. The regional distribution characteristics of in-degree and out-degree centrality showed a high degree of consistency, with a decreasing feature from the east to the west (Figure 3). In summary, the county tourism linkages network of the Tibetan Plateau has developed in terms of scale and connectivity, and the core growth poles, which integrate agglomeration and diffusion effects, have initially formed.
(ii) Betweenness Centrality
The dynamic capacity characteristics of nodes in the tourism network were visually expressed by applying the inverse distance weight spatial interpolation method. As seen in Figure 4, a few core counties control the main channels of tourism linkages in the whole region of the Tibetan Plateau and influence the exchanges and cooperation of other surrounding counties, forming a “multi-core” spatial distribution pattern. Affected by the level of economic development and transportation location, the betweenness centrality of county nodes in the northwest and east-central regions was still low, and the spatial barrier effect was significant.
Chengguan 1 of Lhasa, Pengzhou 2, and Golmud 2 are the three highest nodes, which become the most powerful controllers of the network and form circling radiation, reflecting that the core intersection of multiple tourism corridors easily generates high intermediate centrality nodes. Among them, Chengguan 1 is the center of Tibet’s politics, economy, culture, transportation, communication, and education. It is also the most developed area of Tibet’s religion and culture, with famous monuments such as the Potala Palace, Dazhao Monastery, and Lop Noringa. It is located at the junction point of many self-driving tour routes, including the Sichuan-Tibet Line, Xinjiang-Tibet Line, and Qinghai-Tibet Line, and is the ultimate destination for tourists from home and abroad. Secondly, Pengzhou2 is the northward transportation gateway hub of Chengdu and the demonstration city of national culture and tourism consumption, in the core area of the half-hour economic circle of Chengdu, in the vital position of west Sichuan tourism loop, with solid tourism reception capacity and high tourism accessibility. Last, Golmud2 is the strategic stronghold of Qinghai connecting Tibet, Xinjiang, and Gansu and the transportation hub of western China, where the three highway trunk lines of Qinghai-Tibet, Qingxin, and Dunge intersect, with the source of Yangtze River, Kunlun snowscape, sunrise over the vast sea, desert forest, and other natural landscapes.
(iii) Total Number of Tourism Links
To sort out the spatial hierarchy system of county tourism destinations, according to the principle of minor differences within and significant differences between groups of total tourism links (Ti), the county tourism network nodes in the Tibetan Plateau are divided into four types (Figure 5), ① Strong center (Ti ≥ 1000). It consists of the six counties of Chengxi 1, Chengbei 1, Chengzhong 1, Chengdong 1, Pengzhou 2, and Dujiangyan 2. ② Sub-strong center (100 ≤ Ti < 1000). There are 22 of them, including Xichang 2, Shifang 2, Dayi 3, Wenchuan 3, Yulong Naxi 4, Chengguan 1, Mianzhu 2, Gucheng 1, and other traditional tourism counties. ③ Medium-strong center (10 ≤ Ti < 100). Including 31 of Guide 3, Huangyuan 3, Dazi 1, Yangyuan 3, Luding 3, Shangri-La 2, Songpan 3, Danba 3, Hongyuan 3, Golmud 2, Jiuzhaigou 3, Markang 2, Ruoergai 3, etc. ④ Subordinate counties (Ti < 10). The number of counties in this category is 155, including Hualong Hui 4, Sunan Yugu 4, Minle 3, Wen 3, Lintan 3, Luqu 3, Diebu 3, Gulang 3, Langtang 3, Langkazi 3, Qiongjie 3, Jilong 3, Ruoqiang 3, Pulan 3, and Qumalai 3, etc., which dominate the number in the network.
The nodal status and location of counties at each level in the tourism economic linkage network had a high correlation and presented spatial polarization characteristics and noticeable zonal distribution differences. Specifically, ① strong center counties are all city districts and county-level cities that play an important regional hub role, distributed in the eastern part of the Tibetan Plateau, occupying 70.53% of the network’s tourism flow. ② Sub-strong center counties are mainly distributed in the northeast, southeast, and southwest areas, showing the significant characteristics of spreading to neighboring areas based on the location of strong centers, and the sub-center role of Chengguan 1 and Duilongdeqing 1 of Lhasa City has emerged. ③ Medium center counties are concentrated along the tourism lines of the Gansu-Qinghai Line, Yunnan-Tibet Line, Sichuan-West Line, and Sichuan-Tibet Line, and the Golmud 2 of Haixi Prefecture performed well in the northwestern region. ④ Subordinate counties are mainly distributed in the central and western regions, accounting for 72.43% of the number, but the least amount of flow, only about 1% (Figure 6).
Thus, it can be seen that in the construction of county tourism destinations on the Tibetan Plateau, the core counties gave full play to the node effect in the tourism network under their location advantages, prompting a steady increase in the volume of external county links and excellent tourism organization. In contrast, the tourism links of peripheral counties were still in a relatively weak position, which may form an unfavorable negative cycle of accumulation.
(2) Overall Network Characteristics
Based on Equation (5), the network density (D) value was measured to be 0.133, indicating that the overall cohesiveness of the network structure was low and had the potential for further development.
The study of the degree centrality, betweenness centrality, total number of tourism links, and network density of 214 counties helps to comprehensively understand the unique advantages, comprehensive positions, and future enhancement directions of different counties in the tourism network in the Tibetan Plateau. It provides an essential reference for the construction of world tourism destinations. Taking Chengguan 1 of Lhasa as an example (Figure 7), the tourism development of this area is located in the critical central position of the network with solid control ability. However, the tourism organizational ability needs to be improved, which has an important relationship with geographical conditions, traffic location, economic level, and other factors. The future development should focus on improving tourism facilities, strengthening the close connection with the surrounding areas, and broadening the tourism interaction with middle-long distance areas. Due to the space limitation, only the top 50 counties out of the total number of tourism links (Ti) were selected for drawing.

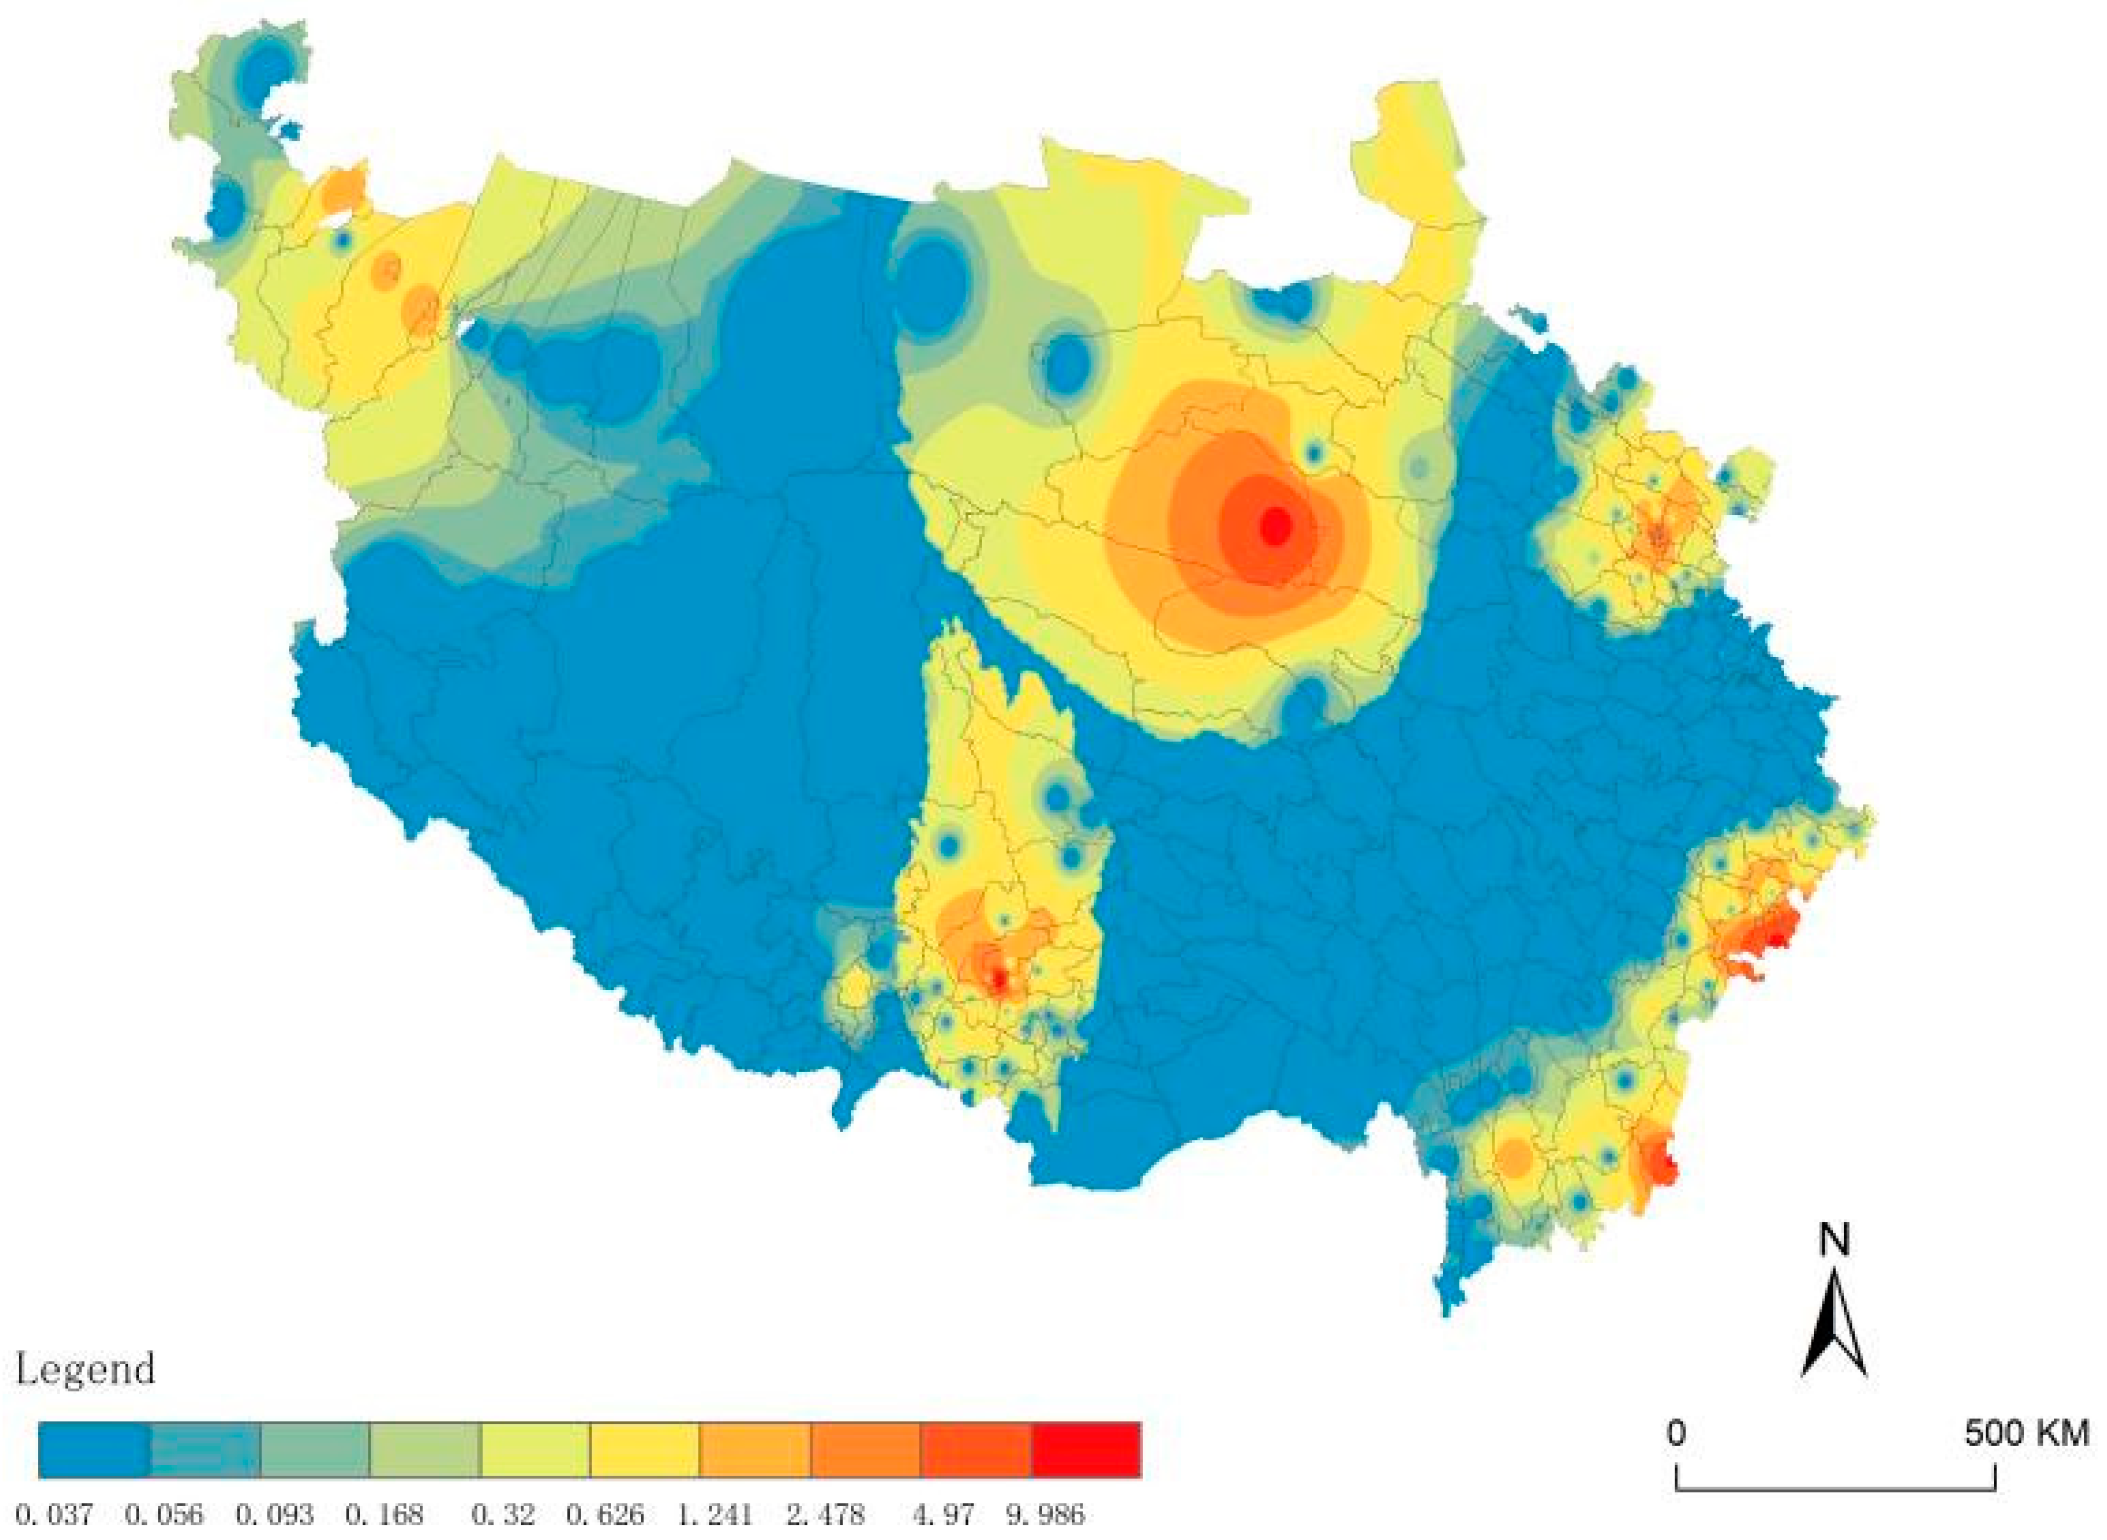
3.1.2. Inter-County Tourism Links

(1) Distance Decay Law
The tourism flow distribution rate can reflect the spatial relationship between flow proportion and distance segments from the side and visualize the decay pattern. In 2019, the sensitivity of the Tibetan Plateau county tourism linkage network to distance changes was relatively high. Regarding distance (Figure 8), 86.58% of inter-county tourism flows were concentrated in the range of 0–200 km, reflecting the overall high number of short and medium distances. The distribution rate showed a trend of rapid growth followed by a rapid decline, with tourism flows peaking in the 0~100 km band, accounting for 78.52% of total tourism flows. It then presented an overall decline with increasing distance, only rising slightly in the 700~800 km band.
(2) Spatial Hierarchy
According to the classification principle of significant differences between groups and minor differences within groups, this paper divided the number of tourism links between “county pairs” into five levels of links. Due to the network’s complexity and space limitation, the III-level linkage and the top 10% of the V-level linkage were selected for the visualization (Figure 9).
(i) I-level linkage: including 16 “county pairs”, forming a multi-core structural system consisting of several districts of Xining, Yulong Naxi 4, Dujiangyan 2, Pengzhou 2, Xichang 2, Yulong Naxi 4, Chengguan 1, and other neighboring regions. Among them, the intensity of “county-to-county” linkage in Chengxi 1-Chengbei 1 was the most prominent.
(ii) II-level linkage: including 86 “county pairs”, expanding based on level I linkage, expanding the spatial influence of the central network nodes, formed a “three-legged” sectoral distribution of small group networks under the influence of spatial proximity effect. However, the independence among small groups was substantial.
(iii) III-level linkage: including 331 “county pairs”, county radiation capacity was enhanced, and the distribution range was further expanded and refined. The cross-regional links between the northeast part of the Tibetan Plateau (with Xining city district as the core), the southeast part (Dujiangyan 2, Xichang 2, Lijiang 2, and other multi-core), and the southwest region (with Chengguan 1 as the core) have taken shape. The trend of forming a network has emerged, consolidating and strengthening the original linkage pattern.
(iv) IV-level linkage: including 5617 “county pairs”, accounting for 12.32% of the total, forming a “bow and arrow” distribution pattern. The Gannan-Chuanxi line, Sichuan-Tibet line, Yunnan-Tibet line, and other tourism corridors have become prominent. The network has added several cross-regional links, and the density of small groups rapidly increased. Through the north-south tourism flow links, the eastern region showed increased density, and northwest of the radiation diffusion capacity was enhanced.
(v) V-level linkage: including 39,532 “county pairs”, accounting for 86.73% of the total, the tourism linkage network was extensive in scale, with a large number of new nodes in small and medium-sized cities, and the network connectivity was greatly improved, forming the bottom linkage pattern of the county tourism network in the Tibetan Plateau. Influenced by distance decay and geopolitical relations, the northwestern regions remained less connected to the central-eastern.

3.2. Organizational Model of Tourism Network on the Tibetan Plateau

3.2.1. Dominant Flow

It is found that there are 22 primate counties in the Tibetan Plateau tourism linkage network, showing a polycentric distribution pattern (Figure 10), and the radiation range was constrained by administrative boundaries, forming several independent territorial systems in space. In addition, most districts and county-level cities assumed the functions of the dominant flow counties. Still, their influence capacity was limited, and the radiation range had distinctive territorial and spatial proximity structure characteristics. The top five primate counties (Pengzhou 2, Chengguan 1, Chengxi 1, Golmud 2, and Xichang 2) collected more than 87% of the nodes, and the spatial scope mainly covered the eastern and southern regions. The dominant flow and the rest of the links work together in the territorial organization pattern of the tourism network, forming an orderly hierarchical association system.
According to the dominant flow strength, all “county pairs” were divided into four types (Figure 10, Table 2), and it can be found that: ① The number of strong links in the network is small, with weak links being the main ones, and the average dominant flow strength is 0.377. Among them, Pengzhou 2 and Chengguan 1 have 66 and 56 pairs of primary ties, respectively. At the same time, other counties are more dependent on them, followed by Chengxi 1 (37 dominant flow pairs), Golmud 2 (14 dominant flow pairs), and Xichang 2 (14 dominant flow pairs). ② The two ends of the “county pairs” that are the primate counties of each other are defined as coupled links with a deep symbiotic relationship of interdependence. In the tourism linkage network of the Tibetan Plateau, including Chengbei 1-Chengxi 1, Chengguan 1-Duilongdeqing 1, Golmud 2-Autonomous Region, Gucheng 1-Yulong Naxi 4, Pengzhou 2-Shifang 2, Xichang 2-Mianning 3, etc. nine pairs of coupling links, essentially formed a regional center area corresponding to the secondary center of the “point—axis—spoke” linkage pattern.

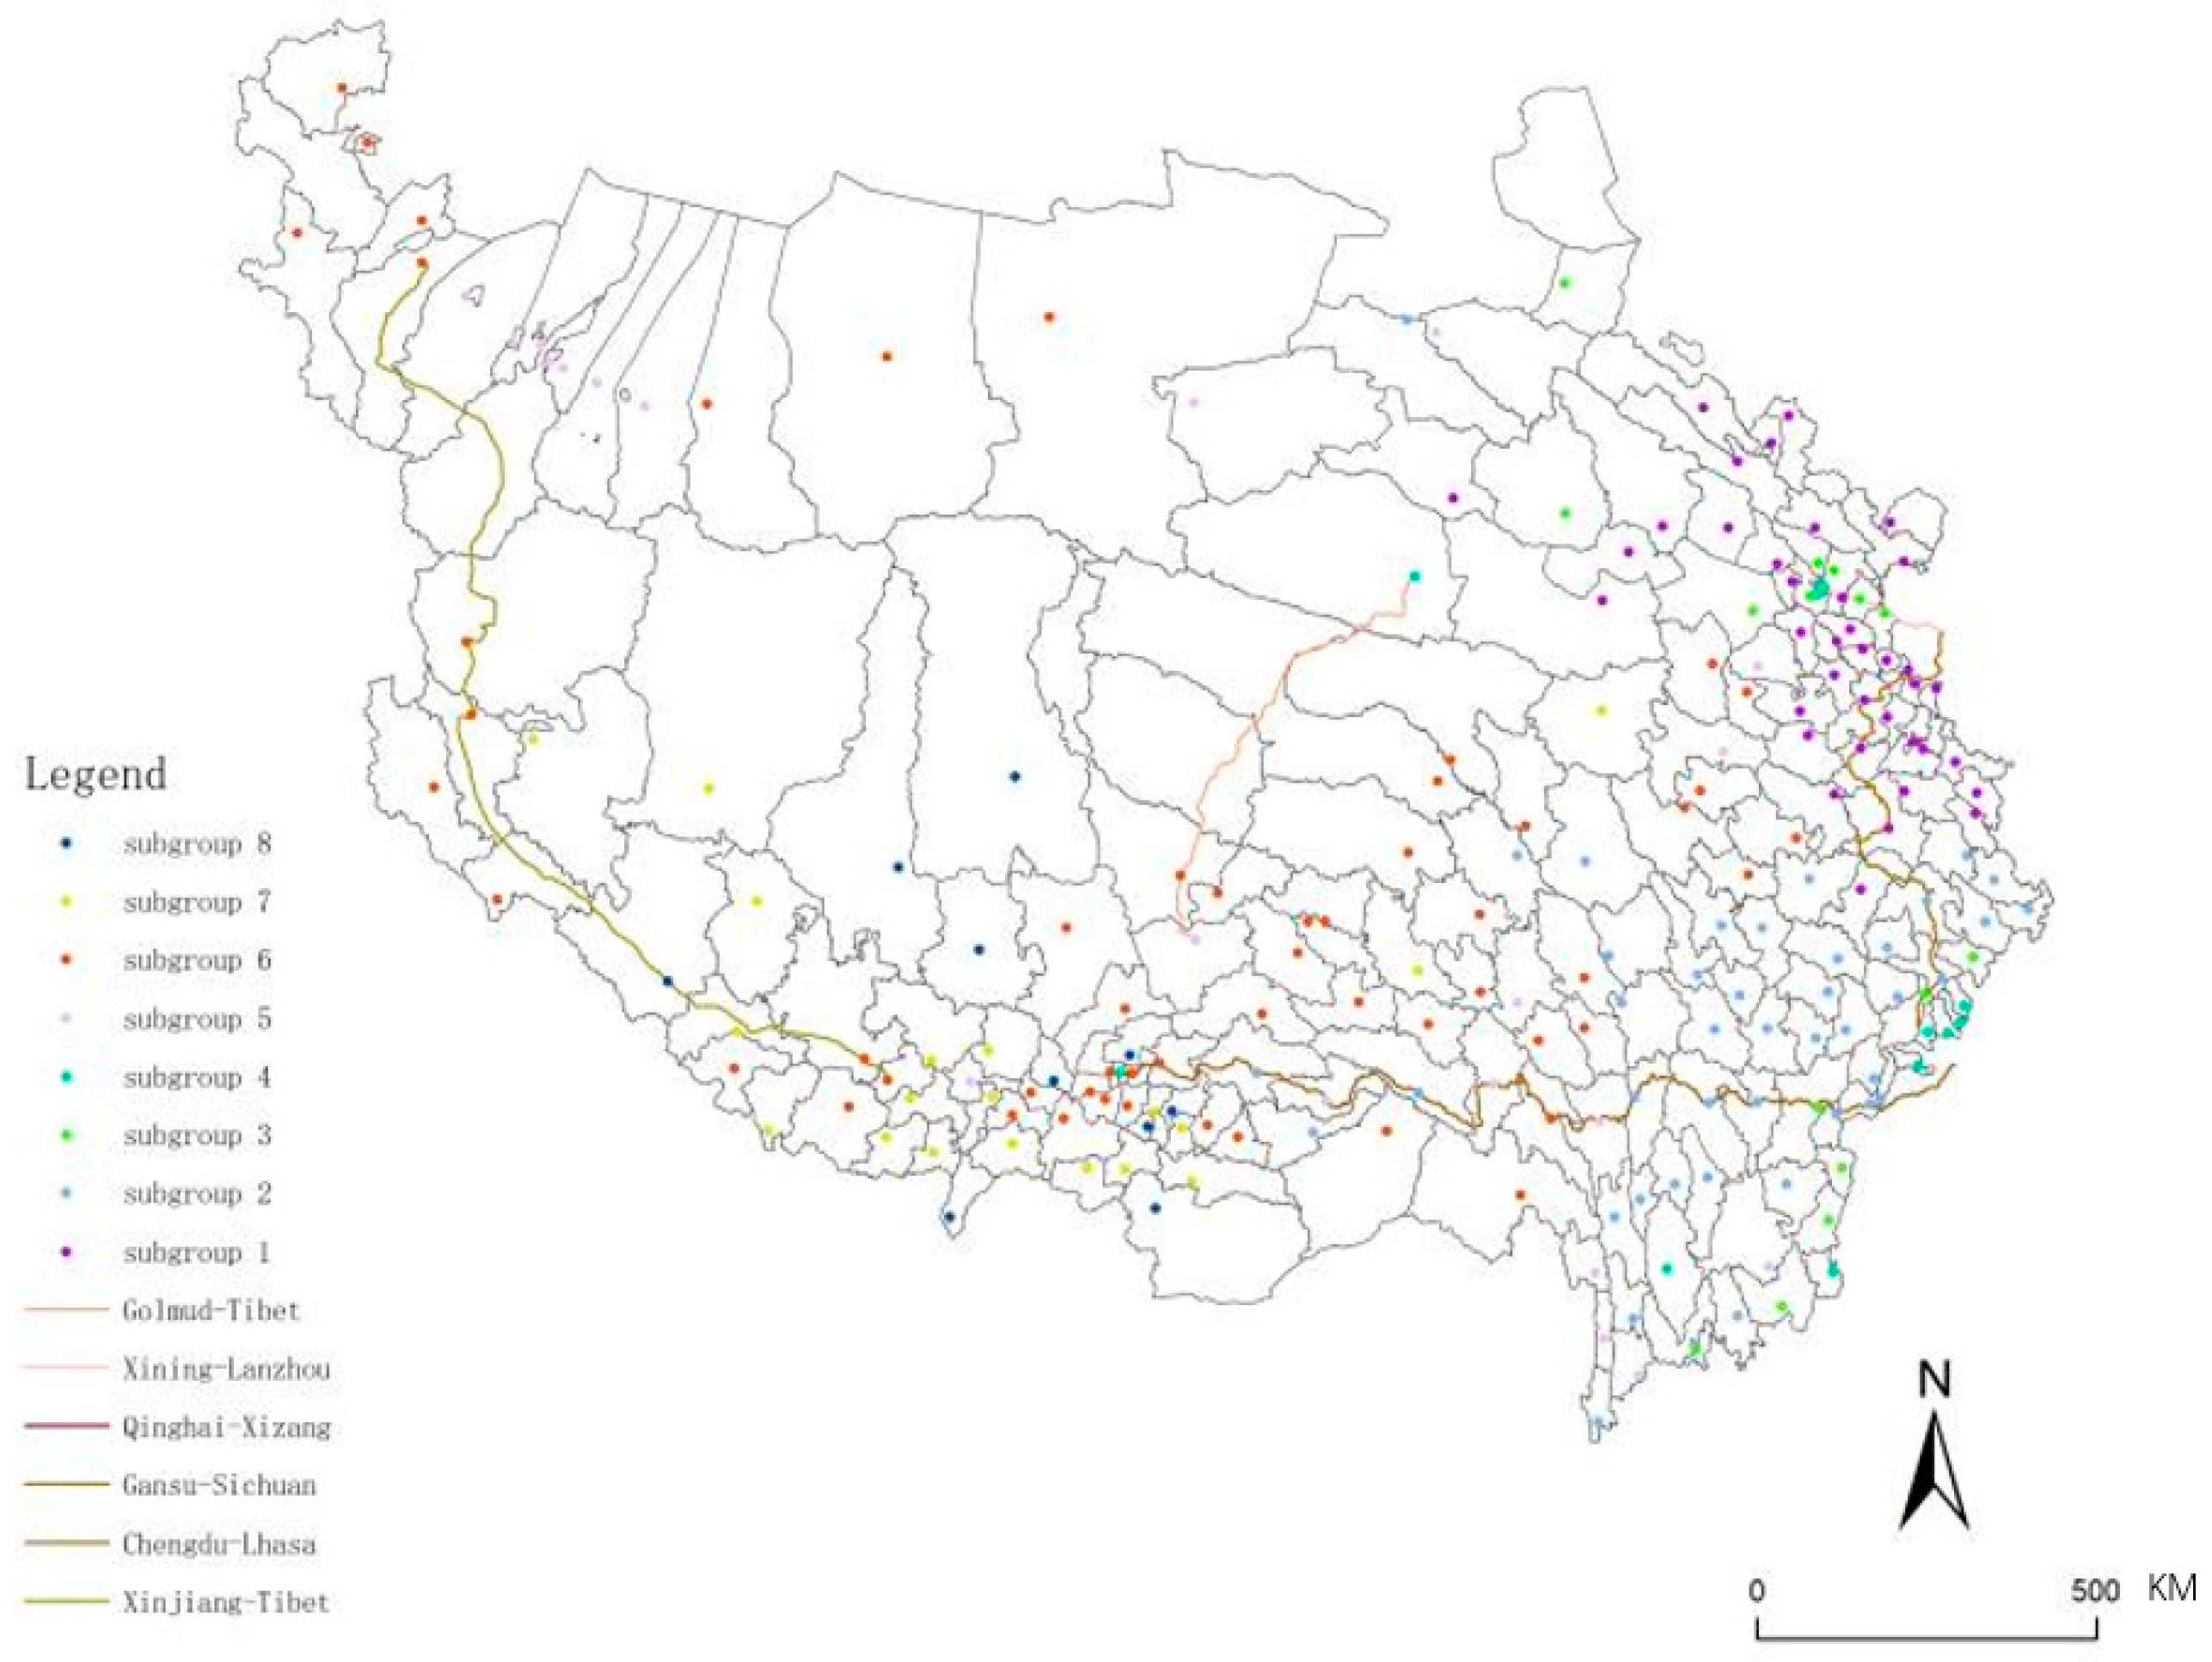
3.2.2. Community Structure

The community structure helps examine the county network’s stability and clustering characteristics from the tourism flow perspective. Overall, the county tourism linkage network on the Tibetan Plateau in 2019 showed significant hierarchical distribution characteristics and clusters into eight cohesive subgroups at four levels (Table 3). Subgroup 4 had a stable pattern, containing all the strong center counties, with Dujiangyan 2, Pengzhou 2, Shifang 2, Xichang 2, Dayi 3, and Chengguan 1 as the apex, forming a polygonal structure, followed by subgroup 2 and subgroup 3. The three subgroups account for 81.25%, 6.5%, and 5.3% of total tourism flows. In addition, the mean value of total tourism linkage can reflect the average sharing capacity of tourism flow in each subgroup, with subgroup 4 being the most prominent and subgroups 7 and 8 having the least sharing capacity.
In the tourism network, most subgroups were located on the route loop or within the envelope and significantly influenced by the tourism corridor effect (Figure 11). Subgroup 1 brought together the central tourism counties in the “Gansu-Qinghai Grand Loop”; subgroups 2 and 6 were located along the Shangri-La Grand Loop and the Qinghai-Tibet-Xinjiang Loop, respectively. Subgroup 4 formed the core growth pole group with strong linkage, and sub-group 3 was its further extension and played an essential role in the network, and the two subgroups formed the eastern growth group. Relying on the “center-hinterland” structure, the hinterland group of the eastern growth cluster formed by subgroups 1 and 2 resulted from the strong center, further spreading its influence and radiation. Subgroup 5, on the other hand, was influenced by geopolitical relations, with a more dispersed spatial location and limited cohesive capacity, and cannot yet form a vital tourism “flow space”. Subgroups 7 and 8 have formed the relatively independent Tibetan Group, although the number of tourism links was small. In terms of the mean value of total tourism links, the vertical structural gradient of the tourism network was incomplete, and the middle-tier counties were missing.

4. Discussion

The primary purpose of this paper is to explore the hierarchical structure and organizational model of the Tibetan Plateau tourism network. Although tourism network structure has been widely studied [14,15,16,17,25], few studies examine tourism linkage networks from the perspective of counties at home and abroad [23,24].
First, the study showed that the center nodes of the tourism network on the Tibetan Plateau are mainly in Lhasa city, Xining city, Golmud, Xichang, and Pengzhou, forming a spatial pattern of “big five corners” from west to east, presenting the topological structure characteristics of both hierarchical hierarchy and distribution. The high-centered nodes are mainly from the “eastern” counties, and the “western” counties are less selected, with a significant “east-west division” and uneven spatial development of tourism networks, which is consistent with the existing literature [55,56].
Second, the study revealed that Chengguan District, Chengxi District, Golmud, and Pengzhou were the leading counties in the network system. In this regard, a certain degree of overlap existed between centrality and dominant flow. Besides, the number of counties as core nodes was small but influential, there was an obvious “position order-scale” characteristic, and the radiation-driven role of the central tourism nodes needed to be further strengthened.
Furthermore, cohesive subgroup analysis identified a community organization model with polarized characteristics in terms of interactivity and influence of grouping. At the same time, Tibet regions formed groups alone and with low-intensity tourism ties [56]. Research on the current structure also revealed that the vertical structure of the Tibetan Plateau tourism network gradient is incomplete, presenting an hourglass structure with a few counties in the first gradient, fewer in the middle gradient, and more counties in the bottom gradient. It should pay attention to avoiding the trend of “centrifugation” and promoting the optimal transformation of counties in the middle level.
Finally, the county tourism linkage network on the Tibetan Plateau is affected by a combination of factors, including tourism supply, geographic distance, and administrative boundaries. While previous studies have focused on provinces and urban areas, this paper refined the research scale to counties. The results confirmed the hindering effect of geographic distance on the flow of tourism linkages in counties and the distance attenuation effect of tourism linkage spillover.

4.1. Theoretical Implications

First, this paper innovatively selected counties as the entry point, which enriched the tourism network research at the county level and helped to supplement and broaden the research perspective.
Second, in terms of the research method, this study conformed to the current paradigm on the spatial structure of the tourism linkage network. According to the principle of spatial interaction, the widely used tourism gravity model takes the number of visitors and tourism revenue as the evaluation index of tourism spatial quality, the economic and transportation distance between two places as damping, and the corrected empirical constant to construct the potential tourism linkage network, which helps reveal the structural and organizational characteristics.
Finally, this paper applied the social network analysis to study the spatial hierarchical structural differentiation and organizational model and integrates multiple dimensions, such as centrality, spatial interaction, dominant flow, and cohesive subgroups, to reveal the current structure of tourism networks in counties on the Tibetan Plateau.

4.2. Practical Implications

To promote the proper flow of regional tourism factors, optimize the division of labor and collaboration relationship between different regions, and further implement the tourism high-quality development strategy, this paper puts forward the following policy recommendations.
First, tailor measures to suit local conditions. For places with strong tourism agglomeration ability/intermediary control ability/excellent organization ability, it is recommended to implement a network-style spatial layout model, close community ties, and enhance the overall competitiveness of local tourism. For neighboring areas around the strong center and sub-center tourism nodes, it is suggested to adopt a “pole-nucleus” spatial layout and differentiated development strategy and strive to form complementary relationships with central tourism places to avoid the “shadow effect”. For counties that are not strong centers but are not far from the tourism traffic corridor, such as Huangyuan 3, Dazi 1, Danba 3, Hongyuan 3, and Ruoergai 3, it is recommended to choose the “point-axis” spatial structure, and actively use the spatial spillover effect of the axis to enhance tourism service function. Subordinate counties are in a weak position in the network, and the scope of attraction of tourism space in these areas needs to seek a breakthrough in administrative boundaries to enhance tourism connectivity.
Second, improve the exchange network and promote the formation and development of regional tourism integration on the Tibetan Plateau. Counties where administrative boundaries meet should strengthen communication and consultation, reduce barriers and costs of cooperation, examine the strengths and weaknesses of local tourism development, and avoid homogenous competition.
Lastly, combined with the actual regional tourism development and the research results, we suggested continuing to promote the national “tourism aid to Tibet” precise help work, improving the construction of the national scenic road system, innovating tourism industry clustering, exploring the border area open development mode, etc., to optimize the regional spatial tourism structure and layout.

5. Conclusions

The perspectives and scales of tourism network studies on the Tibetan Plateau are enriching, but they have not yet focused on the critical act of inter-county spatial interaction. The research objective of this paper was to measure the strength of tourism linkage among 214 counties on the Tibetan Plateau in 2019 based on the modified tourism gravity model, on which the network binary matrix was constructed, and the social network analysis method was applied to reveal the hierarchical structure and organizational model. The study leads to the following conclusions:
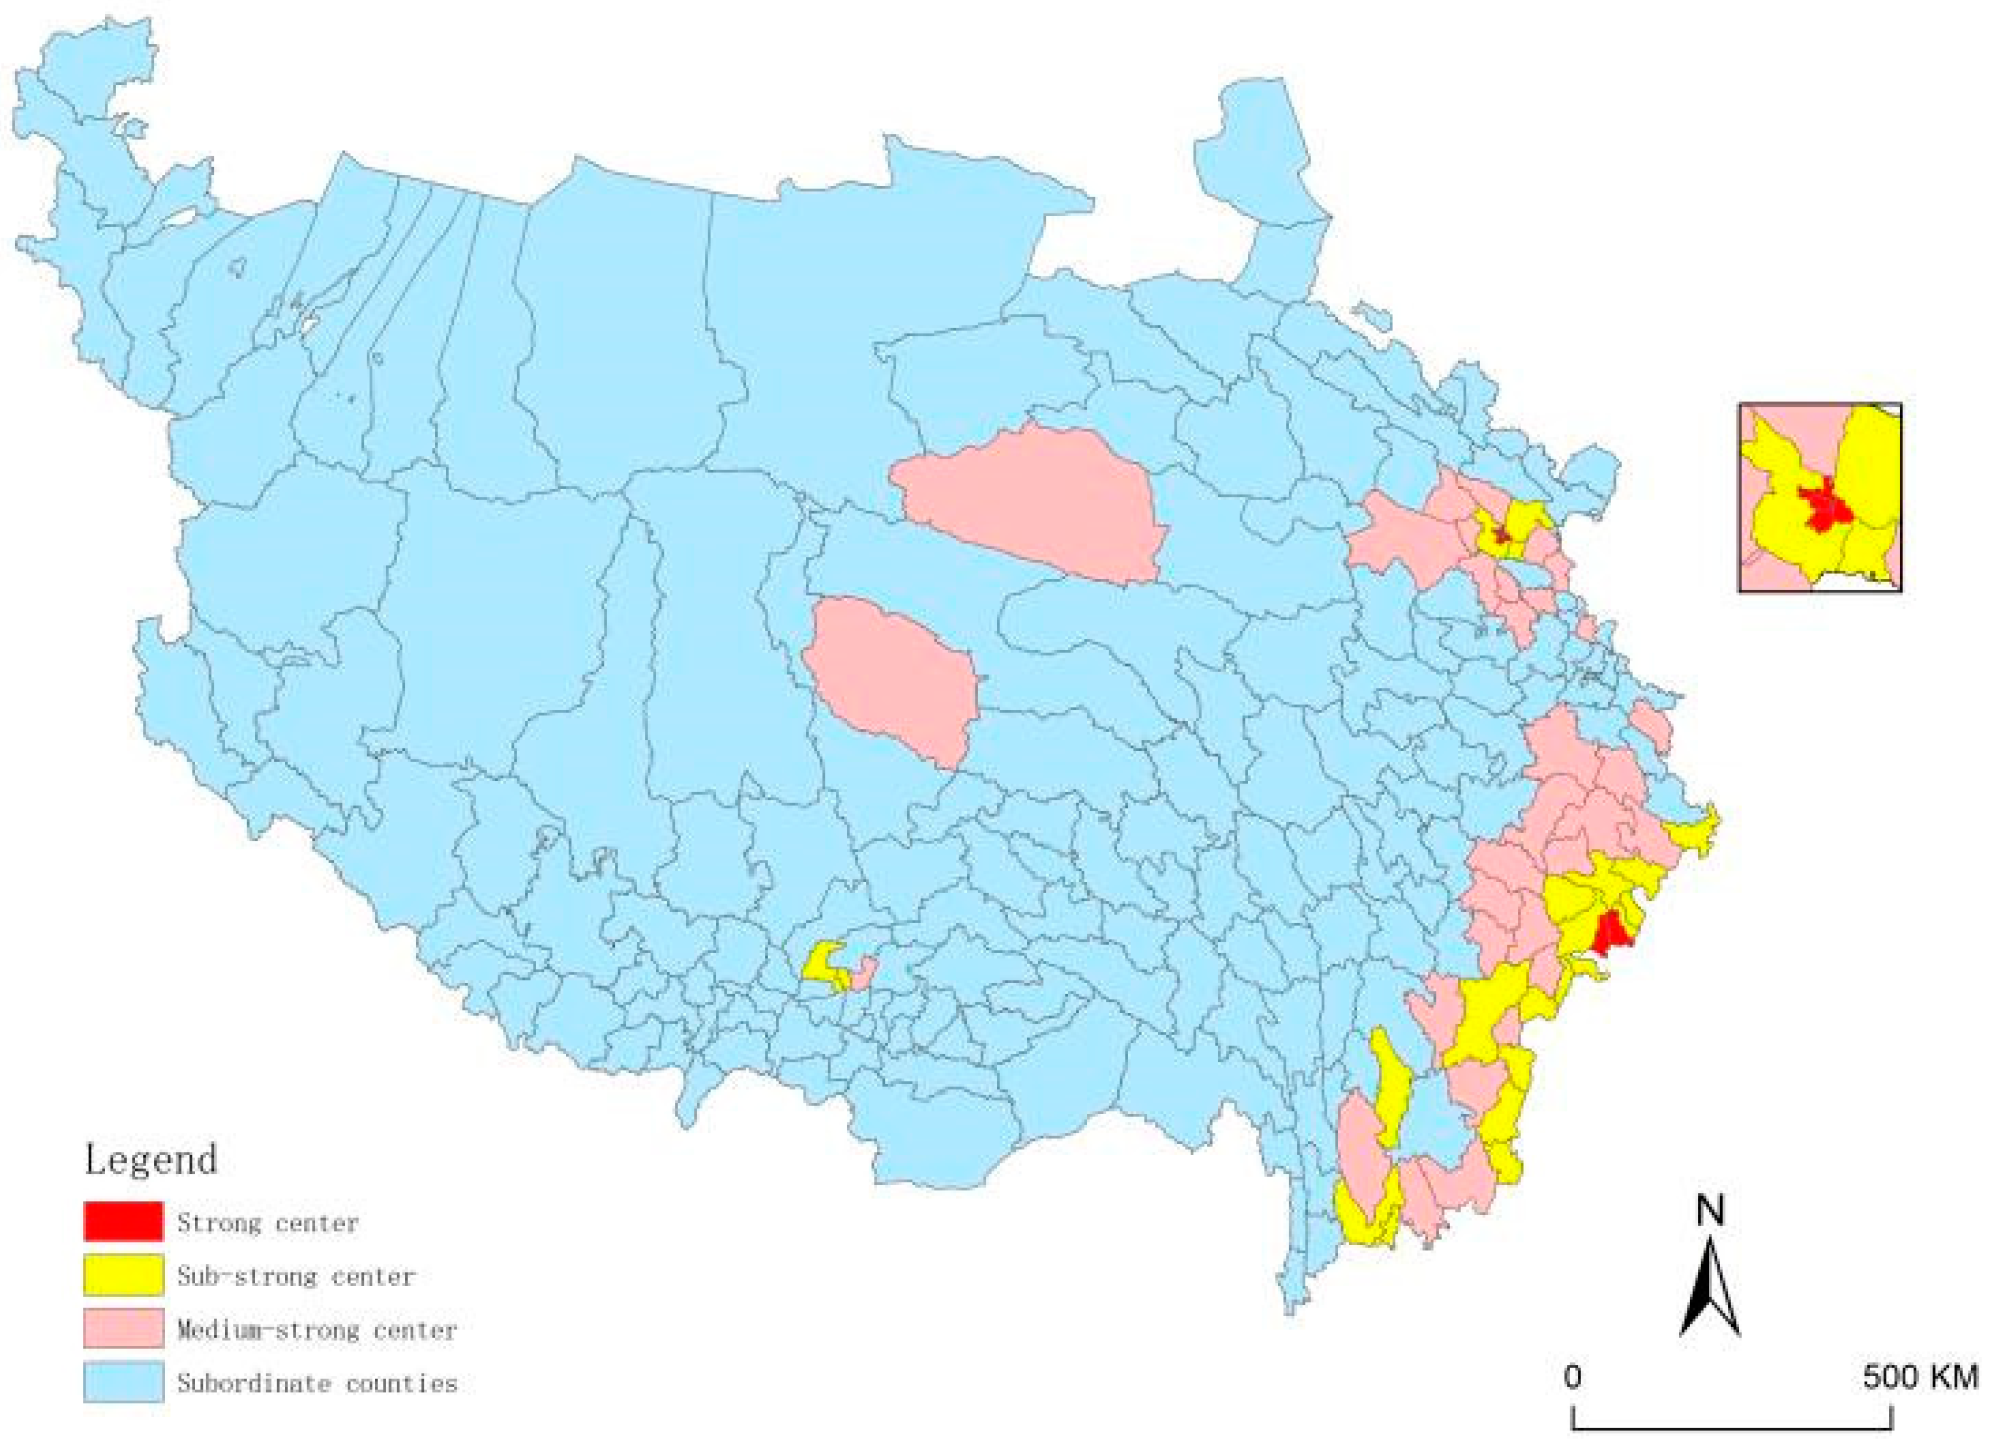
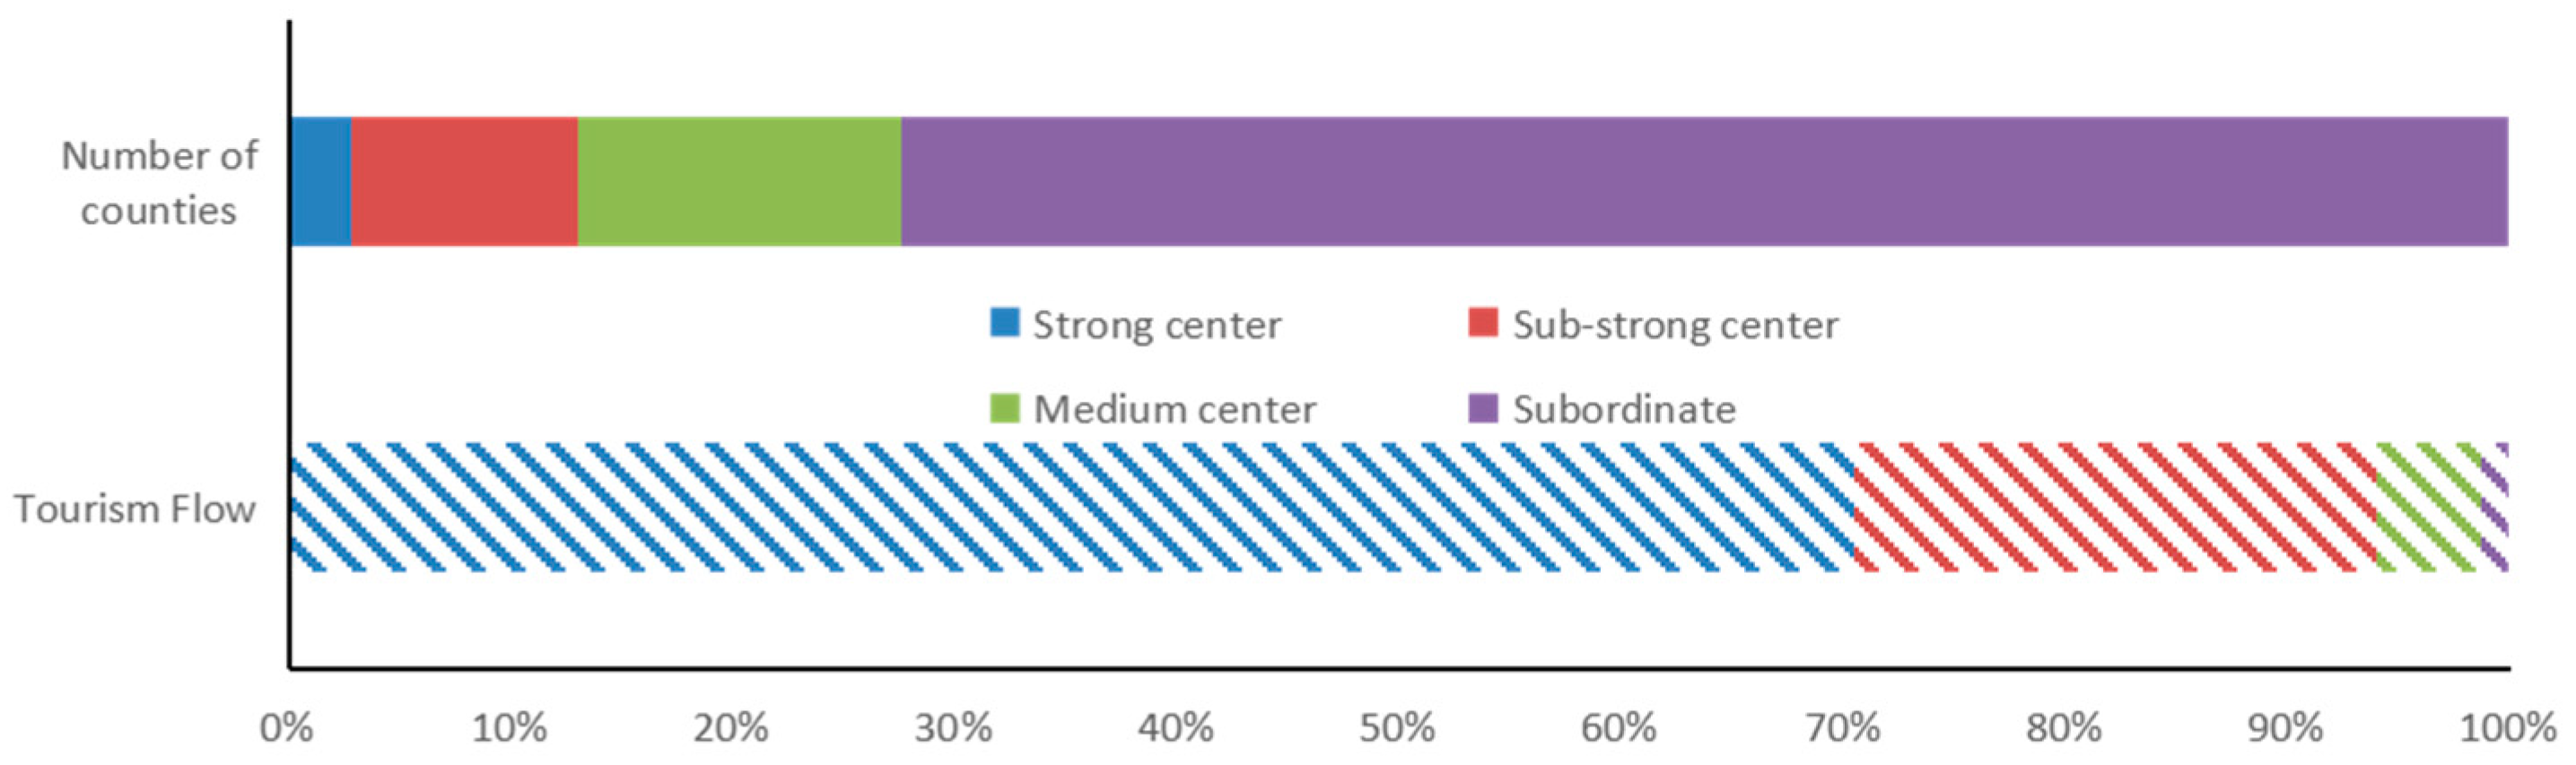
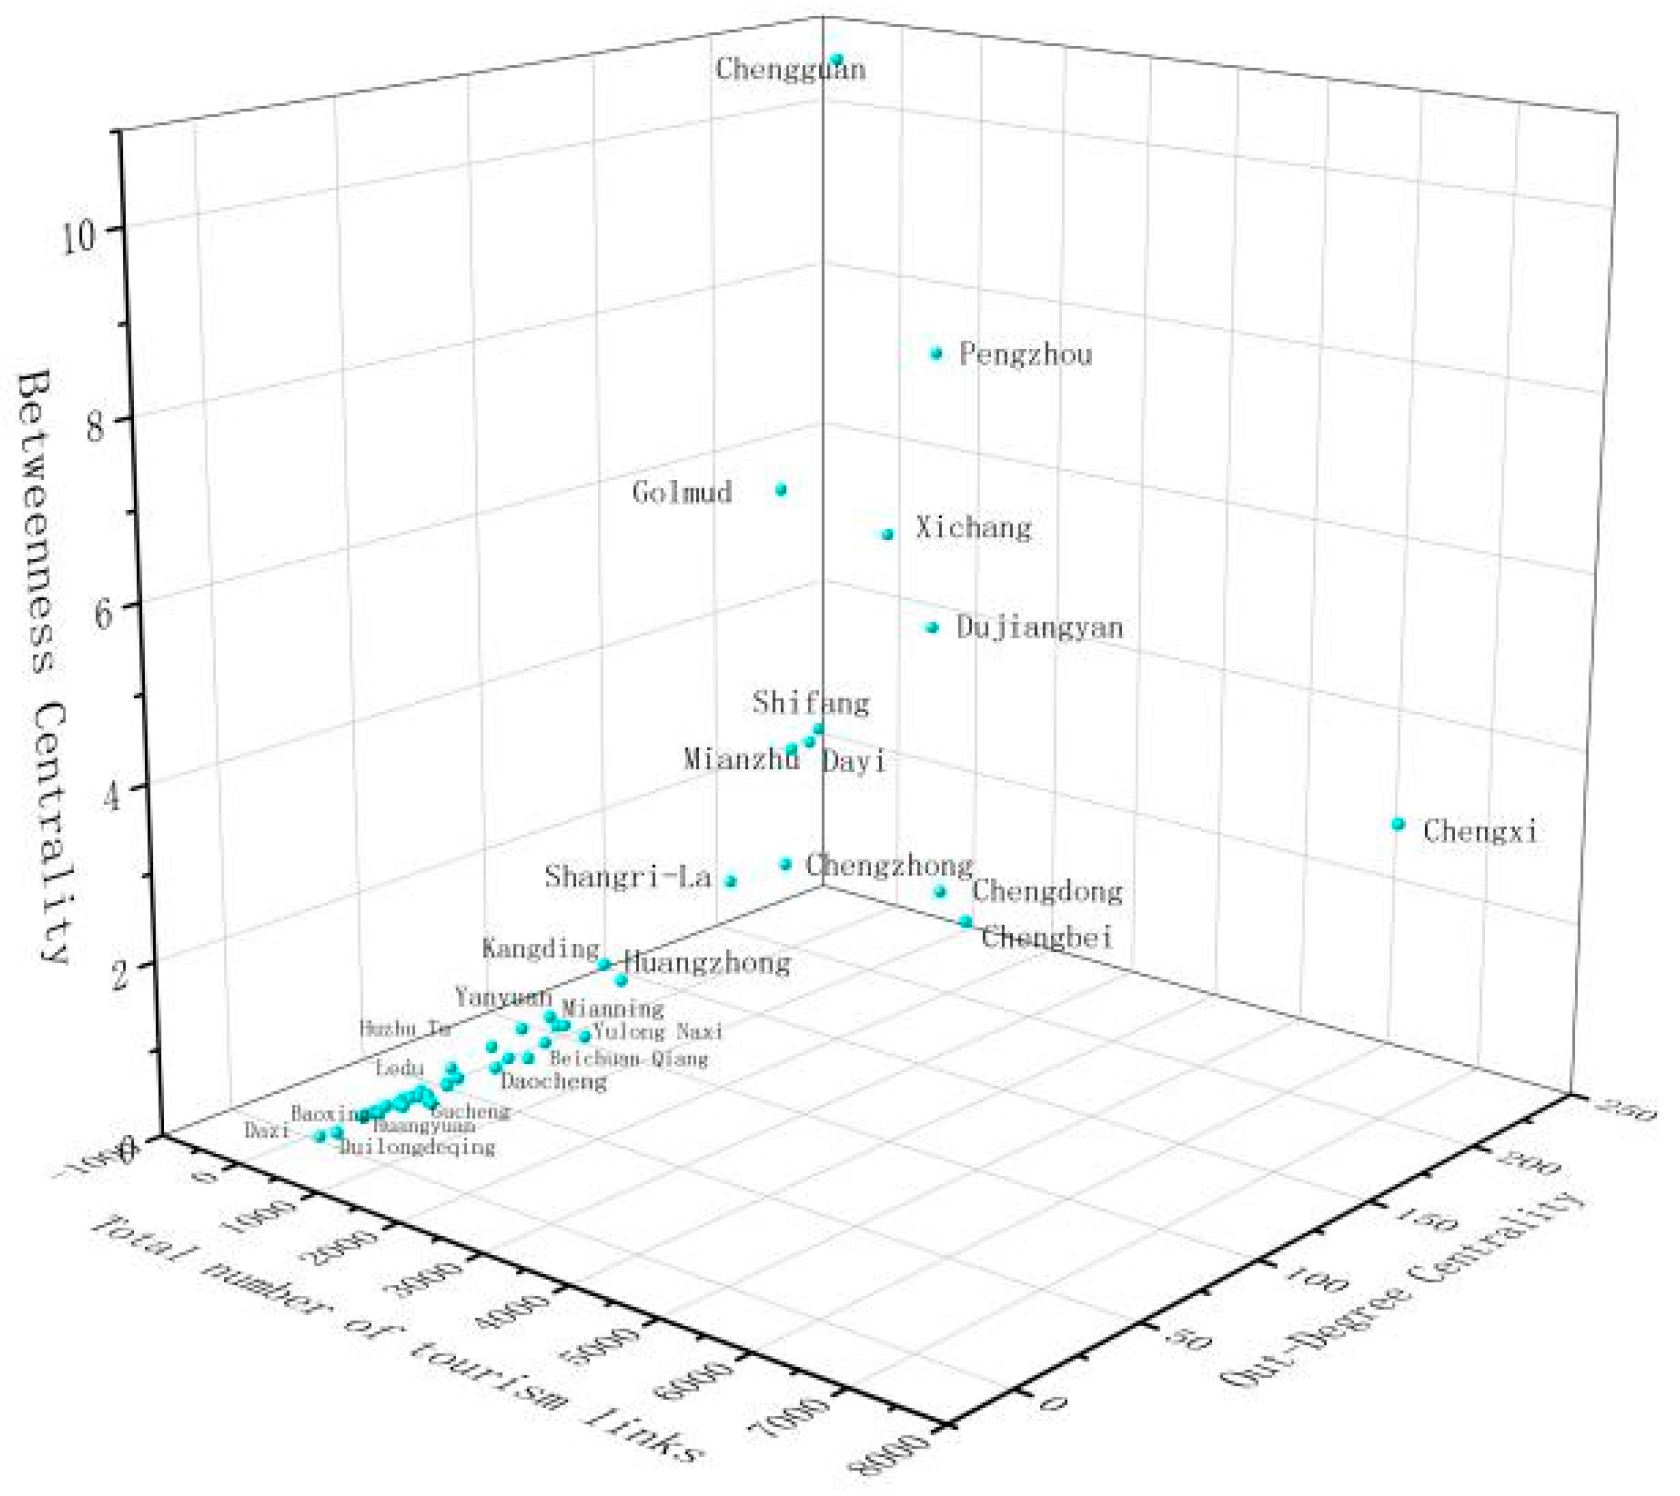
  • Overall characteristics of the county tourism network: ① It showed the unbalanced characteristics of decreasing from the east to the west, Xichang 2, Dayi 3, Shifang 2, Mianzhu 2, Shangri-La 2, and other core growth poles initially formed. ② The Chengguan 1 (Lhasa), Pengzhou 2, and Golmud2 had a major impact on the dynamics of the whole network. ③ According to the capacity of tourism organizations, county tourism nodes formed four types, showing spatial polarization characteristics and noticeable zonal distribution differences. ④ The cohesion of the network needs to be improved, and the multidimensional system structure of county tourism nodes has been formed.
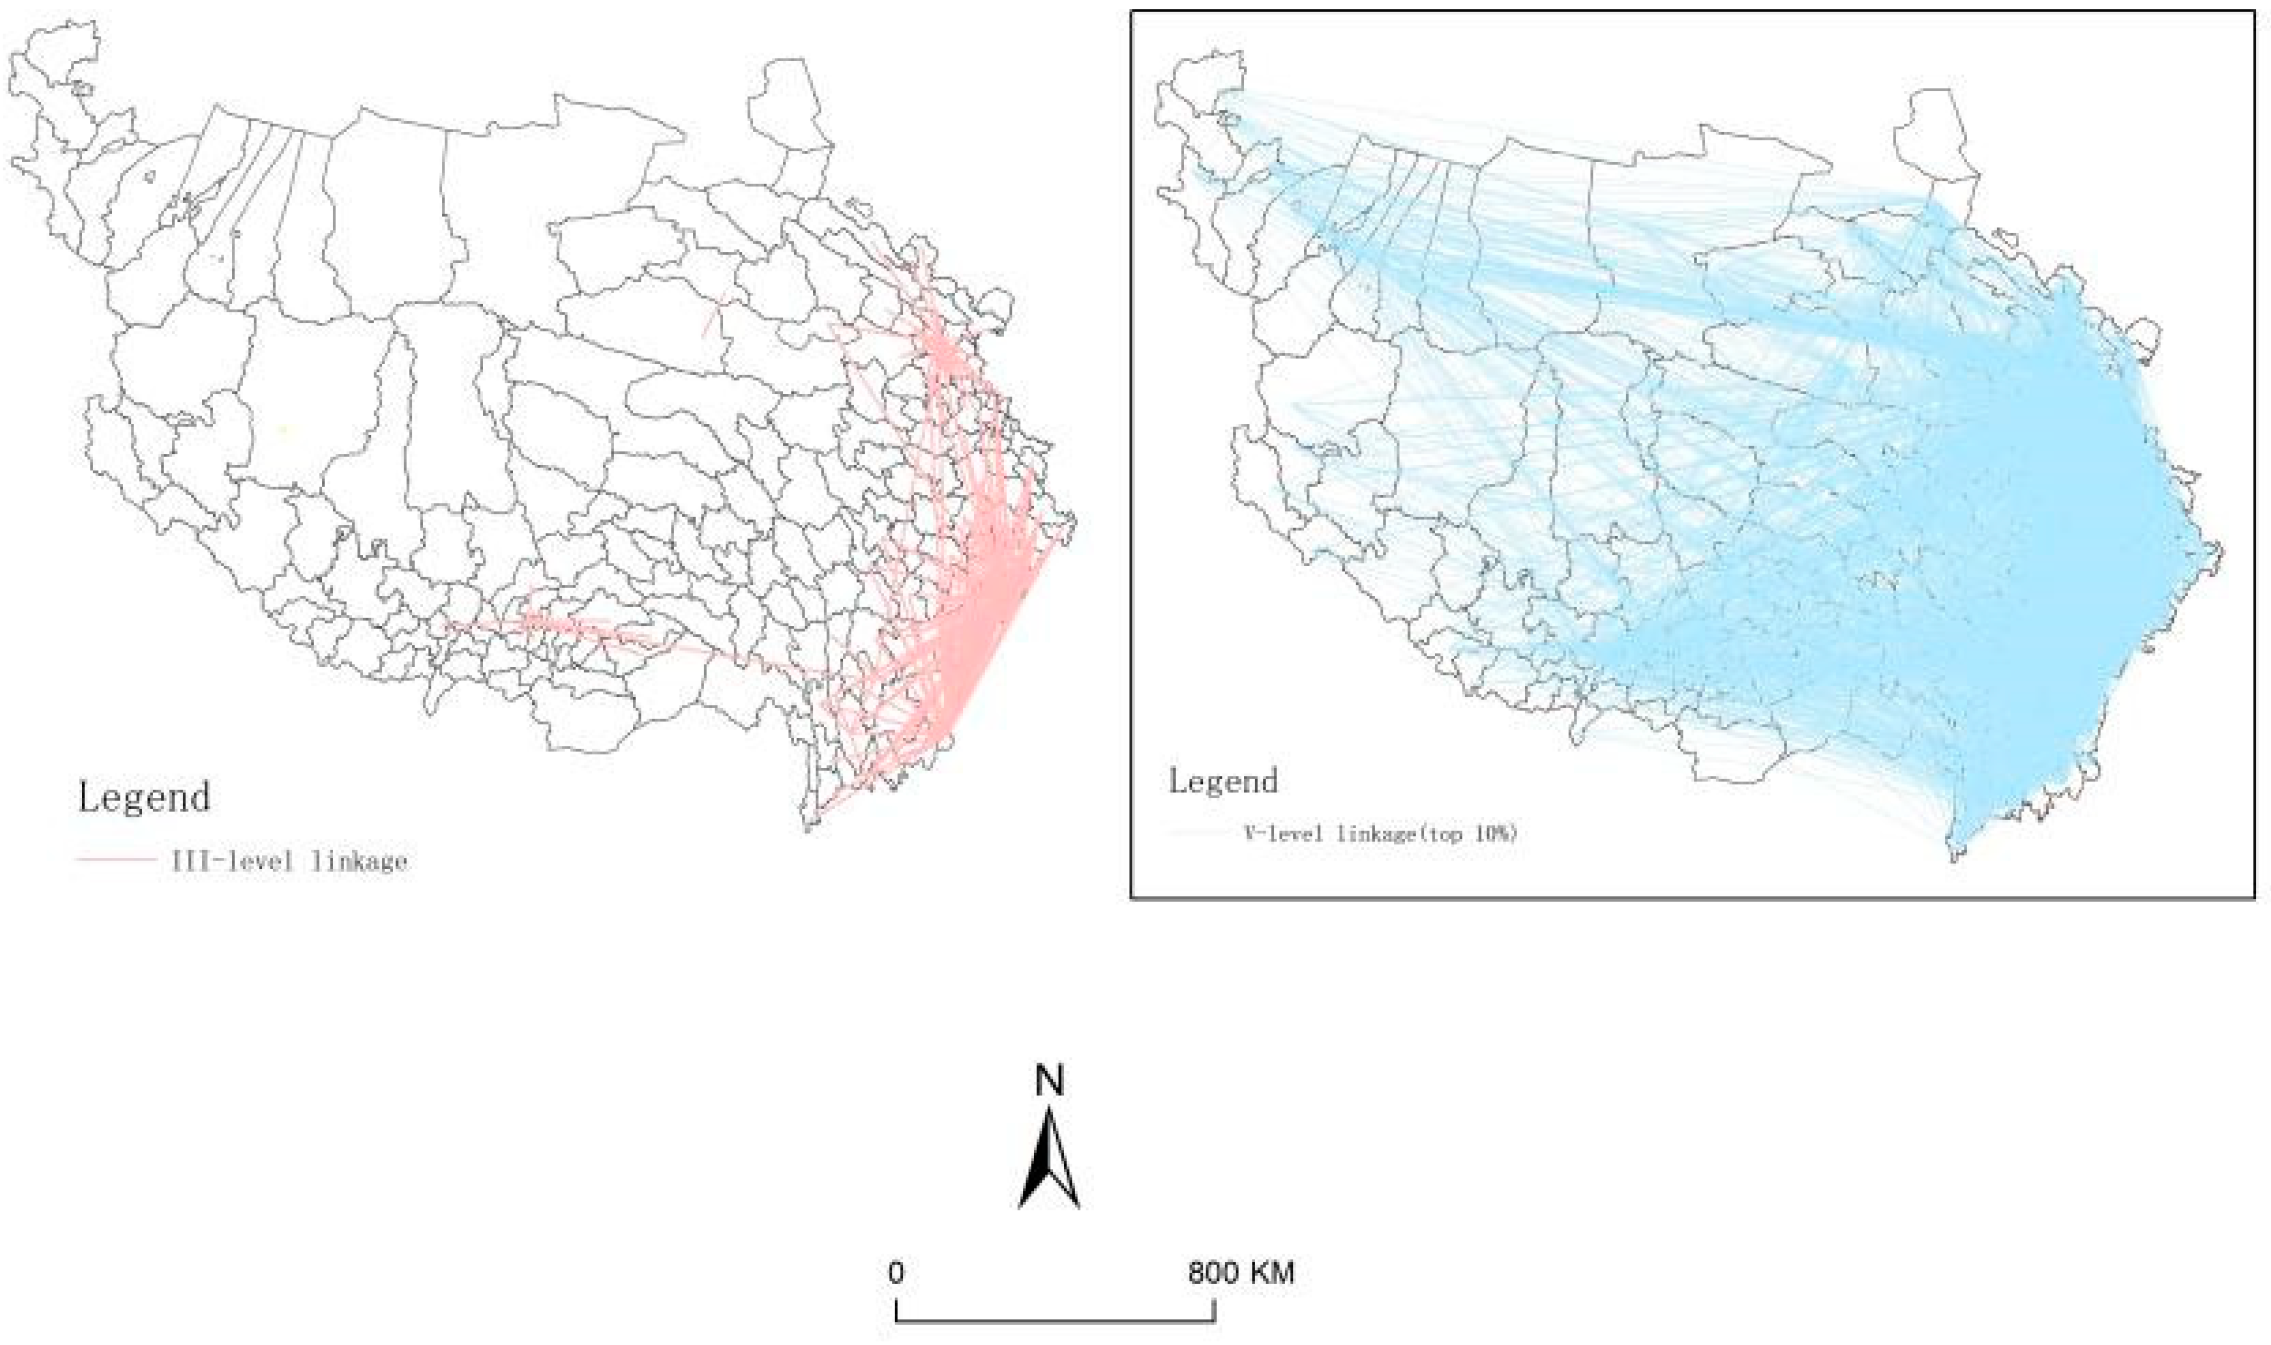
  • Structural characteristics of inter-county tourism linkages: ① In line with the law of distance decay, the travel demand within a radius of 200 km was prominent, showing significant spatial proximity characteristics. ② The hierarchical spatial structure of “inter-county” tourism links was distinct, with the distribution characteristics of “dense in the east and sparse in the west”. The denser the cross-regional links, the more pronounced the trend of forming a network and consolidating and strengthening the linkage pattern.
  • The county tourism network had more distinctive characteristics of dominant flow and community structure, forming an orderly system of hierarchical connections and four regional functional groups.
Several limitations to the current study need to be acknowledged. It mainly revealed the hierarchical structure and organizational model of the county tourism linkage network on the Tibetan Plateau in 2019, but failed to examine the network structure’s dynamic evolution and driving mechanisms for the time being. In the future, we will further update the long-time series data to deepen the research on the evolution of spatio-temporal patterns and influence mechanisms. Additionally, the study adopted a modified gravity model to construct the tourism linkage network. Further research will explore tourism linkages between counties by studying different tourism flows. For example, a web mining method is suited to building a database of tourism flows to better highlight the actual tourism routes generated by tourists.

Author Contributions

Writing—original draft preparation, S.S.; writing—review and editing, S.S. and M.L.; visualization, S.S. and M.L.; supervision, J.X. All authors have read and agreed to the published version of the manuscript.

Funding

This research was funded by the Second Tibetan Plateau Scientific Expedition and Research Program, grant number 2019QZKK1004.

Institutional Review Board Statement

Not applicable.

Informed Consent Statement

Not applicable.

Data Availability Statement

Data are available upon request.

Conflicts of Interest

The authors declare no conflict of interest.

References

  1. Ke, W.; Chen, W.; Yang, Q. Uncovering spatial organization patterns of regional city networks from express way traffic flow data: A case study of Jiangsu province, China. Geogr. Res. 2018, 37, 1832–1847. [Google Scholar] [CrossRef]
  2. Kim, Y.R.; Scott, N. Network dynamics of tourism development in South Korea. Curr. Issues Tour. 2018, 21, 1239–1259. [Google Scholar] [CrossRef] [Green Version]
  3. Jesus, C.; Franco, M. Cooperation networks in tourism: A study of hotels and rural tourism establishments in an inland region of Portugal. J. Hosp. Tour. Manag. 2016, 29, 165–175. [Google Scholar] [CrossRef]
  4. Erkuş-Öztürk, H.; Eraydın, A. Environmental governance for sustainable tourism development: Collaborative networks and organisation building in the Antalya tourism region. Tour. Manag. 2010, 31, 113–124. [Google Scholar] [CrossRef]
  5. Cawley, M.; Marsat, J.; Gillmor, D. Promoting integrated rural tourism: Comparative perspectives on institutional networking in France and Ireland. Tour. Geogr. 2007, 9, 405–420. [Google Scholar] [CrossRef]
  6. van der Zee, E.; Vanneste, D. Tourism networks unravelled; a review of the literature on networks in tourism management studies. Tour. Manag. Perspect. 2015, 15, 46–56. [Google Scholar] [CrossRef] [Green Version]
  7. Yin, P.; Lin, Z.; Prideaux, B. The impact of high-speed railway on tourism spatial structures between two adjoining metropolitan cities in China: Beijing and Tianjin. J. Transp. Geogr. 2019, 80, 102495. [Google Scholar] [CrossRef]
  8. Noguiera, S.; Pinho, J.C. Stakeholder network integrated analysis: The specific case of rural tourism in the Portugese Peneda-Geres National Park. Int. J. Tour. Res. 2015, 17, 325–336. [Google Scholar] [CrossRef] [Green Version]
  9. Pavlovich, K. The evolution and transformation of a tourism destination network: The Waitomo Caves, New Zealand. Tour. Manag. 2003, 24, 203–216. [Google Scholar] [CrossRef]
  10. Timur, S.; Getz, D. A network perspective on managing stakeholders for sustainable urban tourism. Int. J. Contemp. Hosp. Manag. 2008, 20, 445–461. [Google Scholar] [CrossRef]
  11. Zhong, S.; Zhang, J.; Han, G.; Wang, L.; Zhang, H. Spatial patterns of tourist flow: Problems and prospects. Hum. Geogr. 2010, 25, 31–36. [Google Scholar] [CrossRef]
  12. Peng, H.; Lu, L.; Lu, X.; Liu, S. Spatial network structure and optimization of cross-border tourism area based on tourist flow: A case study in Lugu Lake. Prog. Geogr. 2014, 33, 422–431. [Google Scholar] [CrossRef]
  13. Liu, F.; Zhang, J.; Chen, D. The process and spatial-temporal feature of tourism destination network Evolution: A case study of MT. Huangshan Scenic Area and Tangkou. Sci. Geogr. Sin. 2014, 34, 1428–1437. [Google Scholar] [CrossRef]
  14. Gao, P.; Xi, J. Research on the spatial structure and complex characteristics of tourism destination network-A case study of Yesanpo tourism destination. J. Nat. Resour. 2018, 33, 85–98. [Google Scholar] [CrossRef]
  15. Wu, Z.; Zhang, L.; Huang, S. Spatial structure and characteristics of tourism economic connections in Guangdong-Hong Kong-Macao Greater Bay Area. Geogr. Res. 2020, 39, 1370–1385. [Google Scholar] [CrossRef]
  16. Chen, H.; Lu, L.; Zheng, S. The spatial network structure of the tourism destinations in urban agglomerations based on tourist flow: A case study of the Pearl River Delta. Acta Geogr. Sin. 2011, 66, 257–266. [Google Scholar] [CrossRef]
  17. Yu, H.; Chen, T.; Lu, L.; Wang, K.; Zhu, D. Structure of tourist economy network and its spatial development pattern in Jianghuai urban agglomeration. Prog. Geogr. 2014, 33, 169–180. [Google Scholar] [CrossRef]
  18. Zheng, B.; Liu, A.; Han, J.; Ming, Q.; Zhang, X. The structural evolution of Yunnan tourism economic contact network and the construction of cooperative development model. Econ. Geogr. 2021, 41, 222–231. [Google Scholar] [CrossRef]
  19. Wang, Z.; Liu, Q. The evolution and influencing factors of spatial network structure of China’s provincial tourism efficiency. Sci. Geogr. Sin. 2021, 41, 397–406. [Google Scholar] [CrossRef]
  20. Wang, Y.; Ma, Y.; Qang, M. Network structure of multicity inbound tourists to China. Prog. Geogr. 2012, 31, 518–526. [Google Scholar] [CrossRef]
  21. Morrison, A.; Lynch, P.; Johns, N. International Tourism Networks. J. Contemp. Hosp. Manag. 2004, 16, 197–202. [Google Scholar] [CrossRef]
  22. Éber, F.Z.; Baggio, R.; Fuchs, M. Hyperlink network analysis of a multi destination region: The case of Halland, South Sweden. Inf. Technol. Tour. 2018, 20, 181–188. [Google Scholar] [CrossRef] [Green Version]
  23. Tao, W. Spatial-Temporal evolution of tourism economic network structure and its development mode in Wuling Mountainous Area of Hunan at the county level. Econ. Geogr. 2020, 40, 211–220. [Google Scholar] [CrossRef]
  24. Miao, H.; Zeng, B. Analysis on inter-county economic linkage in Hohhot-Baotou-Ordos-Yulin Urban Agglomeration and its temporal-spatial evolution. Financ. Theory Teach. 2020, 6, 76–84. [Google Scholar] [CrossRef]
  25. Kang, S.; Lee, G.; Kim, J. Identifying the spatial structure of the tourist attraction system in South Korea using GIS and network analysis: An application of anchor-point theory. J. Destin. Mark. Manag. 2018, 9, 358–370. [Google Scholar] [CrossRef]
  26. María, S.G.; Francisco, J.; Ledesma, R. International trade and tourism flows: An extension of the gravity model. Econ. Model. 2015, 52, 1026–1033. [Google Scholar] [CrossRef]
  27. Zhou, H.; Wang, F. Research on structure characteristics of the inter-provincial tourist flow spatial network in China based on the modified gravity model. Geogr. Res. 2020, 39, 669–681. [Google Scholar] [CrossRef]
  28. Shih, H.-Y. Network characteristics of drive tourism destinations: An application of network analysis in tourism. Tour. Manag. 2006, 27, 1029–1039. [Google Scholar] [CrossRef]
  29. Scott, N.; Baggio, R.; Cooper, C. Network Analysis and Tourism: From Theory to Practice; Channel View Publications: New York, NY, USA, 2008; p. 222. [Google Scholar]
  30. Liu, F.; Zhang, J.; Zhang, J.; Chen, D. Relationships and networks in tourism destination research: A review of tourism research under the perspective of social network theory at home and abroad. Tour. Sci. 2016, 30, 1–14 + 78. [Google Scholar] [CrossRef]
  31. Zipf, G.K. The P1 P2/D hypothesis: On the intercity movement of persons. Am. Sociol. Rev. 1946, 11, 677–686. [Google Scholar] [CrossRef]
  32. Haugland, S.A.; Ness, H.; Gronseth, B.O.; Aarstad, J. Development of tourism destinations: An integrated multilevel perspective. Ann. Tour. Res. 2011, 38, 268–290. [Google Scholar] [CrossRef]
  33. Asero, V.; Gozzo, S.; Tomaselli, V. Building tourism networks through tourist mobility. J. Travel Res. 2015, 55, 751–763. [Google Scholar] [CrossRef]
  34. Mou, N.; Zheng, Y.; Makkonen, T.; Yang, T.; Tang, J.; Song, Y. Tourists’ digital footprint: The spatial patterns of tourist flows in Qingdao, China. Tour. Manag. 2020, 81, 104151. [Google Scholar] [CrossRef]
  35. Gan, C.; Voda, M.; Wang, K.; Chen, L.; Ye, J. Spatial network structure of the tourism economy in urban agglomeration: A social network analysis. J. Hosp. Tour. Manag. 2021, 47, 124–133. [Google Scholar] [CrossRef]
  36. Chen, J.S. A case study of Korean outbound travelers’ destination images by using correspondence analysis. Tour. Manag. 2001, 22, 345–350. [Google Scholar] [CrossRef]
  37. Ritchie, R.J.B.; Ritchie, J.R.B. A framework for an industry supported destination marketing information system. Tour. Manag. 2002, 23, 439–454. [Google Scholar] [CrossRef]
  38. Yvonne, V.F.; Evert, G. Hotel networks and social capital in destination marketing. Int. J. Serv. Ind. Manag. 2006, 17, 58–75. [Google Scholar] [CrossRef]
  39. Zhou, Y.; Wei, X.; Liang, F. Tourism destination image integrated marketing communications: A composite IPA research based on ancient water towns in the southern Yangtze River case. Tour. Trib. 2013, 28, 53–60. [Google Scholar] [CrossRef]
  40. Ji, Z.; Jiang, Y.; Xie, T. The perceptions and attitudes of residents towards the impacts of tourism. Resour. Sci. 2017, 39, 396–407. [Google Scholar] [CrossRef] [Green Version]
  41. Shi, C.; Zhang, J.; Shen, Z.; Yang, Y.; Zhong, J. An overview of quantitive evaluation of the tourist destination competitiveness. Hum. Geogr. 2006, 3, 72–77. [Google Scholar] [CrossRef]
  42. Yang, X.; Lu, L. Retrospect and prospect of study on resort life cycle. Hum. Geogr. 2004, 19, 5–10. [Google Scholar] [CrossRef]
  43. Zhang, J.; Sun, G. Life cycle and upgrade of Shanxi’s mansion as a tourist destination: Taking Qiao’s Grand Compound as example. Geogr. Res. 2012, 31, 2104–2114. [Google Scholar]
  44. Garay, L.; Canoves, G. Life cycles, stages and tourism history: The Catalonia (Spain) Experience. Ann. Tour. Res. 2011, 38, 651–671. [Google Scholar] [CrossRef]
  45. Aquino, R.S.; Lück, M.; Schänzel, H.A. A conceptual framework of tourism social entrepreneurship for sustainable community development. J. Hosp. Tour. Manag. 2018, 37, 23–32. [Google Scholar] [CrossRef]
  46. Ma, Y.; Zhang, X. A research review of tourist destination in China. World Reg. Stud. 2008, 144–153 + 173. [Google Scholar] [CrossRef]
  47. Baggio, R. Tourism destinations: A universality conjecture based on network science. Ann. Tour. Res. 2020, 82, 102929. [Google Scholar] [CrossRef]
  48. Marrocu, E.; Paci, R. Different tourists to different destinations: Evidence from spatial interaction models. Tour. Manag. 2013, 39, 71–83. [Google Scholar] [CrossRef] [Green Version]
  49. Wang, Z.; Liang, L.; Chu, X.; Li, J. Examining the coordination effect and interactive stress between tourism economy and ecoenvironment in the Tibetan Plateau. J. Geo-Inf. Sci. 2019, 21, 1352–1366. [Google Scholar] [CrossRef]
  50. Yu, Z.; Sun, G.; Feng, Q.; Luo, Z. Tourism climate comfort and risk for the Tibetan Plateau. Resour. Sci. 2014, 36, 2327–2336. [Google Scholar]
  51. Zhang, R.; Xi, J.; Yao, Y.; Ge, Q. Evaluation of tourism dynamic landscape along Qinghai-Tibet railway based on the visual corridor. Acta Ecol. Sin. 2014, 34, 3320–3330. [Google Scholar] [CrossRef]
  52. Jiang, G.; Zhuo, M. Environment carrying capacity of eco-tourism at county levels in the south of the Tibetan Plateau. J. Arid. Land Resour. Environ. 2014, 28, 202–208. [Google Scholar] [CrossRef]
  53. Xi, J.; Zhang, R.; Zhao, M. Travel risk evaluation along the Qinghai-Tibet Railway. J. Mt. Sci. 2012, 30, 737–746. [Google Scholar] [CrossRef]
  54. Chen, X.; Wang, T.; Zheng, X.; Han, F.; Yang, Z. The structure and evolution of the tourism economic network of the Tibetan Plateau and its driving factors. Land 2022, 11, 241. [Google Scholar] [CrossRef]
  55. Zhu, D.; Yu, H.; Liu, Q.; Liu, L. Network structure characteristics and organizational models of tourist flow to Tibet: Comparative analysis based on group and self-guided tours. Prog. Geogr. 2021, 40, 812–824. [Google Scholar] [CrossRef]
  56. Chen, R.; Wang, X.; Zhou, Q.; Zhang, Z. The eco-tourism spatial structure in Tibetan Plateau. J. Arid. Land Resour. Environ. 2012, 26, 192–198. [Google Scholar] [CrossRef]
  57. Zhang, Y.; Li, B.; Liu, L.; Zheng, D. Redetermine the region and boundaries of Tibetan Plateau. Geogr. Res. 2021, 40, 1543–1553. [Google Scholar] [CrossRef]
  58. Crampon, L.J. A New Technique to Analyze Tourist Markets. J. Mark. 1966, 30, 27–31. [Google Scholar] [CrossRef]
  59. Shi, Q.; Xie, Y.; Han, Z.; Liu, T.; Liu, G.; Du, P. Spatial structure and spatial development patterns of urban tourism economic connections in northeast China. Econ. Geogr. 2018, 38, 211–219. [Google Scholar] [CrossRef]
  60. Miguéns, J.I.L.; Mendesb, J.F.F. Travel and tourism: Into a complex network. Phys. A Stat. Mech. Its Appl. 2008, 387, 2963–2971. [Google Scholar] [CrossRef] [Green Version]
  61. Dredge, D. Policy networks and local organization of tourism. Tour. Manag. 2006, 27, 269–280. [Google Scholar] [CrossRef]
  62. Scott, N.; Cooper, C.; Baggio, R. Destination networks-four Australian cases. Ann. Tour. Res. 2008, 35, 169–188. [Google Scholar] [CrossRef]
  63. Zhou, H.; Xu, C. Research on structural characteristics of spatial network for Hunan’s tourism economy. Theory Pract. Financ. Econ. 2015, 36, 126–131. [Google Scholar] [CrossRef]
  64. Dai, T.; Jin, F.; Wang, J. Spatial interaction and network structure evolvement of cities in term of China’s railway passenger flow in 1990s. Prog. Geogr. 2005, 24, 80–89. [Google Scholar] [CrossRef]
  65. Wang, J.; Jing, Y. Comparison of spatial structure and organization mode of inter-city networks from the perspective of railway and air passenger flow. Acta Geogr. Sin. 2017, 72, 1508–1519. [Google Scholar] [CrossRef]
Figure 1. Overview map of the study area (source: GS(2019)1822). (A) The 214 counties on the Tibetan Plateau. (B) Location of the study region in China.
Land 11 01880 g001
Figure 2. Out-degree centrality, calculated and visualized based on Formula (2).
Land 11 01880 g002
Figure 3. In-degree centrality, calculated and visualized based on Formula (2).
Land 11 01880 g003
Figure 4. Betweenness centrality, calculated and visualized based on Formula (3).
Land 11 01880 g004
Figure 5. County hierarchy, calculated and visualized based on Formula (4).
Land 11 01880 g005
Figure 6. Hierarchical distribution pattern of county nodes and tourism flows.
Land 11 01880 g006
Figure 7. Multidimensional system structure.
Land 11 01880 g007
Figure 8. The distance decay pattern of county tourism flow.
Land 11 01880 g008
Figure 9. The pattern of tourism links between “county pairs”.
Land 11 01880 g009
Figure 10. Spatial organization of the dominant flow in the tourism network.
Land 11 01880 g010
Figure 11. Spatial distribution of cohesive subgroups.
Land 11 01880 g011
Table 1. Detailed formulas and explanations of research methods.
IndicatorsFormulaExplanation of the FormulaIndicator Meaning
Tourism economic linkage intensity
R ij = K ij P i V i P j V j D i j 2
Rij is the intensity of tourism linkage of region i and j; Pi and Pj are the tourism receptions of region i and j; Vi and Vj are the tourism revenues of region i and j; dij is the actual shortest road distance between region i and j; g is the regional gross product. Dij indicates the economic distance between region i and j, which is calculated by dij/gi − gj; considering there is a difference between the tourism linkage and the pure economic attraction of the two regions, through Vi/Vi + Vj to calculate the correction coefficient Kij, to reflect the weight of region i to region j tourism linkage strength.The larger the value of Rij, the stronger the tourism linkage between regions i and j and the more active the tourism interaction.
Degree Centrality
C D ( n i ) = d ( n i ) g 1
CD(ni) denotes the degree centrality of region i; d(ni) denotes the number of effective links between region i and other node regions; g denotes the number of all regions in this network.CD characterizes the agglomeration-diffusion structure of the network. This indicator portrays the central nodes with substantial influence and diffusion power in the social network. It is used to measure the importance of the position of a county in the overall regional tourism development.There are out-degree and in-degree in the directed network matrix; out-degree indicates the attraction of one spatial unit to another spatial unit and represents the agglomeration of space; in-degree indicates the attraction of one spatial unit to another spatial unit and represents the radiation of space [63].
Betweenness centrality
C B ( n i ) = 2 j < k g j k ( n i ) / g j k ( g 1 ) ( g 2 )
j≠k; CB(ni) denotes the betweenness centrality of region i; gjk(ni) denotes the number of shortcuts with region i on the shortcut for region j to reach region k; gjk denotes the number of shortcuts for region j to reach region k; g is the total number of regions in this overall regional network.CB characterizes the dynamic capacity structure of the network. This indicator portrays the central node in the social network with a high intermediary capacity to measure the ability of a county to control tourism interactions with the other two counties and is an important dynamic parameter that influences network changes.
Total number of tourism links
T i = j = 1 n R i j
Ti is the total number of tourism links in region i.Ti characterizes the structural features of the organizational capacity of the network. This indicator is the sum of the intensity of tourism linkages in a county, and the larger the value of Ti, the stronger the sharing capacity, which is used to measure the tourism organizational capacity.
Network Density
D = 2 m n ( n 1 )
D is the network density value; m is the actual number of relationships; n is the theoretical maximum number of relationships.D characterizes the overall cohesiveness of the network. This index portrays the overall network perfection and the tightness of connections between nodes. The larger the D value, the stronger the overall cohesion of the network.
Table 2. Statistics on the strength of the dominant flow between county pairs.
Strong Links (pcs)
(≥0.6)
Sub-Strong Links (pcs)
(<0.6, ≥0.3)
Weak Links (pcs)
(<0.3)
Coupling Links (pcs)
(Mutual Dominant Flow)
Average Degree of Dominant Flow
Tourism flow26
(12.15%)
97
(45.33%)
91
(42.52%)
9
(4.2%)
0.377
Table 3. Location and hierarchical structure of cohesion subgroups.
Community StructureCohesive
Subgroup
Main Location
(Subgroup Name)
Number of Levels
(Strong Center/Sub-strong Center/Medium Strong Center/Subordinate Counties)
Mean Value of Total Tourism LinksTypical Counties
Eastern Growth Hinterland Group1Gansu-Qinghai Grand Loop0/2/10/2717Ping’an 1, Guide 3, Huangyuan 1, Haiyan 1, Jianzha 1, Hongyuan 1
2Shangri-La Grand Loop0/7/13/2339.8Gucheng 1, Li 3, Daocheng 3, Qingchuan 3, Mao 3, Lushan 3
Eastern Growth Group3Ring of Growth Poles Group0/8/5/2130.33Wenchuan 3, Yulong Naxi 4, Mianning 3, Beichuan Qiang 4, Huangzhong 1, Shimian 3
4Growth Pole Group6/5/2/01549.57Chengxi 1, Chengbei 1, Chengdong 1, Pengzhou 2, Dujiangyan 2, Chengzhong 1, Xichang 2
Northwest Group5Northern Group0/0/0/211.63Mangya 3, Hetian 3, Luopu 3, Kunyu 2, Yutian 3, Pishan 3, Cele 3
6Qinghai-Tibet-Xinjiang Loop0/1/1/535.32Duilongdeqing 1, Dazi 1, Mozhugongka 3, Gonga 3, Qushui 3, Dangxiong 3
Tibetan Group7Ali Grand Loop0/0/0/190.07Naidong 1, Bailang 3, Qusong 3, Nanmulin 3, Xietongmen 3, Sajia 3
8Tibet mini-loop0/0/0/100.545Linzhou 3, Nimu 3, Sangri 3, Qiongjie 3, Yadong 3, Cuona 3
Publisher’s Note: MDPI stays neutral with regard to jurisdictional claims in published maps and institutional affiliations.

