Article

Research on the Interactive Coupling Relationship between Land Space Development and Eco-Environment from the Perspective of Symbiosis: A Practical Analysis of Henan, China

1
College of Resources and Environment, Henan Agricultural University, Zhengzhou 450002, China
2
School of Public Policy and Management, China University of Mining and Technology, Xuzhou 221116, China
3
Research Center for Transition Development and Rural Revitalization of Resource-based Cities in China, China University of Mining and Technology, Xuzhou 221116, China
*
Author to whom correspondence should be addressed.
Land 2022, 11(8), 1252; https://doi.org/10.3390/land11081252
Submission received: 15 July 2022 / Revised: 3 August 2022 / Accepted: 4 August 2022 / Published: 5 August 2022
(This article belongs to the Section Land Environmental and Policy Impact Assessment)

Abstract

:
As a key issue in China’s sustainable development, land space development (LSD) creates increasing pressure on the environment. Thus, a better understanding of the relationship between LSD and the eco-environment is necessary for Chinese policymakers to realize sustainable high-quality development. LSD and the eco-environment are closely related and mutually dependent, and the coupling coordination pattern between LSD and the eco-environment has great significance to promoting high-quality development and ecological civilization construction in the region. This study highlights the equilibrium between LSD and ecological protection and introduces symbiosis theory to measure the degree of coordinated and symbiotic development in the Henan province, using data from 2000–2018. The coupling coordination degree model was used to evaluate the coupling coordination relationship of spatial–temporal patterns and development type characteristics. The evaluated results show that there are regional gradient differences in the level of LSD and the eco-environment, and the coupling coordination degree of LSD and the eco-environment in the Henan province are in the bare coordination stage and on the verge of imbalance at present. In addition, the spatial correlation pattern between LSD and the eco-environment was discussed. It is proposed that there is a positive correlation between the coupling coordination degree of LSD and the eco-environment. Moreover, this study suggested implementing a scientific and high-quality development path of land space, reasonably coordinating the social, economic, and eco-environment of the Henan province, then promoting regional sustainable development.

1. Introduction

The land spatial pattern is a comprehensive manifestation of the interaction between natural ecosystems and social systems [1]. Since the reform and opening-up, China’s urbanization rate has increased from 17.92% in 1978 to 59.58% in 2018. Especially since 2000, urbanization has entered a stage of rapid development. Meanwhile, the scale of China’s built-up area has rapidly expanded from 7000 km2 in 1981 to 58,000 km2 in 2018 [2]. In addition, industrial land has always played an important role in the spatial pattern of China’s land and its proportion of construction land has been more than 20% for a long time. A large amount of industrial land, the lack of living land, and the insufficient supply of ecological land have gradually affected the spatial structure of China. In 2017, the 19th National Congress of the Communist Party of China put forward “high-quality development” for the first time, proposing to “establish and improve the economic system of green carbon reduction and circular development”. Therefore, in the context of the gradual imbalance of the land space structure, how to coordinate the use of land space and eco-environment protection and scientifically guide the orderly development of land space has become the key to achieving comprehensive, coordinated, and sustainable regional development.
There is objectively an interactive coercive relationship between land space development (LSD) and eco-environment. On the one hand, the rational development of the land space pattern can promote the rational flow and efficient agglomeration of various elements in the land space, thereby promoting the intensive use of urban land and improving the eco-environment. The good development of the eco-environment will reduce the environmental and resource consumption caused by economic growth, improve the eco-environment quality, and arouse the attention of government departments on environmental protection [3]. On the other hand, the over-exploitation of land space will cause frequent problems, such as environmental pollution, waste of resources, and forest destruction. The decline in the quality of the eco-environment means that the resource—environmental carrying capacity and the land intensive use level weakened, which in turn restricts the development of high-quality spatial patterns [4]. At present, researchers have tried to discuss LSD with different scales and different purposes [5,6,7]. Most previous research addressing the relationship between LSD and the eco-environment has focused on the “Environmental Kuznets Curves (EKC)”, a nonlinear relationship that can be used to describe the urbanization and environmental system [8]. The Environmental Kuznets hypothesis was first proposed by Grossman and Kreuger [9] to describe the relationship between development and environmental quality. The EKC revealed that the environmental quality will initially degrade as the development process accelerates, and when the economy reaches a certain level, it will improve as the degree of development deepens [10]. Therefore, analyzing the interactive relationship between LSD and the eco-environment is crucial for human survival and social development.
In China, many scholars tried to reveal the complex interactions between the urbanization and eco-environment [11,12], such as discussing the stress of urbanization on the eco-environment from the aspects of population, space, economy, and society, and analyzing the restraint effect of eco-environment on urbanization from the aspects of ecological resources, ecological pressure, and ecological response [13,14,15,16,17]. In the process of rapid urban development, problems, such as ecological destruction and environmental pollution, have frequently appeared [18,19]. Therefore, research on ecological environmental protection and governance in the process of urban development has gradually increased, mainly involving land use [20,21], water resource utilization [22,23], environmental assessment [24,25], etc. For instance, Qin [26] constructed a water resource constraint model for the urbanization process to measure the intensity of water resource constraints in the urbanization process of the Yangtze River Economic Belt. Zhao [27] used the comprehensive evaluation model of ecological environmental effects to explore the ecological environmental effects of long-term urban land expansion in the Songhua River Basin. According to different research fields, foreign scholars have carried out a series of studies on the interaction mechanism and stress relationship of the symbiotic coupling between urbanization and eco-environment [28,29]. For example, Kijima [30] used the EKC to confirm the nonlinear relationship between urbanization and eco-environment. Veziroglu [31] used the system dynamics model to evaluate the efficiency of water resources utilization in the context of rapid urbanization.
Meanwhile, LSD must be based on whether the development and eco-environment can be coordinated. Optimizing the pattern of land space is an important means to promote regional sustainable development. Land space optimization has specific planning goals and can use certain technical methods to optimize the land use structure and direction on the time scale and space scale. Early spatial optimization methods at home and abroad include linear programming [32], gray linear programming [33], multi-objective linear programming [34], and system dynamics models [35], which are mainly used in the optimization of land use structures. With the development of 3S technology, the optimization of land use has risen from a single structural optimization to a spatial optimization. Genetic algorithm [36], neural network [37], cellular automata (CA) model [38], small-scale land use change and effect model (CLUE-S), and other technologies [39] have become an important research direction for spatial pattern optimization. In China, land space optimization is an important measure to ensure regional sustainable development. The basic means for local governments to achieve land space optimization is to reasonably determine the intensity of regional development and implement total construction land control [40].
Clearly, scholars have carried out various pieces of research in different aspects [41,42,43], but there are still some shortcomings. Firstly, there are currently few studies on the coordination of LSD and the eco-environment, and the interaction is mostly focused on the temporal order of the coupling coordination of the two systems, and there is insufficient research on dynamization. Then, the relationship between LSD and the eco-environment is subject to the regional economic development stage and the regional differentiation law and has certain spatial correlation characteristics. However, previous studies focused on measuring the type of coupling coordination between the LSD and the eco-environment, as well as spatial pattern optimization, etc., and lack of comprehensive research on the spatial correlation.
In the process of social development in China, the disorderly expansion of construction land and the large-scale occupation of ecological land have seriously hindered the sustainable development of land space. As one of the core theories of racial ecology, symbiosis theory mainly studied material communication, information transmission, energy transmission, and symbiosis among symbiotic units [44,45]. Symbiosis theory can be applied to the relationship between LSD and the eco-environment, thereby reducing the negative effects of LSD on the eco-environment, enhancing the ecological support capacity of LSD, and promoting coordinated and symbiotic development. Facing the high-quality development needs of land space, this paper takes the city unit of the Henan province as an example. Through the construction of an index system for LSD and the eco-environment, this paper identifies the temporal evolution characteristics of LSD and the eco-environment and uses the coupling coordination model to discuss the coupling coordination characteristics and spatial pattern of LSD and the eco-environment. The main objectives of this study are as follows: (a) establish an evaluation index system to identify and quantify LSD and the eco-environment at the municipal level; (b) analyze the temporal evolution characteristics of LSD subsystem and the eco-environment subsystem; (c) evaluate the spatial pattern and development type characteristics of coupling coordination degree between LSD and the eco-environment; and (d) exploring the spatial correlation pattern between LSD and the eco-environment.

2. Analytical Framework

2.1. Symbiotic Relationship between LSD and Eco-Environment

As a symbiotic system, the development of land space is often accompanied by the destruction and instability of the corresponding eco-environment. Therefore, to realize the symbiotic development of land space, it is necessary to coordinate the symbiotic relationship between LSD and the eco-environment, providing the basis for the integrated development of the internal functional structure of land space. The early LSD was guided by the growth effect and took economic growth and urban expansion as the primary goal. Therefore, to a certain extent, it buried hidden dangers for the regional eco-environment, resulting in the gradual imbalance between LSD and the eco-environment. The problems of ecological degradation and environmental degradation have increasingly become an important obstacle to the healthy development of the social economy.
Symbiosis theory refers to the fact that different species live together and have extended material relationships [45]. It was originally mostly used in biological system relationships and believed that the willingness to survive between organisms must be interdependent and coexist in a certain way, thereby forming a coordinated coexistence symbiosis relation [45]. Symbiosis theory can be applied to the relationship between LSD and the eco-environment to reduce the negative effects of LSD on the eco-environment and enhance the ecological support capacity of land space.

2.2. Coupling Symbiosis Mechanism of LSD and Eco-Environment

Based on the symbiosis theory, aiming at the symbiosis coupling relationship between LSD and the eco-environment, the symbiosis mechanism is constructed from the perspective of “stress mechanism-driving mechanism-coupling coordination mechanism”. In addition, from the perspective of “parasitic mode-partial interest symbiosis mode-asymmetrical mutualism symbiosis mode-symmetrical mutualism symbiosis mode”, the symbiosis model between the LSD and the eco-environment is constructed (Figure 1). Among them, the stress mechanism includes natural elements and eco-environment elements, which are the basic factors forming the symbiosis mechanism. The driving mechanism includes economic activities, talent drainage, innovation and development, industrial agglomeration, etc., which are the key factors forming the symbiosis mechanism. The coupling coordination mechanism includes information flow, spatial flow, traffic flow, and other fluid elements, which is an important guarantee for the formation of a symbiosis mechanism. The combined effect of the three types of mechanisms is the key to promoting the symbiotic coupling of LSD and the eco-environment.
The symbiosis mode of LSD and the eco-environment can be divided into parasitic mode, partial interest symbiosis mode, asymmetrical mutualism mode and symmetry mutualism mode. The evolution of symbiosis mode also reflects the transition of LSD and the eco-environment from maladjusted recession and coordination transition to coupling coordination. As a multilateral and multi-directional communication model, the symmetrical mutualism symbiosis mode is a harmonious state of space development, and it is also an ideal symbiosis model for LSD and the eco-environment at present.

3. Materials and Methods
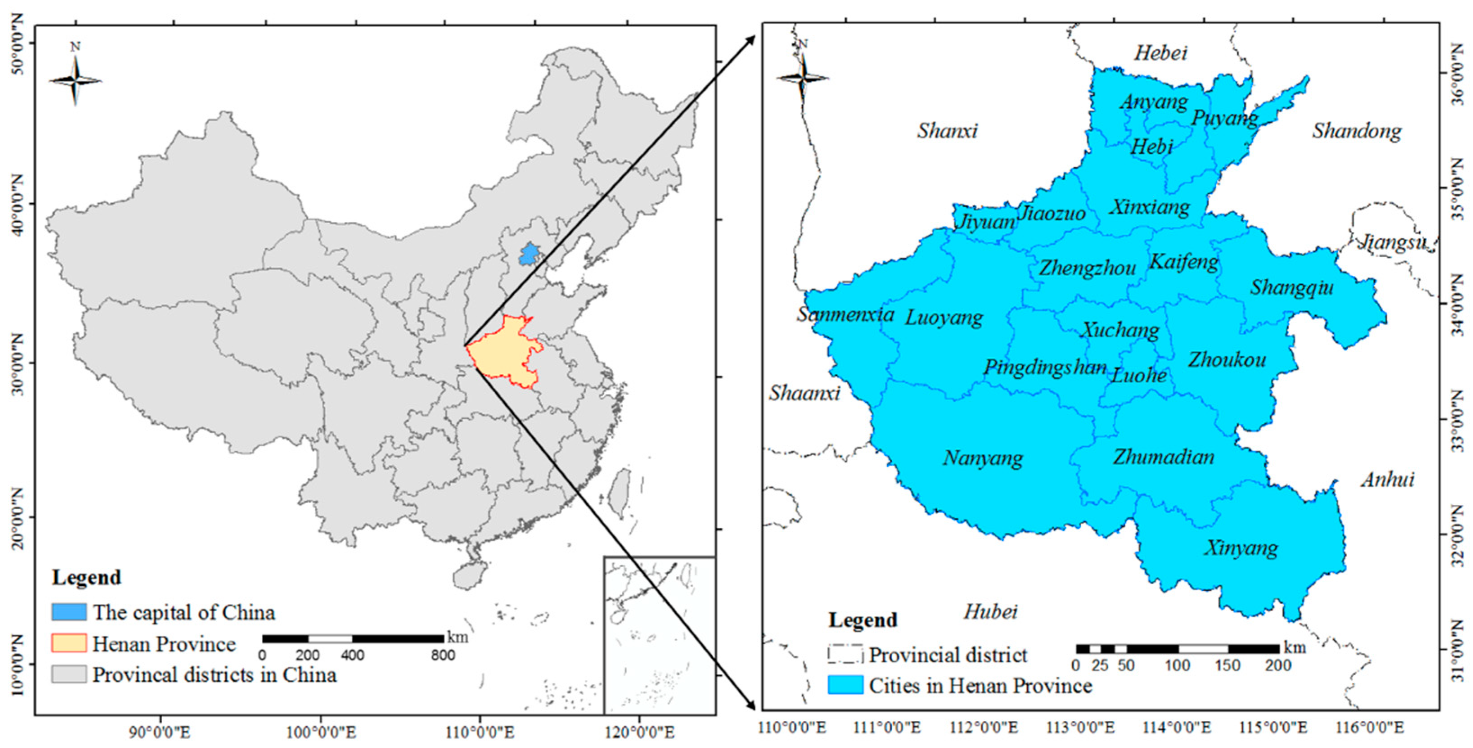
3.1. Study Area

Henan province is situated in the middle of China and the middle and lower reaches of the Yellow River (Figure 2). It has an area of 167,000 km2 and a total population of 109.06 million, with rich resources and comparatively high levels of socio-economic development. Henan province is composed of plains, basins, mountains, and hills, accounting for 55.7%, 26.6%, and 17.7% of the total area, respectively. In 2018, the GDP (gross domestic product) of the Henan province was 4.81 trillion Yuan. Meanwhile, the urbanization level was 51.71%. Henan province has achieved rapid progress in urbanization and industrialization in recent years. However, with the rapid economic development, the natural resource constraints of Henan province have become tighter, the pressure on the eco-environment brought by economic development has increased, and the spatial structure of land space has gradually become unbalanced. Therefore, it is urgent to optimize the land spatial pattern by reasonably judging the interactive coupling relationship between LSD and the eco-environment.
By the end of 2018, Henan province included 18 cities, and the population and area of different cities are shown in Table 1. Research on the symbiotic coupling relationship between LSD and eco-environment among 18 cities in Henan province is very important for the interconnection and collaborative development between cities.

3.2. Data Source and Processing

This study takes the cities of Henan province as the research unit and uses data from 2000–2018. Specifically, the land use data come from the Henan Land Use Survey (2000–2018). The social and economic data were obtained from the Henan statistical yearbook (2001–2019) and the other cities’ statistical yearbooks (2001–2019), as well as the statistical bulletin of the national economy and social development of Henan and cities in 2000–2018. The environmental data were obtained from the environmental status bulletin and water resources bulletins of Henan province and cities (2000–2018). The missing data of individual years in some cities are based on the data of adjacent years, supplemented by moving average and trend extrapolation methods.
Considering the differences that exist in both the dimension and magnitude of each of the selected indicators, the data need to be normalized before an analysis can be undertaken. This article uses a dimensionless method to standardize the positive and negative indicator data [46], and the formulas were as follows:
X i j = { x i j min ( x i j ) / max ( x i j ) min ( x i j ) max ( x i j ) x i j / max ( x i j ) min ( x i j ) }
where i is the indicator, j is the year, Xij is the standardized value, xij is the original value, and max (xij) and min (xij) represent the maximum and minimum value of the indicator i in all of the years studied.

3.3. The Indexes for Evaluation of LSD and Eco-Environment

In view of the symbiotic relationship and mechanism between LSD and eco-environment, this paper generally discusses the coercive effect of LSD on eco-environment from the aspects of population, space, economy, and society, and analyzes the restrictive effect of eco-environment on urbanization from the aspects of ecological resources, ecological pressure, and ecological response.
In order to accurately reflect the interactive symbiosis mechanism of LSD and eco-environment, taking into account the availability of data indicators and the actual situation of Henan province, 26 indicators are constructed from the two system levels of LSD and eco-environment [3,11,47]. The LSD system is made up of 3 sub-systems and 15 indicators (Table 2). The LSD system selects indicators from the land space carrying capacity, the socio-economic development level, and the population size, which mainly reflect the current status of LSD and the degree of socio-economic development. The eco-environment system is made up of 3 sub-systems and 11 indicators (Table 3). The eco-environment system selects indicators from the eco-environment pressure, eco-environment status, and eco-environment response, which mainly reflect the carrying capacity of resources ecological status.

3.4. Comprehensive Index Evaluation Model of LSD and Eco-Environment

This article involves multi-regional and multi-year, taking into account the interrelationship of indicators, and to eliminate the interference of subjective factors on the evaluation results, this article adopts the entropy method to calculate the index weights [48,49]. As an objective weighting method, the entropy method determines the index weight by calculating the index information entropy and the relative change degree of the index. The calculation equation is as follows:
e i = k i = 1 n P i j ln P i j , k = 1 ln n , P i j = X i j X i j
h i = 1 e i
W i = h i / i = 1 n h i
where i is the indicator, j is the year, n is the number of research units, ej is the information entropy of the i evaluation index, hi is the information utility value of the i evaluation index, Wi is the weight of the i evaluation index. The results of index weight are displayed in Table 2 and Table 3, respectively.
Furthermore, the linear weighting method is used to calculate the evaluation value of the LSD system and the eco-environment system, respectively [47]. The calculation method as follows:
F ( x ) = i = 1 n W i × X i , G ( y ) = j = 1 m W j × Y j
where F(x) represents the comprehensive evaluation value of LSD, G(y) represents the comprehensive evaluation value of eco-environment, Xi represents the standardized value of LSD, Yj represents the standardized value of eco-environment, Wi represents the evaluation index weight of LSD, Wj represents evaluation index weight of eco-environment.

3.5. Coupling Coordination Degree Model of LSD and Eco-Environment

3.5.1. Coupling Degree Model

Coupling degree is a physical concept, which mainly refers to the measurement of the degree of closeness between various modules in a certain system [4]. Studying the coupling degree between LSD and eco-environment can quantitatively reflect the interaction and stress relationship. Refer to existing related research to construct a coupling degree model between LSD and eco-environment [49,50]. The calculation method as follows:
C = { F ( x ) × G ( y ) [ F ( x ) + G ( y ) / 2 ] 2 } 1 / k
where C represents the coupling degree between LSD and eco-environment, C ∈ [0, 1], the larger the value of C, the higher the coupling degree and the stronger the interaction relationship. k represents the adjustment coefficient. Since this article mainly measured the coupling degree of the LSD system and eco-environment system, k = 2.

3.5.2. Coordination Degree Model

Although the coupling degree model can measure the strength of the interaction between different systems, it cannot reflect the level of coordinated development between different systems. Therefore, this article constructs the coordination degree model between LSD and eco-environment [10,51], the calculation method is as follows:
D = C × T
T = α × F ( x ) + β × G ( y )
where D is the coordination degree between LSD and eco-environment, T is the index value of LSD and eco-environment, α and β are the undetermined coefficients of LSD and eco-environment, respectively, α + β = 1. Considering that LSD and eco-environment protection are equally important in the process of regional economic development, the undetermined coefficients of α and β are both assigned a value of 0.5.

3.5.3. Classification of Coupling Coordination Degree

By referring to the standards of some scholars for the classification of coupling coordination degree [11], this paper divides the coupling coordination degree into 3 categories and 10 sub-categories according to the value of D. Meanwhile, combining the evaluation values of F(x) and G(y), the coupling coordination degree is further subdivided into 9 basic types to determine the coupling coordination degree and development types between LSD and eco-environment (Table 4).

3.6. Spatial Correlation Analysis Model between LSD and Eco-Environment

The spatial correlation model is the main method to study spatial correlation. Spatial correlation analysis can reflect a certain geographical phenomenon on a regional unit or the correlation degree between an attribute value and the attribute value of adjacent regional units. The spatial autocorrelation model generally used includes two aspects, one is the global spatial autocorrelation, and the other is the local spatial autocorrelation. The Global Moran’s I index can reflect the similarity of attribute values of adjacent units in space. The Local Moran’s I index can reflect the degree of difference between regions and adjacent regions. The calculation method is as follows:
G M I = n i j w i j ( Y i Y ¯ ) ( Y j Y ¯ ) ( i j w i j ) i ( Y i Y ¯ ) 2
L M I i = Y i Y ¯ S 2 j 1 n w i j ( Y j Y ¯ )
S 2 = 1 n ( Y i Y ¯ ) 2
where GMI and LMIi are the Global Moran’s I index andLocal Moran’s I index, respectively, Yi and Yj are the values of variables in adjacent paired space units, Wij is the spatial weight matrix. The value range of GMI is [−1, 1], the larger the value, the stronger the positive correlation; the smaller the value, the stronger the negative correlation. When it is equal to 0, it means that there is no spatial correlation. n is the total number of evaluation units in the study area; S2 is the variance of statistics. When the LMIi value is greater than 0, it indicates that there is “high-high” (“low-low”) aggregation in space; when the LMIi value is less than 0, it indicates that there is “high-low” (“low-high”) aggregation in space; When LMIi = 0, it is an insignificant area.

4. Results

4.1. Temporal Evolution Characteristics of LSD and Eco-Environment

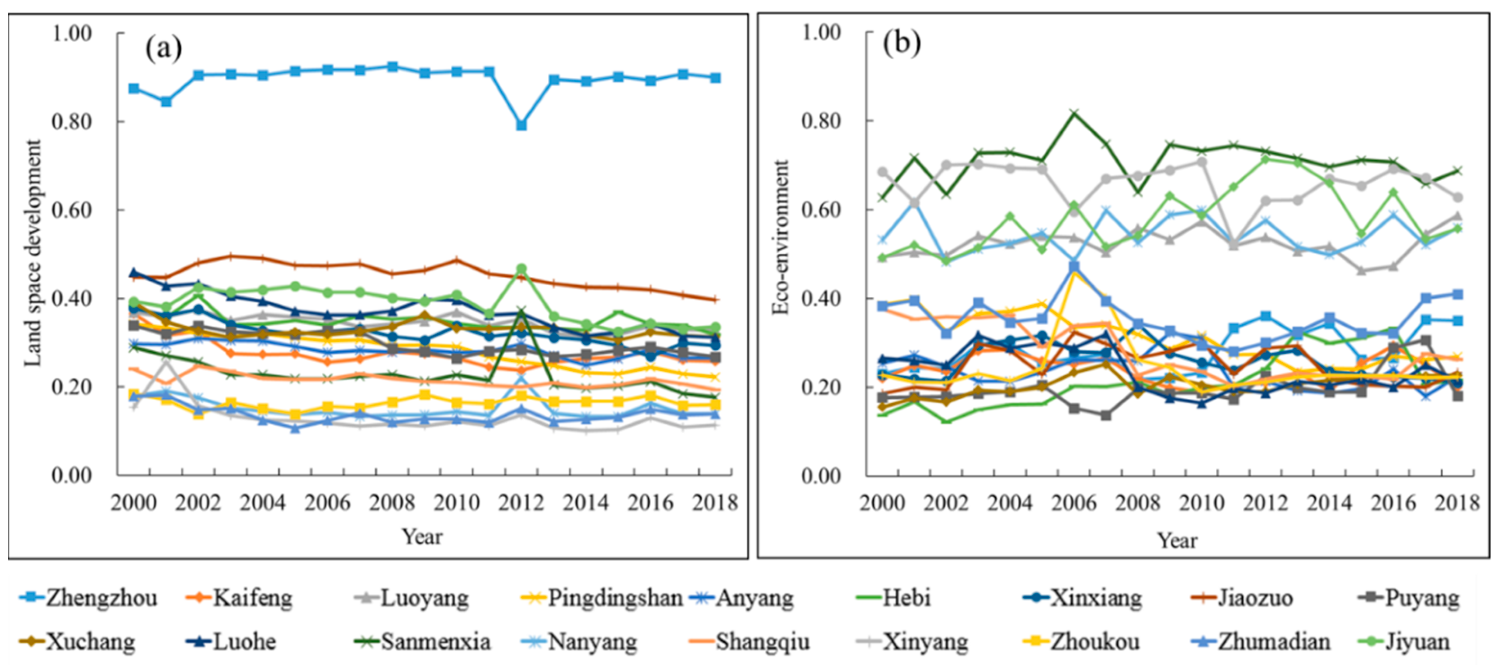
4.1.1. Evolution Trends of LSD and Eco-Environment

According to Formulas (2)–(5), the index evaluation values of LSD and the eco-environment system of 18 cities during 2000–2018 are calculated. Figure 3a shows the evolution trends of LSD. Figure 3b shows the evolution trends of the eco-environment. The results are as follows.
As is shown in Figure 3a, the level of LSD in various cities developed steadily without significant fluctuations during 2000–2010. After 2012, except in Zhengzhou city, Jiaozuo city, Luohe city, and Pingdingshan city, the level of LSD in most cities has risen slightly and has subsequently developed steadily. In terms of space, Zhengzhou city as the economic center of Henan province, has a significantly higher level of LSD than other cities, with obvious differences in regional gradients. The low-level areas are mostly located in the southern and southeastern Henan province, which are distributed in clusters. The reason is mainly due to the low social and economic production efficiency, weak non-agricultural production capacity, and lack of power points to enhance the capacity of regional economic development.
As is shown in Figure 3b, the overall eco-environment level is slowly shrinking and then increasing, and the speed of change is relatively stable, but the characteristics of periodic fluctuations are obvious. From 2000 to 2018, the eco-environment level of southwestern and northwestern has been significantly higher than other regions, while the eco-environment level of the central and eastern regions, represented by Zhengzhou city, Zhumadian city, and Zhoukou city, was relatively low. In terms of space, the high-value areas of the eco-environment are mostly closed to mountains and rivers, and the low-value areas are mostly concentrated in Zhengzhou city, Luoyang city, Xuchang city, etc. This type of area has a relatively high degree of economic development and serious environmental pollution, resulting in a low level of eco-environment.

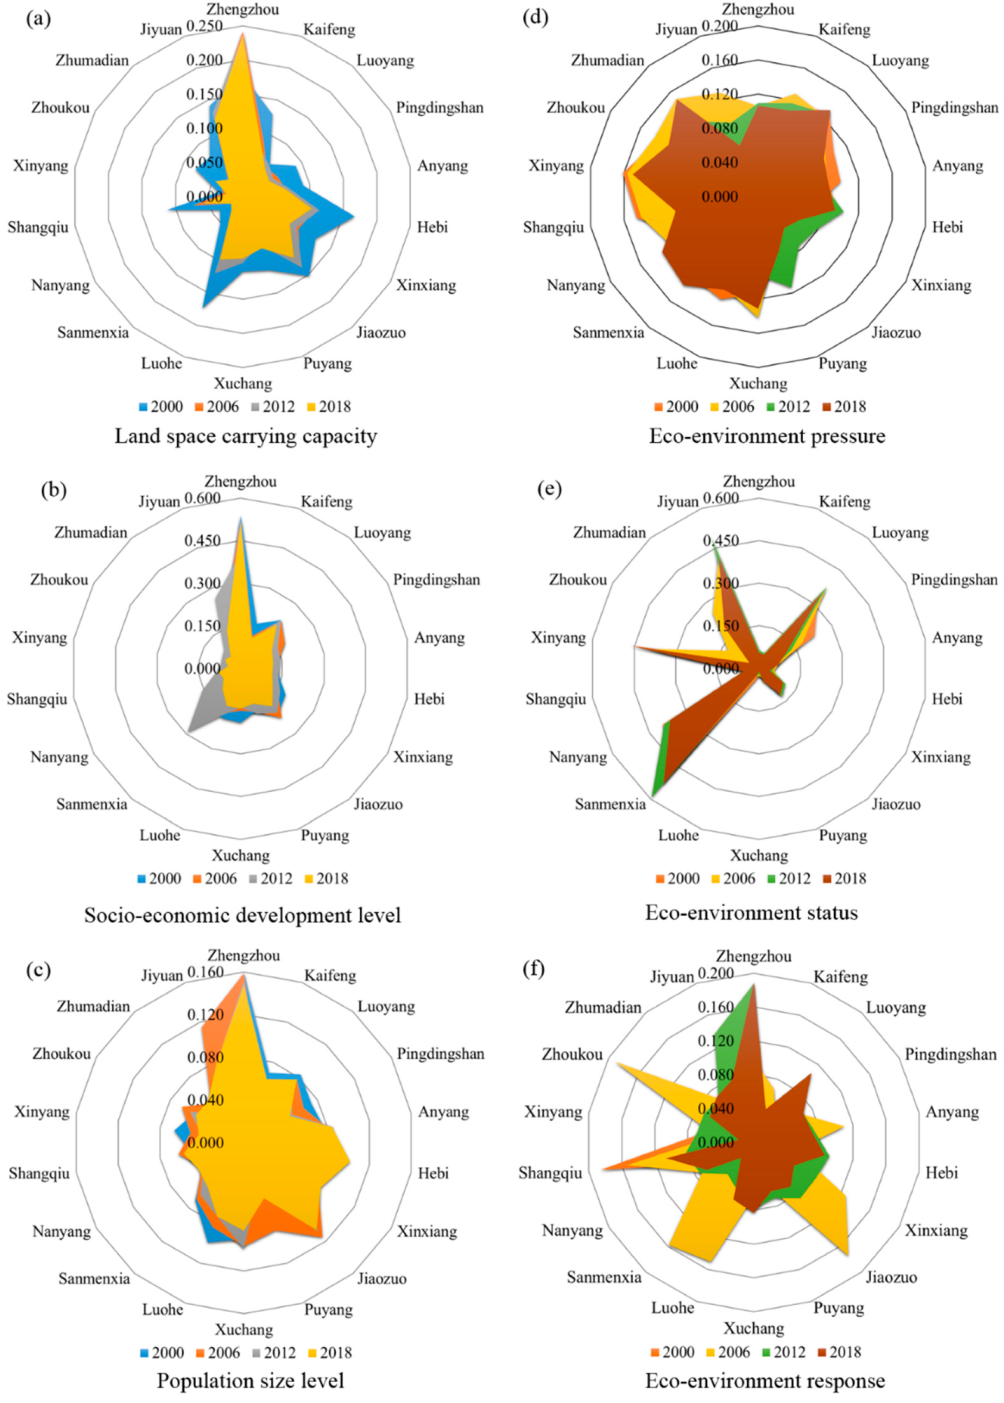
4.1.2. Evolution Trends of Subsystem between LSD and Eco-Environment

Figure 4a–c reflects the evolution trend of the LSD subsystem. From 2000 to 2018, the land space carrying capacity and the socio-economic development in Henan province showed a downward trend. The population scales of Zhengzhou, Kaifeng, Luoyang, Xuchang, and other cities are gradually decreasing, while other cities are slowly increasing. Spatially, high-value areas of land space carrying capacity are mainly located in the central and northern plains, while low-value areas are mostly located in northwest mountain basins. Due to natural and socio-economic conditions, most low-value areas have relatively weak spatial carrying capacity and economic levels. The distribution pattern of the socio-economic development level is similar to the land space carrying capacity. High-value areas are concentrated in the central and northern regions, such as Zhengzhou city, Luoyang city, and Xinxiang city, while low-value areas are concentrated in the western and northern regions. The population size level shows a pattern of “high in the middle east and low in the southwest”, which has a greater relationship with the natural conditions of the Henan province, especially the topography.
Figure 4d–f reflects the evolution trend of the eco-environment subsystem. From 2000 to 2018, the eco-environment pressure, the eco-environment status, and the eco-environment response showed a fluctuating development status. The subsystem of some cities, including Zhengzhou city, Luoyang city, and Luohe city, increased slowly, while the subsystem of other cities weakened sporadically. Spatially, the distribution pattern of eco-environment pressure is balanced, and the difference in the level of eco-environment pressure between different cities is relatively small. This is mainly due to the existence of different degrees of environmental problems in various cities. The eco-environment status mainly presents a distribution pattern of “high in the southwest and low in the middle”, which depends on the difference in natural resource endowments in the region. The pattern of the eco-environment response is in a dispersed state. Among them, Zhengzhou city and the radiation zone centered on Zhengzhou city have strong eco-environment response capabilities, while other cities need to be further strengthened.

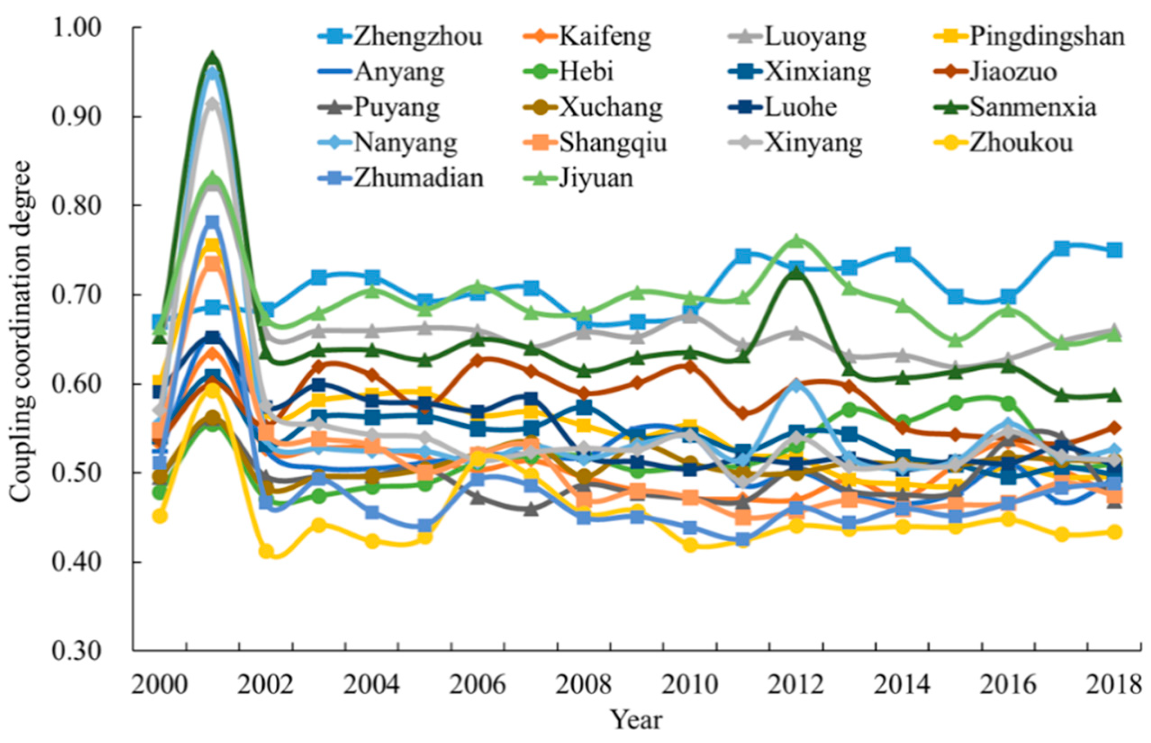
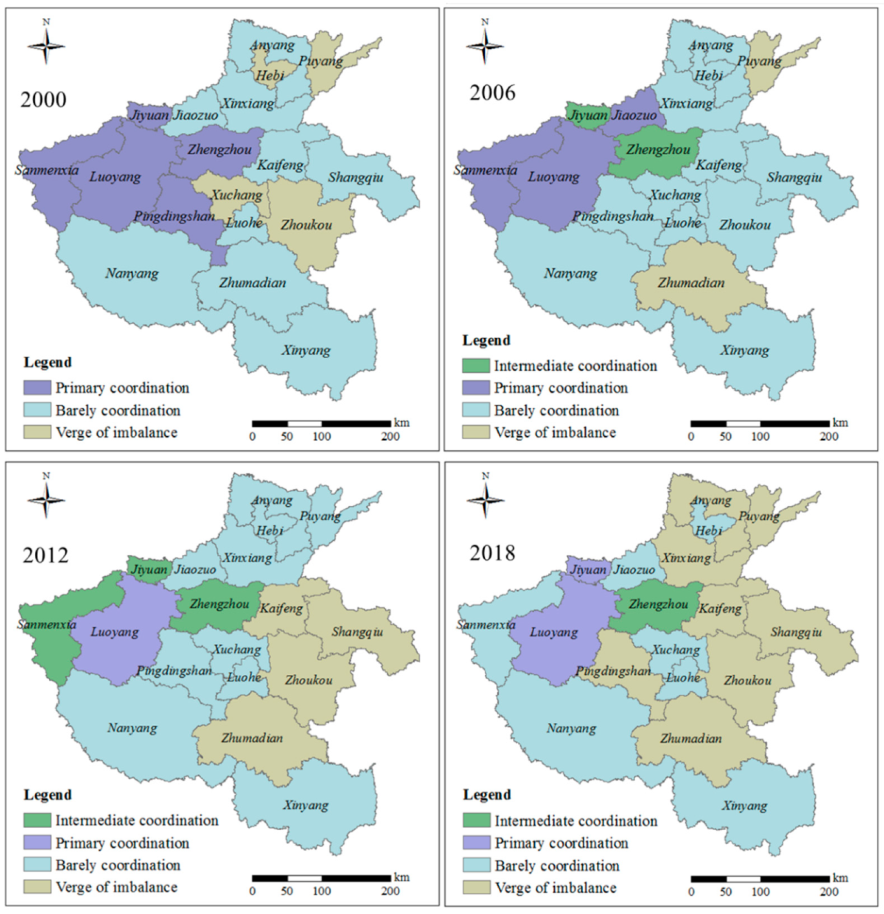
4.2. Spatiotemporal Pattern of Coupling Coordination Degree between LSD and Eco-Environment

The coupling coordination degree of LSD and the eco-environment is measured by Formulas (6)–(8), and the results are shown in Figure 5 and Figure 6.
Figure 5 reflects the time change of coupling coordination degree between LSD and the eco-environment during 2000–2018 in the Henan province. In terms of time series, from 2000 to 2018, the average value of the coupling coordination degree between LSD and the eco-environment is between 0.53–0.71, and the coupling coordination degree is mainly in the bare coordination and primary coordination stages. Specifically, the coupling coordination degree of various cities in the Henan province rose significantly in 2001, and some cities were in a state of advanced coordination. After 2001, the coupling coordination degree of various cities in the Henan province dropped sharply and then maintained a steady and rising trend (Figure 5). This is due to the unrestricted development of land space that has caused local governments to pay more attention to the regional eco-environment.
According to Figure 6, the coupling coordination degrees between LSD and the eco-environment show obvious spatial heterogeneity during 2000–2018. (1) In 2000, the coupling coordination degree was between 0.45–0.67. The eastern Henan plain and the northern Henan plain are on the verge of imbalance, while the south Henan and the central parts of Henan are in a state of barely coordination. In addition, Zhengzhou City, Luoyang City, Jiyuan City, Sanmenxia City, and Pingdingshan City are in a primary coordination state. (2) In 2006, the coupling coordination degree was between 0.47–0.71. Compared with 2000, the intermediate coordination type increased, and the verge of imbalance type decreased. The intermediate coordination and primary coordination areas are Zhengzhou City, Jiyuan City, Luoyang City, Sanmenxia City, and Jiaozuo City. The barely coordination and the verge of imbalance areas are mainly concentrated in the central and eastern regions of Henan. (3) In 2012, the coupling coordination degree was between 0.44–0.76. The spatial distribution pattern of the intermediate coordination type and the primary coordination type was relatively stable, and the intermediate coordination type added Sanmenxia City. Compared with 2006, the verge of imbalance type has increased. Intermediate coordination and primary coordination areas are still concentrated in central and western Henan. (4) In 2018, the degree of coupling coordination is between 0.43–0.75. Among them, Jiyuan City, Luoyang City, and Zhengzhou City are in the primary and intermediate coordination state. The barely coordination type and the verge of imbalance type are mainly concentrated in the eastern Henan plain, the Huanghuaihai plain, and the northern Henan plain. In summary, from 2000 to 2018, the overall spatial pattern of the coupling coordination degree in the Henan province was similar, with some changes in local types.

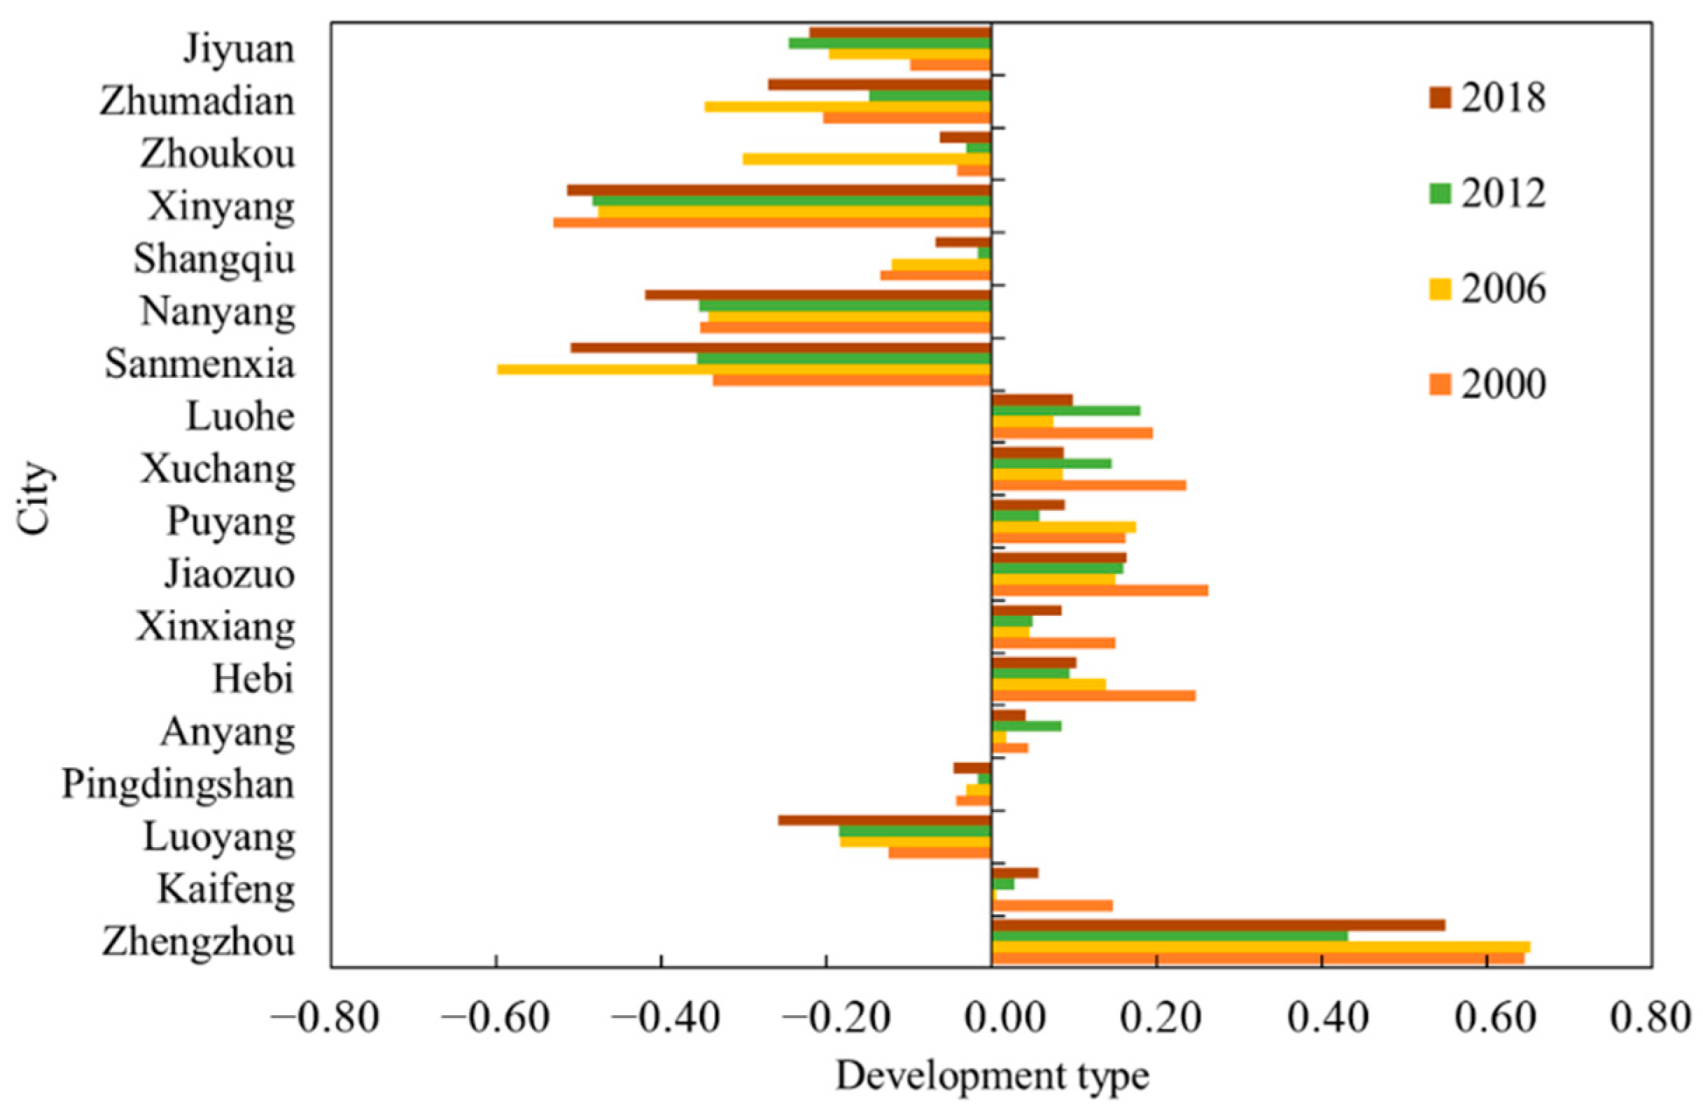
4.3. Development Type Characteristics of LSD and Eco-Environment

According to the classification criteria determined in Table 4, if the absolute value of the difference between F(x) and G(y) is less than 0.1, it is regarded as a balanced development type. If the difference between F(x) and G(y) is less than −0.1, it is regarded as a development lagging type; if the difference between F(x) and G(y) is greater than 0.1, it is regarded as eco-environment lagging type. Figure 7 plots the contrast of the development types of coupling coordination degree from 2000 to 2018 in the Henan province. Figure 7 shows that during the period 2000–2018, the number of development lagging types in 18 cities was more than the number of balanced development types and eco-environment lagging types. Luoyang City, Sanmenxia City, Nanyang City, Xinyang City, and Zhumadian City have been development lagging type from 2000 to 2018, indicating that the development speed and comprehensive quality of the land space in the Henan province still need to be focused on. However, the number of regions with eco-environment lagging type is the least. Only Zhengzhou City and Jiaozuo City have always belonged to the eco-environment lagging type, and the contradiction between LSD and the eco-environment development is less acute. Finally, the number of balanced development types is in the middle. Among them, Kaifeng City, Pingdingshan City, and Anyang City belonged to the balanced development type for a long time from 2000 to 2018, indicating that the Henan province has a good foundation for the coupling coordination between LSD and the eco-environment.

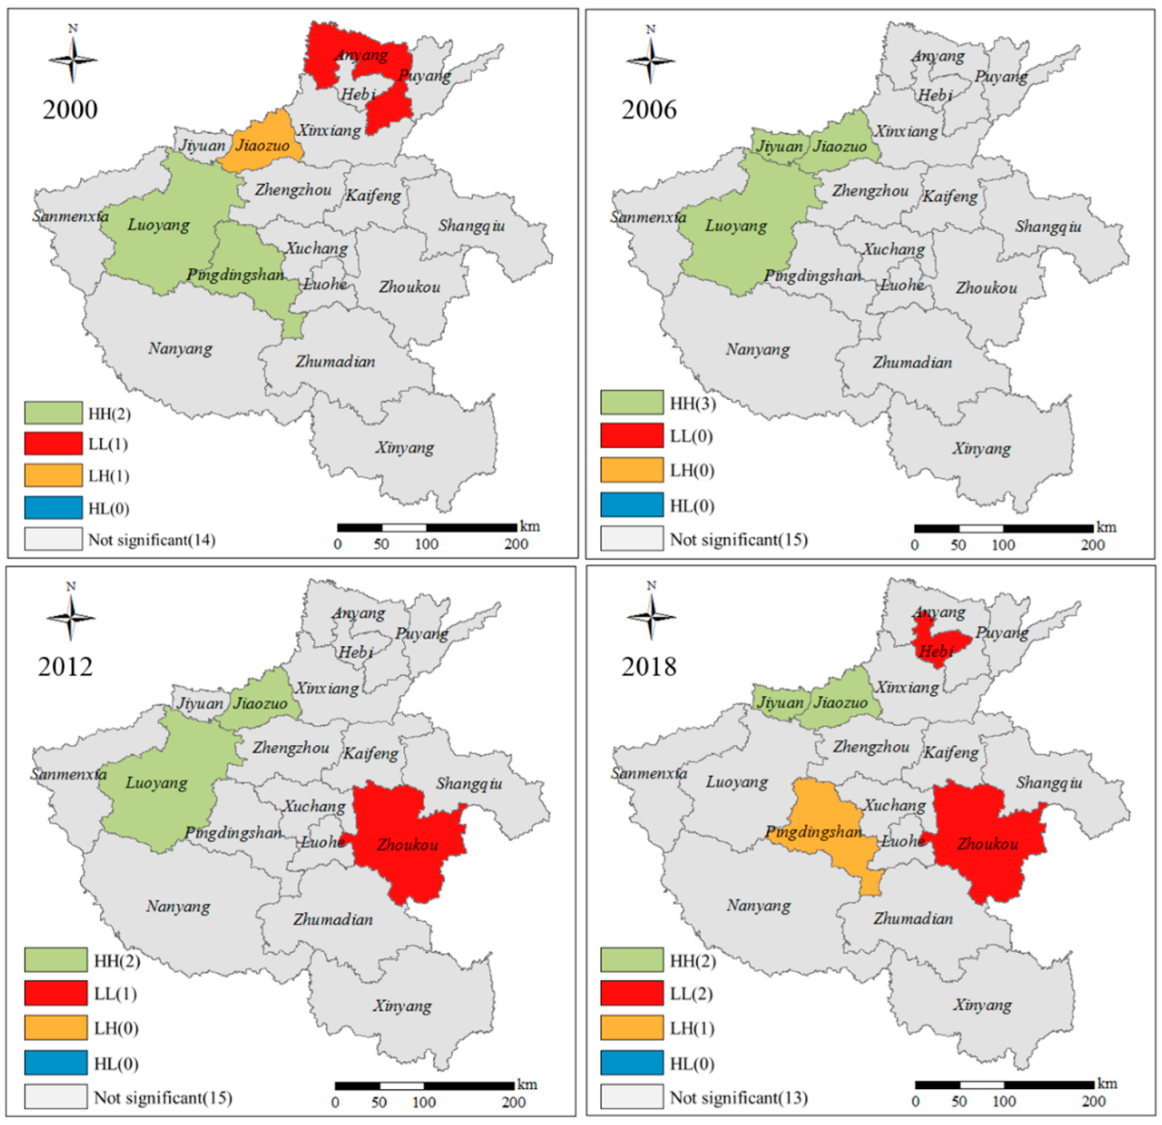
4.4. Spatiotemporal Pattern of Spatial Correlation between LSD and Eco-Environment

To further clarify the spatial correlation pattern of the coupling coordination degree between LSD and the eco-environment, the global autocorrelation is used for analysis, and the Moran scatter diagram is drawn (Figure 8). The scatter diagram is divided into four quadrants with the average value as the center. From the statistical results of each quadrant, the horizontal points of the coupling coordination degree are mainly distributed in the first quadrant and the third quadrant. The analysis shows that the Global Moran’s I index of the coupling coordination degree is significantly positive at the level of p = 0.05, and the Global Moran’s I index values in 2000, 2006, 2012, and 2018 are 0.381, 0.527, 0.439, and 0.287, respectively.
Furthermore, Geoda software is used to analyze the local spatial autocorrelation of coupling coordination degree between LSD and the eco-environment, and then the spatial heterogeneity of the local region is discussed (Figure 9). In terms of the time sequence, the number of H–H units remained unchanged from 2000 to 2018, but the spatial location changed. The position of the high–high area moves from west to northwest. From 2008 to 2018, the location of L–L units shifted from Anyang City to Hebi City and Zhoukou City, with a trend of “decentralized layout”. In 2000 and 2018, there was an L–H type in the research unit, but the spatial pattern of not significant type areas was relatively stable over time. In terms of spatial distribution, H–H units are mainly distributed in the northwest, and L–L units are mainly located in the east and north. In general, the coupling coordination degree of LSD and the eco-environment has certain spatial agglomeration characteristics. Among them, H–H units are in the form of “clusters”, L–L units are in the form of “dispersion”, and L–H units are randomly distributed around the H–H area.

5. Discussion

5.1. Rationality of the Interactive Coupling between LSD and Eco-Environment

Eco-environmental protection and governance in the process of urban development have always been issues that require urgent attention [52,53]. A series of environmental issues not only restrict the process of urban development but also affect the increase in economic aggregates. Therefore, in view of the interactive coupling relationship and the mechanism of LSD and the eco-environment, the stress effect of LSD on the eco-environment is generally discussed from the aspects of population, space, economy, and society. Meanwhile, from the aspects of ecological resources, ecological pressure, and ecological response to analyzing the restraint effect of the eco-environment on urbanization [3]. It can be seen that the LSD and the eco-environment both interact and restrict each other, and there is a symbiotic relationship between LSD and the eco-environment. To achieve comprehensive, coordinated, and sustainable regional development, it is necessary to coordinate the relationship between LSD and the eco-environment, and scientifically guide the orderly development of land space [54].
Current related researches mostly focus on the coupling level of urbanization and eco-environment [17,47,55,56]. For example, Sun [57] comprehensively used the coupling coordination degree model, spatial autocorrelation, geographic detectors, and other methods to analyze the spatial characteristics and driving mechanism of coupling coordination degree between urbanization and eco-environment in the Pan Yangtze River Delta from 2002 to 2014. Zhao [54] constructed the coupling coordination model of new urbanization and eco-environment, and then quantitatively measured the spatiotemporal differentiation and synchronous development state of coupling coordination in the Yellow River Basin from 2005 to 2016. However, the urbanization research mostly discusses the demographic, economic, and social levels, and fails to take into account the level of land space carrying capacity. The difference between this study and other studies is that the coupling symbiosis between LSD and the eco-environment is discussed from the perspectives of carrying capacity, economic level, and population, which can provide a basis for exploring the high-quality development path of land space in the Henan province to a certain extent.

5.2. Insights into the Relative Relationship between LSD and Eco-Environment

This paper analyzes the temporal evolution law of the LSD and the eco-environment in the Henan province, the temporal and spatial differentiation characteristics of the coupling coordination degree, as well as the development type, which can provide a basis for rational planning in Henan province. According to the results of the research, there are two patterns in the changing trend of the coupling coordination degree of the LSD and the eco-environment in the Henan province. On the one hand, as the degree of space development continues to increase, the eco-environment continues to be destroyed, and the coupling correlation between LSD and the eco-environment is gradually dispersed [8,57]. This is similar to the study about the optimization of urban land development spatial allocation [41], which believes that how to balance coordination of the layout of ecological spaces with urban land development to maximize the profit of developed land without affecting ecological protection, has become a key issue for urban planners to promote sustainable development. The other is that the increase in the land development degree is often accompanied by the increase in the economic development level, which in turn leads to the research area being more capable of environmental protection investment [58,59]. At the same time, the pressure on the eco-environment can be alleviated, and the relationship between LSD and the eco-environment can be more coordinated [60,61]. For example, the Henan province gradually increased its investment in ecological environmental protection in 2010. Especially in 2018, the Henan Province prepared the “ecological protection and restoration plan of mountains, rivers, forests, fields, lakes and grasses in Henan Province”, trying to build a solid ecological security pattern to improve the level of ecological security and ecological supply capacity. Therefore, with the comprehensive implementation of ecological protection projects, the quality of eco-environment in the Henan province has been significantly improved, which has promoted the healthy development of land space [62]. The two patterns can provide different references for urban construction and regional sustainable development.

5.3. Policy Implications and Limitations

Under the realistic background of the continuous spread of global urban space and the gradual imbalance of China’s land spatial structure in the process of urbanization, guiding the orderly development of land space has become an urgent need to achieve regional comprehensive, coordinated, and sustainable development.
Therefore, how to coordinate the relationship between LSD and the eco-environment is a problem that needs to be solved urgently. Firstly, guide the industrial development direction of different regions according to the current situation of LSD and resource constraints. At the same time, it is necessary to increase investment in industries and funds in areas with development lagging space, establish a diversified investment incentive mechanism, and guide private capital to participate in land development, protection, and renovation. For areas with eco-environment lagging type, it is necessary to encourage efficient development and green development, guide the development of high-tech industries, and strictly control the conversion of the ecological space in the region. Regarding the balanced development area, it is necessary to rationally utilize natural resources and deeply grasp the integrity, system, and internal laws of the ecosystem, so as to coordinate the land space.
In addition, it is necessary to carry out overall planning based on the spatial difference of the coupling coordination degree of various cities in the Henan province. At the same time, we should strengthen the awareness of the eco-environment crisis, actively create safeguard measures, and put an end to major ecological damage, environmental pollution, and other events. Finally, a regional coupling and coordinated development platform should be established, and a coupled linkage mechanism should be constructed from the aspects of technology, information, infrastructure, natural resources, etc., so as to achieve information sharing, policy exchange, and stimulate regional linkage effects and symbiotic development.
Although the established coupling coordination system and evaluation perspective have good applicability and a scientific basis, there are still some improvements to be made. Firstly, due to the availability of data and the limitations of quantitative methods, the indicators for LSD and the eco-environment system measurement need to be further optimized. Secondly, this article only studies the characteristics of the spatiotemporal pattern of coupling coordination between the LSD and the eco-environment system, and the interaction between them is not yet clear. In addition, a single-scale analysis may not be enough to reveal the true interaction between LSD and the eco-environment. More detailed small-scale research may produce some changes, and multi-scale comprehensive research is still necessary.

6. Conclusions

Taking 18 cities in Henan province as the study area and using 2000–2018 as the research period, the evaluation index system of LSD and the eco-environment was constructed. The entropy method and linear weighting method were employed to evaluate the evolution trend of LSD and the eco-environment. The coupling coordination model was established to illustrate the spatiotemporal differentiation characteristics and development types of the coupling coordination degree of LSD and the eco-environment. Then, the idea of symbiosis integration of LSD and the eco-environment was discussed.
The main research conclusions we got are as follows: (1) From 2000 to 2018, the overall level of LSD was steady and progressing, and the level of the eco-environment showed a slow decline. From a spatial perspective, there are regional gradient differences in the level of LSD, and there are obvious laws of regional dependence on the level of the eco-environment. (2) The overall coupling coordination degree of the Henan province is in the barely coordination stage and on the verge of imbalance. The degree of coordination varies with the local types over time. (3) The lagging problem of LSD in the Henan province has always existed, indicating that the relationship between LSD and the eco-environment has not yet reached the ideal state of coupling coordination. It is necessary to improve the level of coupling coordination to achieve symbiotic development. (4) The agglomeration pattern of the coupling coordination degree of LSD and the eco-environment fluctuates slightly over time, while the spatial correlation pattern of the coupling coordination degree is basically consistent with the spatial distribution of development.

Author Contributions

Conceptualization, X.X. and X.L.; methodology, X.X.; software, X.X.; validation, X.X.; formal analysis, X.X.; investigation, X.X.; resources, X.X.; data curation, X.L.; writing—original draft preparation, X.X.; writing—review and editing, X.X. and H.F.; visualization, X.X.; supervision, X.L.; project administration, X.L.; funding acquisition, X.L. All authors have read and agreed to the published version of the manuscript.

Funding

This study was funded by the National Natural Science Foundation of China (71874192).

Data Availability Statement

Not applicable.

Acknowledgments

The authors would like to thank the anonymous reviewers for their comments and suggestions.

Conflicts of Interest

The authors declare no conflict of interest.

References

  1. Kuang, W. Issues regarding spatial pattern change of national land space and its overall implementation on beautiful vision in new era. Resour. Sci. 2019, 41, 23–32. [Google Scholar] [CrossRef] [Green Version]
  2. National Bureau of Statistics of China. China Statistical Yearbook; China Statistics Press: Beijing, China, 2019. (In Chinese)
  3. Liu, Y.; Wang, S. Coupling coordinative degree and interctive coercing relationship between urbanization and eco-environment in pearl river delta. Hum. Geogr. 2015, 30, 64–71. (In Chinese) [Google Scholar]
  4. Zhu, Q.; Chen, Y.; Hu, W.; Mei, Y. Spatiotemporal pattern of coupling coordination degree between land intensive use and regional ecological efficiency in China. Trans. CSAE 2020, 36, 234–243. (In Chinese) [Google Scholar]
  5. Keola, S.; Andersson, M.; Hall, O. Monitoring Economic Development from Space: Using Nighttime Light and Land Cover Data to Measure Economic Growth. World Dev. 2015, 66, 322–334. [Google Scholar] [CrossRef]
  6. Liu, J.; Jin, X.; Xu, W.; Fan, Y.; Ren, J.; Zhang, X.; Zhou, Y. Spatial coupling differentiation and development zoning trade-off of land space utilization efficiency in eastern China. Land Use Policy 2019, 85, 310–327. [Google Scholar] [CrossRef]
  7. Xie, X.; Li, X.; He, W. A land space development zoning method based on resource–environmental carrying capacity: A case study of henan, China. Int. J. Environ. Res. Public Health 2020, 17, 900. [Google Scholar] [CrossRef] [Green Version]
  8. He, J.; Wang, S.; Liu, Y.; Ma, H.; Liu, Q. Examining the relationship between urbanization and the eco-environment using a coupling analysis: Case study of Shanghai, China. Ecol. Indic. 2017, 77, 185–193. [Google Scholar] [CrossRef]
  9. Grossman, G.M.; Kreuger, A.B. Economic growth and the environment. Quart. J. Econ. 1994, 110, 353–378. [Google Scholar] [CrossRef] [Green Version]
  10. Chen, X.; Huang, B.; Lin, C.T. Environmental awareness and environmental Kuznets curve. Econ. Model. 2019, 77, 2–11. [Google Scholar] [CrossRef]
  11. Xiong, X.; Xiao, J. Evaluation of coupling coordination between urbanization and eco-environment in six central cities, Wuling Mountain area. Acta Ecol. Sin. 2021, 41, 5973–5987. (In Chinese) [Google Scholar]
  12. Ariken, M.; Zhang, F.; Liu, K.; Fang, C.; Kung, H.-T. Coupling coordination analysis of urbanization and eco-environment in Yanqi Basin based on multi-source remote sensing data. Ecol. Indic. 2020, 114, 106331. [Google Scholar] [CrossRef]
  13. Liu, W.; Jiao, F.; Ren, L.; Xu, X.; Wang, J.; Wang, X. Coupling coordination relationship between urbanization and atmospheric environment security in Jinan City. J. Clean. Prod. 2018, 204, 1–11. [Google Scholar] [CrossRef]
  14. Hersperger, A.M.; Oliveira, E.; Pagliarin, S.; Palka, G.; Verburg, P.; Bolliger, J.; Grădinaru, S. Urban land-use change: The role of strategic spatial planning. Glob. Environ. Chang. 2018, 51, 32–42. [Google Scholar] [CrossRef]
  15. He, S.; Luo, D.; Guo, K. Analysis of Factors Affecting the Coordinated Development of Urbanization and the Ecological Resource Environment in Southwest China Based on Data Mining. J. Urban. Plan. Dev. 2021, 147, 04021034. [Google Scholar] [CrossRef]
  16. Zhao, Y.; Wang, S.; Zhou, C. Understanding the relation between urbanization and the eco-environment in China’s Yangtze River Delta using an improved EKC model and coupling analysis. Sci. Total Environ. 2016, 571, 862–875. [Google Scholar] [CrossRef]
  17. Feng, Y.; He, S.; Li, G. Interaction between urbanization and the eco-environment in the Pan-Third Pole region. Sci. Total Environ. 2021, 789, 148011. [Google Scholar] [CrossRef]
  18. Başar, S.; Tosun, B. Environmental Pollution Index and economic growth: Evidence from OECD countries. Environ. Sci. Pollut. Res. 2021, 28, 36870–36879. [Google Scholar] [CrossRef]
  19. Wang, S.; Zhou, H.; Hua, G.; Wu, Q. What is the relationship among environmental pollution, environmental behavior, and public health in China? A study based on CGSS. Environ. Sci. Pollut. Res. 2021, 28, 20299–20312. [Google Scholar] [CrossRef]
  20. Ruiz, I.; Sanz-Sánchez, M.J. Effects of historical land-use change in the Mediterranean environment. Sci. Total Environ. 2020, 732, 139315. [Google Scholar] [CrossRef]
  21. Song, Y.; Chen, B.; Kwan, M.P. How does urban expansion impact people’s exposure to green environments? A comparative study of 290 Chinese cities. J. Clean. Prod. 2020, 246, 119018. [Google Scholar] [CrossRef]
  22. Zhao, L.; Sun, C.; Liu, F. Interprovincial two-stage water resource utilization efficiency under environmental constraint and spatial spillover effects in China. J. Clean. Prod. 2017, 164, 715–725. [Google Scholar] [CrossRef]
  23. Fan, M.; Xu, J.; Chen, Y.; Li, D.; Tian, S. How to sustainably use water resources—a case study for decision support on the water utilization of xinjiang, china. Water 2020, 12, 3564. [Google Scholar] [CrossRef]
  24. Gao, S.; Sun, H.; Zhao, L.; Wang, R.; Xu, M.; Cao, G. Dynamic assessment of island ecological environment sustainability under urbanization based on rough set, synthetic index and catastrophe progression analysis theories. Ocean. Coast. Manag. 2019, 178, 104790. [Google Scholar] [CrossRef]
  25. Filho, W.L.; Barbir, J.; Sima, M.; Kalbus, A.; Nagy, G.J.; Paletta, A.; Villamizar, A.; Martinez, R.; Azeiteiro, U.M.; Pereira, M.J.; et al. Reviewing the role of ecosystems services in the sustainability of the urban environment: A multi-country analysis. J. Clean. Prod. 2020, 262, 121338. [Google Scholar] [CrossRef]
  26. Qin, T.; Zhang, H.; Tong, J.; Ma, J.; Zhi, Y. Water resource constraint on urbanization in Yangtze River Economic Belt. China Popul. Resour. Environ. 2018, 28, 39–45. (In Chinese) [Google Scholar]
  27. Zhao, D.; Tong, L.; Qiu, F.; Guo, F. Eco-environment effect of urban expansion in Songhua River Basin. Geogr. Res. 2017, 36, 74–84. [Google Scholar] [CrossRef]
  28. Nguyen, C.T.; Chidthaisong, A.; Limsakul, A.; Varnakovida, P.; Ekkawatpanit, C.; Diem, P.K.; Diep, N.T.H. How do disparate urbanization and climate change imprint on urban thermal variations? A comparison between two dynamic cities in Southeast Asia. Sustain. Cities Soc. 2022, 82, 103882. [Google Scholar] [CrossRef]
  29. Raihan, A.; Tuspekova, A. Dynamic impacts of economic growth, energy use, urbanization, agricultural productivity, and forested area on carbon emissions: New insights from Kazakhstan. World Dev. Sustain. 2022, 1, 100019. [Google Scholar] [CrossRef]
  30. Kijima, M.; Nishide, K.; Ohyama, A. Economic models for the environmental Kuznets curve: A survey. J. Econ. Dyn Control 2010, 34, 1187–1201. [Google Scholar] [CrossRef]
  31. Veziroglu, A.; Macario, R. A system dynamics model for the reduction of health expenditures through transition to hydrogen vehicles (Srth): Case studies in the USA, China, and India. Int. J. Green. Energy 2014, 11, 695–726. [Google Scholar] [CrossRef]
  32. Chuvieco, E. Integration of linear programming and GIS for land-use modelling. Int. J. Geogr. Inf. Syst. 1993, 7, 71–83. [Google Scholar] [CrossRef]
  33. Hajiagha, S.H.R.; Akrami, H.; Hashemi, S.S. A multi-objective programming approach to solve grey linear programming. Grey Syst. Theory Appl. 2012, 2, 259–271. [Google Scholar] [CrossRef]
  34. Ghoseiri, K.; Ghannadpour, S.F. Multi-objective vehicle routing problem with time windows using goal programming and genetic algorithm. Appl. Soft Comput. J. 2010, 10, 1096–1107. [Google Scholar] [CrossRef]
  35. Shen, Q.; Chen, Q.; Tang, B.; Yeung, S.; Hu, Y.; Cheung, G. A system dynamics model for the sustainable land use planning and development. Habitat Int. 2009, 33, 15–25. [Google Scholar] [CrossRef]
  36. Stewart, T.J.; Janssen, R.; Herwijnen, M.V. A Genetic Algorithm Approach to Multi-Objective Land Use Planning; Elsevier Science Ltd.: Amsterdam, The Netherlands, 2004; pp. 2293–2313. [Google Scholar]
  37. Hong, K.Y.; Pinheiro, P.O.; Minet, L.; Hatzopoulou, M.; Weichenthal, S. Extending the spatial scale of land use regression models for ambient ultrafine particles using satellite images and deep convolutional neural networks. Environ. Res. 2019, 176, 108513. [Google Scholar] [CrossRef] [PubMed]
  38. Han, J.; Hayashi, Y.; Cao, X.; Imura, H. Application of an integrated system dynamics and cellular automata model for urban growth assessment: A case study of Shanghai, China. Landsc. Urban. Plan. 2009, 91, 133–141. [Google Scholar] [CrossRef]
  39. Jiang, W.; Chen, Z.; Lei, X.; Jia, K.; Wu, Y. Simulating urban land use change by incorporating an autologistic regression model into a CLUE-S model. J. Geogr. Sci. 2015, 25, 836–850. [Google Scholar] [CrossRef] [Green Version]
  40. Gao, J.; Huang, J.; Li, S.; Cai, Y. The New Progresses and Development Trends in the Research of Physio-Geographical Regionalization in China. Prog. Geogr. 2010, 29, 1400–1407. (In Chinese) [Google Scholar]
  41. Tong, H.; Shi, P.; Bao, S.; Zhang, X.; Nie, X. Optimization of Urban Land Development Spatial Allocation Based on Ecology-Economy Comparative Advantage Perspective. J. Urban. Plan. Dev. 2018, 144, 05018006. [Google Scholar] [CrossRef]
  42. Fan, Y.; Fang, C.; Zhang, Q. Coupling coordinated development between social economy and ecological environment in Chinese provincial capital cities-assessment and policy implications. J. Clean. Prod. 2019, 229, 289–298. [Google Scholar] [CrossRef]
  43. Li, J.; Ouyang, X.; Zhu, X. Land space simulation of urban agglomerations from the perspective of the symbiosis of urban development and ecological protection: A case study of Changsha-Zhuzhou-Xiangtan urban agglomeration. Ecol. Indic. 2021, 126, 107669. [Google Scholar] [CrossRef]
  44. Wang, C.; Fei, Z.; Ye, Q.; Zhang, Y. Rural settlement space reconstruction strategy and implementation based on symbiosis theory on village scale. Trans. CSAE 2014, 30, 205–214. (In Chinese) [Google Scholar]
  45. Xie, X.; Li, X.; Fan, H.; He, W. Spatial analysis of production-living-ecological functions and zoning method under symbiosis theory of Henan, China. Environ. Sci. Pollut. Res. 2021, 28, 69093–69110. [Google Scholar] [CrossRef] [PubMed]
  46. Liu, Y.; Liu, Y.; Chen, Y. Territorial Multi-functionality Evaluation and Decision-making Mechanism at County Scale in China. Acta Geogr. Sin. 2011, 66, 1379–1389. (In Chinese) [Google Scholar]
  47. Wang, S.; Fang, C.; Wang, Y. Quantitative investigation of the interactive coupling relationship between urbanization and eco-environment. Acta Ecol. Sin. 2015, 35, 2244–2254. [Google Scholar]
  48. Shemshadi, A.; Shirazi, H.; Toreihi, M.; Tarokh, M.J. A fuzzy VIKOR method for supplier selection based on entropy measure for objective weighting. Expert Syst. Appl. 2011, 38, 12160–12167. [Google Scholar] [CrossRef]
  49. Li, Y.; Li, Y.; Zhou, Y.; Shi, Y.; Zhu, X. Investigation of a coupling model of coordination between urbanization and the environment. J. Environ. Manag. 2012, 98, 127–133. [Google Scholar] [CrossRef]
  50. Zhao, L.; Li, L.; Wu, Y. Research on the coupling coordination of a sea-land system based on an integrated approach and new evaluation index system: A case study in Hainan province, China. Sustainability 2017, 9, 859. [Google Scholar] [CrossRef] [Green Version]
  51. Sun, Y.; Cui, Y. Evaluating the coordinated development of economic, social and environmental benefits of urban public transportation infrastructure: Case study of four Chinese autonomous municipalities. Transp. Policy 2018, 66, 116–126. [Google Scholar] [CrossRef]
  52. Shao, H.; Liu, M.; Shao, Q.; Sun, X.; Wu, J.; Xiang, Z.; Yang, W. Research on eco-environmental vulnerability evaluation of the Anning River Basin in the upper reaches of the Yangtze River. Environ. Earth Sci. 2014, 72, 1555–1568. [Google Scholar] [CrossRef]
  53. Zhou, Y.; Li, Y.; Liu, Y. The nexus between regional eco-environmental degradation and rural impoverishment in China. Habitat Int. 2020, 96, 102086. [Google Scholar] [CrossRef]
  54. Zhao, J.; Liu, Y.; Zhu, Y.; Qin, S.; Wang, Y.; Miao, C. Spatiotemporal differentiation and influencing factors of the coupling and coordinated development of new urbanization and ecological environment in the Yellow River Basin. Resour. Sci. 2020, 42, 159–171. (In Chinese) [Google Scholar] [CrossRef]
  55. Fang, C.; Cui, X.; Li, G.; Bao, C.; Wang, Z.; Ma, H.; Sun, S.; Liu, H.; Luo, K.; Ren, Y. Modeling regional sustainable development scenarios using the Urbanization and Eco-environment Coupler: Case study of Beijing-Tianjin-Hebei urban agglomeration, China. Sci. Total Environ. 2019, 689, 820–830. [Google Scholar] [CrossRef] [PubMed]
  56. Fang, C.; Cui, X.; Deng, X.; Liang, L. Urbanization and eco-environment coupling circle theory and coupler regulation. J. Geogr. Sci. 2020, 30, 1043–1059. [Google Scholar] [CrossRef]
  57. Sun, H.; Huang, Z.; Xu, D.; Shi, X.; Liu, H.; Tan, L.; Ge, J. The spatial characteristics and drive mechanism of coupling relationship between urbanization and eco-environment in the Pan Yangtze River Delta. Econ. Geogr. 2017, 37, 163–186. (In Chinese) [Google Scholar]
  58. Shu, C.; Xie, H.; Jiang, J.; Chen, Q. Is Urban Land Development Driven by Economic Development or Fiscal Revenue Stimuli in China? Land Use Policy 2018, 77, 107–115. [Google Scholar] [CrossRef]
  59. Wang, L.O.; Wu, H.; Hao, Y. How does China’s land finance affect its carbon emissions? Struct. Chang. Econ. Dyn. 2020, 54, 267–281. [Google Scholar] [CrossRef]
  60. Zhang, X.; Wu, L.; Zhang, R.; Deng, S.; Zhang, Y.; Wu, J.; Li, Y.; Lin, L.; Li, L.; Wang, Y.; et al. Evaluating the relationships among economic growth, energy consumption, air emissions and air environmental protection investment in China. Renew. Sustain. Energy Rev. 2013, 18, 259–270. [Google Scholar] [CrossRef]
  61. Zhang, W.; Li, G. Environmental decentralization, environmental protection investment, and green technology innovation. Environ. Sci. Pollut. Res. 2022, 29, 12740–12755. [Google Scholar] [CrossRef]
  62. Xie, X.; Li, X. Spatio-temporal evolution characteristics and influencing factors of “production-living-ecological” functions in Henan Province, China. Transac. CSAE 2021, 37, 243–252. (In Chinese) [Google Scholar]
Figure 1. Symbiotic mechanism of LSD and eco-environment.
Land 11 01252 g001
Figure 2. Study area.
Land 11 01252 g002
Figure 3. Evolution trends during 2000–2018. (a) represents the evolution trends of land space development (LSD); (b) represents the evolution trends of eco-environment.
Land 11 01252 g003
Figure 4. The evolution trends of subsystem during 2000–2018. (a) represents the evolution trends of land space carrying capacity; (b) represents the evolution trends of socio-economic development level; (c) represents the evolution trends of population size level; (d) represents the evolution trends of eco-environment pressure; (e) represents the evolution trends of eco-environment status; (f) represents the evolution trends of eco-environment response.
Land 11 01252 g004
Figure 5. Time change of coupling coordination degree between LSD and eco-environment during 2000–2018.
Land 11 01252 g005
Figure 6. Spatial distribution of coupling coordination degree between LSD and eco-environment from 2000 to 2018.
Land 11 01252 g006
Figure 7. The contrast of the development types of coupling coordination degree from 2000 to 2018.
Land 11 01252 g007
Figure 8. Moran’s scatter plot of coupling coordination degree between LSD and eco-environment from 2000 to 2018.
Land 11 01252 g008
Figure 9. Local spatial correlation of coupling coordination degree between LSD and eco-environment from 2000 to 2018.
Land 11 01252 g009
Table 1. Population and area of 18 cities in Henan province.
NumberCity Population (10,000 Persons)Total Area (sq.km)
1Zhengzhou7877567
2Kaifeng5266240
3Luoyang71415,236
4Pingdingshan5537910
5Anyang5927352
6Hebi1662140
7Xinxiang6178291
8Jiaozuo3773973
9Puyang3994271
10Xuchang4984979
11Luohe2842692
12Sanmenxia2319936
13Nanyang119826,511
14Shangqiu92610,704
15Xinyang88518,916
16Zhoukou116211,961
17Zhumadian92015,086
18Jiyuan711899
Table 2. The index system of land space development (LSD).
Target LevelSub-SystemIndicators (Unit)Serial NumberWeightAttribute
Land space developmentLand space carrying capacityUrban land proportion (%)L10.0814 +
Rural land proportion (%)L20.0298 +
Traffic land density (%)L30.0605 +
Built-up area per 10,000 people (km2/person)L40.0783
Socio-economic development levelEconomic density (yuan/km2)L50.0791 +
Gross industrial production per area (yuan/km2)L60.0724 +
Proportion of secondary and tertiary industries (%)L70.0440 +
Per capita retail sales (yuan/person)L80.0994 +
Per capita disposable income ratio in urban and rural areas (%)L90.0543 +
Number of college students per 10,000 people (person)L100.1643 +
Number of hospital beds per 10,000 people (unit)L110.0559 +
Population size levelPopulation density (person/km2)L120.0325 +
Population urbanization rate (%)L130.0602 +
Natural population growth rate (%)L140.0325
Proportion of employees in secondary and tertiary industries (%)L150.0554 +
Note: “+” means a positive index, “−”means a negative index.
Table 3. The index system of eco-environment.
Target LevelSub-SystemIndicators (Unit)Serial NumberWeightAttribute
Eco-environmentEco-environment pressurePer capita industrial wastewater discharge (t/person)E10.0366
Per capita industrial sulfur dioxide emission (t/person)E20.0312
Per capita comprehensive water (t/person)E30.0510
Input intensity of chemical fertilizer (kg/hm2)E40.0578
Eco-environment statusForest coverage (%)E50.1659 +
Per capita total water resources (m3/person)E60.1521 +
Per capita ecological land area (km2/person)E70.1855 +
Habitat abundance index (−)E80.1170 +
Eco-environment responseHarmless treatment rate of domestic waste (%)E90.0322+
Comprehensive utilization rate of industrial solid waste (%)E100.0315+
Proportion of total environmental investment (%)E110.1393+
Note: “+” means a positive index, “−”means a negative index.
Table 4. Classification of coupling coordination types between LSD and eco-environment.
CategoryIntervalSub-CategoryF(x) and G(y)Development Type Characteristics
Coupling coordination stage0.9 < D ≤ 1Advanced coordinationF(x) − G(y) > 0.1
|F(x) − G(y)| < 0.1
F(x) − G(y) < −0.1
Coupling coordination—Eco-environment lagging
Coupling coordination—Balanced development
Coupling coordination—Development lagging
0.8 < D ≤ 0.9Well coordination
0.7 < D ≤ 0.8Intermediate coordination
0.6 < D ≤ 0.7Primary coordination
Coordination transition stage0.5 < D ≤ 0.6Barely coordinationF(x) − G(y) > 0.1
|F(x) − G(y)| < 0.1
F(x) − G(y) < −0.1
Coordination transition—Eco-environment lagging
Coordination transition—Balanced development
Coordination transition—Development lagging
0.4 < D ≤ 0.5Verge of imbalance
Maladjusted recession stage0.3 < D ≤ 0.4Mild imbalanceF(x) − G(y) > 0.1
|F(x) − G(y)| ≤ 0.1
F(x) − G(y) ≤ −0.1
Maladjusted recession—Eco-environment lagging
Maladjusted recession—Balanced development
Maladjusted recession—Development lagging
0.2 < D ≤ 0.3Moderate imbalance
0.1 < D ≤ 0.2Serious imbalance
0 < D ≤ 0.1Extreme imbalance
Publisher’s Note: MDPI stays neutral with regard to jurisdictional claims in published maps and institutional affiliations.

