4.3.1. Variable Selection
- (1)
Setting of explained variables
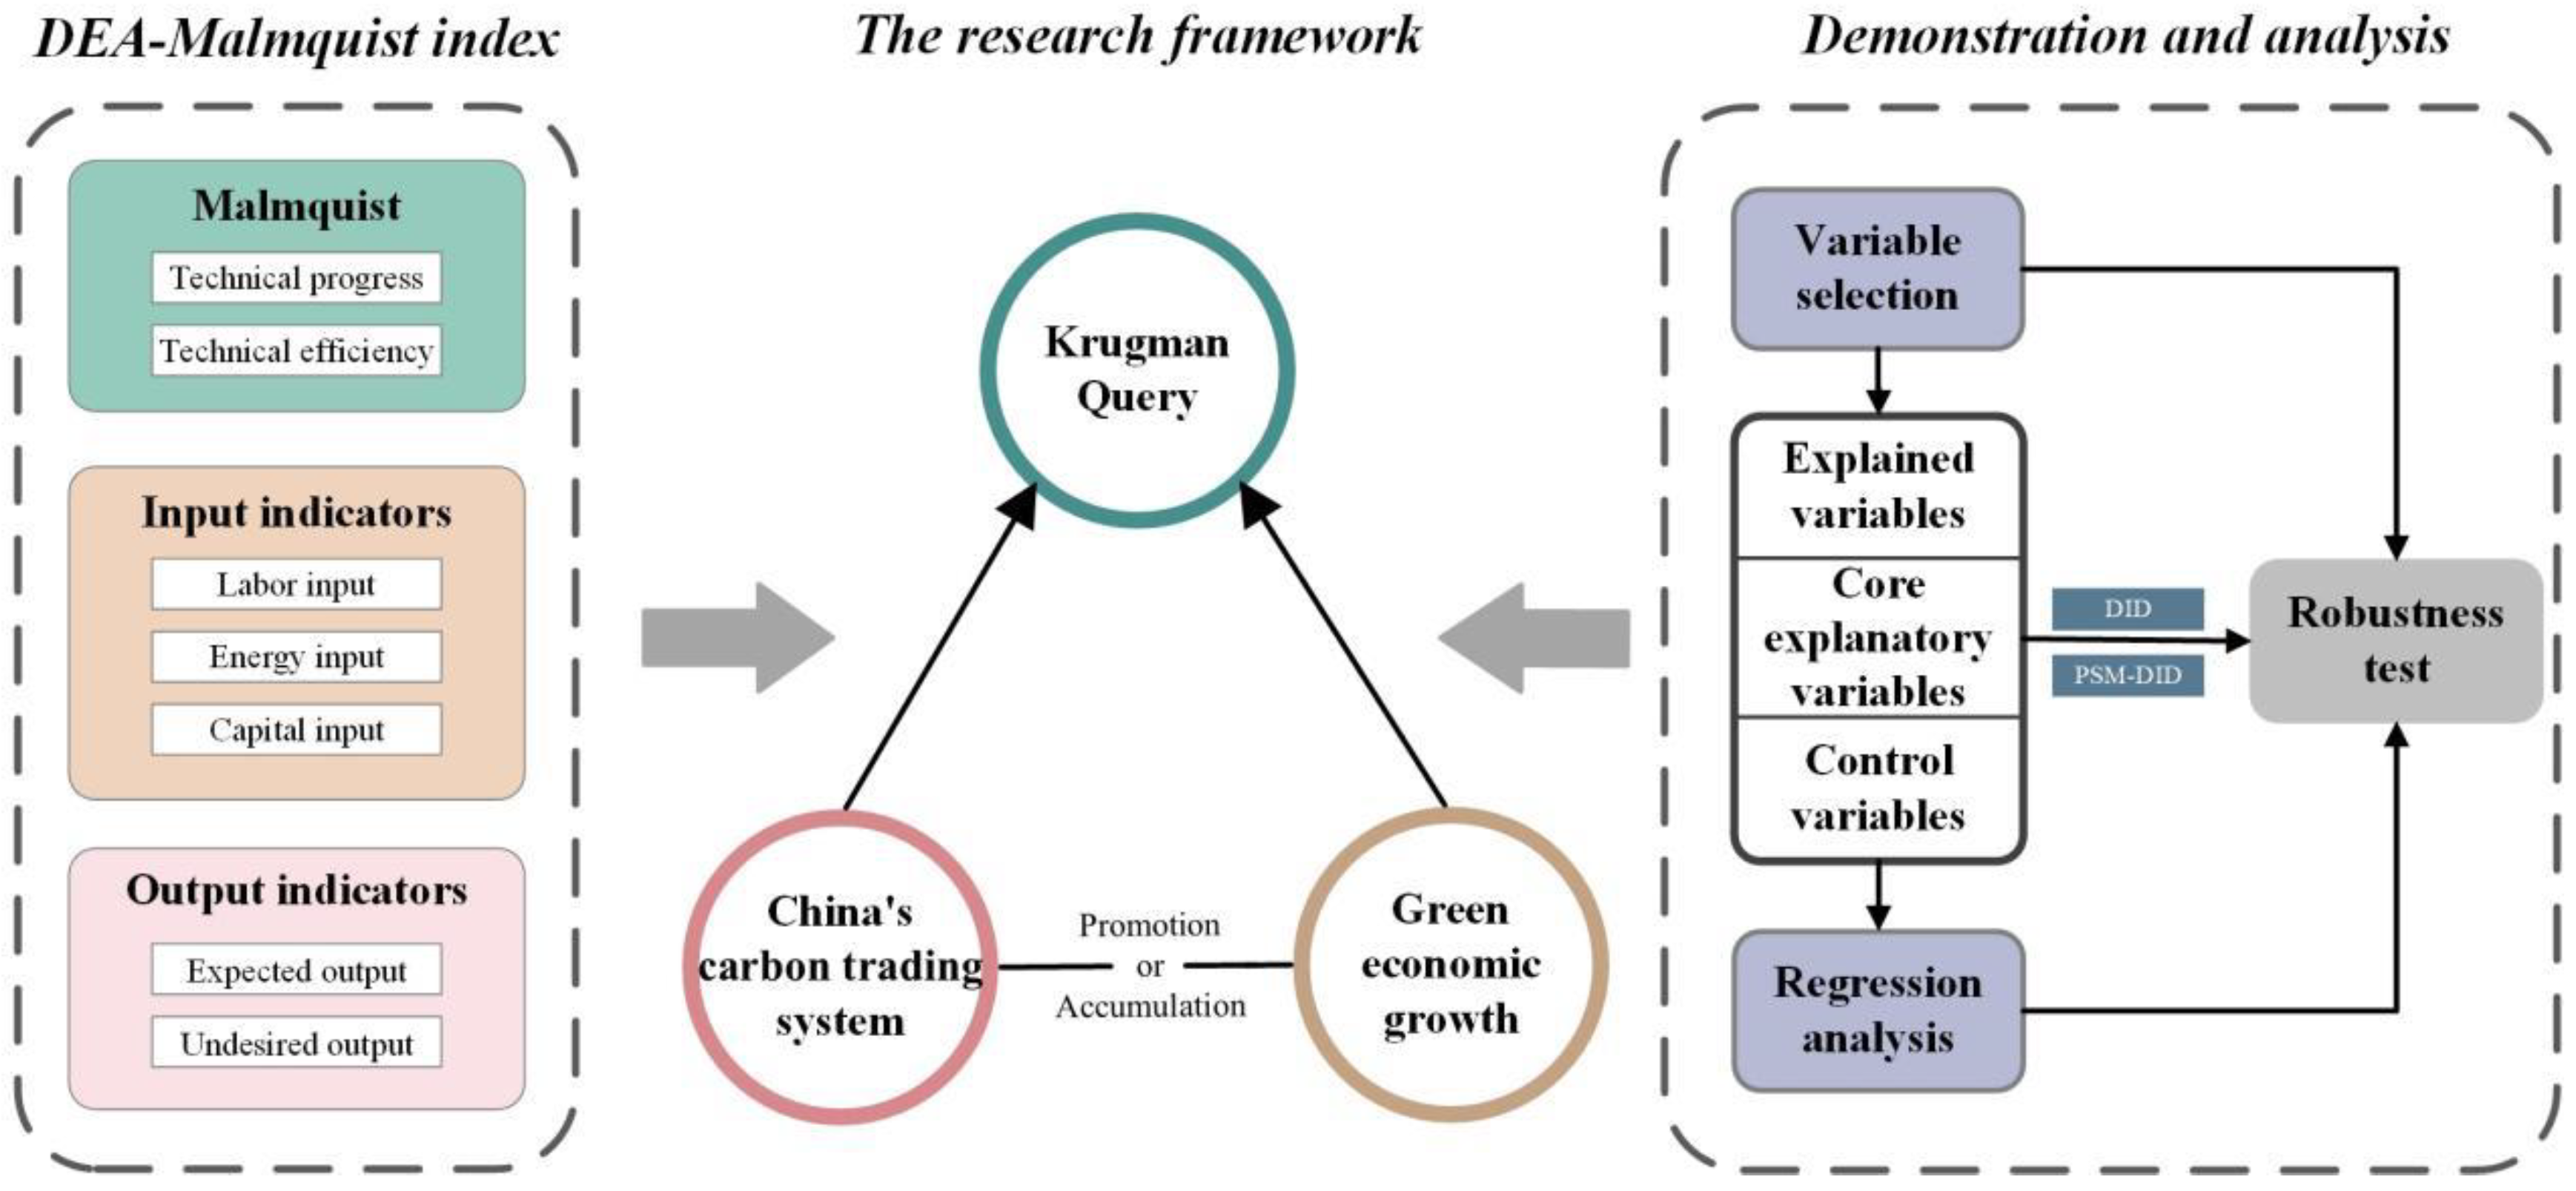
① Green development effect. To measure the efficiency of green development, it is necessary to consider not only the allocation efficiency of input-output factors, but also the resource input and environmental costs. In other words, when constructing the index system, the selection of input-output indicators must be considered. Based on the existing research and theory, and according to the core requirements of green development, the green development effect measurement system constructed in this paper mainly examines the level of green production technology. Among them, the output indicators are divided into expected output indicators and non-expected output indicators, and the input indicators are selected as labor, energy, and capital, and the green development efficiency is comprehensively measured by using the DEA model and decomposed by the Malmquist index, in order to fully reflect the concept of green development and comprehensively measure the level of green production technology.
② Economic growth effect. The impact of economic growth is expressed in terms of carbon emission intensity, i.e., CO2 emissions per unit of GDP. The calculation formula is carbon emission intensity = carbon emission/GDP, denoted as Ci. A decline in carbon emission intensity reflects the coordinated development between the economy and the environment. Specifically, if the pilot policy in China reduces the carbon emission intensity, this represents the economic growth effect, where the stronger the decline, the stronger the economic growth effect. Conversely, it hinders economic growth.
- (2)
Core explanatory variables
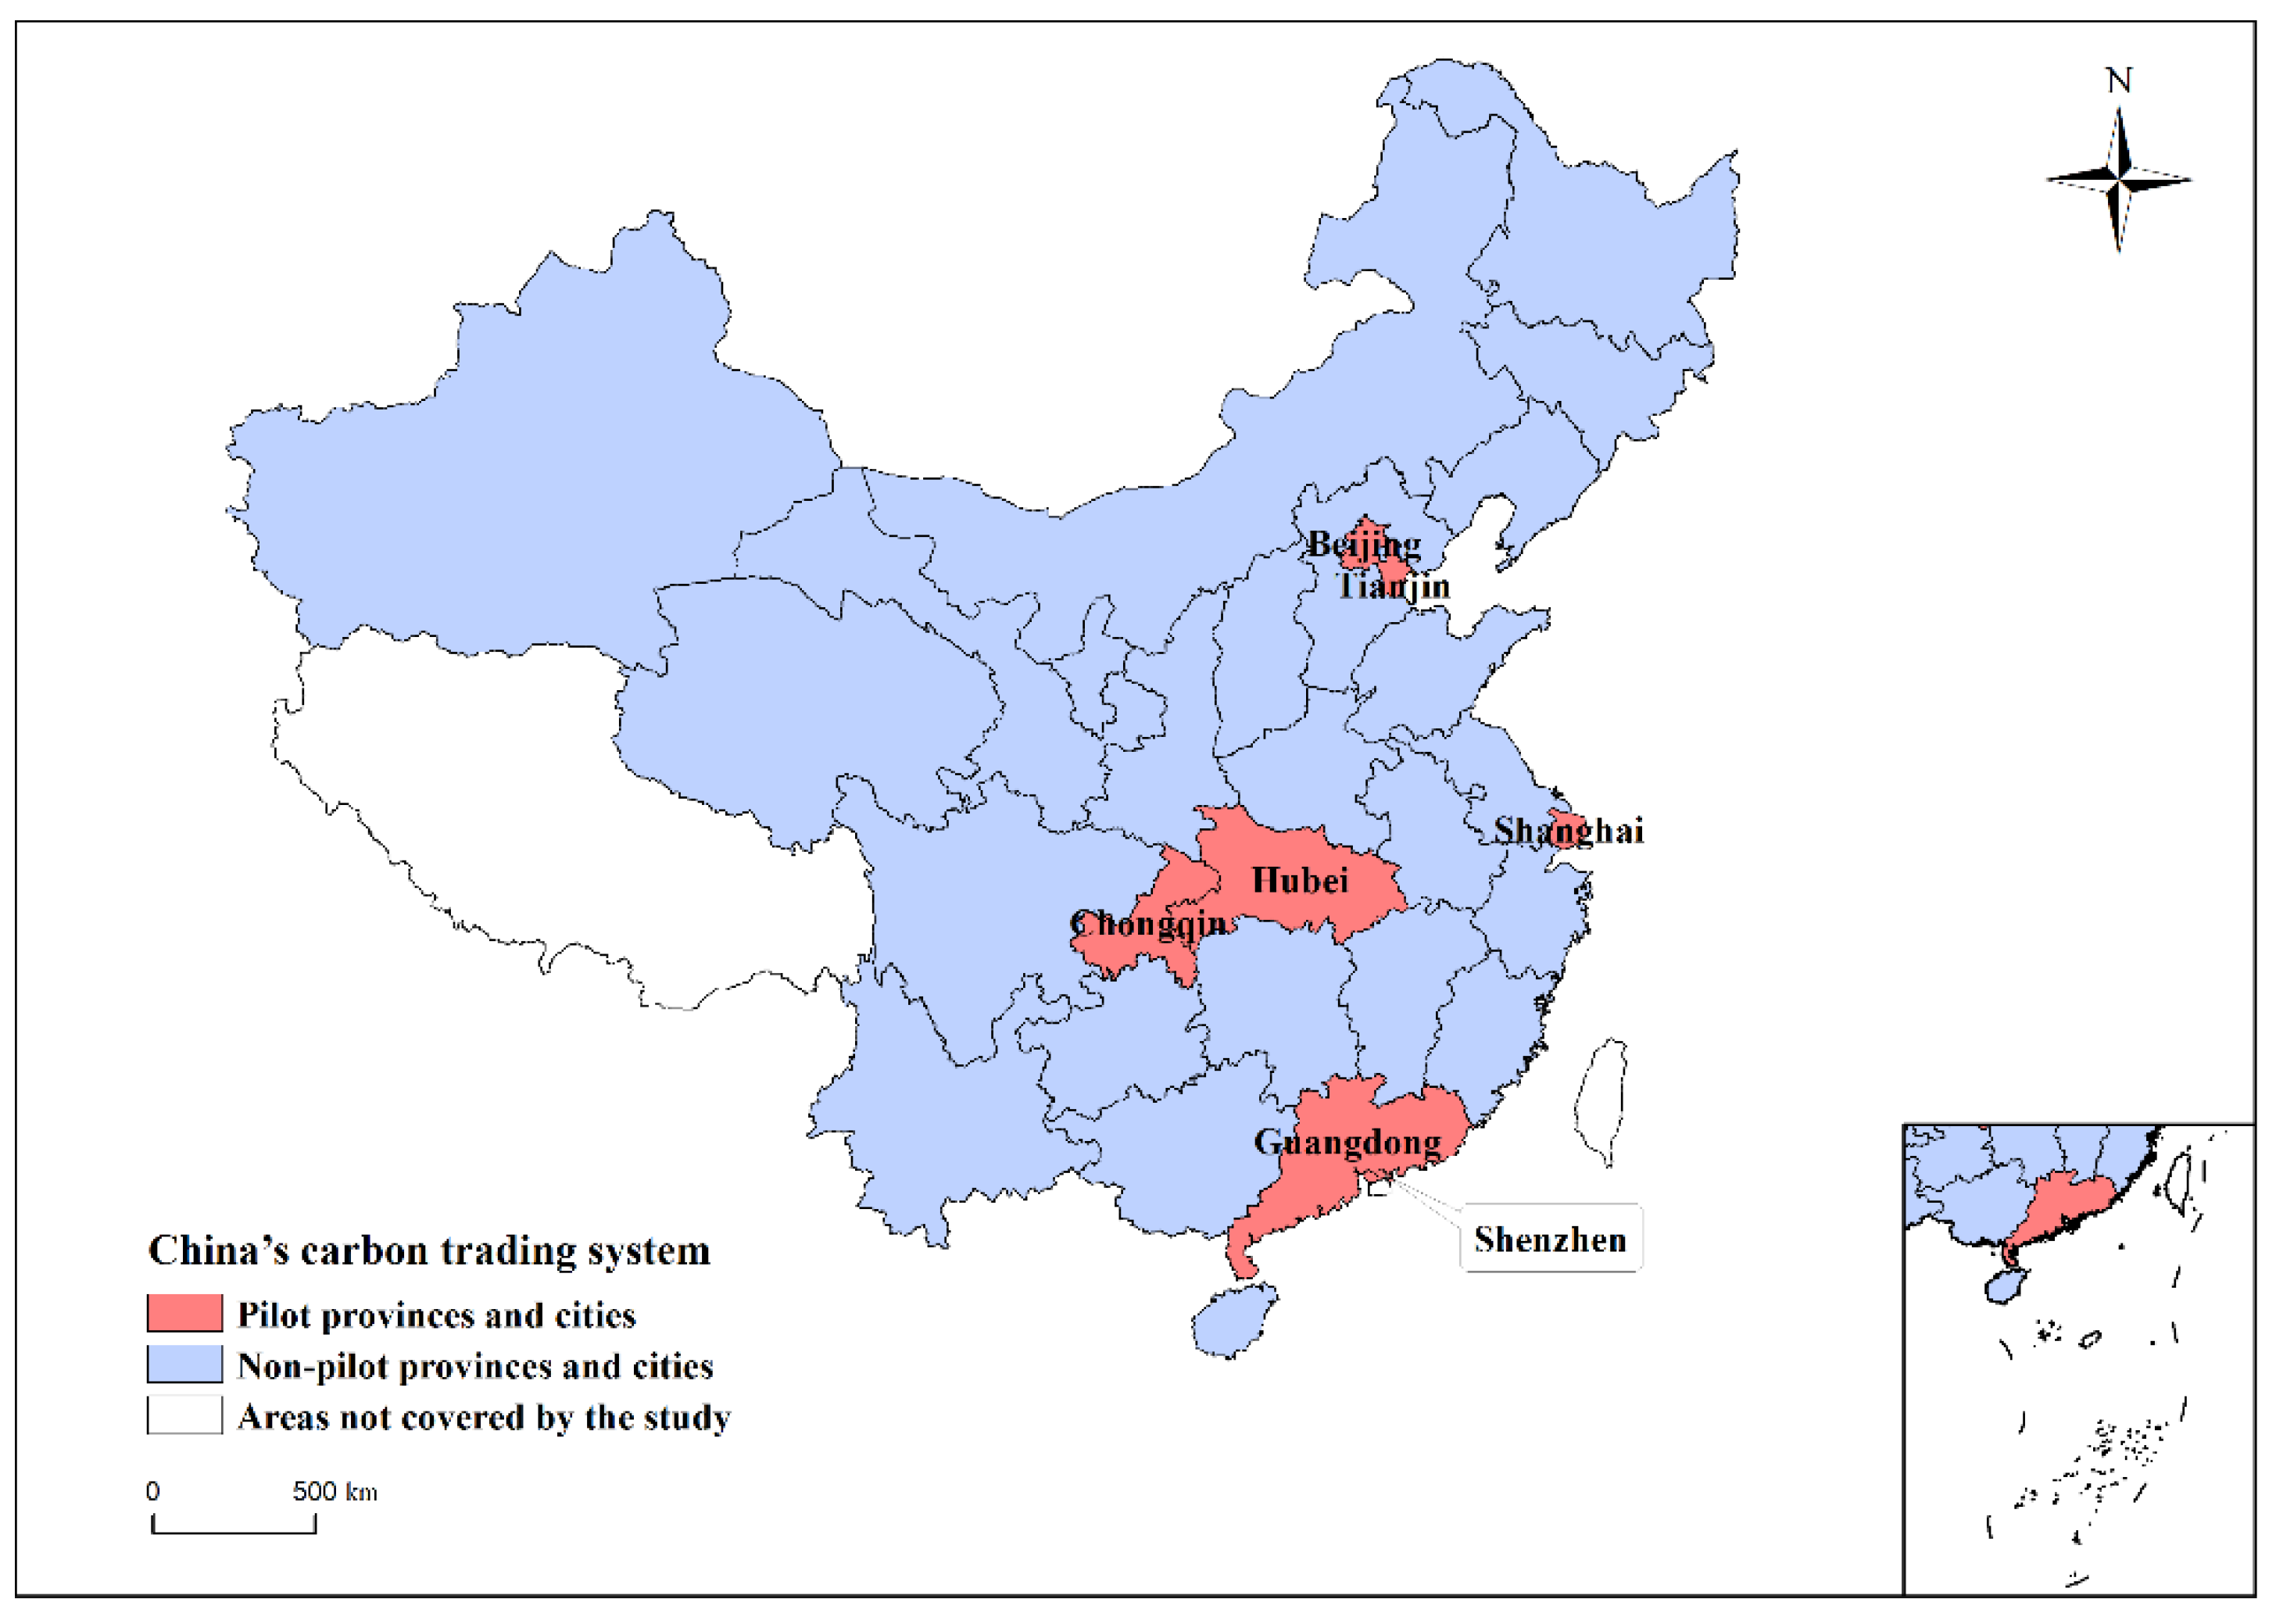
① Implementation of the regional virtual variable treat for the pilot policy of the carbon trading system; Treat = 1 represents provinces and cities that implemented pilot carbon trading system policies during 2013–2018 (e.g., Beijing, Tianjin, Shanghai, Chongqing, Hubei, Guangdong, and Shenzhen); Treat = 0 represents provinces and cities that did not implement carbon trading system pilot policies during 2013–2018 (excluding Tibet, Hong Kong, Macao, and Taiwan). ② The time dummy variable before and after the implementation of carbon trading system pilot policies; Time = 1 represents the implementation of carbon trading system pilot policies during 2013–2018; Time = 0 represents that the pilot policy of carbon trading system was not carried out during 2001–2012. ③ DID estimator tt; tt is the interaction term between the regional dummy variable and the time dummy variable, which is the core index to verify green development. Through the symbol and significance of tt, the effect of carbon trading system pilot policy on green development and economic growth could be assessed.
- (3)
Control variables
Based on previous research, this paper scientifically selects six control variables that affected the green development level. These are presented in detail in the following:
① Economic development level: Per capita gross national product reflects the per capita GDP, recorded as pgdp.
② Industrial structure: The proportion of the added value of the secondary industry in GDP, recorded as is;
③ Investment in energy industry, denoted as eii; this reflects whether the energy industry investment was moderate or not directly affected by the clean use of energy. Because of the non-renewability of fossil energy, the energy problem has aroused great concern. Coupled with the continuous growth of energy demand, the energy industry had become the key sector of greenhouse gas emission.
④ The technical level: This paper uses domestic patent application acceptance to measure technological progress, recorded as pi.
⑤ Population scale, recorded as pop; pop refers to the number of permanent residents in all provinces and cities.
4.3.2. Double Difference Regression Analysis
This paper establishes the PSM-DID model according to pilot provinces and cities and the implementation time of the pilot policy. Furthermore, GTFP (
gtfp) is used to measure the level of green production technology; these were assumed as dependent variables. The core variables were the virtual variables of pilot policy, urban virtual variables, and their interaction items. The time selection range of the data was from 2001 to 2018, and the cross-section selection range was all provinces, municipalities directly under the central government, and autonomous regions (except Tibet, Hong Kong, Macao, and Taiwan). Because China’s carbon trading system was implemented in 2013, the policy dummy variable
time = 1 was selected for data from 2013 to 2018, and
time = 0 was selected for other time periods. The city virtual variable
city was generated, where the seven pilot cities (i.e., Shanghai, Beijing, Guangdong, Shenzhen, Tianjin, Hubei, and Chongqing) are set as 1, i.e.,
city = 1, while other regions (excluding Xizang, Hong Kong, Macao, and Taiwan) were set as
city = 0. Therefore, the interaction between policy dummy variable and city dummy variable was defined as their product, namely
jc = time * city. The regression model of the benchmark was:
Based on the benchmark regression model, the following control variables are added: economic development level (denoted as PGDP), industrial structure (denoted as
is), energy industry investment (denoted as
eii), technical level (denoted as
pi), and the size of the population (denoted as
pop). Firstly, descriptive analysis was carried out on the variables. The descriptive statistics of each index are shown in
Table 3.
The effect mechanism of carbon trading pilot policy implementation on the level of green production technology and green development effect was tested by the DID method in this paper. Total factor productivity and carbon emission intensity are set as dependent variables and policy dummy variables, urban dummy variables, and interaction terms are set as independent variables. To verify the robustness of variable coefficients, we add control variables to the original model. First, the impact of the pilot policy on the level of green production technology is analyzed (
Table 4). Control variables are not added in model 1, and Models 2–6 gradually added control variables.
From the results of the DID method, the coefficient coincidence degree and importance of core explanatory variables did not change fundamentally from Model 1 to Model 6. The coefficient significance of other variables changed for the most part, and the decisive coefficient R2 of the model gradually increased. In Model 6, at a significance level of 5%, the core explanatory variables are positively correlated with the level of green production technology. This indicates that the pilot policy promoted the green development level in pilot cities, but the effect was weak, and merely increased by 5.2%.
Regarding control variables, the level of economic development was positively correlated with the level of green production technology. The industrial structure had a negative correlation with the level of green production technology. Energy industry investment had a significant positive impact on the level of green production technology, i.e., the increased investment would improve the level of production technology. The technology level had a significant positive impact on the technology level of green production, i.e., the improvement of technology yields a “synergistic effect”, driving the improvement of green technology. The scale of the population had a significant negative impact on the level of green production technology, and an increase in population constrains the improvement of production technology. This shows that from the perspective of control variables, if spatial factors were not considered, “economic development level”, “energy industry investment”, and “technology level” would promote green economic growth to a certain extent; however, the “proportion of secondary industry” and “population size” would hinder green economic growth to a certain extent. This proved that the “Krugman Query” was not tenable.
The influence of pilot policy implementation on economic growth effect is analyzed in the following, and control variables are gradually added to the benchmark regression model. The results are shown in
Table 5.
In Model 6, at the significance level of 5%, the core explanatory variables had a significant positive impact on the level of green production technology, indicating that the implementation of carbon trading policy exerts a strong effect by reducing the carbon emission intensity of pilot cities by 49.1%.
Regarding control variables, the level of economic development, the technology level, and the population size had a significant negative impact on carbon emission intensity. The industrial structure had a significant negative impact on carbon emission intensity, i.e., the higher the industrial structure, the less the restriction of carbon emissions. Investments in the energy industry had a significant positive impact on carbon emission intensity i.e., increasing investment would improve carbon emission intensity.
4.3.3. PSM-DID Analysis
This paper uses the logit model, where the policy dummy variable time is used as the dependent variable, and variables are used as covariates. The results obtained by using the PSM method are shown in
Table 6.
The data in
Table 7 show that at a significance level of 5%, the
p values of all variables fail to pass significance. The results show that the matching results are effective, and the PSM-DID method is therefore used for estimation, and control variables are added and not added, respectively.
Based on the estimation results, in the model that uses green technology level as dependent variable, the interaction terms of core variables in Model 1 and Model 2 pass significance at a level of 1%, and all coefficients are positive. In the model that uses green development effect as dependent variable, the core variable interaction term in Model 3 and Model 4 pass significance at a level of 1%, and all coefficients are positive. This shows that the implementation of the policy promotes green development and reduces carbon emissions, further indicating that the model has good robustness.


