Abstract
Land-cover change is a major cause of global ecosystem degradation, a severe threat to sustainable development and human welfare. In mountainous regions that cross national political boundaries, sensitive and fragile ecosystems are under complex disturbance pressures. Land-cover change may further exacerbate ecological risks in these regions. However, few studies have assessed the ecological risks in transboundary areas. This study focused on the Gandaki Basin (GRB), a typical transboundary region in the Himalayas. Based on the dynamic change in land cover, the landscape ecological risk index (ERI) model was constructed to assess the ecological risk in the GRB, revealing the evolution characteristics and spatial correlation of such a risk during the period 1990–2020. The results showed that all land cover types in the GRB have changed over the last 30 years. The interconversion of cropland and forestland was a distinctive feature in all periods. Overall, the medium and medium to low ecological risk level areas account for approximately 65% of the study area. The areas of high ecological risk were mainly distributed in the high elevation mountains of the northern Himalayas, while the low risk areas were located in the other mountains and hills of Nepal. In addition, the ecological risk in the Gandaki basin has shown a fluctuating trend of increasing over the past 30 years. However, there were different phases, with the order of ecological risk being 2020 > 2000 > 2010 > 1990. Ecological risks displayed positive spatial correlation and aggregation characteristics across periods. The high–high risk clusters were primarily located in the high and medium high ecological risk areas, while the low–low risk clusters were similar to low risk levels region. The findings provided the reference for ecosystem conservation and landscape management in transboundary areas.
1. Introduction
Ecosystems are an essential part of the biosphere [1], providing not only services including provisioning, regulation, culture and support for humans, but more crucially, playing an irreplaceable role in maintaining the balance of the Earth’s living systems and environment [2,3,4]. However, in recent decades, global multiple ecosystems have been seriously degraded as a result of rapid population growth, exploitation of resources and accelerated urbanization [5,6,7,8]. At present, as global climate change, species invasions and environmental pollution intensify, ecosystems are under substantial pressure [9,10]. Land-cover change is an integrated reflection of the interaction of natural and anthropogenic factors in the ecosystem [11], which directly affects the ecosystem structure and function of the region and is considered the most prevalent influence on ecosystem degradation [12]. In the course of land-cover change, composite ecosystems coupled with socio-economic and natural environments are threatened by human disturbances and complex biological processes, raising many substantial ecological risks [13,14]. Therefore, it is imperative to analyze land-cover change and assess the ecological risks associated with it.
Ecological risk represents the risk of stress on ecosystems and their components from external disturbances, describing the probability of negative impacts on ecosystem function and structure from anthropogenic activities or natural hazards [15]. It reflects the ability of an ecosystem to maintain its self-stability under specific environmental pressures [16]. Ecological risk assessment is an effective measure to detect and contain ecosystem degradation. The assessment contributes to our understanding of the extent to which anthropogenic activities and natural environmental changes are potentially harmful to regional ecosystems [17]. Most of the early ecological risk assessments focused on the environmental impacts of chemical contaminants or pollution events on ecosystems, mostly at the scale of a single risk source or a single risk receptor [18,19]. With the advancement of global change and ecological risk studies, landscape ecological risk assessment from the perspective of land-cover change has become a mainstream of research [20]. Landscapes are heterogeneous or patchwork spatial units made up of different ecosystem types and are considered the appropriate scale for examining the impact of human activities on the natural environment [21]. The associated changes in landscape patterns are closely related to disturbances and ecological processes at different scales within ecosystems [22]. The landscape ecological risk index (ERI) combines multiple sources of risk generated by natural or human disturbances [23]. It is mostly constructed on the basis of a landscape pattern index to assess the various potential factors in the landscape mosaic and their cumulative damage levels. Thus, the combination of land-cover change and the ERI is widely applied. Related studies are currently concerned with wetlands [24,25], coastal zones [26,27,28], river basins [29,30,31], protected areas [17,32], administrative districts [33,34,35] and urban agglomerations [36,37]. However, few studies have focused on risk assessment in transboundary regions.
Transboundary regions are areas near or that cross national political boundaries that define countries and territories [38,39]. National political boundaries rarely coincide with natural ecological boundaries [40]. However, cross-border landscapes often overlap with biodiversity hotspots [38]. It is estimated that approximately one-third of all terrestrial biodiversity hotspots cross national borders [41]. When ecological conservation policies conflict with the administrative and political boundaries, the situation is further complicated [42,43]. As globalization progresses, national borders and frontier areas can be transformed into urban concentrations with dense cultural and commercial populations. Increased population, exploitation and trade lead to dramatic land-cover changes within and beyond international borders, which exacerbate the negative impacts on ecosystems [44,45]. In addition, weak governance often affects remote border areas in environmentally heterogeneous regions with varying socio-economic levels, environmental acts and enforcement capabilities [46]. These areas are more prone to habitat changes, species invasions, pollution and the illegal adoption of natural resources, which may increase ecological risks in transboundary areas [47]. Therefore, space–time changes of ecological risks in transboundary areas and their assessment are urgently required.
The Gandaki river basin (GRB) in the central Himalaya is a typical transboundary region, spanning China, Nepal and India, with one of the largest elevation differences in the world [48]. In general, the GRB has complex and diverse landscape types, complete ecosystem types and is a global biodiversity hotspot. Meanwhile, mountain ecosystems are susceptible to climate change and human activities [49,50]. Land cover diversity and its relationship with variable topography, climate and socio-demographic interactions are extremely vulnerable [51]. Moreover, poverty levels are high across the basin, socio-economic indicators are low, and unsustainable disturbances are exacerbated with high population growth rates [52]. Significant changes in land cover have occurred, with ecological problems of the overexploitation of natural resources, loss of critical ecosystem services and ecological degradation [53,54]. Furthermore, multi-national transboundary areas are often not easily managed due to complex political situations, policies and cultural interactions, which further exacerbate the potential for ecological risk deterioration [55,56]. In particular, the population of the GRB is vulnerable to a range of natural hazards, including avalanches, landslides and glacial lake outburst floods [57]. Among these are floods and droughts caused by heavy rainfall, which are the main climatic problems in the upstream [58]; landslides and the drying up of springs in the midstream [59]; river flooding in the plains [60]. In the context of global environmental change, it is urgent to assess ecological risks to GRB. This assessment can provide critical information to help policymakers, land managers and conservation organizations to monitor and curtail the loss of ecosystems and the deterioration of ecological risks in these regions. However, to the best of our knowledge, no studies have investigated the ecological risk changes induced by the land-cover change in the GRB. Therefore, this study aimed to assess the landscape ecological risks of the GRB during the process of land-cover change over the last 30 years. The specific research objectives were to: (1) analyze the characteristics of temporal changes in land cover types in the GRB from 1990 to 2020, (2) assess landscape ecological risk patterns in the GRB during the study period based on land-cover change and (3) explore the dynamic of ecological risk at the landscape scale using spatial autocorrelation analysis.
2. Materials and Methods
2.1. Study Area
The Gandaki transboundary basin is located in the central Himalaya between 85°22′–88°21′ E and 26°47′–29°12′ N [48]. The region spans three countries, China (10%), Nepal (72%) and India (18%), with a total area of 44,731 km2 (Figure 1). The GRB is a sub-basin of the Ganges Basin. The main river in the basin is the Gandaki River, which originates in the southern Tibetan Autonomous Region of China and flows through the deepest gorge in the world [61]. It is known as Narayani River in Nepal and Gandak River in India. With three peaks above 8000 m, the GRB has one of the world’s most extensive ranges of elevation differences. It ranges from 8141 m above sea level in the north of the basin to 28 m in the south [62]. The GRB is geologically complex, with high climatic and ecological variability and distinct differences along the upstream and downstream reaches of the elevational gradient. The upstream areas are located on the Tibetan Plateau towards the northern side of the Himalayas, on the rain shadow side and are relatively unaffected by the monsoon [63]. They are in semi-arid climatic conditions, with an average annual precipitation of less than 163 mm. In contrast, the midstream and downstream areas are located on the windward slopes of the Himalayas and the Indian plains, which experience a humid subtropical to a temperate climate with average annual precipitation greater than 2667 mm [64,65]. The upstream areas are mostly snow-covered, semi-arid barren lands in the High Himalayas and Trans-Himalayas. In the midstream and downstream areas, cultivated land and forests are the dominant land use [48]. In addition, the basin has a high biodiversity level, with three protected areas and five national parks from south to north, such as Mount Qomolangma National Nature Reserve and Chitwan National Park.
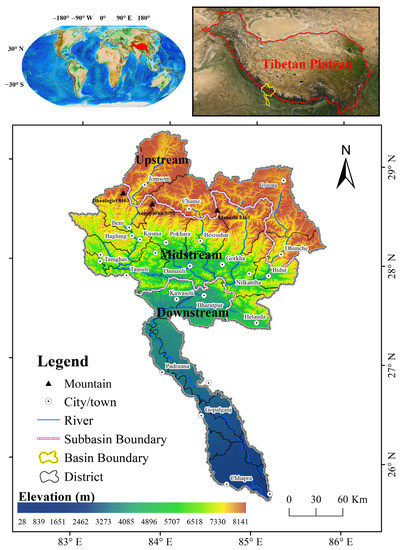
Figure 1.
Location and boundary of the Gandaki River Basin (The digital boundary of the GRB from Rai et al. [48] and Tibetan Plateau from Zhang et al. [66]).
2.2. Land Cover Data Sources and Processing
Land cover data at 30 m spatial resolution (30 × 30 m) for 1990, 2000, 2010 and 2020 were used in this study. Specifically, the existing 1990 land cover data, with the user and producer accuracies were 91.86% and 86.11%, respectively [48], were provided by the Land Change and Regional Adaptation Research Group of the Qinghai–Tibet Plateau, Institute of Geographic Sciences and Natural Resources Research, Chinese Academy of Sciences (CAS). Data for 2000, 2010 and 2020 were produced based on the Google Earth Engine platform [67]. These datasets have a consistent classification system. A total of seven land cover types were included: forestland, cropland, barren land, glacier/snow, grassland, water and urban land.
The land cover data classification consisted of the following steps: first, the USGS Landsat 5 TM, Landsat 7 ETM+ and Landsat 8 OLI/TIRS atmospherically corrected surface reflectance products covering the study area were selected. We created a collection of cloud–shadow-free images by pre-processing, including cloud removal and shadow masking. Pixel-based median image compositing methods were applied to obtain the best observable Landsat image composites. Secondly, sample dataset was obtained by manual visual interpretation supported by Google Earth high-resolution images and existing 1990 land cover data. Then, we randomly segmented the sampled dataset into training samples (70%) for classification and validation (30%). In addition, to ensure comparability of land cover classification results, training and validation samples were derived from the sample dataset for all three periods. Thirdly, to sufficiently detect the information contained in the remote sensing images, as well as the six spectral bands of the Landsat satellite data themselves (blue, green, red, near-infrared, shortwave infrared 1 and shortwave infrared 2), we added some further spectral indices, namely: normalized difference vegetation index [68], the enhancement vegetable index [69], the normalized difference build index [70], the land surface water index [71], the normalized difference snow index [72], the normalized difference tillage index [73]. Furthermore, because the topography of the GRB has a strong influence on the land cover type, we calculated topographic elevation, slope and aspect factors from Shuttle Radar Topography Mission (SRTM) data [74]. Finally, a random forest classification model [75] was used to generate land cover data for three periods. Furthermore, due to the low quality of the images covering the study area and the limited availability of satellite images, we chose images from the target year and the previous year as combination conditions to obtain as many images as possible. The overall accuracy of land cover classification in the study area from 2000 to 2020 was 0.93 ± 0.04, and detailed accuracy results for each land cover category using confusion matrix are presented in Table S1. In addition, we performed a basic visual assessment by overlaying the existing 1990 data with the generated data, correcting obvious errors and problems in the product and ensuring comparability between datasets as much as possible.
In this study, geographic information databases were created using four periods of land cover data at 10 year intervals. In addition, we performed a basic visual assessment by overlaying the data to correct for obvious errors and ensure comparability between the data as much as possible. Land cover categories were quantified for each period, with area and percentage change numbers derived from map-to-map differences. Afterward, the land-cover change transfer matrix was conducted by ArcGIS 10.4 software for the analysis of land-cover change and its characteristics in the GRB from 1990 to 2020.
2.3. Ecological Risk Assessment
The magnitude of regional ecological risk is related to the strength of the disturbance to which the local ecosystem is exposed and its own ability to resist external distress. In general, the greater the extent of external disruption and the weaker its resistance, the greater the ecological risk [23]. Therefore, this study integrates the landscape ecology perspective and ecological risk assessment connotation. The relationship between landscape structure and ecological risk in GRB was also considered, and ERI based on landscape disturbance index and landscape vulnerability index was constructed [33]. The index is based on the proportion of land cover type area. The spatial pattern characteristics of each landscape are converted into a composite representation of the relative scale of ecological risk and the degree of the potential loss. The expression is as follows
where is the landscape ecological risk index for 6 × 6 km grid, is the total area of the kth grid, is the area of ith land cover type in the kth grid, is the ecological loss index for ith land cover type, which is formulated as follows
where is the landscape vulnerability index, which refers to the probability that the ecosystem is able to maintain its structure and function in the presence of external disturbances and is a comprehensive indicator of the sensitivity and resistance of the landscape type. High values of indicate that this type of landscape has a high probability of loss of function and poor ecological stability or resilience to external impacts, and is therefore at higher ecological risk [76]. According to previous studies [21,26,28], and taking into account the features of the GRB, the ecological risk of the different land cover types was ranked from low to high and the corresponding rank values were urban land (1), forestland (2), grassland (3), cropland (4), water (5), barren land (6) and glacier/snow (6). Then, vulnerability indices for specific land cover types were obtained by normalization. refers to the landscape disturbance index, which primarily reflects the degree of disturbance caused by human disturbance and exploitation practices to the ecosystems of each landscape constituent, expressed as follows
where is the landscape fragmentation index, is the landscape isolation index and is the landscape fractal index, the formula for calculating these indices and the ecological meaning are shown in Table 1. a, b and c represent the weights of the three landscape indices respectively, and a + b + c = 1. According to previous studies and the importance of each index, a, b, c were assigned values of 0.5, 0.3 and 0.2, respectively [26,35].

Table 1.
Ecological meaning and expression of the landscape index.
In order to better represent the distribution patterns and spatial heterogeneity of ecological risks within the GRB, the grid with a width and height of 6 km was applied to spatialize the ecological risk index, regarding existing studies and the local situation of landscape patches in the study area [76,77]. Total of 1411 assessment units were sampled using an equal distance sampling approach. Then, the ERI for each sample area was assigned to the ecological risk value at the center of the sample area. Furthermore, to identify the spatial characteristics of the ecological risk of the GRB, we mapped the spatial distribution of ecological risk in the landscape based on the level of ERI for each assessment unit using the ordinary kriging method in the ArcGIS 10.4 geostatistical analysis tool. Some studies have indicated that the natural breakpoint method has high grading accuracy and also takes into account the balance of extreme differences in index intensity at all levels, with better integrated mapping results [31]. Therefore, this method was employed to classify ERI into five grades: low risk (ERI ≤ 0.117), medium low risk (0.117 < ERI ≤ 0.150), medium risk (0.150 < ERI ≤ 0.201), medium high risk (0.201 < ERI ≤ 0.263) and high risk (0.263 < ERI).
2.4. Spatial Autocorrelation Analysis
Spatial autocorrelation analysis is a spatial measurement that describes the dependence of attribute values of a spatial reference unit and its adjacent or nearby units. This analysis of the ERI in the GRB was performed in GeoDa software and reflects the spatial clustering characteristics of the landscape ecological risk, contributing to the understanding of ecological risk occurrence and evolutionary mechanisms [78]. The Moran index (Moran’s I) is a generally prevalent method of global spatial autocorrelation analysis and is calculated as follows
where is the value of ERI in evaluation unit ; is the value of ERI in adjacent evaluation ; is the number of assessment units; is the weight matrix reflecting spatial relation of evaluation unit; when two assessment units are adjacent, , otherwise, ; 2 is the mean square deviation. The Moran’s I values range from −1 to 1. Moran’s I > 0 indicates that ecological risks are aggregated in space, Moran’s I < 0 indicates that ecological risks are discrete in space, and Moran’s I = 0 indicates that ecological risks are randomly distributed.
The local index of spatial autocorrelation (LISA), also named local Moran’s Ii index, is obtained by decomposing Moran’s I [79]. LISA can reflect the correlation of spatially adjacent grid attribute values and identify hot and cold spots of ecological risk in local land cover. When Ii > 0, it means that a region with a high (low) attribute value is surrounded by a region with a high (low) attribute value with little spatial difference, which is called high–high agglomeration (low–low agglomeration). When Ii < 0, a region with a high (low) attribute value is surrounded by a region with a low (low) attribute value, with a large spatial difference, which is called high–low agglomeration (low–high agglomeration). When Ii = 0, there is no significant relationship between the target region and the neighboring regions.
3. Results
3.1. Land-Cover Changes
The land-cover changes in the GRB from 1990 to 2020 are shown in Figure 2. Forestland and cropland are the dominant land cover types in the GRB, together consistently accounting for greater than 60% of the area. Distinct trend changes occurred over the whole study period in the various land cover types at different times. In general, forestland, glacier/snow and grassland showed a decreasing trend, while the remaining land cover types showed an increasing trend. During the study period, bare land experienced the largest percentage increase from 10% in 1990 to 15.5% in 2020. Still, the land type with the highest rate of change (area in 2020 divided by area in 1990 minus 1) was urban land, and grassland experienced the largest decrease of about 7.9% (accounting for the whole study area). In addition, the different land cover types have distinctive phase traits. For 1990–2000, forestland showed a decrease, while cropland showed a marked increase in the same period. The forestland area gradually increased after 2000, while the cropland proportion steadily decreased every decade. Furthermore, the glacier/snow area continuously declined throughout the study period, decreasing by an average of 250 km2 per decade. In contrast, urban land increased every period, averaging about 91 km2 per decade.
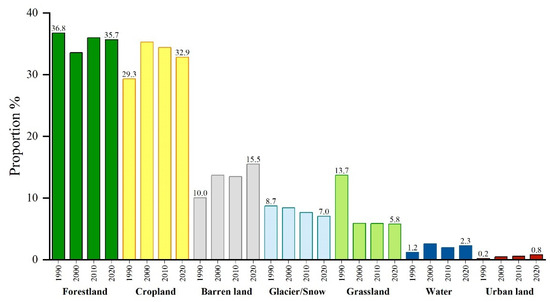
Figure 2.
Percentage change in the area of land cover type in GRB from 1990 to 2020.
The land cover transfer matrix for the period 1990 to 2020 is shown in Table 2. As the dominant land cover type in the GRB, forestland was reduced by 488.12 km2 and was converted mainly to cropland, barren land and grassland. Cropland increased by 1572.81 km2, mainly from forestland, grassland and barren land. It is worth noting that the largest conversion between land cover types occurred on forestland. Cropland was the leading conversion type for forestland, with approximately 74.4% of the change involving the forestland becoming cropland compared to 1990. In other words, the most frequent land cover type of interaction identified in the GRB was between cropland and forestland. Moreover, approximately 33% and 34% of the total glaciers/snow and grassland areas were converted to barren land, respectively. Furthermore, although the urban land cover type represented only 2% of the entire basin, it increased nearly fourfold during the last 30 years. The majority (74.65%) of the change occurred on cropland.
Table 2.
Land cover type transfer matrix for GRB from 1990 to 2020 (unit: km2).
3.2. Spatiotemporal Changes in Ecological Risk Pattern
In the past 30 years, the average level of the ERI for the basin was 0.17, indicating the medium level of ecological risk in the GRB. In general, there is pronounced heterogeneity in the spatial distribution of ERI and the hierarchy of risk areas is apparent. Specifically, the high and medium high ecological risk areas were mainly located in the northern part of the GRB; the low and medium low regions were concentrated in the central part, while the medium risk areas were primarily distributed in the basin’s southern part.
Figure 3 shows the spatial distribution of changes in the ERI in the GRB from 1990 to 2020. In 1990, the ecological risk areas not exceeding the medium low ERI accounted for 65.8% of the basin, mainly in the Middle Mountain region and the Siwalik region of Nepal and the Ganges plain of India. The medium high ERI areas were located primarily in the Mustang and Manang districts of Nepal in the north of the basin. The medium ERI areas were mainly detected in the Gyirong County of China and the main channel of the Gandak River in India. In 2000, the medium low and medium ecological risk index area expanded further, accounting for nearly 60% of the total area. The low risk changed from 23.6% in 1990 to 12.9%. Moreover, the proportion of medium and high risk areas increased from 22% in 1990 to 27% in 2000, indicating an increasing general ecological risk trend in the GRB during 1990–2000. Given the spatial distribution, the main areas of increased ecological risk occurred in Gyirong County in China, central Nepal, and the lower reaches of the Gandak River in India. A similar spatial pattern to that of 2000 was detected in 2010, but it is noteworthy that the percentage of low risk areas increased by close to 6% between 2000 and 2010. In 2020, the rate of the medium and high risk areas of the ERI increased by approximately 7%, with the high risk area reaching 4032.91 km2. This indicated an overall deterioration in the ecological environment in the GRB for 2010–2020. The areas of worsening were mainly focused on the border between China and Nepal and in the Himalayan region and within the Ganges plain in India. In addition, we calculated average ERI of 0.154, 0.174, 0.166 and 0.175 for the period 1990 to 2020. In other words, the ecological risk in the GRB showed an overall fluctuating upward trend over the 30 years, specifically, first increasing and then slightly slowing and then increasing.
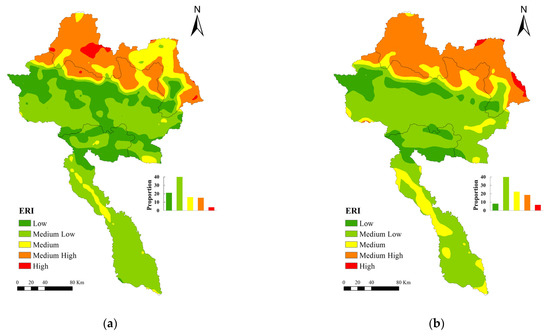
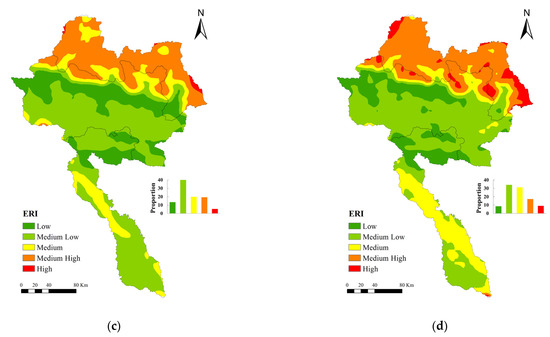
Figure 3.
The spatial distribution of ecological risk index in Gandaki River Basin in 1990 (a), 2000 (b), 2010 (c) and 2020 (d). The inset histograms show the proportion of ERI with different class; the legends are consistent with the map legends.
3.3. Analysis of Ecological Risk Changes in Sub-Basin and Countries
Owing to the marked regional differences in the landscapes of transboundary watersheds, we have studied trends of ecological risk in the upper, middle and lower streams of the GRB. Figure 4a illustrates the variation in ecological risk in the three sub-basins over the study period. Overall, the trends of ERI in each sub-basin are the same as those for the basin as a whole. However, there are apparent discrepancies in the rates and levels of change at different stages. The ecological risk in all sub-basins showed an increasing trend during 1990–2000. At the same time, although the ERI was the highest upstream, the ERI increased the fastest downstream, with a growth rate of 0.007/a. The ecological risk in the sub-basins showed a downward trend between 2000 and 2010, but the rate of change was lower compared with before 2000. The rate of decline was faster in the upstream and midstream than in the downstream, at −0.005/a and −0.004/a, respectively. The rate of increase in upstream and midstream ecological risk over the period 2010–2020 was greater than the average rate of the change prior to 2010. Meanwhile, the upstream ERI rose at a rate of 0.008/a, the highest in the last 30 years, while the midstream and downstream rates of change were 0.004/a and 0.006/a, respectively. In addition, the order of growth of the ERI during the study period from high to low was downstream (0.004/a), upstream (0.003/a) and midstream (0.001/a). This means that the average ecological risk level and the decadal risk growth rate were not consistent across the GRB. Although the downstream is currently at lower ecological risk than the upstream, it has a faster average growth rate. Therefore, there will be a greater emphasis on downstream environmental protection and ecological management in the future.
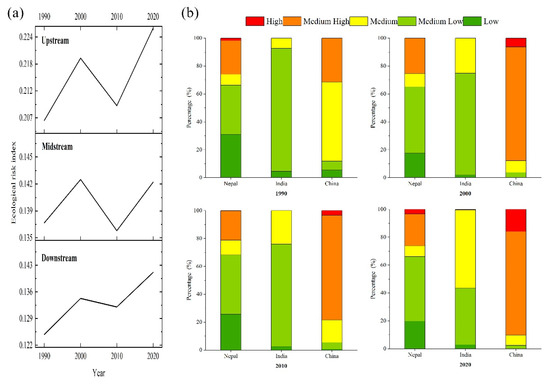
Figure 4.
Ecological risk in GRB from 1990 to 2020: (a) sub-basin change trend, (b) percentage change in Nepal, India, China.
To clarify the level of ecological risk in different countries, we further calculated the percentage of ERI for Nepal, India and China within the GRB shown in Figure 4b. On the whole, the ERI for India and Nepal in the study area are at a medium level, while at a medium high level within China. The average ERI for India in the GRB for 1990–2020 was 0.14, the lowest risk index of the three countries. Before 2010, India had a shallow ecological risk level, with only low, medium low and medium risk zones. Similarly, low and medium low risk zones accounted for as much as 92.69% in 1990. During 2010–2020, medium high and high risk zones emerged, and the medium risk percentage increased the most to 56.05%. During the study period, the average ERI for Nepal in the Gandaki watershed was 0.15 and the highest percentage was of medium risk areas. For the period 1990–2000, the medium low risk level increased by 12%, mainly from the low risk area. After the 2010s, the medium high risk area increased to 26.20%. The average ERI for the Chinese portion of the GRB over the past 30 years was 0.21, the highest risk level of the three countries. The medium risk zone dominated in 1990, and since then, the ecological risk has gradually increased to a predominantly medium high risk.
3.4. Spatial Autocorrelation Analysis of Ecological Risk
Moran’s I was applied to conduct the global spatial autocorrelation analysis of ecological risks to explore the clustering characteristics of ecological risks, and the results are presented in Figure 5. The Moran’s I reached 0.76, 0.51, 0.59 and 0.74 in 1990, 2000, 2010 and 2020, respectively. Moran’s I values were higher at each phase, indicating a significant positive spatial clustering effect of the GRB ecological risk index over the 30-year period. That is, the ecological risk grades at most landscape scales are similar to the risk levels in their surroundings. In addition, there were fluctuations in the values of Moran’s I, as it showed a certain decline from 1990 to 2000 and a gradual increase after the 2000s. This phenomenon suggested that before 2000, land-cover change mainly contributed to the increased spatial heterogeneity of landscape ecological risk. While patches with similar levels of landscape ecological risk continued to spread after 2000, the spatial aggregation effect increased substantially and positive spatial correlation became the prevailing characteristic of the GRB. However, compared to 1990, the values of Moran’s I were lower in 2020, which further indicated that the factors influencing changes in ecological risk in the GRB tended to be more diverse.
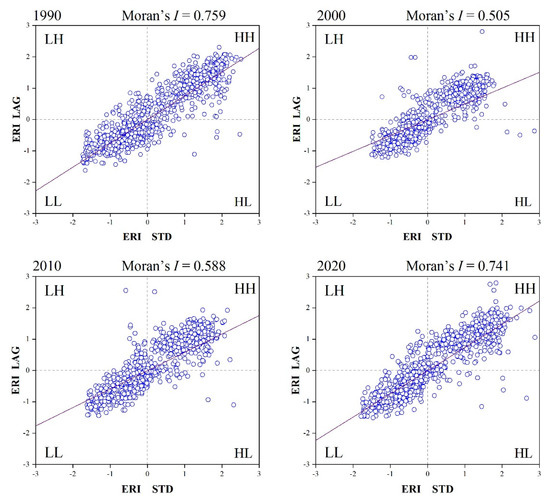
Figure 5.
Moran’s I scatter plot of ecological risk in Gandaki river basin from 1990 to 2020.
Subsequently, we applied the LISA to visualize the landscape scale agglomeration characteristics and spatial dynamics at the time scale of ecological risk from 1990 to 2020 (Figure 6). The general characteristics of the spatial clustering of ecological risks in the GRB were relatively similar over the 30 years and changes occurred mainly at local scales. In general, four spatial autocorrelation patterns are involved in the GRB: high–high, high–low, low–high and low–low. Among them, high–high agglomeration and low–low agglomeration were the dominant patterns of spatial autocorrelation. However, the distribution of the two patterns was dramatically spatially heterogeneous. Specifically, the high–high risk clusters were mainly located in the northern part of the basin, in line with the medium high ecological risk area concentrated in the north of the Himalayas, including the Gyirong County in China and the Annapurna and Manaslu conservation areas in Nepal. The low–low risk clustering was mainly in the central part of the basin, consistent with the low risk area and distributed in the Myagdi, Kaski and Chitwan districts of Nepal. In contrast to these two agglomeration types, the low–high and high–low cluster types were rarely distributed and were mainly scattered.
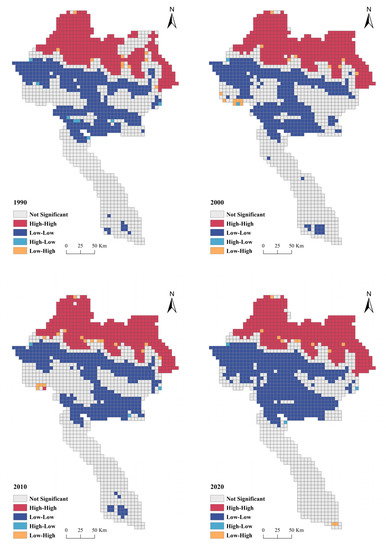
Figure 6.
Local spatial autocorrelation analysis of ecological risk in Gandaki river Basin.
Notably, from 1990 to 2020, the extent of both high–high and low–low spatial autocorrelation patterns showed a significant expansion. The total proportion of the two together increased from 53.2% to 61.7%. However, the two patterns show different characteristics of change at each stage. In 2000, approximately 2.4% of the study area shifted from a non-significant pattern to a high–high-risk agglomeration, which may be associated with grassland degradation and high-elevation forest deforestation, accompanied by an increase in economic activity at the border [48,80]. After 2010, when community forestry projects played a prominent role in Nepal, along with the abandonment of a large amount of hilly mountainous cultivated land, the low–low agglomeration pattern expanded moderately in the central sub-basin increasing from 28.1% in 2010 to 34.3% in 2020.
4. Discussion
4.1. Analysis of Land Cover Dynamics Change
The most predominant land cover types in the GRB were forestland and cropland. During 1990–2020, the main characteristics of land-cover change in the study area were increased cropland and reduced forestland. This finding is similar to that of previous studies [48,81]. It can be observed that cropland in the basin increased by 12%, mainly derived from forestland (68%) and grassland (17%), while forestland decreased due to conversion primarily into cropland (74%). This suggests that cropland and forestland are the two land cover types that interact extremely frequently within the GRB. However, there are phased features in the interactive transfer of forestland and agricultural land, which differ from other land cover types.
Before 2000, the expansion of cropland at the expense of forest loss was a substantial feature of this period. Rapid population increase and policy and climatic factors are considered the principal causes of the shift [82,83,84]. Population growth inevitably led to greater demand for food. However, there was a contradiction between the excessive increase in population and the scarcity of agricultural land in mountainous regions. High population growth rates and poverty levels have played a vital role in the expansion of agricultural land. The heavy dependence on natural resources for income generation has also contributed to massive and irreversible deforestation in the Himalayan region [85,86]. In addition, climatic changes and the introduction of commercial crop cultivation have made it possible to practice planting at higher elevation. This has also resulted in a substantial increase in agricultural land in forested areas [55,87]. Furthermore, the expansion of cropland in the GRB has been facilitated by the promulgation and implementation of the plans and policies of Nepal, such as the Pesticides Act 1991, Water Resources Act 1992 and Agricultural Perspective Plan (APP) 1995–2015 [88].
After 2000, the abandonment of cropland and the rise in forestland became the main trends. Some similar results were also found in other regions of Nepal [89,90,91]. This trend generally results from a combination of socio-economic and climatic factors, land management practices, and forest conservation plans [88,92,93]. In the study area, small-scale subsistence farming is the dominant mode of cultivation. Historical studies have shown that approximately 73% of cultivated land is rain-fed on the border between India and Nepal [94]. As a result, agriculture in the basin has a low adaptive capacity to climate change and natural disasters. In addition, the large amount of migration for work has left a shortage of rural labor, and increasing non-farm wage income is essential to understanding this movement [95,96]. The steep gradient of arable land in mountainous areas and the low productivity also contribute to the yearly decline in cropland [97]. Correspondingly, agricultural abandonment or some long-term fallow situation leading to subsequent natural regeneration of vegetation is also responsible for increasing forestland. In addition, economic development and the implementation of the government’s Land Use Policy (2013, 2015) in Nepal prohibiting the illegal conversion of one land use to another has effectively protected existing forestland [98]. Some studies highlight the Community Forestry Program (CFP) as one of the world’s most successful forest conservation initiatives. Many targeted forest policy initiatives have led to substantial progress in national forest conservation and restoration [99,100]. Afforestation and improved forest management both contribute to the increase in forest cover [101]. Furthermore, this study identified the rapid urban expansion of the Himalayan valley in recent decades that has taken up surrounding cropland, contributing to the decline in cropland.
The GRB is one of the most sensitive areas for global climate change due to its enormous elevation difference and vertical zonation [102]. Glacial snow cover is one of the critical land covers in the Gandaki basin and is also particularly sensitive to climate change. Over the last 30 years, there has been a substantial reduction trend in glacial snow cover in the study area, representing a loss of 23% of the initial total. This may be related to climate change-induced increases in temperature and decreases in precipitation [103,104]. In addition, many studies have confirmed that grassland ecosystems on the Tibetan Plateau are suffering from severe degradation under the comprehensive effects of climate change and human activities [105,106,107]. This study also provides evidence for those results. The GRB grassland is located in the rain shadow zone of the northern slopes of the Himalayas and is also subject to a warm and dry climate. Overgrazing may have accelerated its degradation [108]. It is a common phenomenon that urban land has become the land type with the highest growth rate in the GRB in the context of global urbanization. Meanwhile, it is in line with historical research on the decreasing trend of agricultural land near large cities [109].
4.2. Spatial-Temporal Characteristics Change in ERI
Overall, ecological risk in the GRB is relatively low, with more than 65% of the area at medium and medium low risk levels. Still, there is significant heterogeneity in the spatial distribution of ecological risk. The northern part of the GRB is on the Tibetan Plateau, with a high elevation and fragile landscape that permits lower anthropogenic disturbance [110]. However, the extensive range of barren ground and glaciers and permanent snow also causes high ecological risks. In addition, slight anthropogenic disturbances to sensitive ecosystems can cause irreversible damage. In the central and southern parts of the GRB, forestland is the most widely distributed landscape type. Compared to other landscape types, forestland has low vulnerability and is more resistant to disturbance [111], and thus has relatively low ecological risk. In the southern part of the basin are scattered settlements with high degrees of human activity. However, the continuous agricultural landscape covers up to 84% of the total downstream area, rendering the ecological risk medium.
The general ecological risk to GRB has increased over the past 30 years. However, three stages of change were observed: the ERI showed an increasing trend before 2000; a slight decrease during 2000–2010; a gradual increase after 2010. From 1990–2000, the leading causes of increased risk during this period were high population growth rates and natural resource-based livelihood behavior [86]. In addition to the extensive deforestation for agriculture to satisfy essential food requirements, the demand for timber and firewood by local people has increased forest fragmentation in terms of the exploitation of forest land [112]. In the southern part of the basin in the Indian state of Bihar, the imbalance between the large population and the limited cultivated area has intensified the reclamation of cropland. In addition, forest encroachment and grassland degradation are also important causes of ecological risk deterioration in the northern part of the basin. For example, the expansion of colonized areas brought about by population migration to high elevation mountains, the number of livestock maintained over their carrying capacity, harsh climatic conditions, inadequate management and overgrazing negatively impact the environment [113,114]. The deterioration in ecological risk was mitigated to some extent between 2000 and 2010. A series of Nepalese government policies to protect forests were implemented during this period, such as the agricultural biodiversity policy (2007) plant protection act (2007), which contributed to ecological improvements. Furthermore, the beginning of the abandonment of cropland during this period also contributed to the natural recovery of the vegetation. After 2010, the ecological risks have deteriorated due to a combination of natural and human factors. On the frontier between China and Nepal, warming climates exacerbated the melting and fragmentation of Himalayan glaciers. At the trading ports, the frequent economic and trade activities also increased human disturbance [80]. In addition, the construction of transport and the development of tourism have inevitably altered the continuous landscape. The high intensity of natural catastrophes in the GRB, especially the Gorkha earthquake in 2015, which triggered landslides and mudslides, continues to affect the ecological environment in the central mountainous region. In the southern part of the study area in Bihar, floods have resulted in large areas of fallow land and a more fragmented landscape due to urbanization as new buildings are built on agricultural and vegetated land.
4.3. Implication and Uncertainty of Ecological Risk Assessment
Ecological risk assessment based on land-cover change is an important tool for the integrated conservation and management of watershed ecosystems. The rationality of land use in watersheds is of great relevance to the control of ecological risks. There is a high degree of spatial heterogeneity in the impact of unsustainable anthropogenic disturbance on ecological risk in the study area. Therefore, optimizing land management options and developing targeted ecosystem protection measures depending on different ecological or geographical zoning frameworks is required [115]. In the high Himalayas, the focus is on overgrazing and high elevation reclamation. In the middle mountain, the conflict between human survival and environmental protection should be reconciled by developing a sound land development system, reducing deforestation and limiting cultivation on steep slopes. In the south plain, appropriate policies and regulations should be improved to limit urban sprawl.
This study found inconsistencies between ecological risk levels and rates of change. The upstream was the area with the highest risk levels, while the downstream had the fastest-growing risks. Therefore, while strengthening the landscape management of upstream ecological risk areas and improving and maintaining protected areas, the prevention and control of downstream ecological risks should not be neglected. The study area is a transboundary basin among three countries. The varying levels of risk and rates of change between countries present a challenge for adequate protection and coordinated management of the basins. Past studies have demonstrated that ecological risk management at national boundaries is a weak point in watershed management [116]. Thus, there is a necessity to establish special joint agencies for cross-national synergies to maintain the integrity and connectivity of natural landscapes. In addition, the Gandaki basin has a large number of national parks and protected areas that are hotspots for biodiversity maintenance and ecosystem conservation. Increased ecological risk in ecologically sensitive areas of the Himalayas could have irreversible consequences. For example, the endangered Bengal tiger (Panthera tigris) and leopard (Panthera pardus fusca) inhabit the Chitwan National Park in the GRB. Habitat degradation is inextricably linked to the deterioration in ecological risks in protected areas. Increased ecological risk management practices in core protected areas are essential for the ecological well-being and sustainable development of watersheds. In addition, the study area is highly prone to a variety of natural hazards. In the upstream basin, glacial melt brings glacial and hydrological hazards such as glacial lake outburst floods and glacier debris flows [57], midstream mountain landslides and erosion [59,117], and downstream floods and droughts are frequent. These disasters inevitably increase the ecological risk to the basin. Attention should therefore be paid to the basin’s ecological risk and hazard risk characteristics, and disaster risk pre-warning systems and ecological safety measures should be actively pursued.
This research constructed an ecological risk assessment model based on the relationship between ecosystem land-cover change and ecological risk at the landscape scale, integrating the landscape disturbance index and the landscape vulnerability index. The method has been widely applied at different spatial and temporal scales, providing a convenient and efficient means of assessment. However, we realized that there are some uncertainties in this study. Firstly, the ecological risk assessment results are highly dependent on the results of land cover mapping. This consists of two main aspects: the cartographic accuracy of the land cover and, on the other hand, the classification system of the land cover. It is evident that the level of accuracy of land cover mapping affects the quality of ecological risk assessment. In this study, the overall accuracy of the land cover mapping was above 85% for all four study periods, so evaluating ecological risk based on these data is probably sufficient. However, the land-cover change analysis accuracy is not yet defined, and the area and percentage statistics are derived from straight-line pixel counts tallying between map dates, without a measure of statistical uncertainty to them [118,119]. In general, there is often some error in the precision of the mapping, but access to highly accurate landscape data can help to enhance the assessment results. However, the GRB is located in the Himalayas, a data black hole [120]. The availability of good quality remote sensing imagery is minimal. This research carried out an ecological risk assessment based on seven land cover types over four time periods. Future land cover data with higher spatial and temporal resolution and more advanced classification systems are the way to reduce ecological risk uncertainty. Secondly, the spatial expression of ecological risk is sensitive to the delineation of assessment units. The grid size of the sampling area is an important factor contributing to the uncertainty in ecological risk assessment, and more research is needed to reveal the relationship between the accuracy of ecological risk assessment and the optimal grid size. Thirdly, in the ERI-based assessment model, the degree of vulnerability of different landscapes and the weight of the disturbance index and vulnerability index is determined empirically and based on thresholds. More attention should be given to modelling the objective relationship and sensitivity of risk receptors to external perturbations to improve accuracy. Finally, this study provided a preliminary examination of the possible drivers of ecological risk change, which is essential for understanding the evolution and mechanisms of action of ecological risk. In the future, an ecological process perspective should be used to integrate the identification of ecological risk change factors.
5. Conclusions
In this study, on the basis of a quantitative analysis of land-cover change over the last 30 years, the ERI was developed from a landscape ecology perspective to assess ecological risks in the GRB for the period 1990–2020, using a spatial autocorrelation approach to identify spatial clustering characteristic of ecological risk. The main land cover types in the GRB during the study period were always forestland and cropland, together accounting for over 60% of the total watershed area. Overall, the GRB has experienced substantial land-cover change. Forestland, glacier/snow and grassland showed a decreasing trend, while the remaining land cover types showed an increasing trend. It is worth noting that cropland and forestland were the most frequently interacting land cover types in the basin. There is apparent heterogeneity in the spatial distribution of ecological risks. The medium high risk areas were mainly located in the northern Himalayas and the medium low risk areas were located in the other mountains and hills of Nepal. Furthermore, there was a general fluctuating upward trend in the ecological risk of GRB. Still, the changes can be divided into three phases: Ecological risk increased before 2000, decreased slightly during 2000–2010 and turned to an increasing trend after 2010 when the medium and high risk areas increased extensively. In addition, the upstream portions in Nepal and China were the areas with the highest levels of ecological risk in the study area. However, downstream in the Ganges Plain was the area with the fastest growth rate of risk. The ERI of the basin showed a positive high spatial autocorrelation and spatial clustering effect, with high–high aggregation mainly distributed within the Tibetan Plateau and low–low aggregation primarily in the central part. This study provided valuable information and scientific guidance for cross-national cooperation on quality development and landscape management in transboundary basins.
Supplementary Materials
The following supporting information can be downloaded at: https://www.mdpi.com/article/10.3390/land11050638/s1, Table S1: Accuracy assessment of land cover classification from 2000 to 2020.
Author Contributions
L.L. and B.C. had the original idea and designed the study. B.C. processed and analyzed the data and wrote the manuscript; Y.Z., Z.W. and L.L. had insights on the revision of the manuscript and suggestions for improvement. C.G. provided help and guidance for data processing mapping. C.G., B.W. and D.G. revised the paper. M.K.R. polished the manuscript. All authors have read and agreed to the published version of the manuscript.
Funding
This research was funded by the Strategic Priority Research Program of the Chinese Academy of Sciences (Grant No. XDA20040201), the Second Tibetan Plateau Scientific Expedition and Research (Grant No. 2019QZKK0603), and the Award of 2019 CAS-TWAS President’s Fellowship (Series No 2019-001).
Data Availability Statement
Not applicable.
Acknowledgments
The authors are grateful for the data provider of Land Change and Regional Adaptation Research Group of the Tibetan Plateau, Institute of Geographic Sciences and Natural Resources Research, CAS, and the anonymous reviewers and the editor for their constructive comments and suggestions for this paper.
Conflicts of Interest
The authors declare no conflict of interest.
References
- Li, W.H.; Zhang, B.; Xie, G.D. Research on ecosystem services in China: Progress and perspectives. J. Nat. Resour. 2009, 24, 1–10. [Google Scholar]
- Ecosystem Assessment Millennium. Ecosystems and Human Well-Being: Synthesis; Island Press: Washington, DC, USA, 2005. [Google Scholar]
- Costanza, R.; D’Arge, R.; De Groot, R.; Farber, S.; Grasso, M.; Hannon, B.; Limburg, K.; Naeem, S.; O’Neill, R.V.; Paruelo, J.; et al. The value of the world’s ecosystem services and natural capital. Nature 1997, 387, 253–260. [Google Scholar] [CrossRef]
- Daniel, T.C.; Muhar, A.; Arnberger, A.; Aznar, O.; Boyd, J.W.; Chan, K.M.; Costanza, R.; Elmqvist, T.; Flint, C.G.; Gobster, P.H.; et al. Contributions of cultural services to the ecosystem services agenda. Proc. Natl. Acad. Sci. USA 2012, 109, 8812–8819. [Google Scholar] [CrossRef] [PubMed] [Green Version]
- Haddad, N.M.; Brudvig, L.A.; Clobert, J.; Davies, K.F.; Gonzalez, A.; Holt, R.D.; Lovejoy, T.E.; Sexton, J.O.; Austin, M.P.; Collins, C.D.; et al. Habitat fragmentation and its lasting impact on Earth’s ecosystems. Sci. Adv. 2015, 1, e1500052. [Google Scholar] [CrossRef] [Green Version]
- Geldmann, J.; Joppa, L.N.; Burgess, N.D. Mapping change in human pressure globally on land and within protected areas. Conserv. Biol. 2014, 28, 1604–1616. [Google Scholar] [CrossRef]
- Vogt, J.V.; Safriel, U.; Von Maltitz, G.; Sokona, Y.; Zougmore, R.; Bastin, G.; Hill, J. Monitoring and assessment of land degradation and desertification: Towards new conceptual and integrated approaches. Land Degrad. Dev. 2011, 22, 150–165. [Google Scholar] [CrossRef]
- Foley, J.A.; Asner, G.P.; Costa, M.H.; Coe, M.T.; DeFries, R.; Gibbs, H.K.; Howard, E.A.; Olson, S.; Patz, J.; Ramankutty, N.; et al. Amazonia revealed: Forest degradation and loss of ecosystem goods and services in the Amazon Basin. Front. Ecol. Environ. 2007, 5, 25–32. [Google Scholar] [CrossRef]
- Ravi, S.; Law, D.J.; Caplan, J.S.; Barron-Gafford, G.A.; Dontsova, K.M.; Espeleta, J.F.; Villegas, J.C.; Okin, G.S.; Breshears, D.D.; Huxman, T.E. Biological invasions and climate change amplify each other’s effects on dryland degradation. Glob. Chang. Biol. 2022, 28, 285–295. [Google Scholar] [CrossRef]
- Nguyen, K.; Liou, Y. Global mapping of eco-environmental vulnerability from human and nature disturbances. Sci. Total Environ. 2019, 664, 995–1004. [Google Scholar] [CrossRef]
- Song, W.; Deng, X. Land-use/land-cover change and ecosystem service provision in China. Sci. Total Environ. 2017, 576, 705–719. [Google Scholar] [CrossRef]
- Verburg, P.H.; Crossman, N.; Ellis, E.C.; Heinimann, A.; Hostert, P.; Mertz, O.; Nagendra, H.; Sikor, T.; Erb, K.; Golubiewski, N.; et al. Land system science and sustainable development of the earth system: A global land project perspective. Anthropocene 2015, 12, 29–41. [Google Scholar] [CrossRef] [Green Version]
- Liao, J.; Jia, Y.; Tang, L.; Huang, Q.; Wang, Y.; Huang, N.; Hua, L. Assessment of urbanization-induced ecological risks in an area with significant ecosystem services based on land use/cover change scenarios. Int. J. Sustain. Dev. World Ecol. 2018, 25, 448–457. [Google Scholar] [CrossRef]
- Xie, H.; Wang, P.; Huang, H. Ecological risk assessment of land use change in the Poyang Lake eco-economic zone, China. Int. J. Environ. Res. Public Health 2013, 10, 328. [Google Scholar] [CrossRef] [PubMed] [Green Version]
- Chen, H.; Liu, J.; Cao, Y.; Li, S.; Ouyang, H. Progresses of ecological risk assessment. Acta Ecol. Sin. 2006, 26, 1558–1566. [Google Scholar]
- Hope, B.K. An examination of ecological risk assessment and management practices. Environ. Int. 2006, 32, 983–995. [Google Scholar] [CrossRef]
- Wang, H.; Liu, X.; Zhao, C.; Chang, Y.; Liu, Y.; Zang, F. Spatial-temporal pattern analysis of landscape ecological risk assessment based on land use/land cover change in Baishuijiang National nature reserve in Gansu Province, China. Ecol. Indic. 2021, 124, 107454. [Google Scholar] [CrossRef]
- Solomon, K.R.; Baker, D.B.; Richards, R.P.; Dixon, K.R.; Klaine, S.J.; La Point, T.W.; Kendall, R.J.; Weisskopf, C.P.; Giddings, J.M.; Giesy, J.P.; et al. Ecological risk assessment of atrazine in North American surface waters. Environ. Toxicol. Chem. Int. J. 1996, 15, 31–76. [Google Scholar] [CrossRef]
- National Research Council. Risk Assessment in the Federal Government: Managing the Process; The National Academies Press: Washington, DC, USA, 1983. [Google Scholar]
- Peng, J.; Dang, W.X.; Liu, Y.X.; Zong, M.L.; Hu, X.X. Review on landscape ecological risk assessment. Acta Geogr. Sin 2015, 70, 664–677. [Google Scholar]
- Wang, B.; Ding, M.; Li, S.; Liu, L.; Ai, J. Assessment of landscape ecological risk for a cross-border basin: A case study of the Koshi River Basin, central Himalayas. Ecol. Indic. 2020, 117, 106621. [Google Scholar] [CrossRef]
- Kwon, O.; Kim, J.; Ra, J. Landscape ecological analysis of green network in urban area using circuit theory and least-cost path. Land 2021, 10, 847. [Google Scholar] [CrossRef]
- Zhang, T.; Du, Z.; Yang, J.; Yao, X.; Ou, C.; Niu, B.; Yan, S. Land cover mapping and ecological risk assessment in the context of recent ecological migration. Remote Sens. 2021, 13, 1381. [Google Scholar] [CrossRef]
- Xie, H.; Wen, J.; Chen, Q.; Wu, Q. Evaluating the landscape ecological risk based on GIS: A case-study in the Poyang Lake region of China. Land Degrad. Dev. 2021, 32, 2762–2774. [Google Scholar] [CrossRef]
- Hou, M.; Ge, J.; Gao, J.; Meng, B.; Li, Y.; Yin, J.; Liu, J.; Feng, Q.; Liang, T. Ecological risk assessment and impact factor analysis of alpine wetland ecosystem based on LUCC and boosted regression tree on the Zoige Plateau, China. Remote Sens. 2020, 12, 368. [Google Scholar] [CrossRef] [Green Version]
- Zhang, W.; Chang, W.J.; Zhu, Z.C.; Hui, Z. Landscape ecological risk assessment of Chinese coastal cities based on land use change. Appl. Geogr. 2020, 117, 102174. [Google Scholar] [CrossRef]
- Zhai, T.; Wang, J.; Fang, Y.; Qin, Y.; Huang, L.; Chen, Y. Assessing ecological risks caused by human activities in rapid urbanization coastal areas: Towards an integrated approach to determining key areas of terrestrial-oceanic ecosystems preservation and restoration. Sci. Total Environ. 2020, 708, 135153. [Google Scholar] [CrossRef] [PubMed]
- Li, J.; Pu, R.; Gong, H.; Luo, X.; Ye, M.; Feng, B. Evolution characteristics of landscape ecological risk patterns in coastal zones in Zhejiang Province, China. Sustainability 2017, 9, 584. [Google Scholar] [CrossRef] [Green Version]
- Xue, L.; Zhu, B.; Wu, Y.; Wei, G.; Liao, S.; Yang, C.; Wang, J.; Zhang, H.; Ren, L.; Han, Q. Dynamic projection of ecological risk in the Manas River basin based on terrain gradients. Sci. Total Environ. 2019, 653, 283–293. [Google Scholar] [CrossRef]
- Leuven, R.S.; Poudevigne, I. Riverine landscape dynamics and ecological risk assessment. Freshw. Biol. 2002, 47, 845–865. [Google Scholar] [CrossRef]
- Gong, J.; Zhao, C.; Xie, Y.; Gao, Y. Ecological risk assessment and its management of Bailongjiang watershed, southern Gansu based on landscape pattern. Chin. J. Appl. Ecol. 2014, 25, 2041–2048. [Google Scholar]
- Zhang, Y.; Lei, G.; Lin, J.; Zhang, H. Spatiotemporal change and its ecological risk of landscape pattern in different spatial scales in Zhalong Nature Reserve. Chin. J. Ecol. 2012, 31, 1250–1256. [Google Scholar]
- Jin, X.; Jin, Y.; Mao, X. Ecological risk assessment of cities on the Tibetan Plateau based on land use/land cover changes—Case study of Delingha City. Ecol. Indic. 2019, 101, 185–191. [Google Scholar] [CrossRef]
- Gong, J.; Yang, J.; Tang, W. Spatially explicit landscape-level ecological risks induced by land use and land cover change in a national ecologically representative region in China. Int. J. Environ. Res. Public Health 2015, 12, 4192. [Google Scholar] [CrossRef] [PubMed] [Green Version]
- Mo, W.; Wang, Y.; Zhang, Y.; Zhuang, D. Impacts of road network expansion on landscape ecological risk in a megacity, China: A case study of Beijing. Sci. Total Environ. 2017, 574, 1000–1011. [Google Scholar] [CrossRef] [PubMed] [Green Version]
- Wang, X.; Che, L.; Zhou, L.; Xu, J. Spatio-temporal Dynamic Simulation of Land use and Ecological Risk in the Yangtze River Delta Urban Agglomeration, China. Chin. Geogr. Sci. 2021, 31, 829–847. [Google Scholar] [CrossRef]
- Kang, P.; Chen, W.; Hou, Y.; Li, Y. Linking ecosystem services and ecosystem health to ecological risk assessment: A case study of the Beijing-Tianjin-Hebei urban agglomeration. Sci. Total Environ. 2018, 636, 1442–1454. [Google Scholar] [CrossRef]
- Liu, J.; Yong, D.L.; Choi, C.; Gibson, L. Transboundary frontiers: An emerging priority for biodiversity conservation. Trends Ecol. Evol. 2020, 35, 679–690. [Google Scholar] [CrossRef]
- Kark, S.; Tulloch, A.; Gordon, A.; Mazor, T.; Bunnefeld, N.; Levin, N. Cross-boundary collaboration: Key to the conservation puzzle. Curr. Opin. Environ. Sustain. 2015, 12, 12–24. [Google Scholar] [CrossRef]
- López-Hoffman, L.; Varady, R.G.; Flessa, K.W.; Balvanera, P. Ecosystem services across borders: A framework for transboundary conservation policy. Front. Ecol. Environ. 2010, 8, 84–91. [Google Scholar] [CrossRef] [Green Version]
- Erg, B.; Groves, C.; McKinney, M.; Michel, T.R.; Phillips, A.; Schoon, M.L.; Vasilijevic, M.; Zunckel, K. Trans-Boundary Conservation: A Systematic and Integrated Approach; Best practice protected area guidelines series 2015; IUCN: Gland, Switzerland, 2015. [Google Scholar]
- De Castro-Pardo, M.; Pérez-Rodríguez, F.; Martín-Martín, J.M.; Azevedo, J.C. Modelling stakeholders’ preferences to pinpoint conflicts in the planning of transboundary protected areas. Land Use Policy 2019, 89, 104233. [Google Scholar] [CrossRef] [Green Version]
- Gu, C.; Zhang, Y.; Liu, L.; Li, L.; Li, S.; Zhang, B.; Cui, B.; Rai, M.K. Qualifying land use and land cover dynamics and their impacts on ecosystem service in central himalaya transboundary landscape based on google earth engine. Land 2021, 10, 173. [Google Scholar] [CrossRef]
- McCallum, J.W.; Vasilijevi, C.M.; Cuthill, I. Assessing the benefits of Transboundary Protected Areas: A questionnaire survey in the Americas and the Caribbean. J. Environ. Manag. 2015, 149, 245–252. [Google Scholar] [CrossRef] [PubMed] [Green Version]
- Chicas, S.D.; Omine, K.; Ford, J.B.; Sugimura, K.; Yoshida, K. Using spatial metrics and surveys for the assessment of trans-boundary deforestation in protected areas of the Maya Mountain Massif: Belize-Guatemala border. J. Environ. Manag. 2017, 187, 320–329. [Google Scholar] [CrossRef]
- Gurung, J.; Chettri, N.; Sharma, E.; Ning, W.; Chaudhary, R.P.; Badola, H.K.; Wangchuk, S.; Uprety, Y.; Gaira, K.S.; Bidha, N.; et al. Evolution of a transboundary landscape approach in the Hindu Kush Himalaya: Key learnings from the Kangchenjunga Landscape. Glob. Ecol. Conserv. 2019, 17, e00599. [Google Scholar] [CrossRef]
- Zeitoun, M.; Goulden, M.; Tickner, D. Current and future challenges facing transboundary river basin management. Wiley Interdiscip. Rev. Clim. Chang. 2013, 4, 331–349. [Google Scholar] [CrossRef]
- Rai, R.; Zhang, Y.; Paudel, B.; Acharya, B.K.; Basnet, L. Land use and land cover dynamics and assessing the ecosystem service values in the trans-boundary Gandaki River Basin, Central Himalayas. Sustainability 2018, 10, 3052. [Google Scholar] [CrossRef] [Green Version]
- Wu, X.; Paudel, B.; Zhang, Y.; Liu, L.; Wang, Z.; Xie, F.; Gao, J.; Sun, X. Vertical distribution changes in land cover between 1990 and 2015 within the Koshi River Basin, Central Himalayas. J. Geogr. Sci. 2021, 31, 1419–1436. [Google Scholar] [CrossRef]
- Da Silva, R.F.B.; Millington, J.D.; Moran, E.F.; Batistella, M.; Liu, J. Three decades of land-use and land-cover change in mountain regions of the Brazilian Atlantic Forest. Landsc. Urban Plan. 2020, 204, 103948. [Google Scholar] [CrossRef]
- Paudel, B.; Zhang, Y.; Li, S.; Liu, L.; Wu, X.; Khanal, N.R. Review of studies on land use and land cover change in Nepal. J. Mt. Sci. 2016, 13, 643–660. [Google Scholar] [CrossRef]
- Maharjan, A.; Kochhar, I.; Chitale, V.S.; Hussain, A.; Gioli, G. Understanding rural outmigration and agricultural land use change in the Gandaki Basin, Nepal. Appl. Geogr. 2020, 124, 102278. [Google Scholar] [CrossRef]
- Karki, K.B.; Ojha, R.B. Land Degradation. In The Soils of Nepal; Springer: Berlin/Heidelberg, Germany, 2021; pp. 127–142. [Google Scholar]
- Rimal, B.; Sharma, R.; Kunwar, R.; Keshtkar, H.; Stork, N.E.; Rijal, S.; Rahman, S.A.; Baral, H. Effects of land use and land cover change on ecosystem services in the Koshi River Basin, Eastern Nepal. Ecosyst. Serv. 2019, 38, 100963. [Google Scholar] [CrossRef]
- Bocchiola, D.; Brunetti, L.; Soncini, A.; Polinelli, F.; Gianinetto, M. Impact of climate change on agricultural productivity and food security in the Himalayas: A case study in Nepal. Agric. Syst. 2019, 171, 113–125. [Google Scholar] [CrossRef]
- Tilleard, S.; Ford, J. Adaptation readiness and adaptive capacity of transboundary river basins. Clim. Chang. 2016, 137, 575–591. [Google Scholar] [CrossRef]
- Nie, Y.; Sheng, Y.; Liu, Q.; Liu, L.; Liu, S.; Zhang, Y.; Song, C. A regional-scale assessment of Himalayan glacial lake changes using satellite observations from 1990 to 2015. Remote Sens. Environ. 2017, 189, 1–13. [Google Scholar] [CrossRef] [Green Version]
- Fort, M. Natural hazards versus climate change and their potential impacts in the dry, northern Himalayas: Focus on the upper Kali Gandaki (Mustang District, Nepal). Environ. Earth Sci. 2015, 73, 801–814. [Google Scholar] [CrossRef]
- Bricker, J.D.; Schwanghart, W.; Adhikari, B.R.; Moriguchi, S.; Roeber, V.; Giri, S. Performance of models for flash flood warning and hazard assessment: The 2015 Kali Gandaki landslide dam breach in Nepal. Mt. Res. Dev. 2017, 37, 5–15. [Google Scholar] [CrossRef] [Green Version]
- Aryal, D.; Wang, L.; Adhikari, T.R.; Zhou, J.; Li, X.; Shrestha, M.; Wang, Y.; Chen, D. A model-based flood hazard mapping on the southern slope of Himalaya. Water 2020, 12, 540. [Google Scholar] [CrossRef] [Green Version]
- Pant, R.R.; Zhang, F.; Rehman, F.U.; Wang, G.; Ye, M.; Zeng, C.; Tang, H. Spatiotemporal variations of hydrogeochemistry and its controlling factors in the Gandaki River Basin, Central Himalaya Nepal. Sci. Total Environ. 2018, 622, 770–782. [Google Scholar] [CrossRef]
- Panthi, J.; Dahal, P.; Shrestha, M.L.; Aryal, S.; Krakauer, N.Y.; Pradhanang, S.M.; Lakhankar, T.; Jha, A.K.; Sharma, M.; Karki, R. Spatial and temporal variability of rainfall in the Gandaki River Basin of Nepal Himalaya. Climate 2015, 3, 210. [Google Scholar] [CrossRef] [Green Version]
- Bahadur, K.K. Spatio-temporal patterns of agricultural expansion and its effect on watershed degradation: A case from the mountains of Nepal. Environ. Earth Sci. 2012, 65, 2063–2077. [Google Scholar] [CrossRef]
- Sharma, S.; Khadka, N.; Hamal, K.; Shrestha, D.; Talchabhadel, R.; Chen, Y. How accurately can satellite products (TMPA and IMERG) detect precipitation patterns, extremities, and drought across the Nepalese Himalaya? Earth Space Sci. 2020, 7, e2020EA001315. [Google Scholar] [CrossRef]
- Karki, R.; Talchabhadel, R.; Aalto, J.; Baidya, S.K. New climatic classification of Nepal. Theor. Appl. Climatol. 2016, 125, 799–808. [Google Scholar] [CrossRef]
- Zhang, Y.; Liu, L.; Li, B.; Zheng, D. Redetermine the region and boundaries of Tibetan Plateau. Geogr. Res. 2021, 40, 1543–1553. [Google Scholar]
- Gorelick, N.; Hancher, M.; Dixon, M.; Ilyushchenko, S.; Thau, D.; Moore, R. Google Earth Engine: Planetary-scale geospatial analysis for everyone. Remote Sens. Environ. 2017, 202, 18–27. [Google Scholar] [CrossRef]
- Tucker, C.J. Red and photographic infrared linear combinations for monitoring vegetation. Remote Sens. Environ. 1979, 8, 127–150. [Google Scholar] [CrossRef] [Green Version]
- Matsushita, B.; Yang, W.; Chen, J.; Onda, Y.; Qiu, G. Sensitivity of the enhanced vegetation index (EVI) and normalized difference vegetation index (NDVI) to topographic effects: A case study in high-density cypress forest. Sensors 2007, 7, 2636. [Google Scholar] [CrossRef] [Green Version]
- Zha, Y.; Gao, J.; Ni, S. Use of normalized difference built-up index in automatically mapping urban areas from TM imagery. Int. J. Remote Sens. 2003, 24, 583–594. [Google Scholar] [CrossRef]
- Fensholt, R.; Sandholt, I. Derivation of a shortwave infrared water stress index from MODIS near-and shortwave infrared data in a semiarid environment. Remote Sens. Environ. 2003, 87, 111–121. [Google Scholar] [CrossRef]
- Notarnicola, C.; Duguay, M.; Moelg, N.; Schellenberger, T.; Tetzlaff, A.; Monsorno, R.; Costa, A.; Steurer, C.; Zebisch, M. Snow cover maps from MODIS images at 250 m resolution, Part 1: Algorithm description. Remote Sens. 2013, 5, 110. [Google Scholar] [CrossRef] [Green Version]
- Ettehadi Osgouei, P.; Kaya, S.; Sertel, E.; Alganci, U. Separating built-up areas from bare land in Mediterranean cities using sentinel-2a imagery. Remote Sens. 2019, 11, 345. [Google Scholar] [CrossRef] [Green Version]
- Farr, T.G.; Rosen, P.A.; Caro, E.; Crippen, R.; Duren, R.; Hensley, S.; Kobrick, M.; Paller, M.; Rodriguez, E.; Roth, L.; et al. The shuttle radar topography mission. Rev. Geophys. 2007, 45, 1–33. [Google Scholar] [CrossRef] [Green Version]
- Cutler, D.R.; Edwards, T.C., Jr.; Beard, K.H.; Cutler, A.; Hess, K.T.; Gibson, J.; Lawler, J.J. Random forests for classification in ecology. Ecology 2007, 88, 2783–2792. [Google Scholar] [CrossRef] [PubMed]
- Xu, W.; Wang, J.; Zhang, M.; Li, S. Construction of landscape ecological network based on landscape ecological risk assessment in a large-scale opencast coal mine area. J. Clean. Prod. 2021, 286, 125523. [Google Scholar] [CrossRef]
- Li, C.; Chen, J.; Liao, M.; Chen, G.; Zhou, Q. Ecological risk assessment of Shan Xin mining area based on remote sensing and geography information system technology. J. Geogr. Inf. Syst. 2018, 10, 234. [Google Scholar] [CrossRef] [Green Version]
- Anselin, L. Spatial econometrics. In A Companion to Theoretical Econometrics; Wiley-Blackwell: Hoboken, NJ, USA, 2001; p. 310330. [Google Scholar]
- Anselin, L. Local indicators of spatial association—LISA. Geogr. Anal. 1995, 27, 93–115. [Google Scholar] [CrossRef]
- Chan, R.C.; Bhatta, K.D. Trans-Himalayan connectivity and sustainable tourism development in Nepal: A study of community perceptions of tourism impacts along the Nepal—China Friendship Highway. Asian Geogr. 2021, 1–22. [Google Scholar] [CrossRef]
- Wu, X.; Gao, J.; Zhang, Y.; Liu, L.; Zhao, Z.; Basanta, P. Land cover status in the Koshi River Basin, central Himalayas. J. Resour. Ecol. 2017, 8, 10–19. [Google Scholar]
- Paudel, B.; Zhang, Y.; Li, S.; Liu, L. Spatiotemporal changes in agricultural land cover in Nepal over the last 100 years. J. Geogr. Sci. 2018, 28, 1519–1537. [Google Scholar] [CrossRef] [Green Version]
- Nepal, P.; Khanal, N.R.; Zhang, Y.; Paudel, B.; Liu, L. Land use policies in Nepal: An overview. Land Degrad. Dev. 2020, 31, 2203–2212. [Google Scholar] [CrossRef]
- Roy, P.S.; Roy, A.; Joshi, P.K.; Kale, M.P.; Srivastava, V.K.; Srivastava, S.K.; Dwevidi, R.S.; Joshi, C.; Behera, M.D.; Meiyappan, P.; et al. Development of decadal (1985–1995–2005) land use and land cover database for India. Remote Sens. 2015, 7, 2401. [Google Scholar] [CrossRef] [Green Version]
- Agrawal, A.; Ostrom, E. Collective action, property rights, and decentralization in resource use in India and Nepal. Politics Soc. 2001, 29, 485–514. [Google Scholar] [CrossRef] [Green Version]
- Tiwari, P.C. Land-use changes in Himalaya and their impact on the plains ecosystem: Need for sustainable land use. Land Use Policy 2000, 17, 101–111. [Google Scholar] [CrossRef]
- Paudel, B.; Zhang, Y.; Yan, J.; Rai, R.; Li, L. Farmers’ perceptions of agricultural land use changes in Nepal and their major drivers. J. Environ. Manag. 2019, 235, 432–441. [Google Scholar] [CrossRef] [PubMed]
- Ojha, H.R.; Shrestha, K.K.; Subedi, Y.R.; Shah, R.; Nuberg, I.; Heyojoo, B.; Cedamon, E.; Rigg, J.; Tamang, S.; Paudel, K.P.; et al. Agricultural land underutilisation in the hills of Nepal: Investigating socio-environmental pathways of change. J. Rural Stud. 2017, 53, 156–172. [Google Scholar] [CrossRef]
- Khanal, N.R.; Watanabe, T. Abandonment of agricultural land and its consequences. Mt. Res. Dev. 2006, 26, 32–40. [Google Scholar] [CrossRef] [Green Version]
- Chidi, C.L.; Sulzer, W.; Xiong, D.; Wu, Y.; Zhao, W.; Pradhan, P.K. Land use intensity dynamics in the Andhikhola watershed, middle hill of Nepal. J. Mt. Sci. 2021, 18, 1504–1520. [Google Scholar] [CrossRef]
- Rai, R.; Zhang, Y.; Paudel, B.; Khanal, N.R. Status of farmland abandonment and its determinants in the transboundary Gandaki River Basin. Sustainability 2019, 11, 5267. [Google Scholar] [CrossRef] [Green Version]
- Paudel, K.P.; Tamang, S.; Shrestha, K.K. Transforming land and livelihood: Analysis of agricultural land abandonment in the Mid Hills of Nepal. J. For. Livelihood 2014, 12, 11–19. [Google Scholar]
- Shah, K.U.; Dulal, H.B.; Johnson, C.; Baptiste, A. Understanding livelihood vulnerability to climate change: Applying the livelihood vulnerability index in Trinidad and Tobago. Geoforum 2013, 47, 125–137. [Google Scholar] [CrossRef]
- Palazzoli, I.; Maskey, S.; Uhlenbrook, S.; Nana, E.; Bocchiola, D. Impact of prospective climate change on water resources and crop yields in the Indrawati basin, Nepal. Agric. Syst. 2015, 133, 143–157. [Google Scholar] [CrossRef]
- Kc, B.; Race, D. Outmigration and land-use change: A case study from the Middle Hills of Nepal. Land 2020, 9, 2. [Google Scholar] [CrossRef] [Green Version]
- Pandey, R.; Jha, S.K.; Alatalo, J.M.; Archie, K.M.; Gupta, A.K. Sustainable livelihood framework-based indicators for assessing climate change vulnerability and adaptation for Himalayan communities. Ecol. Indic. 2017, 79, 338–346. [Google Scholar] [CrossRef]
- Paudel, B.; Wu, X.; Zhang, Y.; Rai, R.; Liu, L.; Zhang, B.; Khanal, N.R.; Koirala, H.L.; Nepal, P. Farmland abandonment and its determinants in the different ecological villages of the Koshi River Basin, Central Himalayas: Synergy of high-resolution remote sensing and social surveys. Environ. Res. 2020, 188, 109711. [Google Scholar] [CrossRef] [PubMed]
- Chalise, D.; Kumar, L. Land use change affects water erosion in the Nepal Himalayas. PLoS ONE 2020, 15, e231692. [Google Scholar] [CrossRef] [Green Version]
- Niraula, R.R.; Gilani, H.; Pokharel, B.K.; Qamer, F.M. Measuring impacts of community forestry program through repeat photography and satellite remote sensing in the Dolakha district of Nepal. J. Environ. Manag. 2013, 126, 20–29. [Google Scholar] [CrossRef]
- Gautam, A.P.; Webb, E.L.; Eiumnoh, A. GIS assessment of land use/land cover changes associated with community forestry implementation in the Middle Hills of Nepal. Mt. Res. Dev. 2002, 22, 63–69. [Google Scholar] [CrossRef]
- Gautam, A.P.; Shivakoti, G.P.; Webb, E.L. Forest cover change, physiography, local economy, and institutions in a mountain watershed in Nepal. Environ. Manag. 2004, 33, 48–61. [Google Scholar] [CrossRef] [PubMed]
- Pangali Sharma, T.P.; Zhang, J.; Khanal, N.R.; Prodhan, F.A.; Paudel, B.; Shi, L.; Nepal, N. Assimilation of snowmelt runoff model (SRM) using satellite remote sensing data in Budhi Gandaki River Basin, Nepal. Remote Sens. 2020, 12, 1951. [Google Scholar] [CrossRef]
- Nie, Y.; Pritchard, H.D.; Liu, Q.; Hennig, T.; Wang, W.; Wang, X.; Liu, S.; Nepal, S.; Samyn, D.; Hewitt, K.; et al. Glacial change and hydrological implications in the Himalaya and Karakoram. Nat. Rev. Earth Environ. 2021, 2, 91–106. [Google Scholar] [CrossRef]
- Ren, J.; Qin, D.; Kang, S.; Hou, S.; Pu, J.; Jing, Z. Glacier variations and climate warming and drying in the central Himalayas. Chin. Sci. Bull. 2004, 49, 65–69. [Google Scholar] [CrossRef]
- Wang, Z.; Zhang, Y.; Yang, Y.; Zhou, W.; Gang, C.; Zhang, Y.; Li, J.; An, R.; Wang, K.; Odeh, I.; et al. Quantitative assess the driving forces on the grassland degradation in the Qinghai—Tibet Plateau, in China. Ecol. Inform. 2016, 33, 32–44. [Google Scholar] [CrossRef]
- Lehnert, L.W.; Meyer, H.; Meyer, N.; Reudenbach, C.; Bendix, J.O.R. A hyperspectral indicator system for rangeland degradation on the Tibetan Plateau: A case study towards spaceborne monitoring. Ecol. Indic. 2014, 39, 54–64. [Google Scholar] [CrossRef]
- Zhang, Z.; Duan, J.; Wang, S.; Luo, C.; Chang, X.; Zhu, X.; Xu, B.; Wang, W. Effects of land use and management on ecosystem respiration in alpine meadow on the Tibetan plateau. Soil Tillage Res. 2012, 124, 161–169. [Google Scholar] [CrossRef]
- Paudel, K.P.; Andersen, P. Assessing rangeland degradation using multi temporal satellite images and grazing pressure surface model in Upper Mustang, Trans Himalaya, Nepal. Remote Sens. Environ. 2010, 114, 1845–1855. [Google Scholar] [CrossRef]
- Rimal, B.; Baral, H.; Stork, N.E.; Paudyal, K.; Rijal, S. Growing city and rapid land use transition: Assessing multiple hazards and risks in the Pokhara Valley, Nepal. Land 2015, 4, 957. [Google Scholar] [CrossRef] [Green Version]
- Li, S.; Zhang, Y.; Wang, Z.; Li, L. Mapping human influence intensity in the Tibetan Plateau for conservation of ecological service functions. Ecosyst. Serv. 2018, 30, 276–286. [Google Scholar] [CrossRef]
- Zhang, F.; Yushanjiang, A.; Wang, D. Ecological risk assessment due to land use/cover changes (LUCC) in Jinghe County, Xinjiang, China from 1990 to 2014 based on landscape patterns and spatial statistics. Environ. Earth Sci. 2018, 77, 491. [Google Scholar] [CrossRef]
- Panta, M.; Kim, K.; Joshi, C. Temporal mapping of deforestation and forest degradation in Nepal: Applications to forest conservation. Forest Ecol. Manag. 2008, 256, 1587–1595. [Google Scholar] [CrossRef]
- Acharya, K.P.; Dangi, R.B.; Acharya, M. Understanding forest degradation in Nepal. Unasylva 2011, 62, 238. [Google Scholar]
- Thapa, U.K.; George, S.S. Detecting the influence of climate and humans on pine forests across the dry valleys of eastern Nepal’s Koshi River basin. Forest Ecol. Manag. 2019, 440, 12–22. [Google Scholar] [CrossRef]
- Sleeter, B.M.; Sohl, T.L.; Bouchard, M.A.; Reker, R.R.; Soulard, C.E.; Acevedo, W.; Griffith, G.E.; Sleeter, R.R.; Auch, R.F.; Sayler, K.L. Scenarios of land use and land cover change in the conterminous United States: Utilizing the special report on emission scenarios at ecoregional scales. Glob. Environ. Chang. 2012, 22, 896–914. [Google Scholar] [CrossRef] [Green Version]
- Murton, G. Making mountain places into state spaces: Infrastructure, consumption, and territorial practice in a Himalayan borderland. Ann. Am. Assoc. Geogr. 2017, 107, 536–545. [Google Scholar] [CrossRef]
- Cui, B.; Zhang, Y.; Liu, L.; Xu, Z.; Wang, Z.; Gu, C.; Wei, B.; Gong, D. Spatiotemporal variation in rainfall erosivity and correlation with the ENSO on the Tibetan Plateau since 1971. Int. J. Environ. Res. Public Health 2021, 18, 11054. [Google Scholar] [CrossRef] [PubMed]
- Auch, R.F.; Wellington, D.F.; Taylor, J.L.; Stehman, S.V.; Tollerud, H.J.; Brown, J.F.; Loveland, T.R.; Pengra, B.W.; Horton, J.A.; Zhu, Z.; et al. Conterminous United States Land-Cover Change (1985–2016): New Insights from Annual Time Series. Land 2022, 11, 298. [Google Scholar] [CrossRef]
- Olofsson, P.; Foody, G.M.; Herold, M.; Stehman, S.V.; Woodcock, C.E.; Wulder, M.A. Good practices for estimating area and assessing accuracy of land change. Remote Sens. Environ. 2014, 148, 42–57. [Google Scholar] [CrossRef]
- Pachauri, R.K.; Allen, M.R.; Barros, V.R.; Broome, J.; Cramer, W.; Christ, R.; Church, J.A.; Clarke, L.; Dahe, Q.; Dasgupta, P. Climate Change 2014: Synthesis Report. Contribution of Working Groups I, II and III to the Fifth Assessment Report of the Intergovernmental Panel on Climate Change; IPCC: Geneva, Switzerland, 2014; p. 151. [Google Scholar]
Publisher’s Note: MDPI stays neutral with regard to jurisdictional claims in published maps and institutional affiliations. |
© 2022 by the authors. Licensee MDPI, Basel, Switzerland. This article is an open access article distributed under the terms and conditions of the Creative Commons Attribution (CC BY) license (https://creativecommons.org/licenses/by/4.0/).