Article

Response of Land Use and Net Primary Productivity to Coal Mining: A Case Study of Huainan City and Its Mining Areas

1
Department of Urban and Regional Planning, College of Urban and Environmental Sciences, Peking University, Beijing 100871, China
2
School of Environment and Spatial Informatics, China University of Mining and Technology, Xuzhou 211116, China
*
Author to whom correspondence should be addressed.
Land 2022, 11(7), 973; https://doi.org/10.3390/land11070973
Submission received: 15 May 2022 / Revised: 18 June 2022 / Accepted: 22 June 2022 / Published: 26 June 2022

Abstract

:
The terrestrial ecosystem carbon cycle is essential to the global carbon cycle. Mining activities have seriously damaged the terrestrial ecosystem and destroyed the carbon sequestration ability of vegetation, which is of great significance to studying the effect of coal mining on land structure change and carbon sink function in cities and mining areas. However, the existing research lacks the targeted analysis of the carbon sink level of the mining area combined with the mining data. Based on the coal-mining information, land-use data, and MODIS NPP data, this study analyzed the spatio-temporal change characteristics of land use and NPP in Huainan City and its mining areas from 2001 to 2020. The results showed that: (1) 22.5% of the land types in the mining area have changed, much higher than 3.2% in Huainan; 40.08 km2 of the cropland in the mining area has been transformed into waterbodies, seriously affecting regional food security. (2) NPP fluctuates with rainfall, has a weak correlation with temperature, and is restricted by coal-mining factors. The average NPP of most coal mines is significantly lower than that of non-mining areas. The NPP of Huainan City showed an overall growth trend of 2.20 g/(m2 × a), which was much higher than the average value of 0.43 g/(m2 × a) in the mining area. Especially in the Guqiao mine, the difference in NPPslope before and after mining was as high as 16.92 g/(m2 × a). (3) The probability integral method was used to estimate that 195.16 km2 of land in Huainan would be damaged by mining in 2020. The distribution of damage degree was negatively correlated with NPPslope, which meant the more serious the damage was, the less NPPslope was. This study revealed the characteristics of land-use change and NPP spatio-temporal response in resource-based cities and mining-disturbed areas. It quantitatively estimated the impact of mining activities on regional carbon sink function. It can provide theory and data support for mining areas to carry out ecological protection and restoration, improve the environmental service function of resource-based cities, and formulate sustainable development strategies.

1. Introduction

The exploitation and utilization of coal resources promote the rapid development of the national economy and inevitably degrade the ecological environment in mining areas [1,2]. In eastern China’s areas with high groundwater levels, coal mining has resulted in significant surface subsidence and the formation of seasonal or permanent water accumulation, resulting in drastic changes in the original land-use structure. The succession of terrestrial ecosystems has a profound impact on carbon sequestration, and other ecological functions directly affect the daily production and life of the people in the region and the sustainable development of society [3,4,5]. Dozens of cities with coal resources (cities where coal mining and processing are the leading industries) are located in eastern China, where development and protection have always been the eternal contradiction around the development and utilization of resources. The ecological environment in these cities worsens with coal mining [6]. The Chinese government released the implementation plan of the 14th Five-Year Plan for promoting high-quality development in resource-based areas in 2021, which set higher requirements for the transformation of resource-based cities. In the same year, China put forward the goals of a carbon peak in 2030 and carbon neutrality in 2060. It is urgent to protect the ecology of coal-resource-based cities and their mining areas, reduce carbon emissions, and increase carbon sinks. Revealing the change characteristics of the land structure and the succession process and influencing factors of carbon sink function under coal mining is of great significance in formulating ecological-restoration measures in mining areas and realizing the dual-carbon target [7,8].
Net primary productivity (NPP) refers to the total amount of dry organic matter accumulated in a unit of time and area, and is the basis of the study of matter and energy movement in an ecosystem [9,10]. This indicator can accurately reflect the health status of the ecosystem, and is an important indicator to measure the function of the ecosystem. It is widely used to monitor the carbon cycle in different regions [11,12]. NPP is closely related to the biological characteristics of the vegetation itself and regional environmental factors such as precipitation and temperature [13]. Land-use and land-cover change (LUCC) is the most direct manifestation of the interaction between coal mining and the natural environment [14]. The ecosystem’s type, structure, and function will change with the LUCC, affecting the mining area’s carbon-sequestration capacity [15,16]. Therefore, the study of how the temporal and spatial responses of land-use structures and NPP are driven by coal mining helps to reveal the processes of coal mining that affect the ecosystem, and is of great significance to balancing the relationship between resource mining and the environment.
The mechanism between NPP and natural environmental factors has been one of the hot issues for domestic and foreign scholars. Many scholars have studied the temporal and spatial distributions of NPP and its influencing factors from no visual angle. Michael used the LPJ-DGVM model and global HANPP assessment data to estimate and analyze the loss of NPP caused by dryland degradation due to human activities [17]. Gray studied the effects of population density, species richness, and land use on the spatial distribution of NPP in Australia through a correlation analysis and spatial regression [18]. Peng [19] and Yang [20] respectively took Beijing and the Yangtze River Basin as their research object to analyze the impact of LUCC on NPP.
Some scholars have studied the NPP variation in mining areas. Xie [21] used the EOS/MODIS NPP data set to explore the trend of NPP in the Shendong mining area and conduct a correlation analysis of climate factors. The results showed that NPP in the mining area was lower than the national average, and precipitation was the main climatic factor affecting NPP change. Hou used the CASA model to calculate NPP, and found that the change rate of NPP in the ecological damage area affected by coal mining was the fastest, and the decrease in NPP was positively correlated with the production capacity of the coal mine [22]. The mining of high groundwater levels causes damage to the surface ecological environment that is challenging to repair. There is little analysis of NPP in coal-resource-based cities and their mining areas with high groundwater levels, and the change law of NPP disturbed by coal mining is unclear.
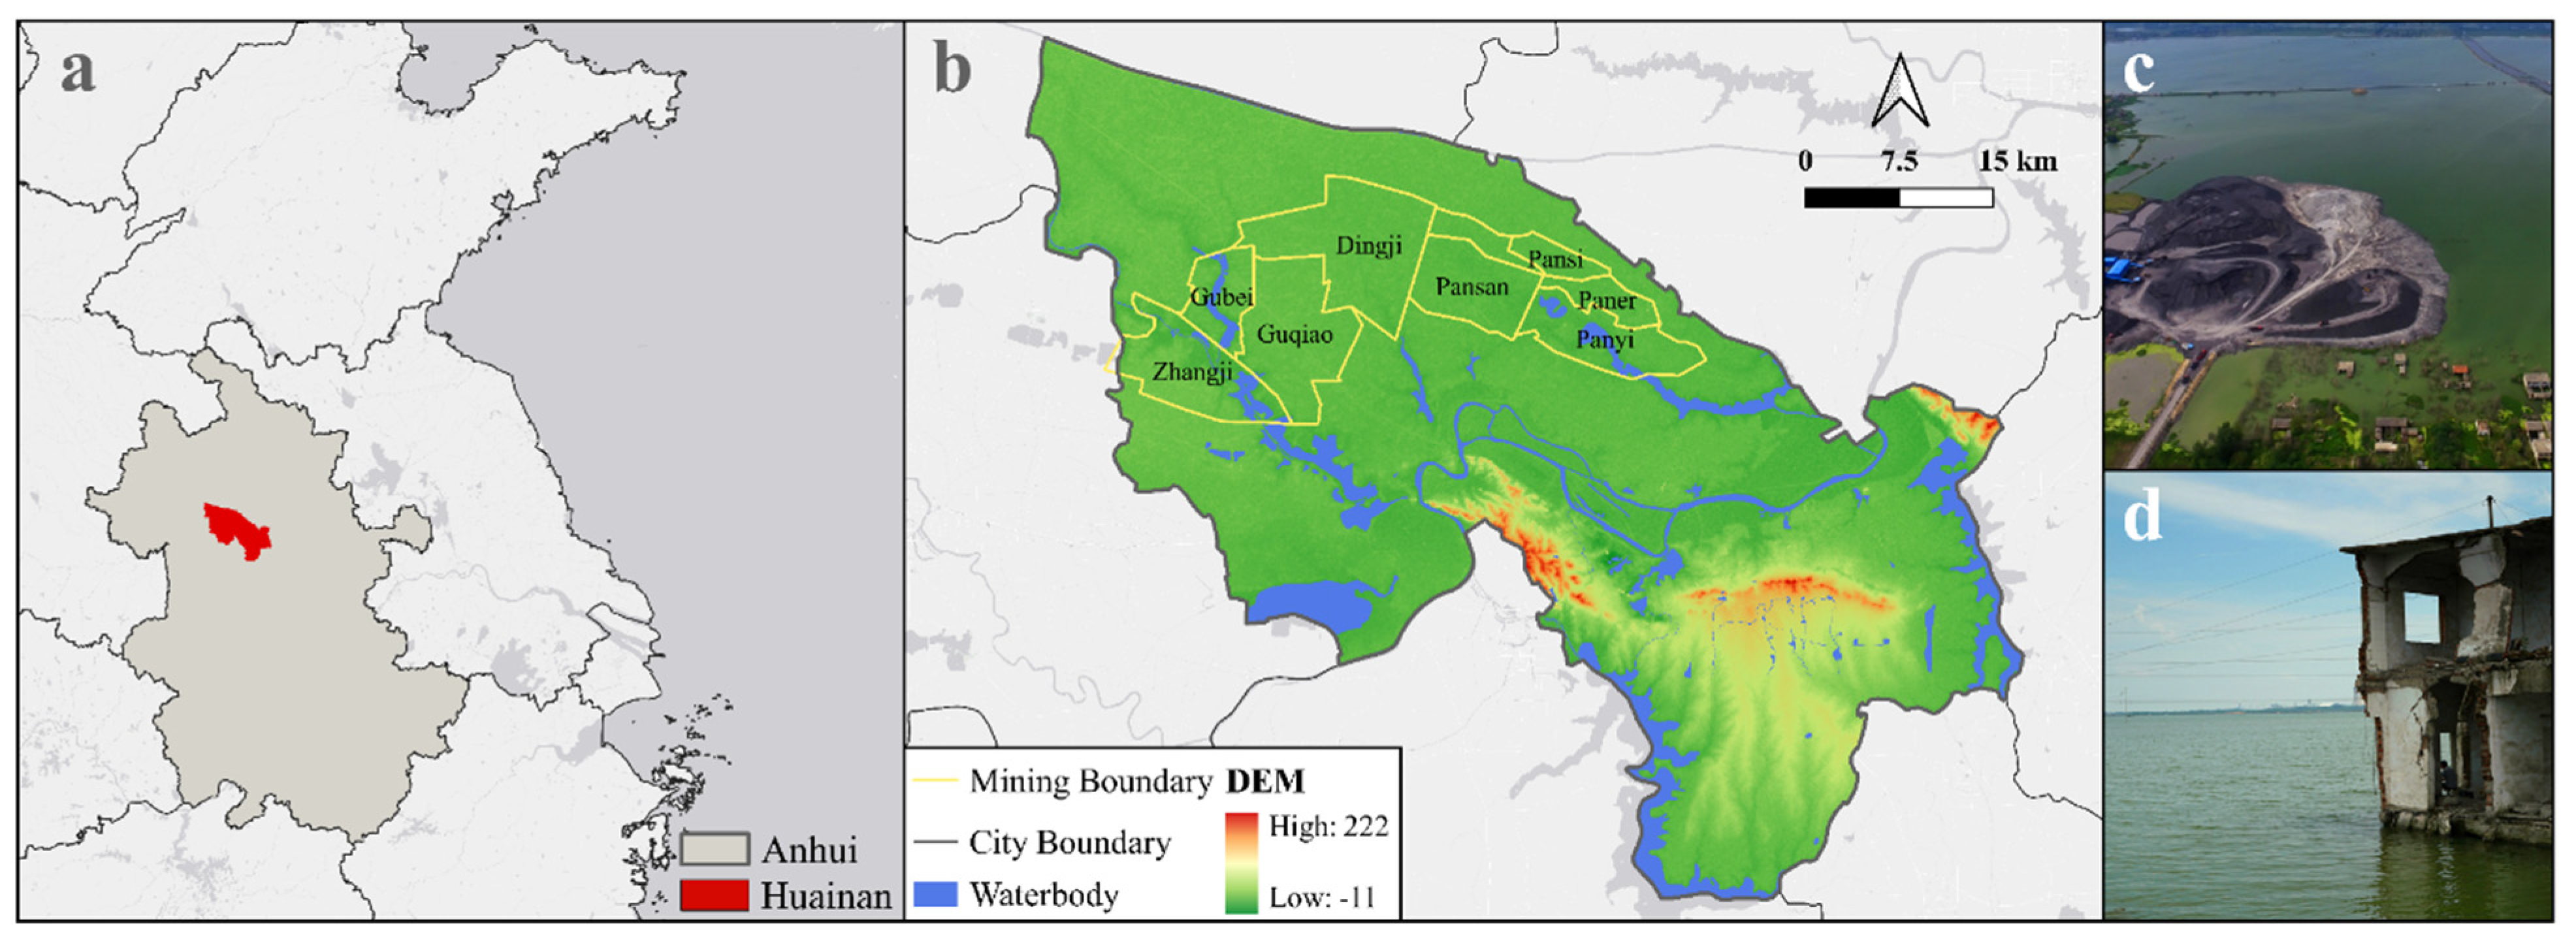
To quantitatively describe the impact of underground mining on land use and NPP at the surface, we proposed a set of accounting processes. Taking Huainan City and its eight mines as an example, this paper studied the changes and differences in land-use structures in urban areas and mining areas between 2001 and 2020, obtained the total amount and change trend of NPP in the past 20 years through a time-series-analysis method, and then determined the spatial relationship between the degree of surface collapse and NPP through a spatial correlation analysis based on the impact range of coal mining obtained using a probability integral method. This method enriched the calculation method of carbon sequestration function in the mining area, and the results obtained can provide valuable data for local ecological restoration and carbon neutrality strategies.

2. Materials and Methods

2.1. Study Area

Huainan (Figure 1) is located in the center of Anhui Province, with the geographical coordinates of 116°21′21′′ E~117°11′59′′ E, 32°32′45′′ N~33°0′24′′ N. Huainan is a typical coal-resource-based city with prospective coal reserves of 44.4 billion tons, and the groundwater level in its mining area there is high. Coal mining severely disturbed the land surface and destroyed the ecological environment. Huainan is also an essential grain-producing region in eastern China with villages and cropland inundated by water, seriously affecting regional food security. As shown in Figure 1c,d, the ecological problems caused by coal mining are shocking. It is necessary to carry out scientific data analysis to support the environmental restoration work under the dual-carbon-target constraints. Shou County was transferred to Huainan in 2016 and has not been disturbed by coal mining, so it was not included in this study.
In this study, the Zhangji, Gubei, Guqiao, Dingji, Panyi, Paner, Pansan, and Pansi mines in Huainan were selected as the mining areas for specific research. The basic information for each mine is shown in Table 1.

2.2. Data Sources

The MODIS NPP data (MOD17A3HGF) for the period of 2001–2020 were downloaded from the United States Geological Survey (https://lpdaac.usgs.gov/products/mod17a3hgfv006, accessed on 26 December 2021). In general, the accuracy of MODIS NPP estimates have been proven to be consistent with the NPP observed on-site [23]. The data set is in TIF format with a resolution of 500 m. We extracted Huainan’s NPP from the global map and excluded non-vegetation areas [24].
Globeland30, a 30-meter spatial resolution global land cover database, was used as the land-use/land-cover data (http://www.globallandcover.com, accessed on 26 December 2021) in this study. The Globeland30 data includes 10 primary types: cultivated land, forest, grassland, shrubland, wetland, waterbodies, tundra, artificial surface, bare land, and perennial snow and ice [25]. The original data of Globeland30 consists of four parts: the surface coverage data file, coordinate information file, classified image connection chart file, and metadata file. The overall accuracy of the data is 85.72%, and the kappa coefficient is 0.82, which met the needs of this study.
MODIS NPP and Globeland30 data are global-scale products. After projection and cutting, the data of the Huainan region were obtained.
The climate data came from the Anhui statistical yearbook and the China National Meteorological Science Data Center (http://data.cma.cn, accessed on 26 December 2021), including the average annual precipitation and temperature from 2001 to 2019.
Coal-mining data were provided by Huainan Mining Group Limited and relevant government departments in Huainan.

2.3. Method

2.3.1. Analysis of Land Use

The land-use change matrix can reflect the dynamic process information of the conversion between the area types at the beginning and the end of a specific period. The general form of the land-use change matrix is shown in Table 2 [26].
In Table 2, An represents different land use types. Snn represents the area of LUCC. For example S12 represents the area converted from land type 1 to land type 2.

2.3.2. Delineation of Coal-Mining Impact Areas

Coal mining is one of the main driving factors for the evolution of land-use structures in mining areas [27]. To effectively define the disturbance of coal mining in the terrestrial ecosystem in Huainan City, specific methods needed to be adopted to estimate the size, type, and spatial distribution of the land damage. When the coal seam dip angle is less than 45°, the probability integral method is the most suitable method [28,29]. The dip angle of the coal seam in the Huainan mining area is generally less than 25°; therefore, this paper used the probability integral method to predict the mining-influence area of the mining area.
The probability integral method is the more mature method in mining subsidence, and its probability density function integral equation is expressed as follows:
W e ( x ) = 1 r 2 e x p ( π x 2 r 2 )
where W e ( x )   is the unit point subsidence value; r is the primary influence radius, mainly related to the unit mining depth and the primary influence angle; and x is the horizontal coordinate value of any point on the surface. As seen in the above expressions, the function form of the surface’s subsidence basin produced by the surface is the same as that of the normal distribution probability density function when the unit is mined.
According to the regulation regarding coal pillar setting and coal mining in buildings, waterbodies, railways, and main roadways, MSPS software was used to simulate the subsidence. A collapse subsidence value of −10 mm was taken as the boundary of the influence range of the collapse area; 0~0.5 m was considered mild damage, 0.5–1.5 m was considered moderate damage, and more than 1.5 m was considered severe damage.

2.3.3. NPP Analysis

The trend of change in NPP at the cell level was analyzed and predicted using one-way linear regression analysis, and the formula used is as follows:
N P P s l o p e = n × i = 1 n i × N P P i i = 1 n i × i = 1 n N P P i n × i = 1 n i 2 ( i = 1 n i ) 2
where n is the number of years, N P P i is the NPP for year i, and N P P s l o p e   is the slope for NPP at the individual cell.

2.3.4. Correlation Analysis

The Pearson correlation coefficient is used to measure the linear correlation between two variables. If r = 0, there is no linear correlation between x and y. The closer r is to 1 or −1, the stronger the correlation is. The closer r is to 0, the weaker the correlation is. The formula is as follows:
r = N x i y i x i y i N x i 2 ( x i ) 2 N y i 2 ( y i ) 2
Spatial autocorrelation analysis is used to measure whether the distribution of spatial variables is aggregated, including global spatial autocorrelation and local spatial autocorrelation. To reveal the spatial correlation among variables, Anselin proposed a bivariate spatial autocorrelation method that can calculate the correlation between spatial unit attribute values and other attribute values in adjacent space [30]. Geoda software was used to analyze spatial autocorrelation. The global spatial autocorrelation can reflect the similarity between the research area’s regional and neighboring regional units. Global Moran’s I is a widely used global autocorrelation statistic whose formula is:
I = i = 1 n   j = 1 n   w i j ( x i x ¯ ) ( x j x ¯ ) S 2 ( i   j   w i j )
Local Moran’s I statistics are often used to measure local indicators of spatial association (LISA) to capture local spatial elements’ aggregation and differentiation characteristics accurately. The formula is as follows:
I i = ( x i x ¯ ) j = 1 n   w i j ( x i x ¯ ) S 2
S 2 = 1 n i = 1 n ( x i x ¯ )
where n is the number of spatial units; x i and x j are the observed values of units i and j, respectively; ( x i x ¯ ) is the deviation between the observed value and the average value on the ith space unit; and w i j is the spatial weight matrix based on the spatial k adjacency relation.

3. Results

3.1. Temporal and Spatial Changes in Land-Use Structure

There are six main types of land in Huainan according to the data of Globeland30: cropland, forestland, grassland, urban land, water bodies, and wetland. The LUCC of Huainan and its mining area from 2000 to 2020 was calculated using the land-use change matrix. Table 3 is the Huainan land use change matrix, and Table 4 is the change matrix of land use in the mining area. Because the size of the forest land in the mining area was less than 0.1 km2, it was not considered in the land-use change analysis. Table 5 shows changes in land-use structures in Huainan and mining areas. The change in land types from 2000 to 2020 is shown in Figure 2.
The total area of LUCC in Huainan from 2000 to 2020 was 497.51 km2, accounting for 19.3% of the total area of Huainan. The area of cropland type that changed to other land types was the largest, reaching 308.5 km2. The area of farmland type that changed to the urban land type was 199.98 km2, accounting for 64.8% of the farmland type changing to other land types, which showed that extensive cropland had been occupied as urban land in the past 20 years. The rapid development of urbanization has caused a reduction in cropland areas.
In Table 4 and Table 5, it can be found that the total area of LUCC from 2000 to 2020 was 101.44 km2, accounting for 22.5% of the total area, which was more than 3.2% of the LUCC in Huainan. This indicated that the change in land-use structures caused by mining was more evident than that caused by urbanization and other human activities. At the same time, the area of cropland conversion to waterbodies in the mining area was 40.08 km2, accounting for 40% of the total area of change. This showed that the land-type change caused by mining differed from the land-type change of urbanization in Huainan. The main effect of mining was land-surface subsidence, which led to the formation of standing water, resulting in the conversion of large amounts of cropland into waterbodies.
Figure 2 shows the spatial distribution of LUCC from 2000 to 2020. It can be seen that the areas converted to waterbodies were mainly distributed within mining areas. The areas converted to urban land types were primarily in the central and southern regions of Huainan. This showed that coal mining was one of the main factors driving the change in land-use types.

3.2. Temporal and Spatial Variation of NPP

3.2.1. Analyze the Impact of Climate on NPP

We found that the total NPP, temperature, and precipitation (Figure 3) in Huainan from 2001 to 2019 accorded with the normal distribution. Therefore, the Pearson correlation coefficient was used to analyze the correlation between the total amount of NPP and climate factors, as shown in Table 6 (since the climate data for 2020 was not available, it was not considered). NPP in the Huainan was strongly correlated with precipitation and weakly correlated with temperature. The precipitation fluctuated obviously from 2001 to 2019, and the NPP fluctuated violently.
Chen [31] used the remote sensing process coupling model based on remote sensing of ecological-process coupling to simulate and calculate the NPP data of vegetation in the Huainan mining area from 2000 to 2012. It was found that there was a weak positive correlation between the annual NPP and annual average temperature, with a correlation coefficient of 0.125, and a high correlation with annual precipitation, with a correlation coefficient of 0.522. Wang [32] used the CASA model and remote-sensing data to study the change and spatial–temporal distribution pattern of NPP in the North China mountain area from 2000 to 2018. It was found that precipitation was the main driving factor of regional NPP by using a multivariate correlation analysis. These studies were consistent with the conclusions of this paper.

3.2.2. Spatial Distribution of NPP

The annual average value and trend of NPP were obtained via spatial analysis, as shown in Figure 4. Huainan’s annual average NPP ranged from a minimum of 157.3 g/m2 to a maximum of 574.6 g/m2. The high-value areas were mainly distributed in the northern part of Huainan, and the low-value regions were distributed in the central part of Huainan. As can be seen in Figure 4b, the blue area was the area with an increasing trend of NPP from 2001 to 2020, with a maximum value of 16.14 g/(m2×a), which was mainly distributed in the central and southern areas of Huainan City. However, there were almost no such areas within the mining area. The red area had a downward trend in NPP from 2001 to 2020, with a maximum value of −25.36 g/(m2×a). The site with a severe reduction in NPP was mainly distributed in the north of Huainan City. The red area had apparent spatial agglomeration, especially in the mining area.

3.2.3. Analysis of the Average NPP of Each Coal Mine

We calculated the annual average NPP and NPP density of each mine and of Huainan, as shown in Figure 5. We found that the NPP density of other mining areas, except for the Dingji mine and Pansi mine, was lower than that of Huainan City (423.70 t/km2). NPP in the mining area was generally lower than in Huainan, indicating that the carbon sink function was significantly affected by coal mining. The ecological basis of the Dingji and Pansi mining areas was better, which resulted in a higher NPP density in the two mining areas than the overall NPP density in Huainan. In addition, land reclamation and ecological restoration may have been reasons for the higher NPP.

3.2.4. Trend Analysis of NPP in Coal Mines

We plotted the NPP density changes in coal mines and in Huainan from 2001 to 2020 and calculated the NPPslope(Figure 6). The NPPslope of the Guqiao mine and Zhangji mine was −0.62 g/(m2 × a) and −0.61 g/(m2 × a), respectively. The NPPslope of the other mines was positive, but the growth rate was much lower than that of Huainan. The Huainan NPP showed an overall increasing trend of 2.20 g(m2 × a), much higher than the average of 0.43 g/(m2 × a) in the mining area. The increasing trend of NPP in other regions except the mining area was much higher, reaching 2.63 g/(m2 × a), which was six times the growth rate of the mining area. The Nppslope gap was obvious under the same climatic conditions. It can be seen that coal mining was an important influencing factor for NPP, and the NPP growth trend in coal-mining areas was obviously lower than that in non-coal-mining areas.

3.2.5. Variation Trend of NPP in a Typical Coal Mine before and after Mining

We selected specific mining areas for a case study to further analyze NPP changes before and after coal mining. The Guqiao mine has been mined since 2007, and its output is the largest among the eight mines. Therefore, this mine was selected for detailed analysis. We divided it into two stages: (1) the pre-mining stage (2001–2006); and (2) the mining stage (2007–2020). We compared the NPP trend of the Guqiao mine with that of Huainan in two stages, as shown in Figure 7.
In the pre-mining stage, the NPPslope of the Guqiao mine was 13.07g/(m2 × a), which was higher than 10.72g/(m2 × a) in Huainan City. However, in the mining stage, the decreasing trend of NPP in the Guqiao mine was four times higher than that in Huainan City, proving that coal mining substantially impacted NPP. Coal mining damaged the surface ecological environment and had a noticeable negative effect on vegetation NPP.

3.3. Spatial Correlation Analysis between Mining Disturbance and NPP

Using the mining information of each coal mine, we estimated the area of different subsidence grades using MSPS software (Table 7). The results showed that 195.16 km2 of land was affected by mining in 2020. The extent of slight damage was the largest, accounting for 46.8% (91.43 km2). The spatial distribution of coal-mining subsidence is shown in Figure 8a.
Using Geoda software, we analyzed the spatial correlation between coal-mining subsidence and NPP in the study area using the Bivariate Moran Index and drew a LISA aggregation graph (Figure 8c). The areas with significant spatial autocorrelation were divided into four types: (1) High-High: the areas with profound mining influence and an increasing NPP; (2) Low-Low: The effect of mining was small, and NPP tended to decline; (3) Low-High: The mining influence was small, and NPP tended to increase; (4) High-Low: The mining influence was severe, and NPP tended to decrease.
The global spatial correlation index between the degree affected by coal mining and the changing trend of NPP in the study area was −0.511, showing a significant spatial negative correlation (p < 0.05). It can be seen in Figure 8c that most of the essential regions were High-Low and How-High types, especially in the Zhangji and Dingji mines, which had a large area of High-Low regions. The NPP of these mining areas was obviously affected by mining, and the carbon sink function was seriously damaged. It is urgent to carry out land reclamation and ecological restoration.

4. Discussion

4.1. Difference in LUCC between City and Mining Areas

The change in land-use structures driven by coal mining was obviously different from that of urban land-use structures, which was consistent with the research conclusions of Wang [33]. He pointed out that LUCC in mining areas was different from that in general areas, and high intensive mining of coal resources was one of the essential factors that affected the evolution of land use. Xiao [
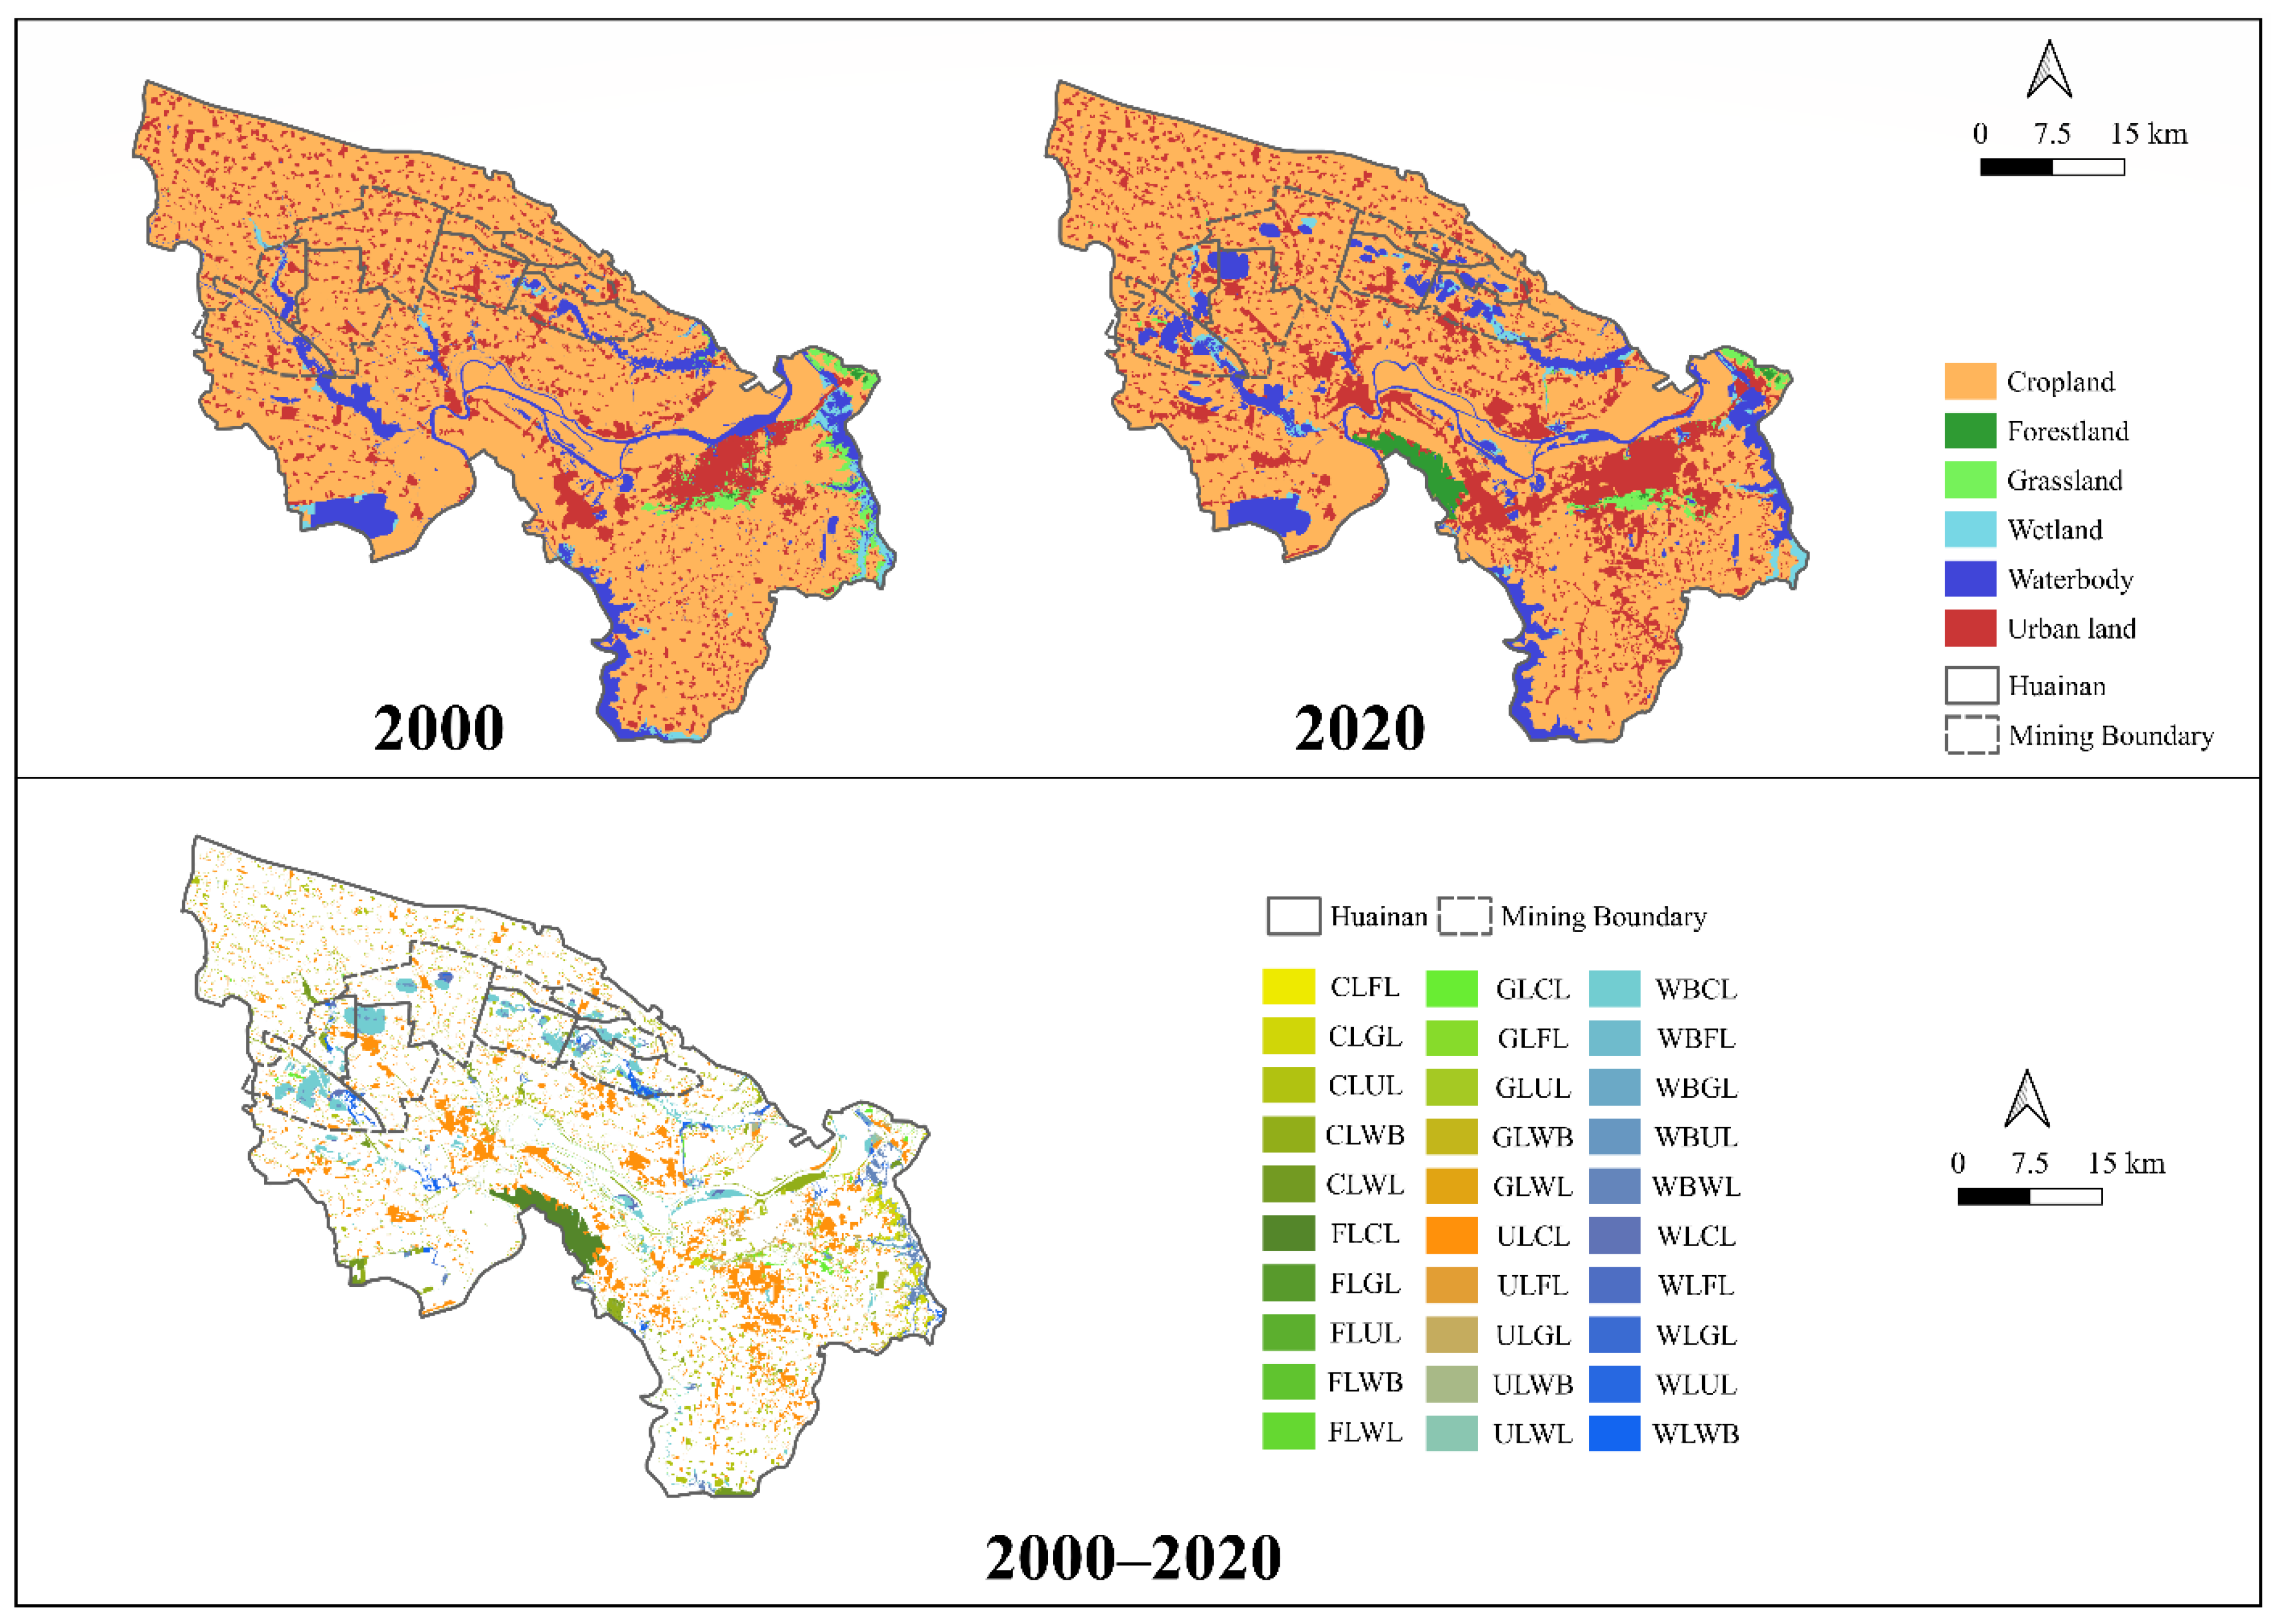
34] pointed out that underground mining activities in areas with high groundwater levels led to a drastic change in land use and tremendous pressure on the ecological environment. For urban land types other than mining areas, the determinants of land-use-structure change were complex, mainly in urbanization, and the change in land-use structure was characterized by a significant increase in urban land use. Our results also confirmed the existence of this problem. With coal mining, a large amount of cropland changed into waterbodies in the Huainan mine area. This conversion was significantly different from other areas outside the mine area. The mining activities in this area will continue for several decades, and more attention should be paid to protecting land resources in the mining area.

4.2. Many Factors Influenced the Change in NPP

Wu [35] found that climate change significantly affected NPP in the Yangtze River Delta agroforestry areas. The results of Gao [
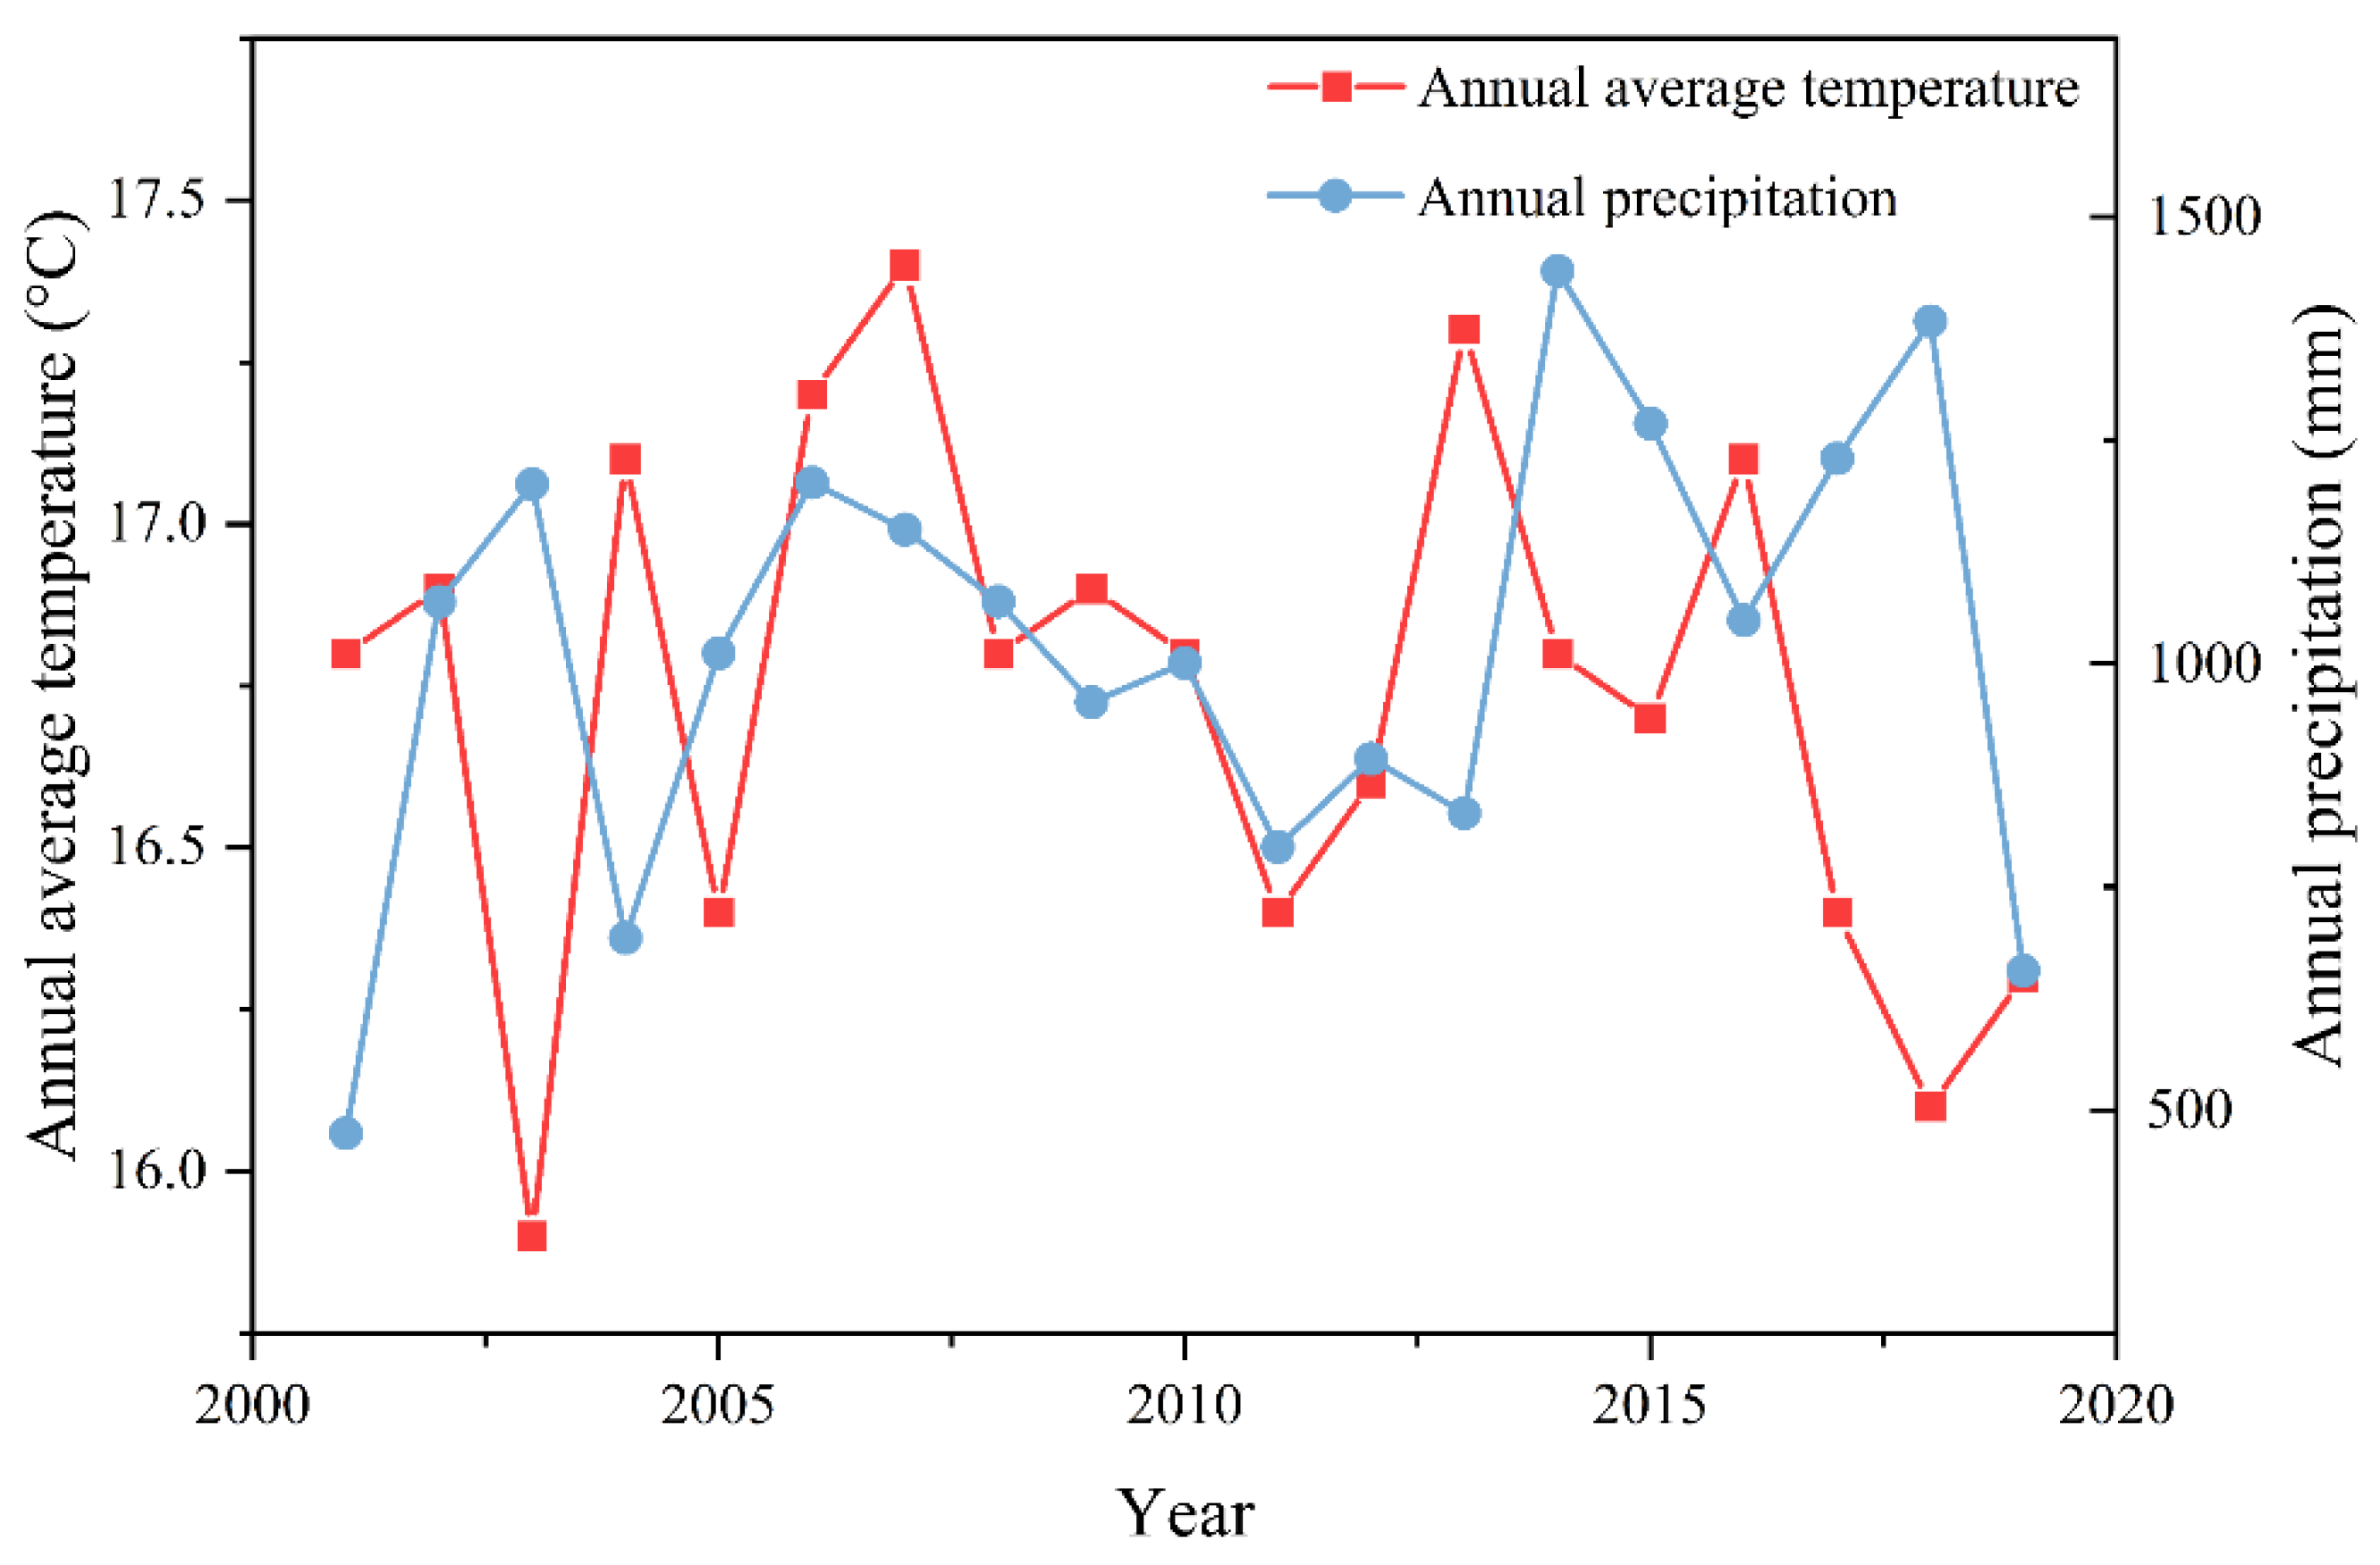
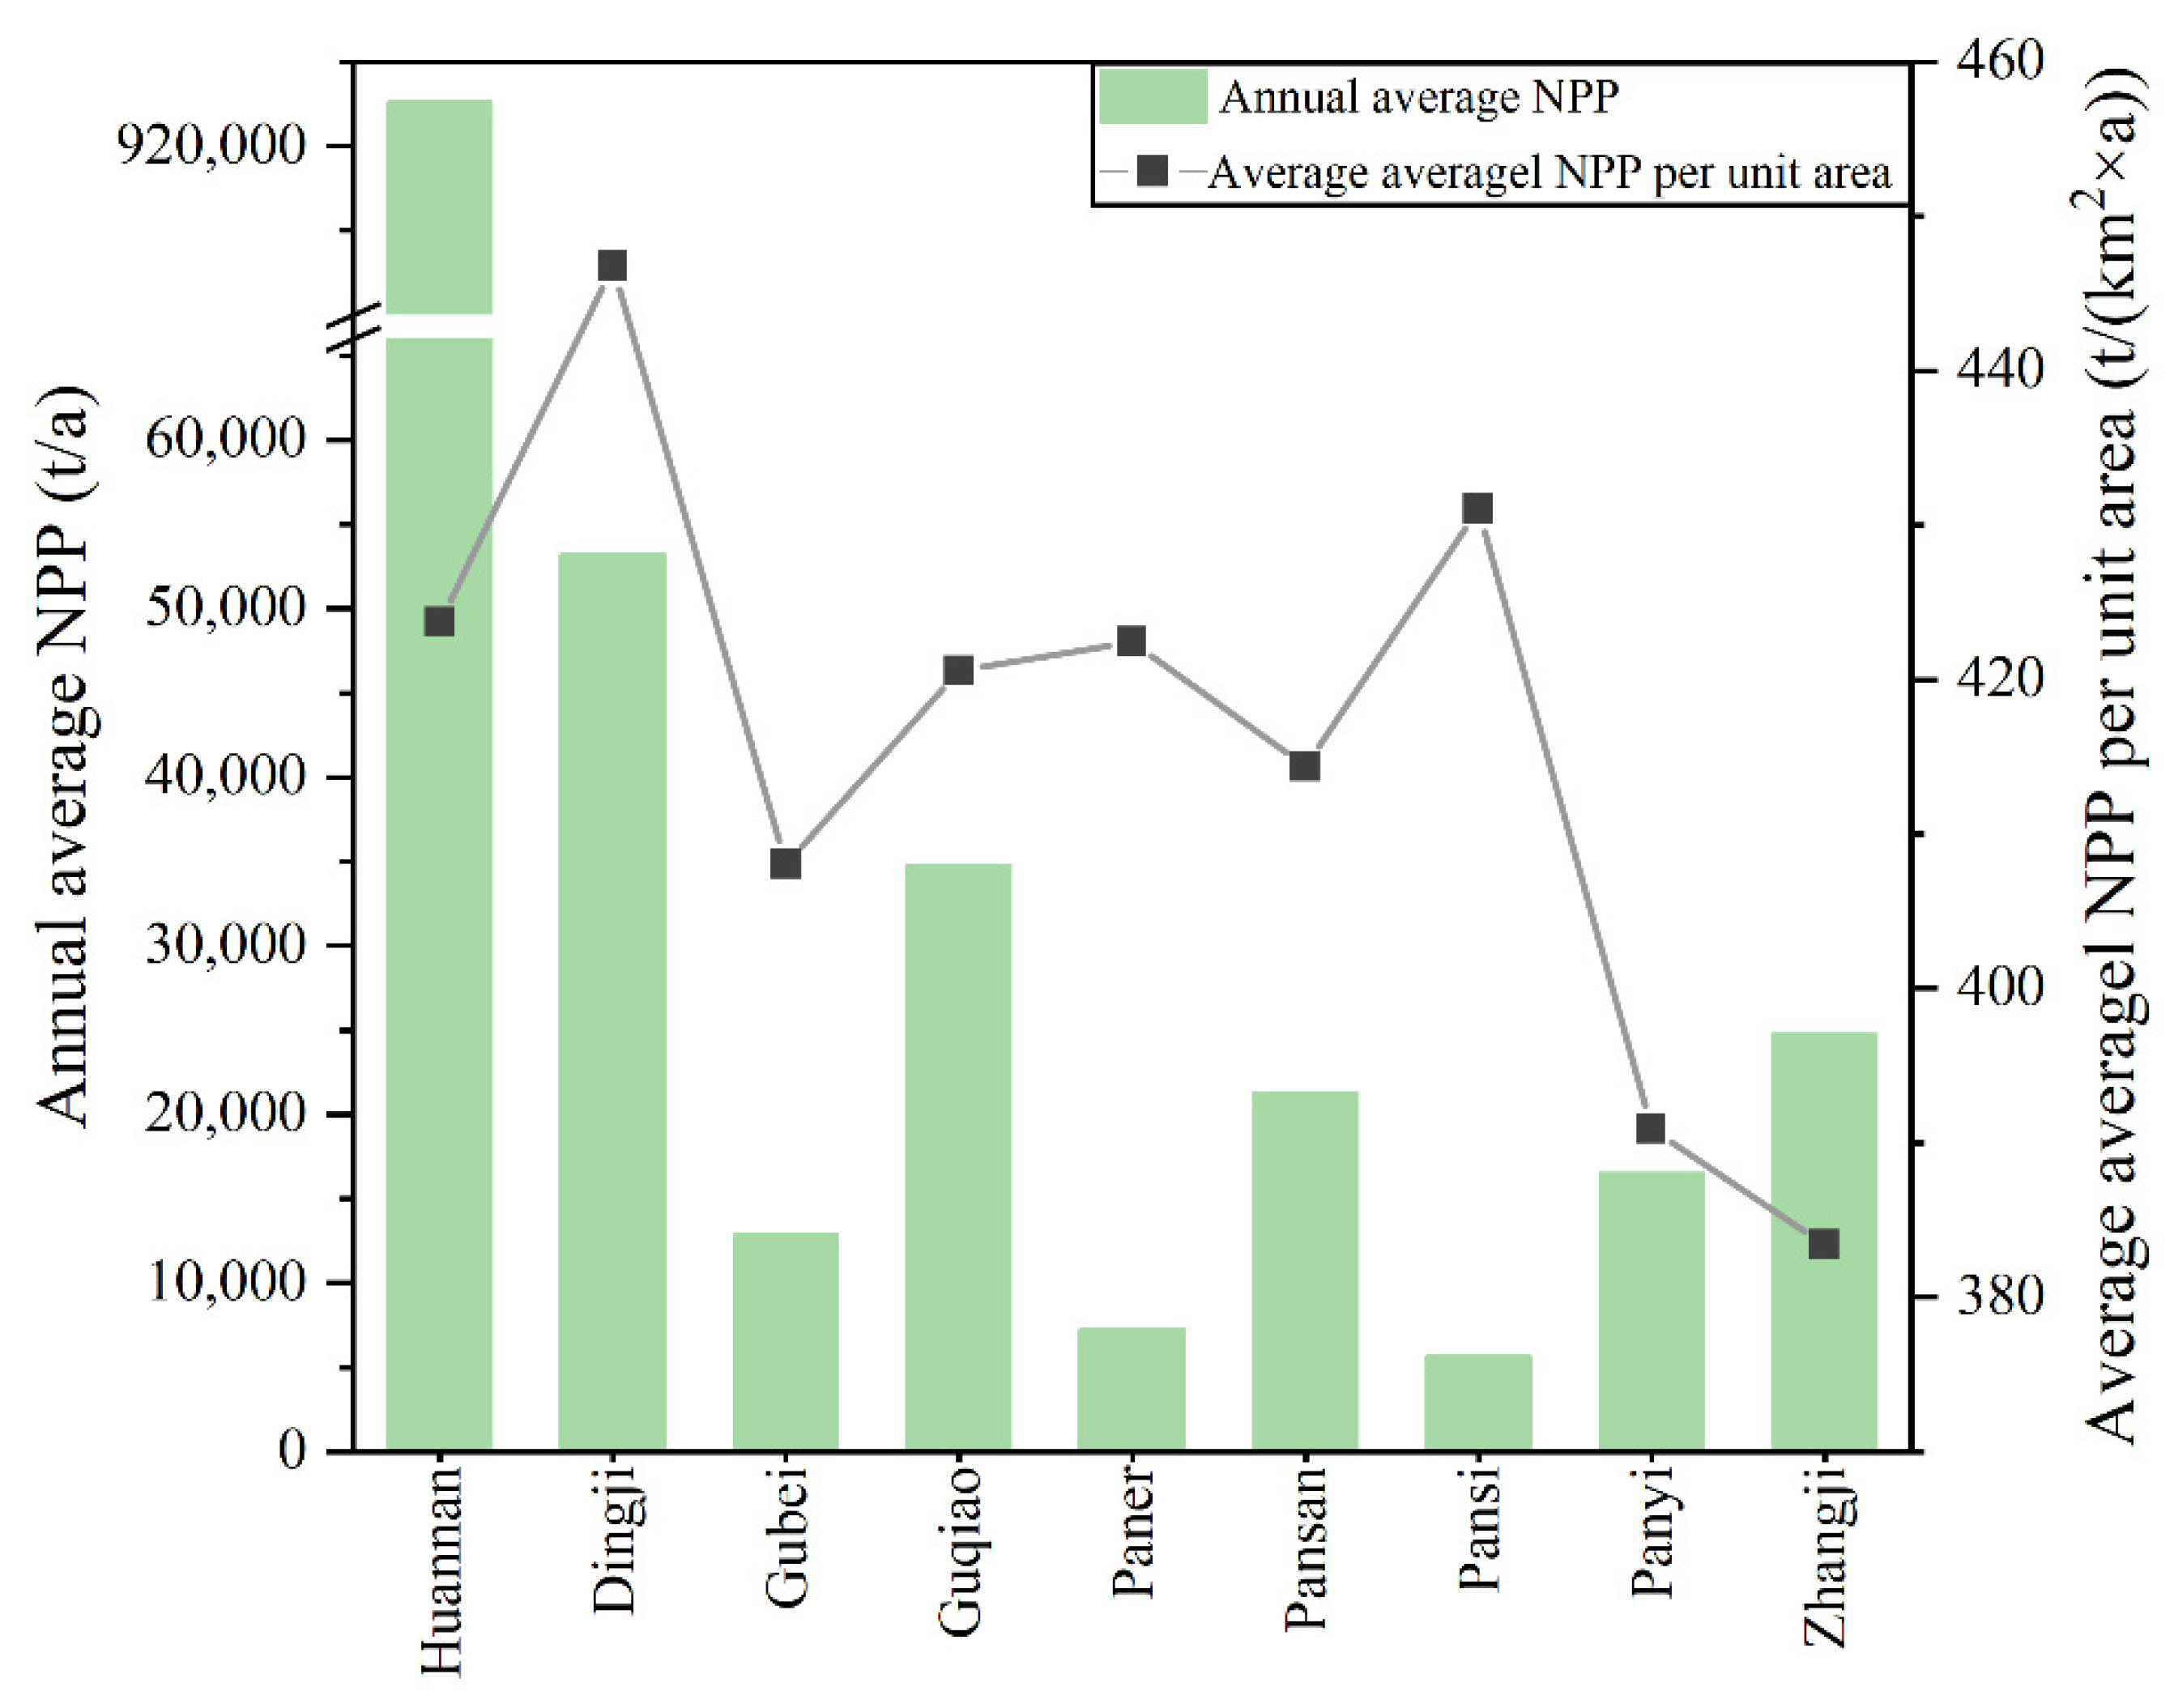
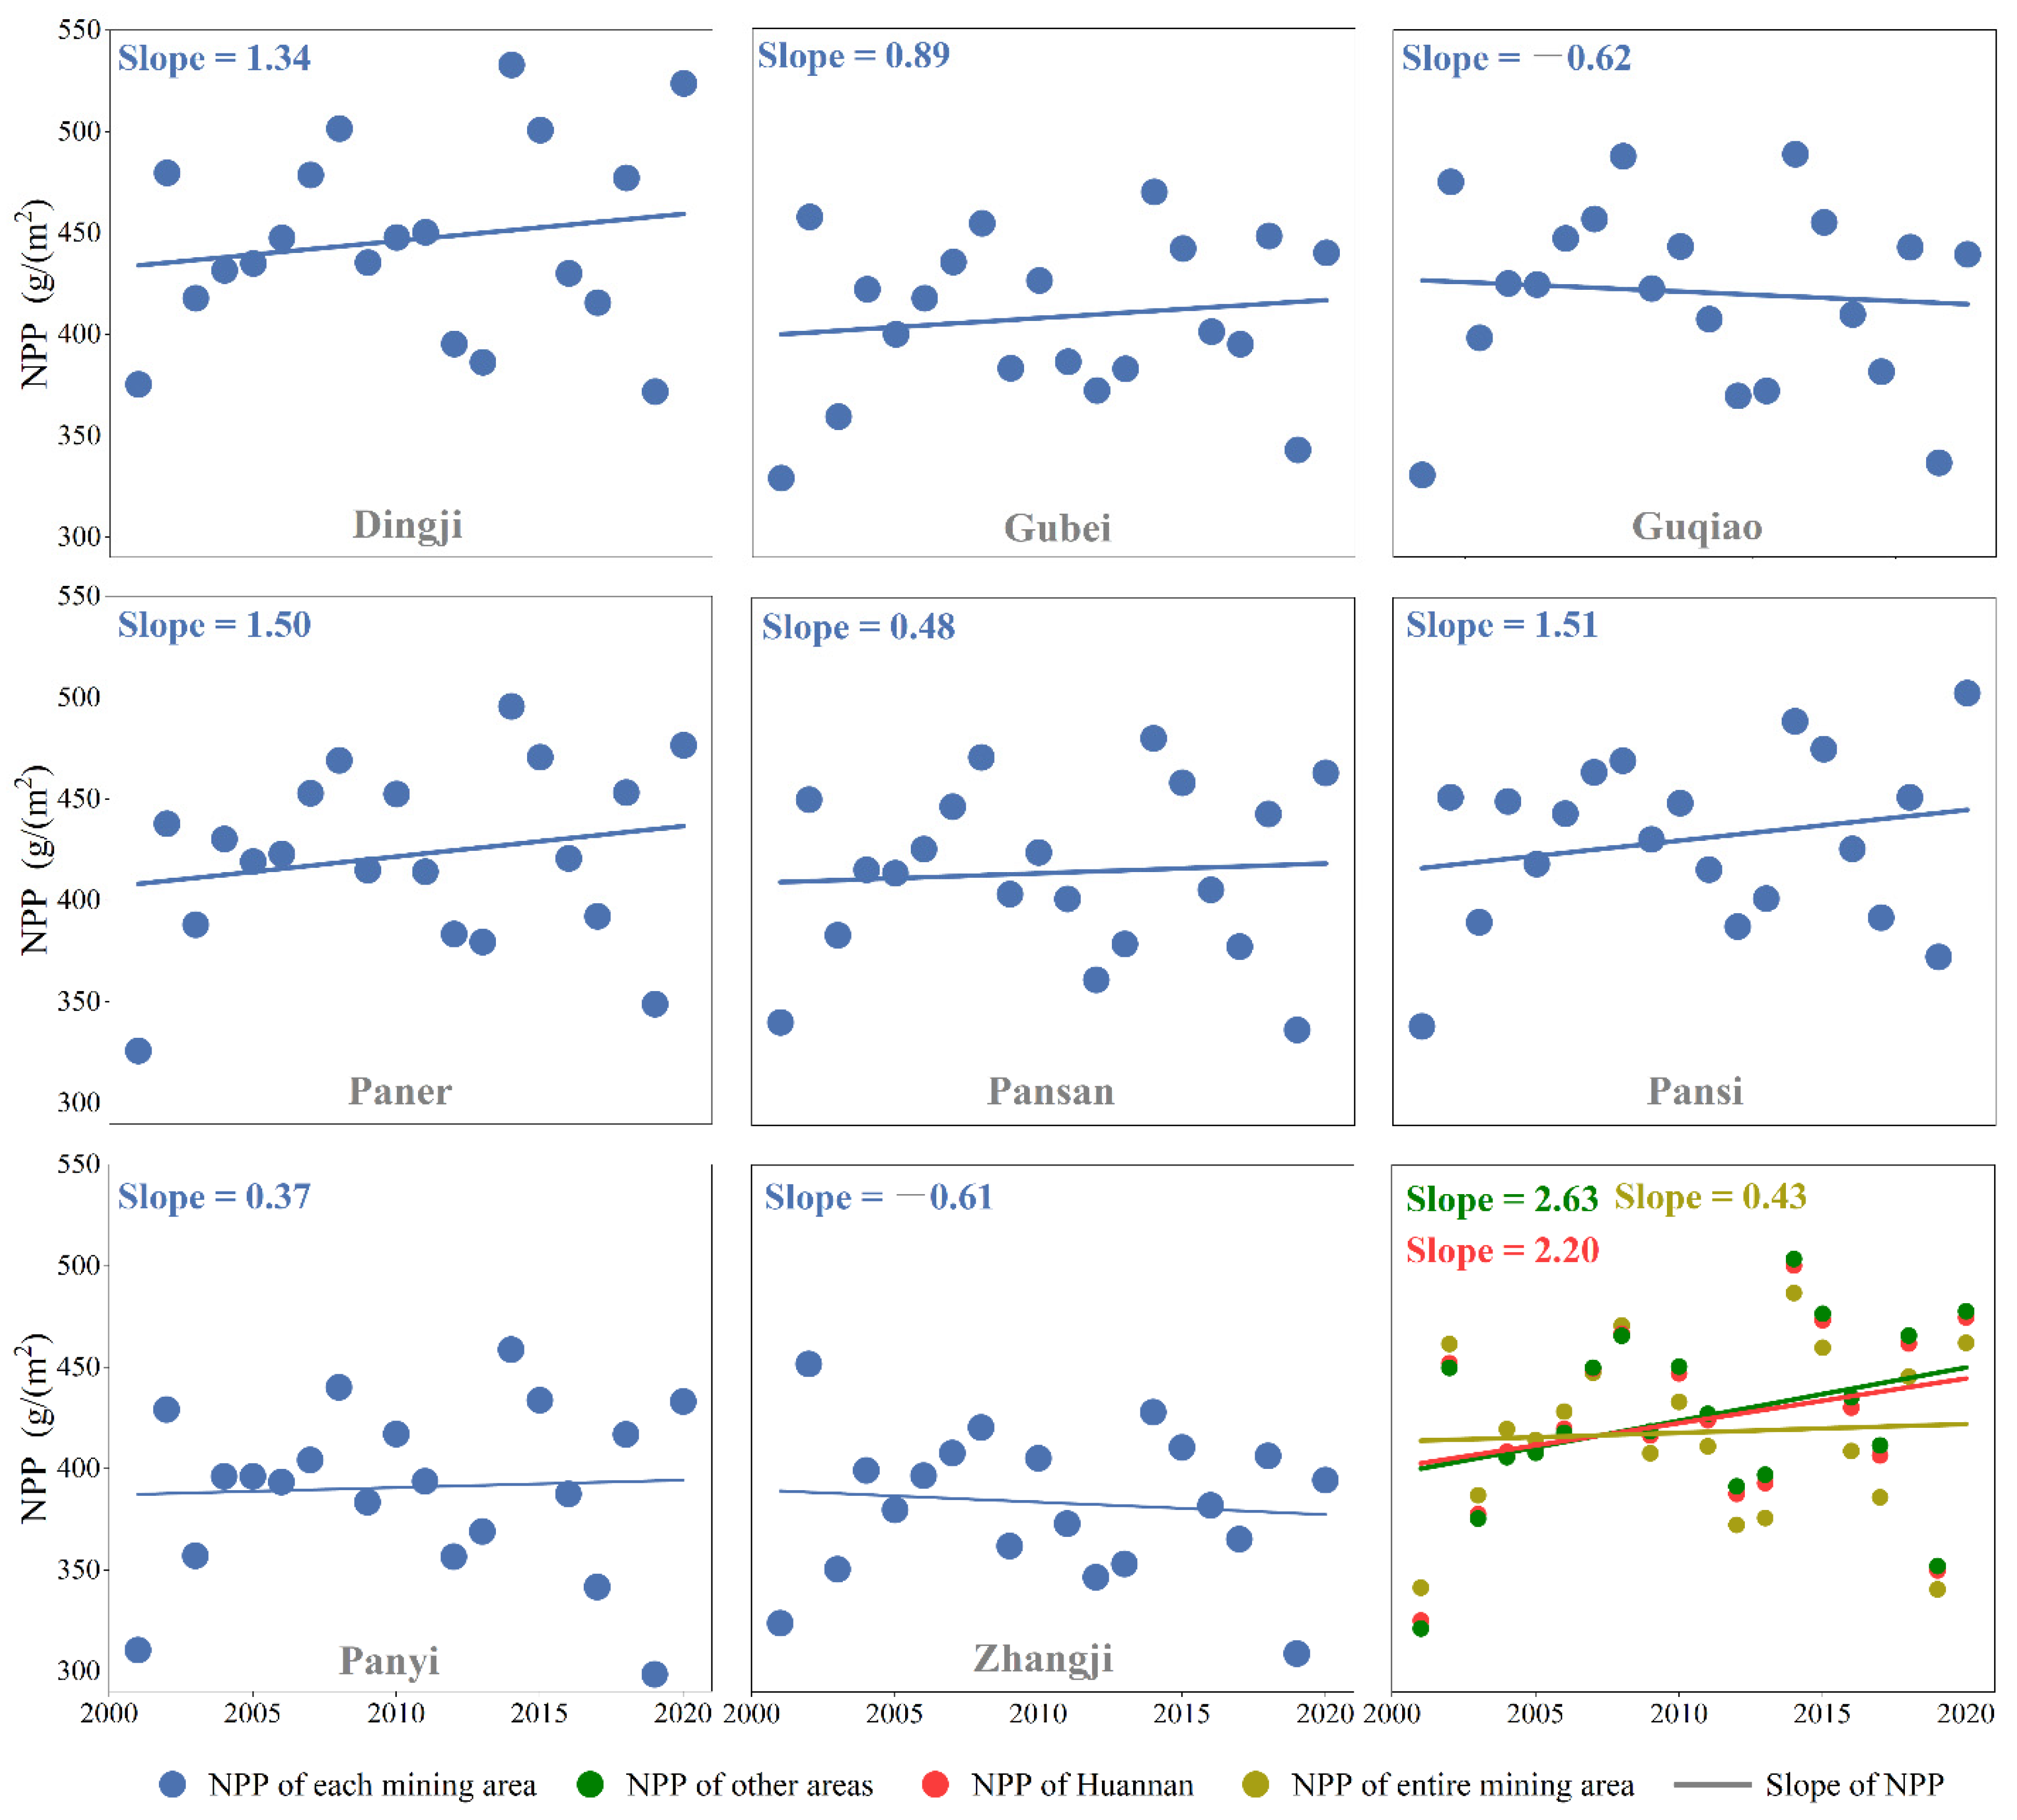
36] showed that NPP presented significant seasonal and interannual changes in the Tibetan Plateau. In this study, we found that the Huainan NPP was significantly affected by rainfall and had a weak correlation with air temperature. At the same time, coal mining was also an essential factor that affected NPP. Although the average annual NPP of each mining area fluctuated with climate change, the changing trend of NPP in the mining area was still significantly different from that in Huainan City. On the one hand, under the same natural conditions, the growth rate of NPP in mining areas was considerably less than in non-mining regions. On the other hand, the difference in the NPP change trend between pre-mining and mining in the same mining area was very significant. Through a bivariate spatial correlation analysis, we found that the more serious the damage caused by coal mining, the more pronounced the trend in NPP reduction, which was mainly due to the transformation of the terrestrial surface ecosystem to the aquatic ecosystem caused by coal mining. In the area seriously damaged by coal mining, the vegetation was extensively damaged, and the NPP changed under the influence of vegetation.

4.3. Suggestions for Local Development

Large-scale coal mining in resource-based cities has seriously affected the ecological environment of the cities, resulting in a lower NPP in mining areas than in other areas of the cities. In China’s promotion of the carbon-neutralization goal, it is essential to estimate the change of the carbon sink function in resource-based cities and mining areas. The accounting and analysis path of NPP change in cites with a high phreatic water level and mining areas proposed in this study can provide a fast and effective means for this work. Mining enterprises and management departments can calculate the carbon sink loss year by year in combination with the coal-mining progress to provide reference data for the next mining and ecological restoration work. Mining in high-groundwater-level mining areas will lead to dramatic changes to the surface. In addition to eastern China, such mining areas are also distributed in the United States, Myanmar, Vietnam, Malaysia, and the Czech Republic. The work of this paper is also applicable to these areas.
In the future, the management of Huainan should focus on the ecological environment of the mining area. Since the area is a high-water mining area, much of the arable land would have been lost to the water if ecological restoration had been carried out after mining had ended. Therefore, the mining process should be carried out simultaneously while seizing the best governance opportunity and initiating timely restoration of damaged ecological environments. To avoid the abandonment caused by land-subsidence water, the stability of NPP should be maintained before and after mining. In this way, the contradiction between exploitation and utilization of coal resources and environmental protection can be alleviated, and the mining activities can be developed in a green and sustainable direction.
While carrying out ecological construction, resource-based cities need to vigorously develop clean industries such as renewable energy and modern service industries, optimize the allocation of resources, and promote the greening of initiatives to reduce carbon emissions, thereby improving regional environmental quality. The government should increase investment in low-carbon technologies, reduce carbon emissions, encourage enterprises and the public to participate in environmental governance, and promote the early realization of China’s dual-carbon target.

4.4. Limitations

The land-use data selected in this study was Globeland30 data. Although it is widely used, and the overall accuracy is 85.72%, we did not verify the accuracy of this data set in Huainan City. In future research, we should further verify the accuracy of the land classification and the rationality of the land-type division. The reliability of the NPP data provided by UCGS needs to be further confirmed. Moran’s I is applicable to infer the spatial distribution relationship of the two factors. In order to more accurately explore the relationship between coal mining and the carbon sink function, it is necessary to conduct on-site sampling.

5. Conclusions

To make up for the deficiency of existing studies in the analysis of carbon sink changes in high-groundwater-level mining areas, we took Huainan and its mining areas as an example, analyzed the temporal and spatial characteristics of LUCC and the trend in NPP from 2001 to 2020, and reached the following conclusions:
(1)
Under coal mining, LUCC’s type was mainly the change from farmland to waterbodies and wetland, while the non-mining area was primarily changed from farmland to urban land. Between 2000 and 2020, 22.5% of the land in mining areas changed, compared with 3.2% in Huainan.
(2)
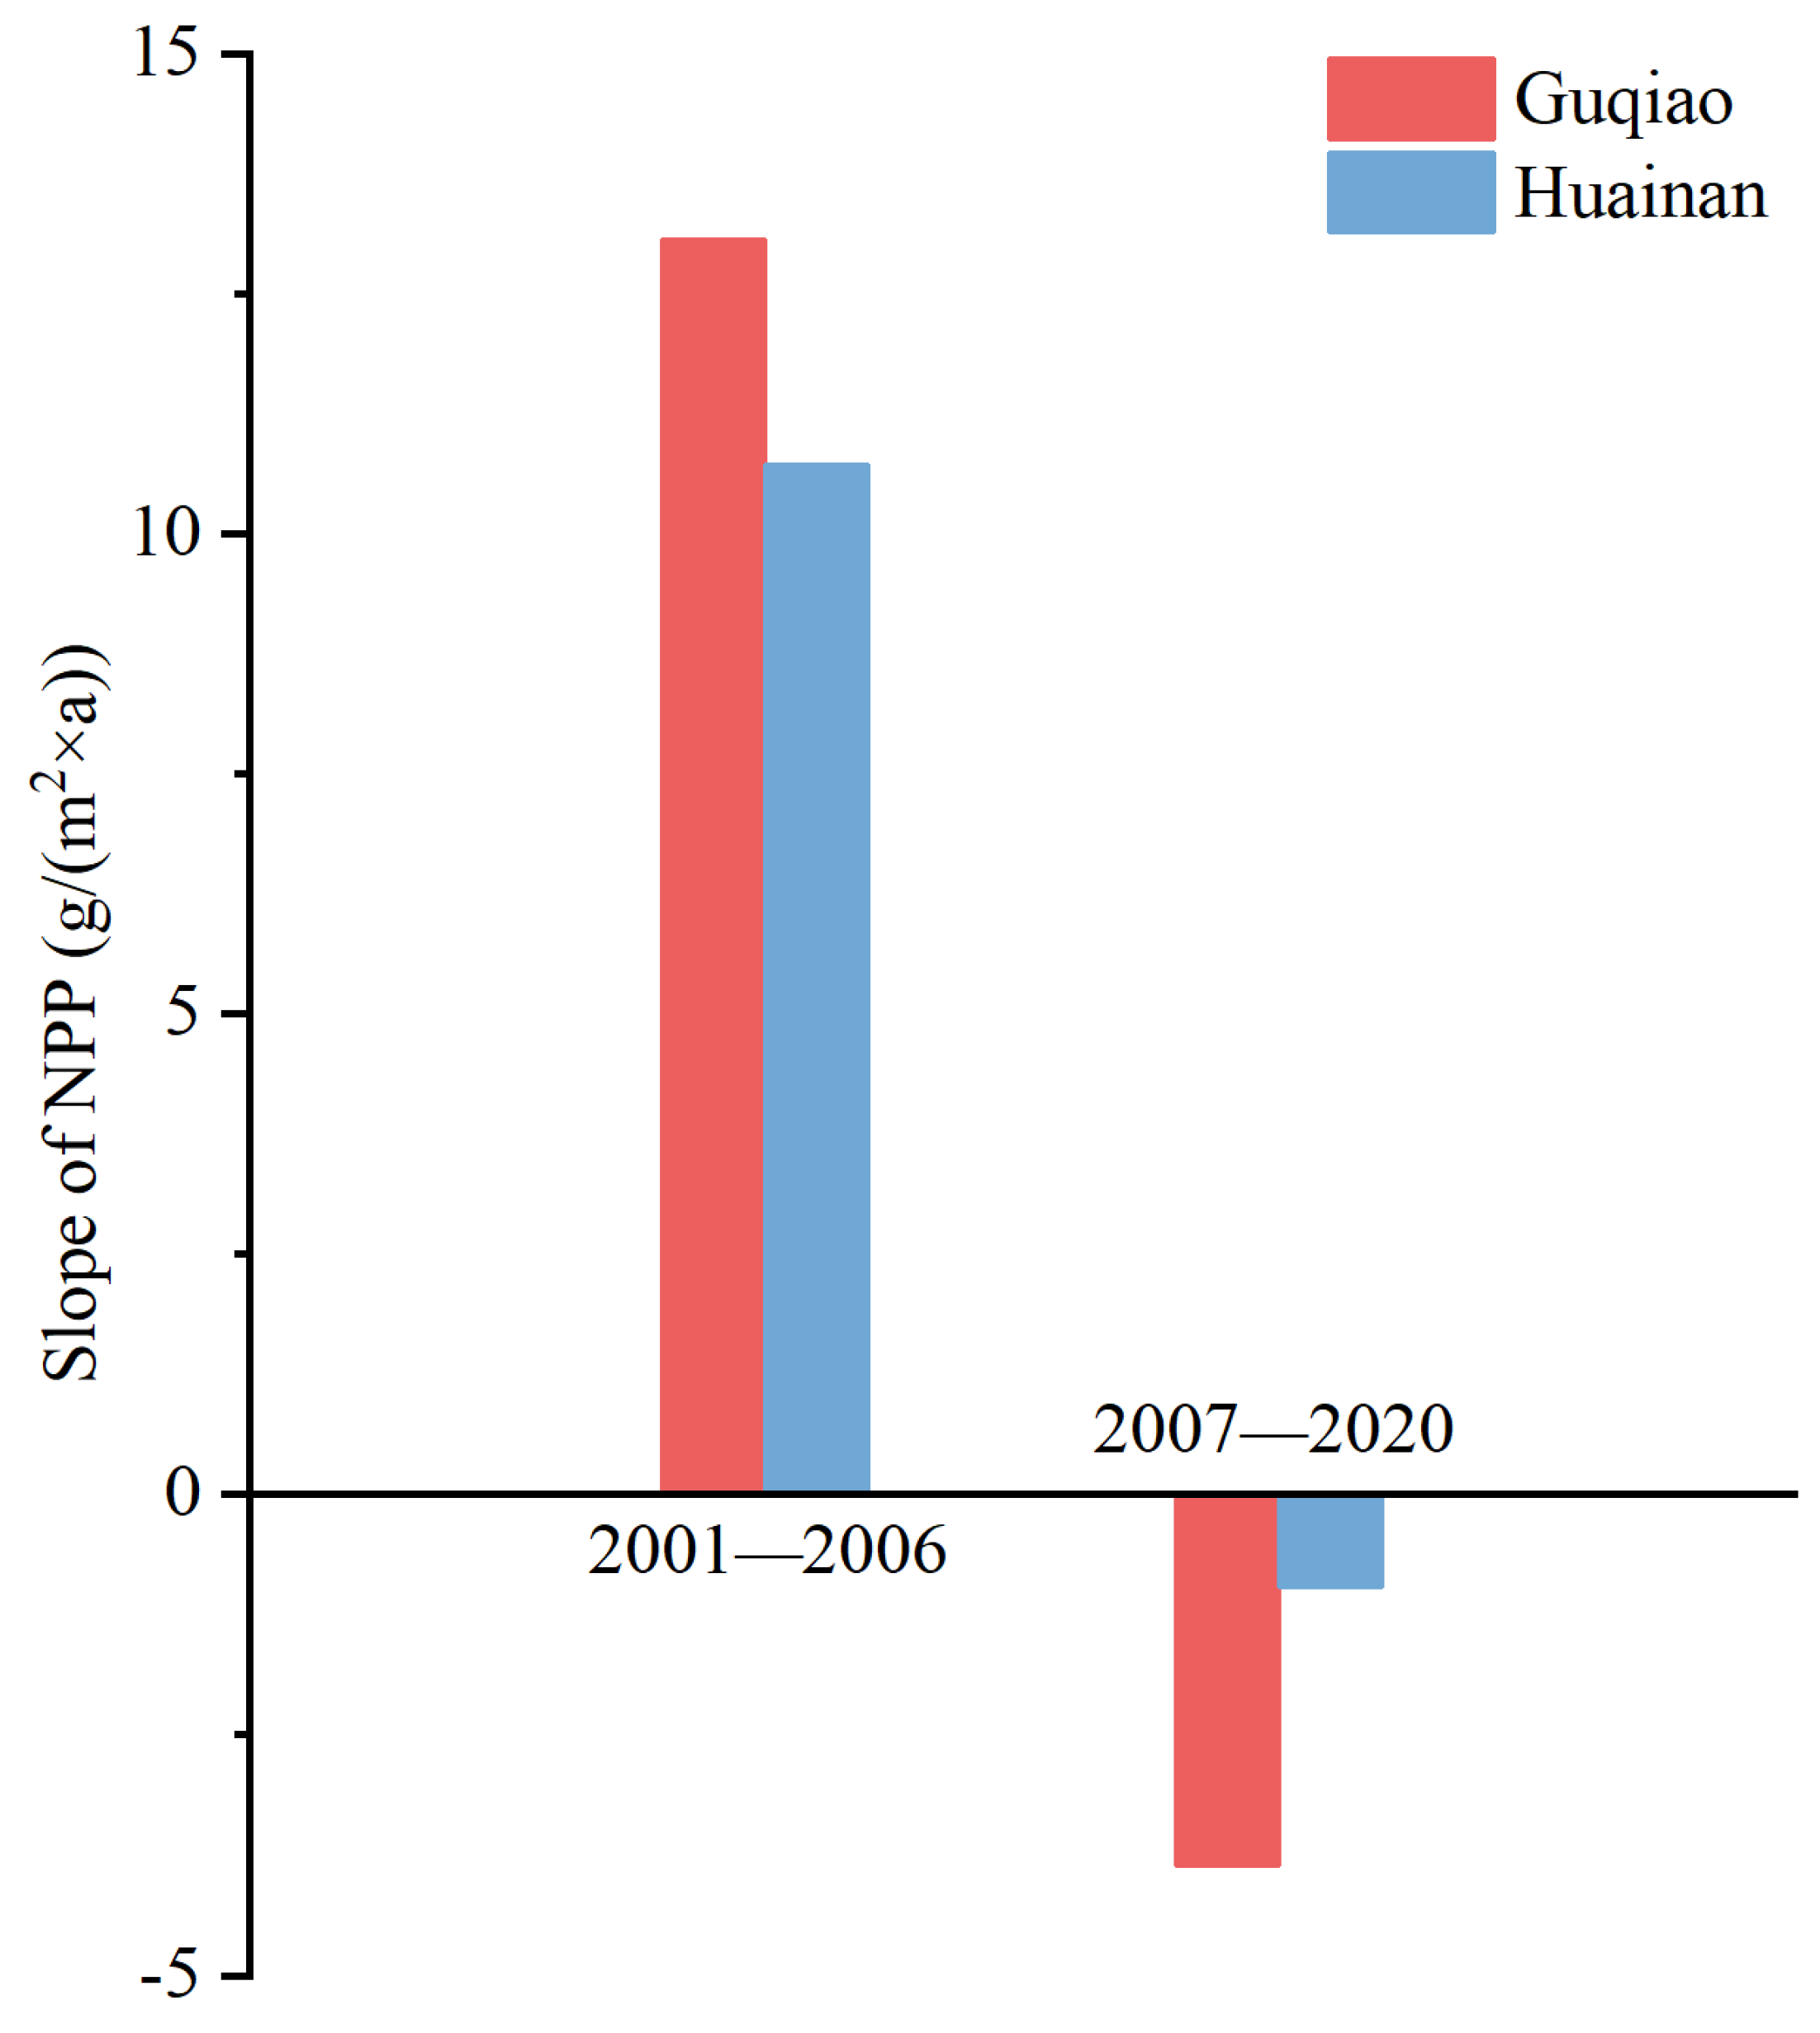
NPP varied with rainfall fluctuation and was restricted by coal-mining factors. NPP in the mining area was 0.43 g/(m2×a), which was lower than 2.63 g/(m2×a) in the non-mining area. In the Guqiao mine, NPP increased more before mining than in Huainan, but after 2006, NPP decreased by more than four times as much as in Huainan.
(3)
The spatial correlation between mining disturbances and NPP was obvious. The more serious the damage caused by coal mining, the smaller the value of the NPPslope and the larger the bivariate Moran Index.
This study revealed the characteristics of LUCC and the temporal–spatial response and driving factors of NPP in coal-resource-based cities with high phreatic water levels in East China. It can provide theoretical and data support for urban ecological structure–function planning and sustainable-development strategies.

Author Contributions

Conceptualization, X.W.; methodology, X.W.; software, X.W. and J.H.; validation, X.W., J.H. and J.L.; data curation, X.W. and J.H.; writing—original draft preparation, X.W. and J.H.; writing—review and editing, X.W., J.H. and J.L.; visualization, X.W.; funding acquisition, J.L. All authors have read and agreed to the published version of the manuscript.

Funding

This research was funded by the National Natural Science Foundation of China under grant number 42171247.

Institutional Review Board Statement

Not applicable.

Informed Consent Statement

Not applicable.

Data Availability Statement

Not applicable.

Acknowledgments

The authors would like to express their appreciation to members of the research group at the China University of Mining and Technology for providing great help in terms of data support.

Conflicts of Interest

The authors declare no conflict of interest.

References

  1. Hu, Z.; Yang, G.; Xiao, W.; Li, J.; Yang, Y.; Yu, Y. Farmland damage and its impact on the overlapped areas of cropland and coal resources in the eastern plains of China. Resour. Conserv. Recycl. 2014, 86, 1–8. [Google Scholar] [CrossRef]
  2. Zhang, F.; Hu, Z.; Fu, Y.; Yang, K.; Wu, Q.; Feng, Z. A new identification method for surface cracks from UAV images based on machine learning in coal mining areas. Remote Sens. 2020, 12, 1571. [Google Scholar] [CrossRef]
  3. Hu, Z.; Wang, X.; McSweeney, K.; Li, Y. Restoring subsided coal mined land to farmland using optimized placement of Yellow River sediment to amend soil. Land Degrad. Dev. 2022, 33, 1029–1042. [Google Scholar] [CrossRef]
  4. Li, G.; Hu, Z.; Li, P.; Yuan, D.; Wang, W.; Yang, K. The optimal framework and model to balance underground coal mining and cropland protection in Jining, eastern China. Resour. Policy 2021, 74, 102307. [Google Scholar] [CrossRef]
  5. Kuittinen, S.; Hietaharju, J.; Kupiainen, L.; Hassan, M.K.; Yang, M.; Kaipiainen, E.; Villa, A.; Kangas, J.; Nen, M.K.; Vepsalainen, J.; et al. Bioethanol production from short rotation S. schwerinii E. Wolf is carbon neutral with utilization of waste-based organic fertilizer and process carbon dioxide capture. J. Clean. Prod. 2021, 293, 126088. [Google Scholar] [CrossRef]
  6. Xiao, W.; Chen, W.; Deng, X. Coupling and coordination of coal mining intensity and social-ecological resilience in China. Ecol. Indic. 2021, 131, 108167. [Google Scholar] [CrossRef]
  7. Xiao, X.; Li, X.; Jiang, T.; Tan, M.; Hu, M.; Liu, Y.; Zeng, W. Response of net primary production to land use and climate changes in the middle-reaches of the Heihe River Basin. Ecol. Evol. 2019, 9, 4651–4666. [Google Scholar] [CrossRef] [Green Version]
  8. Han, J.; Hu, Z.; Mao, Z.; Li, G.; Liu, S.; Yuan, D.; Guo, J. How to account for changes in carbon storage from coal mining and reclamation in eastern China? Taking Yanzhou coalfield as an example to simulate and estimate. Remote Sens. 2022, 14, 2014. [Google Scholar] [CrossRef]
  9. Gao, Q.; Li, X.; Yang, X. Responses of vegetation and primary production in north-south transect of eastern China to global change under land use constraint. Acta Bot. Sin. 2003, 45, 1274–1284. [Google Scholar]
  10. Bao, G.; Bao, Y.; Qin, Z.; Xin, X.; Bao, Y.; Bayarsaikan, S.; Zhou, Y.; Chuntai, B. Modeling net primary productivity of terrestrial ecosystems in the semi-arid climate of the Mongolian Plateau using LSWI-based CASA ecosystem model. Int. J. Appl. Earth Obs. 2016, 46, 84–93. [Google Scholar] [CrossRef]
  11. Liu, X.; Pei, F.; Wen, Y.; Li, X.; Wang, S.; Wu, C.; Cai, Y.; Wu, J.; Chen, J.; Feng, K.; et al. Global urban expansion offsets climate-driven increases in terrestrial net primary productivity. Nat. Commun. 2019, 10, 5558. [Google Scholar] [CrossRef] [PubMed] [Green Version]
  12. Mitchell, L.E.; Lin, J.C.; Bowling, D.R.; Pataki, D.E.; Strong, C.; Schauer, A.J.; Bares, R.; Bush, S.E.; Stephens, B.B.; Mendoza, D.; et al. Long-term urban carbon dioxide observations reveal spatial and temporal dynamics related to urban characteristics and growth. Prod. Natl. Acad. Sci. USA 2018, 115, 2912–2917. [Google Scholar] [CrossRef] [Green Version]
  13. Chi, D.; Wang, H.; Li, X.; Liu, H.; Li, X. Assessing the effects of grazing on variations of vegetation NPP in the Xilingol Grassland, China, using a grazing pressure index. Ecol. Indic. 2018, 88, 372–383. [Google Scholar] [CrossRef]
  14. Song, X.; Hansen, M.C.; Stehman, S.V.; Potapov, P.V.; Tyukavina, A.; Vermote, E.F.; Townshend, J.R. Global land change from 1982 to 2016. Nature 2018, 560, 639. [Google Scholar] [CrossRef] [PubMed]
  15. Gaur, S.; Mittal, A.; Bandyopadhyay, A.; Holman, I.; Singh, R. Spatio-temporal analysis of land use and land cover change: A systematic model inter-comparison driven by integrated modelling techniques. Int. J. Remote Sens. 2020, 41, 9229–9255. [Google Scholar] [CrossRef]
  16. Li, F.; Meng, J.; Zhu, L.; You, N. Spatial pattern and temporal trend of land degradation in the Heihe River Basin of China using local net primary production scaling. Land Degrad. Dev. 2020, 31, 518–530. [Google Scholar] [CrossRef]
  17. Zika, M.; Erb, K. The global loss of net primary production resulting from human-induced soil degradation in drylands. Ecol. Econ. 2009, 69, 310–318. [Google Scholar] [CrossRef]
  18. Luck, G.W. The relationships between net primary productivity, human population density and species conservation. J. Biogeogr. 2007, 34, 201–212. [Google Scholar] [CrossRef]
  19. Peng, J.; Shen, H.; Wu, W.; Liu, Y.; Wang, Y. Net primary productivity (NPP) dynamics and associated urbanization driving forces in metropolitan areas: A case study in Beijing City, China. Landsc. Ecol. 2016, 31, 1077–1092. [Google Scholar] [CrossRef]
  20. Yang, H.; Zhong, X.; Deng, S.; Xu, H. Assessment of the impact of LUCC on NPP and its influencing factors in the Yangtze River basin, China. Catena 2021, 206, 105542. [Google Scholar] [CrossRef]
  21. Xie, S.; Ma, C.; Tian, S.; Tian, J. NPP changes and climate impact of Shendong Coalfield from 2000 to 2010. J. Geomat. Sci. Technol. 2015, 32, 5. [Google Scholar]
  22. Hou, H.; Zhang, S.; Ding, Z.; Gong, Y.; Ma, C. Study on the measurement of ecological loss based on the net primary productivity in coal mines. J. China Coal Soc. 2012, 37, 7. [Google Scholar]
  23. Heinsch, F.A.; Zhao, M.; Running, S.W.; Kimball, J.S.; Nemani, R.R.; Davis, K.J.; Bolstad, P.V.; Cook, B.D.; Desai, A.R.; Ricciuto, D.M.; et al. Evaluation of remote sensing based terrestrial productivity from MODIS using regional tower eddy flux network observations. IEEE Trans. Geosci. Remote Sens. 2006, 44, 1908–1925. [Google Scholar] [CrossRef] [Green Version]
  24. Zhao, M.; Heinsch, F.; Nemani, R.; Running, S. Improvements of the MODIS terrestrial gross and net primary production global data set. Remote Sens. Environ. 2005, 95, 164–176. [Google Scholar] [CrossRef]
  25. Chen, J.; Chen, J.; Liao, A.; Cao, X.; Chen, L.; Chen, X.; He, C.; Han, G.; Peng, S.; Lu, M.; et al. Global land cover mapping at 30 m resolution: A POK-based operational approach. ISPRS J. Photogramm. 2015, 103, 7–27. [Google Scholar] [CrossRef] [Green Version]
  26. Liu, B.; Pan, L.; Qi, Y.; Guan, X.; Li, J. Land use and land cover change in the Yellow River Basin from 1980 to 2015 and its impact on the ecosystem services. Land 2021, 10, 1080. [Google Scholar] [CrossRef]
  27. Quercia, D.; Saez, D. Mining urban deprivation from foursquare: Implicit crowdsourcing of city land use. IEEE Pervasive Comput. 2014, 13, 30–36. [Google Scholar]
  28. Yang, Z.F.; Li, Z.W.; Zhu, J.J.; Hu, J.; Wang, Y.J.; Chen, G.L. InSAR-based model parameter estimation of probability integral method and its application for predicting mining-induced horizontal and vertical displacements. IEEE Trans. Geosci. Remote Sens. 2016, 54, 4818–4832. [Google Scholar] [CrossRef]
  29. Li, H.; Zhao, B.; Guo, G.; Zha, J.; Bi, J. The influence of an abandoned goaf on surface subsidence in an adjacent working coal face: A prediction method. Bull. Eng. Geol. Environ. 2018, 77, 305–315. [Google Scholar] [CrossRef]
  30. Anselin, L. Local indicators of spatial association—LISA. Geogr. Anal. 2010, 27, 93–115. [Google Scholar] [CrossRef]
  31. Chen, G.; Li, X.; Jiao, L.; Wang, J.; Gu, K. Spatial-temporal variation of vegetation net primary productivity in Huainan Coal mine area from 2000 to 2012. Ecol. Environ. Sci. 2017, 26, 8. [Google Scholar]
  32. Wang, D.; Qin, W.; Jia, G.; Shan, Z.; Hao, M. Assessing the effects of climate variability and vegetation conversion on variations of net primary productivity in the mountainous area of North China. For. Ecol. Manag. 2022, 506, 119957. [Google Scholar] [CrossRef]
  33. Wang, X.; Wang, Y. Simulation and prediction of land utilization evolution in coal mining area. Metal Mine 2011, 415, 132–135. [Google Scholar]
  34. Xiao, W.; Fu, Y.; Wang, T.; Lv, X. Effects of land use transitions due to underground coal mining on ecosystem services in high groundwater table areas: A case study in the Yanzhou coalfield. Land Use Policy 2018, 71, 213–221. [Google Scholar] [CrossRef]
  35. Wu, S.; Zhou, S.; Chen, D.; Wei, Z.; Dai, L.; Li, X. Determining the contributions of urbanisation and climate change to NPP variations over the last decade in the Yangtze River Delta, China. Sci. Total Environ. 2014, 472, 397–406. [Google Scholar] [CrossRef]
  36. Gao, Y.; Zhou, X.; Wang, Q.; Wang, C.; Zhan, Z.; Chen, L.; Yan, J.; Qu, R. Vegetation net primary productivity and its response to climate change during 2001-2008 in the Tibetan Plateau. Sci. Total Environ. 2013, 444, 356–362. [Google Scholar] [CrossRef]
Figure 1. Geographical distribution map of the study area. (a) location of Huainan City; (b) location of mining area for this study; (c) coal mining causes serious damage to surface ecology; (d) the villages in the coal mining subsidence area were flooded by ponding.
Land 11 00973 g001
Figure 2. Schematic diagram of LUCC (where CLFL represents the change in land types from FL to CL, with the rest remaining the same; CL means cropland; FL means forestland, GL means grassland; WL means wetland; WB means waterbodies; and UL means urban land).
Land 11 00973 g002
Figure 3. Precipitation and temperature changes from 2001 to 2019.
Land 11 00973 g003
Figure 4. The average value and change trend of NPP from 2001 to 2020: (a) average value; (b) change trend.
Land 11 00973 g004
Figure 5. Average NPP and NPP per unit area for each mine in the study area and in Huainan.
Land 11 00973 g005
Figure 6. NPP change trend from 2001 to 2020 in coal mines and in Huainan.
Land 11 00973 g006
Figure 7. Guqiao mine and Huainan NPP change trend in two stages.
Land 11 00973 g007
Figure 8. Influence range of coal mining and space analysis: (a) spatial distribution map of coal-mining subsidence damage; (b) trend map of NPP from 2001 to 2020; (c) LISA aggregation graph.
Land 11 00973 g008
Table 1. Information about each mine.
NameProduction Capacity (10,000 Tons/Year)Production Time (Year)Area (km2)
Design LevelActual Level
Zhangji400700200147.7
Gubei400400200736.0
Guqiao5001000200784.0
Dingji500600200761.0
Panyi300600198347.6
Paner300380198919.7
Pansan300500199264.0
Pansidong210260200736.0
Table 2. A sample of the land-use change matrix.
Land Use TypeA1A2An
A1S11S12S1n
A2S21S22S2n
AnSn1Sn2Snn
Table 3. Huainan land-use change matrix (km2).
20202000
CroplandForestlandGrasslandUrban LandWaterbodiesWetlandTotal
Cropland1634.830.0812.7275.3336.2213.081772.26
Forestland27.372.310.430.290.150.0130.56
Grassland8.300.6411.352.900.850.0924.13
Urban land199.980.125.68260.652.860.95470.24
Waterbodies61.440.044.174.69162.9911.56244.89
Wetland11.160.032.941.0912.357.9835.55
Total1943.083.2237.29344.95215.4233.662577.62
Table 4. Land-use change matrix of mining area (km2).
20202000
CroplandGrasslandUrban LandWaterbodiesWetlandTotal
Cropland292.250.0214.403.611.02311.31
Grassland1.150.000.050.060.011.28
Urban land5.610.000.505.990.4812.57
Waterbodies40.080.014.0113.180.8958.17
Wetland23.760.0242.990.250.0067.02
Total362.850.0561.9523.092.40450.35
Table 5. Land-use structures in Huainan and mining areas from 2000 to 2020.
Area (km2)CroplandForestlandGrasslandUrban LandWaterbodiesWetland
Huainan20001943.083.2237.29344.95215.4233.66
Proportion75.38%0.12%1.45%13.38%8.36%1.31%
20201772.2630.5624.13470.24244.8935.55
Proportion68.76%1.19%0.94%18.24%9.50%1.38%
Mining area2000362.850.000.0561.9523.092.40
Proportion80.57%0.00%0.01%13.76%5.13%0.53%
2020311.310.001.2867.0258.1712.57
Proportion69.13%0.00%0.28%14.88%12.92%2.79%
Table 6. Pearson correlation coefficient table.
Climate FactorsTemperaturePrecipitation
Pearson correlation coefficient0.190.76
Table 7. Area of damaged land in different degrees.
Damage GradeArea (km2)Proportion
Lightly land damage91.4346.8%
Moderate land damage33.2317.1%
Severe land damage70.5036.1%
Publisher’s Note: MDPI stays neutral with regard to jurisdictional claims in published maps and institutional affiliations.

