Abstract
Afforestation can improve hydrological processes, such as infiltration, in basins and, therefore, reduce the impact on human populations of floods, soil erosion, landslides, droughts, and climate variation. The aim of this work was to analyze how afforestation and other changes in land use influence infiltrability and the evolution of soils. Infiltration rates, soil water repellency, and physical and chemical properties of sandy loam soils were measured in four types of land: native holm oak forest, afforested 20-year-old pine forest, shrubs, and grasslands. Non-forest covers are the result of the degradation of native oak forests for centuries, while the pine afforestation in this study took place on a perennial wet mountain pasture (cervunalito). Our results show that soil infiltration rates are much higher in pine afforestation areas (857.67 mm·h−1) than in holm oak forest (660.67 mm·h−1), grasslands (280.00 mm·h−1), or shrubs (271.67 mm·h−1). No statistically significant differences in fertility, organic matter content, bulk density, or effective porosity were found between afforestation areas and other types of cover; however, pine afforestation improved the drainage of the soil, as its infiltration rate was higher than that of the native holm oak forest.
1. Introduction
Global change includes climate variations, as well as modification of land cover, over-exploitation of natural resources, the effects of invasive species, habitat losses, and the alteration of biogeochemical cycles. Changes in land use have occurred for centuries, especially from forest to agricultural usage or grasslands, and these changes have an undoubted influence on soil erosion, hydrological processes [1], and natural water resources [2]. On the other hand, restoration of forest ecosystems by means of afforestation can contribute to ameliorating the hydrological processes of soils [3], mainly by the infiltration of basins, thereby reducing the impact of climate variations on human populations in terms of controlling floods, soil erosion, landslides, and droughts [4].
Infiltration is a complex hydrological process that consists of the vertical entry of water into the soil. During the process, the water potential, capillary forces, and gravitational gradients are controlled, and they are related to soil water content and pore structure, among other soil characteristics [5]. Infiltration is one of the main components of the hydrological cycle. It is a main factor in the regulation and maintenance of ecological relationships in water-dependent terrestrial ecosystems [6]. Soil infiltrability (or infiltration capacity) is the maximum capacity of soil to infiltrate surface water in a unit of time (L∙m−2∙min−1, mm∙h−1), and it is estimated by the soil infiltration rate [5,7]. Quantifying the soil infiltration capacity is necessary to understand and model the hydrological regime of an area, and to assess soil erosion and its stability [8], due to its close relationship with the hydrological functioning of the soil [9] and the hydrological services of ecosystems [10]. Therefore, it is an important factor in land management and in the estimation of overland flow or groundwater [11].
During soil infiltration, the initial infiltration rate is extremely high, and the rate decreases exponentially over time, gradually stabilizing [12] to a constant final infiltration rate (i.e., a steady state infiltration rate). This final infiltration rate is very close to the saturated hydraulic conductivity (field saturated hydraulic conductivity) [12] or the permeability of the soil [5]. Generally, the infiltration process takes two to four hours to reach the final infiltration rate, at which time the flow of water into the soil depends exclusively on the gravitational gradient and not on the initial soil moisture content [7].
Soil infiltration has been extensively studied and modeled in the past and more recently [13], and depends on various factors [5,10,12,14,15,16,17]. Such factors include precipitation characteristics (duration, intensity, droplet size), surface water characteristics (turbidity, temperature, density), terrain relief, vegetation cover, soil properties (surface roughness, litter cover, texture, structure, porosity, soil depth, bulk density, coarse elements and stoniness, compaction, water content, organic matter, calcium carbonate, etc.), and livestock. Agricultural and forest works also affect soil infiltration. It is necessary to study and model the infiltration of different soil and land cover conditions and the management of those conditions [5,14,18,19]. Zhang et al. [11] showed that the heterogeneity of soils makes it very difficult to obtain representative infiltration rates at the plot or hillside scale. They also found significant differences between measuring instruments, especially between small soil cores and double-ring infiltrometers.
Several studies have been conducted on different types of land use, as vegetation is one of the main factors influencing infiltration. There are numerous works on infiltration in agricultural land in tropical [7,9,19,20], subtropical [21], temperate [22], and cold regions [23]. Other studies have focused on different types of vegetation cover [3,24,25,26,27,28] and showed that reforestation improves (increases) soil infiltration. Some studies [29] showed that trees usually enhance infiltration capacity.
However, there is a lack of information on infiltration in forests, although numerous experiments have been carried out [3,11,16,30,31,32,33,34,35,36]. Various researchers found that infiltration rates tend to increase after reforestation [6,25,30,37,38,39,40,41]. Other researchers [3,6,40,42] reported higher infiltration rates under vegetation tree cover than in unforested sites. The reasons for this are that forest canopy intercepts rainwater, acting as a shield against raindrop impact, and the roots of trees form a dense network of ducts that connect the soil surface to its deeper layers [39]. Ilstedt et al. [33] found that reforestation in tropical areas increased infiltrability three times more than agricultural crops in such areas. Trees increase infiltrability more than any other type of vegetation, which may be due to the depth and length of their roots, a higher content of surficial litter, and organic matter in the soil [22]. In addition, microtopography surrounding tree trunks, the microclimate under tree canopies, and a large number of edaphic fauna improve the hydrological conditions of the soil [11,40,43]. Generally, forests provide for better infiltration than old traditional grasslands, except in some cases such as the ancient agro-pastoral systems of the Western French Pyrenees. Leigh et al. [44] found better hydrological conditions in grassland areas than in forest areas. Yu et al. [26] also found higher infiltration rates at the soil surface (0–20 cm) of grasslands than in the black locust forest of the Loess Plateau, but the forest had higher infiltration rates below a depth of 20 cm. Greenwood and Buttle [25] reported that a 27-year-old Scotch pine plantation had the same infiltration rate as a 100-year-old pasture. Habrovsky et al. [10] studied infiltration rates and water repellency in vineyards, natural forests, and forested areas in the Little Carpathian Mountains and found that higher rates of water repellency were related to the lower infiltration rates of the ground surface in forested areas. The hydrophobicity associated with certain land uses [45,46,47], especially forest land [48], is related to the presence of organic substances in the soil [49,50] and is sometimes linked to the presence of certain fungi [51] or forest fires [47,52,53]. The hydrological implications of hydrophobicity are complex, depending on its degree of intensity, but hydrophobicity generally reduces infiltration capacity and, therefore, increases surface runoff and sediment transport [53,54,55]. This means that water repellency or hydrophobicity is a soil property that can have significant hydrological consequences [45].
As Löf et al. indicated, “afforestation by artificial regeneration or by natural invasion of trees often occurs first on those marginal sites as a consequence of land use change, shifts in agriculture practices and depopulation of rural areas” [56]. Consequently, more scientific evidence is required about the effects of these changes on the hydrological conditions of different types of soil with different agricultural or forestry activities [33,43].
In addition to improving the hydrological properties of soil, forest vegetation improves the chemical and physical properties of soil. [42]. This could be related to the thickness of leaf litter generated by trees after forest restoration [40], which stabilizes the soil structure and increases microbial community activity and nutrient cycling [37]. For this reason, soil generally presents better quality in forested areas than in degraded areas [37,57]. However, some properties of land, such as soil erodibility, vary slightly after less than a century of reforestation, compared with degraded soils in the same area [40]. However, Medeiros et al. found that the difference was only around 9% less when reforested areas were compared with degraded areas [58]. The evolution of some soil properties in reforested land, such as fertility [6,59] or the presence of communities of earthworms, can be relatively slow [60]. Eighty years after the reforestation of gullies, Navarro et al. found no significant changes in soil strength penetration, soil pH, electrical conductivity, or bulk density [40]. Laudicina et al. also reported that some soil properties had not changed six decades after reforestation [61]. Other studies found that vegetation in degraded areas changed soil properties, such as textural fractions, bulk density, porosity, electrical conductivity, pH, some nutrient levels, cation exchange capacity, percentage of exchangeable sodium, and organic matter [28,40,42,62]. Accordingly, vegetation seems to be a significant factor in ameliorating soil properties.
Currently, there is a lack of information on the recovery of soil infiltration capacity after forest restoration [29]. Several studies have reported how different factors, such as soil texture and structure, grassland use, soil type, and vegetation, affect soil infiltration rates [29], but the influence of these factors and forestation in the recovery of soil infiltration capacity is still not well understood [41]. Therefore, the main objective of this work is to compare different land uses and the results of historic land management practices in a mountainous area in central Spain (with a focus on native holm oak forest, shrubs, and pasture) with a recent pine afforestation area, in terms of the hydrological conditions (infiltration, NRCS hydrologic groups, and repellency) and other physical and chemical properties of the soil. Our hypothesis is that afforestation with Pinus species contributes to soil improvement, recovering hydrological and edaphic properties that were lost when the native holm oak forest was turned to grasslands or to shrub vegetation.
2. Material and Methods
2.1. Study Area
The study area was around Navalperal de Pinares, a Spanish village located in the Tajo River basin. Specifically, it is in the small basins of the Majalayegua and Pradomolino streams in the Alberche River sub-basin. This area is located in the eastern part of the province of Ávila (40°35′32″ N, 4°24′39″ W), which is in the central system mountain range in the interior of the Iberian Peninsula (Figure 1).
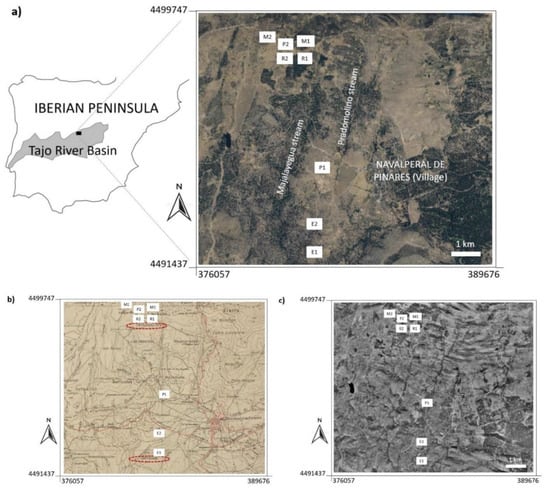
Figure 1.
(a) Location of the study area in the Tajo River basin and the location of the sampling plots (R1, R2, E1, E2, M1, M2, P1, P2), using orthophotography PNOA 2017; (b) location of the study area in topographic map 1915; (c) location of the study area via ortophotography OLISTAT 1997–1998, before afforestation. Coordinates: UTM zone 30N, Datum ETRS89.
The climate of the study area is classified as a humid temperate climate. The average annual temperature is 9.9 °C, the average minimum temperature in January (the coldest month) is −0.3 °C, and the average maximum temperature in July (the warmest month) is 27.5 °C. The average annual precipitation is 459 mm, with maximum precipitation occurring in autumn and minimum precipitation occurring in summer. The annual mean potential evapotranspiration, according to the Thorthwaite method, is 642 mm. The duration of the dry period is 2.7 months.
The lithology of the area is composed of igneous rocks, mainly consisting of adamellites with megacrystals and tonalitic microaggregates, as well as leucogranites and pegmatites. Humic and gleic cambisols are formed on these materials, as well as, to a lesser extent, lithic and umbric leptosols. Generally, the soil is sandy loam, with more than 60% sand (mean values: sand 67%, silt 21%, clay 12%). The soil pH is 5.4, which indicates acidic soil conditions; CaCO3 is not detectable, and organic matter content is 8.8%. The relief is mountainous in the northern part, with slopes descending to flatter areas in the southern part. The altitudes of the study area range between 1217 m and 1488 m, predominantly from the southern and southeastern orientations.
The area presents an anthropized landscape formed by grasslands for extensive livestock usage, including Stipa gigantea LINK, Trifolium sp. L., Poa bulbosa L., and other herbaceous species. The area is fenced and dotted with some trees. The holm oak (Quercus ilex ssp. ballota [Desf.] Samp.) and Pyrenean oak (Quercus pyrenaica Willd.) predominate in the highlands and near the village. On the map of 1915, there is evidence of an old presence of oaks in the area, such as in the carrascal, which means an area covered with small holm oaks (Figure 1b). However, the old presence of pinewoods is indicated by some place names in the region, such as Peñaelpino, Navalperal de Pinares, or Resin house. The original vegetation of dense holm oak and Pyrenean oak was cleared over time by cropping and fires to generate pastures for grazing sheep and cattle (which remains the majority usage today). Since at least the fifteenth century, the area has been of great importance for livestock, according to different historical documents. In addition, the soil evolution has been influenced by historic land management, forestry use (firewood and timber, resin), cropping, and cattle raising. Since the end of the past century, ancient cleared lands, with open or non-existent trees and poor grazing, have been colonized by broom scrub (Cytisus oromediterraneus) (Rivas Mart. et al., 1984). Afforestation and reforestation with Scots pine (Pinus sylvestris L.) have been carried out on abandoned land. Therefore, pinewoods in the area, as a means of recovering lost trees and their ecosystem services, are now about 20 years old. Some of these pinewoods were planted on an ancient perennial and wet mountain pasture that was named Cervunalito on the map of 1915 (Figure 1b). Before planting, mechanical site preparation (MSP) was carried out to avoid excessive soil moisture for the roots of the pine saplings. For this purpose, ridges were made with a bulldozer (mounding), so the soil surface shows excavated and compacted furrows between ridges of disturbed and loose earth.
2.2. Field Sampling and Laboratory Work
Eight 10 m × 10 m sampling plots (Figure 1a) were randomly chosen in areas of four different types of land use: (i) holm oak forest (E1, E2), (ii) afforested pinewood (R1, R2), (iii) shrubs (M1, M2), and (iv) grasslands (P1, P2) (Figure 2). Twenty-four infiltration tests were carried out (three in each plot) under dry soil conditions (without precipitation in the 10 days prior to the infiltration tests) using a simple ring infiltrometer (Infiltest) (Figure 3). This infiltrometer has a millimetric methacrylate to read the measurements and a steel tube to place the methacrylate cylinder on the ground. A little furrow surrounding the simple ring was dug to pour water and avoid lateral infiltration. Consequently, it worked as a double-ring infiltrometer. The tests lasted three hours, during which 17 measurements were made to determine the initial infiltration rate (f0) and the steady-state (fC) infiltration rate, to obtain their corresponding infiltration curves.
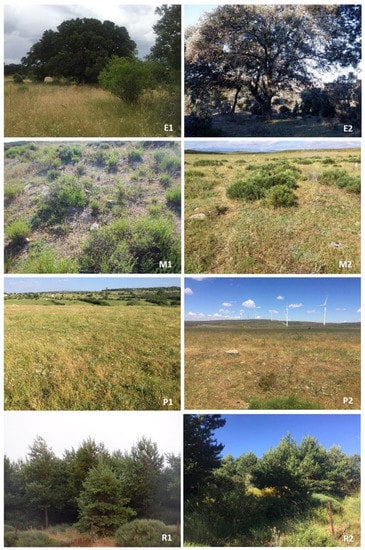
Figure 2.
Sampling plots with the different types of vegetation: pine forest (recent afforestation) (R1,R2), holm oak forest (E1,E2), shrubs (M1,M2), and grasslands (P1,P2).
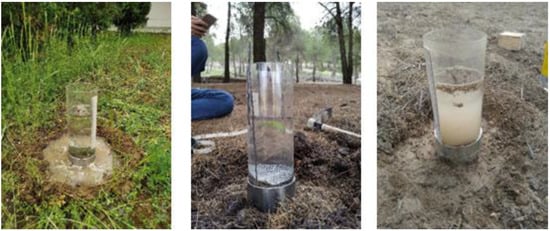
Figure 3.
Simple ring infiltrometer (Infiltest).
Repellency was determined by means of 10 tests in each plot, with the water drop penetration time (WDPT) and molarity of an ethanol droplet (MED) methods [45,48,63]. The WDPT method consists of pouring 0.05 mL drops of distilled water (ten drops for each plot) onto the soil from a height of 1 cm. The time until it infiltrates was recorded, and the same process was repeated for the excavated soil (depth = 1 cm). The MED method consists of successively placing drops with increasing concentrations of ethanol in distilled water (0, 3, 5, 8.5, 13, 24, and 36%), timing how long the drops last to infiltrate. The test ended when one drop took less than three seconds to infiltrate, and the same process was repeated for the excavated soil (1 cm).
In addition, the slope degree (SL) and the orientation of all the plots were determined, and a representative soil sample from 0–50 cm deep was taken for laboratory analysis. We determined the following for all samples: texture, as a percentage of weight in relation to the fine earth (% sand = SD, % silt = ST, and % clay = CY); coarse soil particles (>2 mm sieve); soil bulk density (BD) by means of unaltered soil samples, extracted by cylinder steel-rings 8 cm ø × 24 cm (three points in each plot); soil moisture content (MC) with the Theta Probe equipment (10 points in each plot); and the effective porosity (EP), which was determined using the modified Briggs and Shantz equation [64]:
where PD is the mineral particle density.
Likewise, soil organic matter (OM) was determined according to the Walkley–Black method (which determines organic carbon using a coefficient of 1.724 to obtain the organic matter content); soil pH (potentiometry-water solution 1:2.5); electrical conductivity (EC) (conductivity meter-water solution 1:2.5); the contents of nitrogen, phosphorus, potassium, calcium, sodium, and magnesium; and the macro fertility index (MFI) (sum of N, K, and P). The sum of the bases (SB) (the sum of Ca, Mg, Na, and K) was determined. Finally, the hydrologic soil groups (HSG) [65] were determined for each plot, as well as the related curve number (CN) [66] and the initial abstraction (IA) [67].
2.3. Statistical Analysis
Eleven variables directly related to soil properties were analyzed by mean of a principal component analysis (PCA). The selected data were OM, N, Ca, EP, K, Mg, P, pH, Na, BD, and MC, with MFI and SB as complementary variables.
The differences among bulk density, porosity, soil moisture, organic matter, fertility, sum of bases, phosphorus, potassium, calcium, magnesium, and nitrogen of the different types of vegetation were analyzed by means of an ANOVA model of one factor (one-way ANOVA), adjusting for different variances for each type of vegetation.
Some equations of mixed linear models were adjusted to study the effects on initial and final infiltration, and on repellency in the types of considered vegetation:
where is the initial or final infiltration for some of the four types of soil repellency for the k sampling point in the j plot for the i vegetation type, μ is the general effect of the mean, is the effect of the type of vegetation, is the linked effect of the plot for each type of vegetation, and is the random effect of the different measures in each plot; with the covariance matrix were determined by a different variance for each type of vegetation, and constant covariances for each type of vegetation, , and null between different types of vegetation. Finally, is the random error of the model such that is independent. To attain model convergence, restricted maximum likelihood (REML) variances were calculated. Pairwise t-tests were used to compare the estimated means for the different levels of significant fixed effects.
In addition, we fitted some linear regression models by means of linear mixed models with the following equation to analyze the influence of the numeric plot soil variables (bulk density, porosity, silt, clay, sand, and organic matter) on infiltration rates and repellency:
where a and b represent the intercept and the slope of the regression line, respectively, is the soil infiltration rate or repellency, and is the value of the different independent soil variables for the j-plot. The random terms for the models are the same as those of the previous model, is the random effect for the three measures in each plot, and is the random error of the model, with the same REML variance and covariance structures.
Every model was adjusted by means of the PROC MIXED of SAS 9.4 statistical model, and the variances for the restricted maximum likelihood (REML) were obtained to fit the convergence of the models.
3. Results
Table 1 shows the results of the means for the study variables and the four types of the analyzed land use, as well as the descriptive statistical parameters for the different variables.

Table 1.
Study variables for the four types of vegetation. Mean and (standard deviation). Soil properties for 0 to 50 cm depth.
The first two factors (PC1 and PC2) of the PCA with soil data explained 77.80% of the total variation. PC1 was negatively correlated with BD (−0.83) and MC (−0.63) and positively correlated with the rest of the variables, particularly with Mg (0.88), K (0.87), EP (0.87), pH (0.84), Ca (0.83), P (0.83), and SB (0.94) (Table 2). PC2 was negatively correlated with Na (−0.74) and positively correlated with N (0.87), MFI (0.80), and OM (0.70).
Table 2.
Pearson correlation matrix between soil variables and the first two factors of the PCA (PC1, PC2).
The PCA allowed us to describe the edaphic properties of the plots. The plot on these two factorial axes revealed distinct groups of vegetation types and differences between the plots considered for each type of vegetation (Figure 3). The first factor, PC1 (horizontal axis), distinguished between the holm oak and the rest of the types of vegetation. The oak plots were characterized by high values of Mg, K, Ca, and P, as well as SM and a high pH (positive values of PC1). In addition, Figure 4 shows low values of soil moisture content and bulk density (negative values of PC1), unlike the falues of other types of vegetation. Moreover, PC2 (vertical axis) allowed distinguishing between (a) those plots with high values of OM and N, with high macrofertility, and with low values of Na (positive values of PC2) and (b) plots with the opposite trend (negative values of PC1).
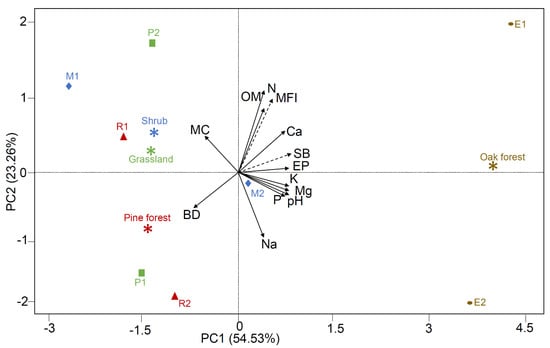
Figure 4.
Plot of cases and variables in the PCA plane for soil plot data. The plotted points correspond to the centroids of cases for each plot and type of vegetation. Variable description and acronyms are explained in Table 1.
Therefore, PCA allowed us to describe the edaphic properties of the plots. Figure 4 shows that variability between plots in each type of land use is high (distance between plots) and that the holm oak has better soil properties than the rest of the land uses.
The influence of the types of vegetation on the edaphic variables was also analyzed (Figure 5). According to the physical properties of the soil, only bulk density (p-value = 0.0024) and effective porosity (p-value < 0.0001) presented significant differences. The holm oak plots had the lowest bulk density and the highest porosity, with statistically significant differences compared with the other three types of vegetation. Pine afforestation areas did not show significant differences in either variable, compared with shrubs and grasslands. Regarding the soil chemical properties, only K (p-value = 0.0052) and Mg (p-value = 0.0101) showed significant differences. In practice, oak forests presented the highest values of these nutrients, while pine afforestation areas did not present significant differences compared with shrubs and grasslands. In addition, organic matter, fertility, sum of bases, and contents of P, Ca, and N did not show statistically significant differences among these three land uses.
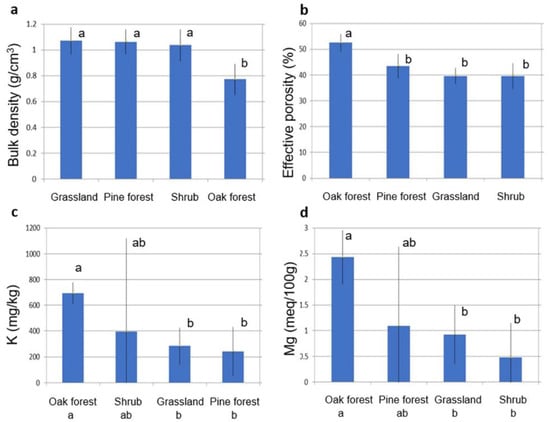
Figure 5.
Mean plot of the bulk density: (a) bulk density, (b) effective porosity, (c) K content, and (d) Mg content for the vegetation types. Error bars represent 95% confidence intervals. Different letters denote statistically significant differences, α = 0.05.
Figure 6 shows the infiltration curves for the different land uses. The initial soil infiltration rate did not present significant differences for the four types of vegetation. However, the steady-state infiltration rate presented significant differences, for a probability of 99% (p-value < 0.0001), with pine afforestation at the highest rate, followed by native holm oak, grasslands, and shrubs (Figure 7).
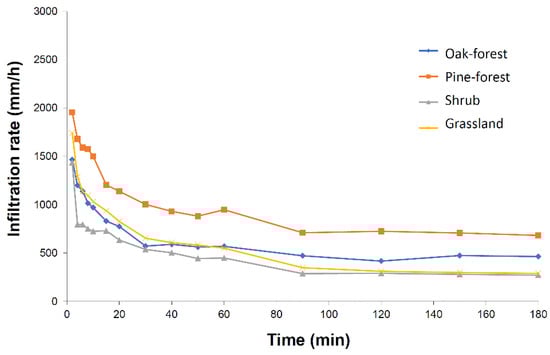
Figure 6.
Infiltration curves for the four types of vegetation zones.
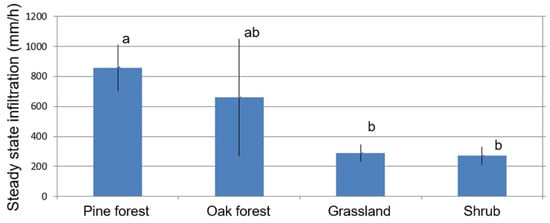
Figure 7.
Mean plot of the steady state infiltration rate for the vegetation types. Error bars represent 95% confidence intervals. Different letters denote statistically significant differences, α = 0.05.
Based on the regression analysis, the factors influencing the soil steady-state infiltration rate were the effective porosity and the sand content. The p-values and the fitted regressions are shown in Table 3.
Table 3.
Factors influencing soil infiltration and soil repellency.
The repellency or soil hydrophobicity was clearly greater in pinewood than in the rest of the vegetation types, regardless of the methods used (p-value < 0.0001). However, there was a significant difference between the plots within the same type of vegetation, especially in pinewood and holm oak (Figure 8). In our opinion, these differences could be related to historical changes in land management and land use, such as the transformation of native forests for grasslands and livestock activities over past centuries. In contrast, the current differences could be due to forestation or shrub invasion on abandoned land. However, more research is needed to support this point of view. Statistical analysis also showed that soil bulk density, effective porosity, sand, silt, clay, and organic matter content influence soil repellency, with different levels of significance, depending on the factors, variables, and methods used(Table 3).
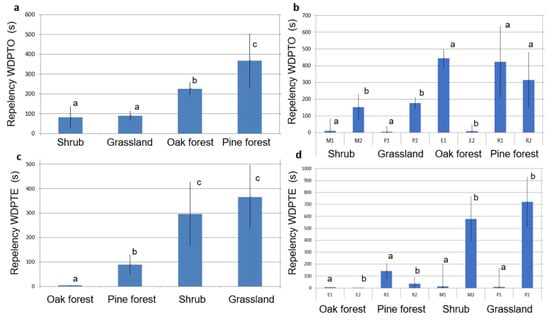
Figure 8.
Mean plot of the soil repellency for the vegetation types (left) and for sampling plots (right). Error bars represent 95% confidence intervals. Different letters mean statistically significant differences, α = 0.05, between the vegetation types in (a,c), and between plots within each vegetation type in (b,d).
Regarding the hydrological groups of soils, we followed the criteria established by [65,66], and all land uses were between groups A and B (Table 1). These values meant that they had a very high to high infiltration capacity, respectively. However, there were some differences in the related hydrologic curve numbers (CNs), which were the closer values to 100 maximum soil runoff capacity and the lower values of lower soil runoff capacity. In addition, the oak and pine forests had a better infiltration capacity and a lower capacity to generate runoff, because their CNs were between 25 and 55. On the other hand, shrubs had a greater response in runoff (CN = 35–56), but the response was even greater in grasslands (CN = 49–69).
Finally, the initial abstraction (IA) represents the rainfall interception, water infiltra-tion, and surface depression storage during the early periods of a storm until runoff begins [67]. Our results showed that the pine forest had the highest runoff threshold (IA = 79.5 mm), followed by the oak forest (IA = 76.2 mm). On the other hand, shrubs and grasslands showed a much lower capacity to intercept rainfall (IA = 60.9 mm, IA = 35.3 mm, respectively). Pine forest showed the highest capacity for retaining runoff and, therefore, it had the greatest capacity for controlling floods and soil erosion, and enhancing groundwater.
4. Discussion
4.1. Infiltration and Runoff
Generally, soil infiltrability is closely related to the type of vegetation cover [14]. Infiltration rates are usually higher when the vegetation size and cover are larger, especially when trees provide the cover [3,22,29,68]. Gilmour et al. [30] found improved infiltration rates in reforested areas that were 5 and 12 years old (51 and 524 mm·h−1, respectively) and in native forests (370 mm·h−1), compared with deforested lands or those converted to heavily grazed grasslands (39 mm·h−1). Mapa [7] reported higher infiltration rates in reforestations that were 12 years old (567 mm·h−1) in lands that were transformed into pastures (259 mm·h−1) or crop areas (286 mm·h−1). Gajic et al. [69] recorded steady-state infiltration rates in forests that were 2.5 times higher than the rates in meadows and six times higher than the rates in cultivated fields. Zwartendijk et al. [9] found high infiltration rates in forests in eastern Madagascar (724 mm·h−1) compared with the rates in crop areas (45 mm·h−1). Ahirwal et al. [20] found that infiltration rates decreased from forest to reforested land and from forest to crop land by 89% and 45%, respectively, in tropical Jharkhand (India).
In line with previous studies, our results show a higher steady-state soil infiltration rate in restored areas (e.g., recent pine afforestation) and in oak forests than in grasslands and shrubs. The more recent afforestations have steady-state infiltration rates three times higher than those of shrubs and grasslands, and the rates of holm oaks are 2.3 times higher than those of non-wooded lands. Some authors reported that infiltration rates increased after forest restoration, compared to the rates of deforested areas [3,6,7,33,37,39,40,42]. Bessie et al. [68] reported improved soil infiltration rates at sites where natural vegetation was recovering. In our study, the soil infiltration rate of oak forest is lower than that of pinewood (660.67 mm·h−1 compared to 857.67 mm·h−1). This fact could be explained by that the native forests in pristine condition do not exist within the study area. The ancient original oak forest was felled for different uses at different intensities over the centuries (i.e., for firewood, timber, cropping, and grazing). Currently, the oak forest area supports some cattle and provides firewood to the inhabitants of the area. Some soil compaction could be expected, as these activities are not developed in the pinewood area. Similar results were obtained by Gilmour et al. [30], who found that native forests were altered by grazing and human activity. Ghimire et al. [70] also observed reductions in infiltration rates due to intensive use of the forest. Therefore, it is very probable that soil infiltration was higher in native forest areas that were unaltered by the influence of human activities. Furthermore, afforestation was carried out by means of mounding, to enhance infiltration capacity and soil drainage [56,71]. Accordingly, soil infiltrability in the pine afforestation areas could have been increased by the MSP.
Some works suggest that a long period of time is necessary for forest restoration to affect the hydrological conditions of soil. Greenwood and Buttle [25] indicated that it took from 25 to 40 years for pine plantations to regenerate the soil and improve infiltration rates to the level of the rates of undisturbed mixed coniferous and broadleaved forests. Zhang et al. [11] explained that a period of 23 years of forest restoration was necessary to have a positive effect on the physical properties of the soil, such as porosity or bulk density, which are directly related to infiltration. For example, oak forests have the lowest soil bulk density (0.77 g∙cm−3), but pinewoods, shrubs, and grasslands have similar values (1.06, 1.04, and 1.07 g∙cm−3, respectively). These results show that afforestation did not change soil bulk density when compared with the forest’s prior state, which is similar to the results for shrubs or grasslands. All of the bulk density values of the different land uses are far from the growth-limiting bulk density (GLBD = 1.65 g∙cm−3) for sandy soils [72], which means that soils are in a good state for root development. Navarro et al. [40] found an improvement in soil infiltration rates in 80-year-old forest restoration areas, but they also found that soil bulk density under the forest (1.63 g∙cm−3) was very close to that of barren land (1.7 g∙cm−3); Mongil-Manso et al. [3] observed a notable improvement in infiltrability in a 50- to 60-year-old pine reforestation area area that was relatively close to the area for this work (about 75 km in a straight line), but they also observed that the soil bulk density of the reforested pinewood (1.48 g∙cm−3) was similar to that of the degraded land (1.51 g∙cm−3) and higher than that of the native oak forest (1.34 g∙cm−3). In contrast, it is important to emphasize that forestation is associated with the MSP, which aims to improve water infiltration into the soil and better root development [71]. Therefore, the MSP could also have a positive effect on the amelioration of soil infiltration rates in pine forestation areas.
It is well known that soil infiltration depends on various factors in addition to the type of vegetation, such as texture [7,29], the presence of coarse particles [3], surface stoniness [73], bulk density, porosity [7,11,14,38], electrical conductivity [74], and soil organic matter [14,41]. Among the factors studied in this work, only moisture content, porosity, and texture influenced the steady-state infiltration rate, as we did not find a correlation between the infiltration rate and bulk density, clay content, or organic matter. We found that soil moisture content is negatively correlated with the infiltration rate. This content is produced when soil pores are progressively filled with water, followed by the slowing down of the infiltration capacity [75]. On the other hand, porosity and microporosity (effective porosity) positively influence soil infiltration [14]. Regarding texture, our results indicate that infiltration is positively correlated with sand content and negatively correlated with silt content. Yüksek and Yüksek [38] showed that forest plantations improved the infiltration of clay soils, compared with the infiltration of bare and degraded land in a semi-arid region of Turkey, but Mapa [7] found that clay, silt, and sand contents showed no significant differences in reforested soils, grasslands, or farmlands in Sri Lanka. In contrast, Cerdà [14] reported that clay and silt had a negative influence on soil infiltration, but a high sand content had a positive effect. In our area, we found that soils were sandy in all cases, with a higher effective porosity in the holm oak followed by the porosity of afforested pines, which in turn had the highest infiltration rates.
Accordingly, forests had the soils with the lowest curve number (CN = 25 to 55) and the maximum initial abstraction (IA = 76.2 mm to 79.5 mm), which meant that they had a lower capacity for generating surface runoff. Shrubs and grasslands had higher CN values (35 to 56 and 49 to 69, respectively) and lower IA values (60.9 mm to 35.3 mm), which meant they had a much higher capacity to generate runoff [65,66]. Therefore, we concluded that pine afforestation has a similar effect to that of native oak forests in controlling runoff in the basin, moderating flows and floods in response to heavy rainfall and enhancing groundwater. On the other hand, the transformation of the forest to shrubs or grasslands causes a greater capacity to generate runoff and, consequently, a greater impact of floods on rivers and valleys, increasing the torrential behavior of the basins.
4.2. Water Repellency
Soil hydrophobicity is usually associated with certain land uses [46,47], especially with forest land [48]. In our study, the afforestation processes resulted in much higher values than the values in unforested areas. Some authors related water repellency to the presence of organic substances in the soil [49,50], and others indicated that water repellency is independent of the amount of organic matter [45]. Bisdom et al. [76] stated that the appearance of soil hydrophobicity requires the presence of organic vegetal compounds (leaves, roots, and trunks), wrapping soil particles and forming part of the interstitial components of the soil. In addition to its relationship to organic matter content, we found that water repellency was related to bulk density, porosity, and sand and silt content. Other authors found a correlation between repellency and moisture content [77], or between repellency and other soil characteristics, such as pH, CaCO3 content, or textural fractions [63]. Moreover, we observed that soil litter in the pine forest remains in a very low degree of decomposition, due to the low temperatures in the area and the lack of abundant rainfall, which probably slow down the incorporation of fresh organic matter into the soil [78] and increase water repellency. Perhaps the recency of these afforestations could be another factor influencing hydrophobicity, but this possibility requires a longer-term study. We also observed notable differences between plots with the same type of vegetation (Figure 6), especially in afforestation areas, grasslands, and oak forests. These differences in land uses and treatments could be based on a greater or lesser livestock load, land management, forest site preparation, and the extraction of firewood and timber over time.
The hydrological consequences of water repellency are not clear [45], as the consequences depend on the amount of repellency, but repellency usually reduces infiltration capacity and increases the generation of surface runoff and soil erosion [53,54,55]. However, in our study, no relationship was found between hydrophobicity and infiltration rates. Pine afforestation areas showed the highest infiltration rates, but also the highest repellency amounts. These results seem inconsistent; however, the complexity of these processes and the large number of factors that influence them, as well as the existing circumstances of each plot (the slow decomposition of OM and the different historical evolution of land usage and management), could explain them. In addition, the method used to estimate repellency (e.g., on or below the soil surface, removing or not removing organic matter layer) can significantly change the results. It would be helpful to determine which is the better methodology to understand how water repellency is related to runoff generation and to draw sound conclusions about its real influence. In our study, we did not find any problems in carrying out the field tests for soil infiltration because of soil hydrophobicity.
4.3. Chemical Soil Properties
Several authors reported that forest restoration improves soil properties, compared with the properties of degraded land, bringing the soil closer to that of natural forests [28,37,40,42,57]. The main improvement is usually the content of organic matter due to the accumulation of plant debris from the tree canopy [37]. Other researchers showed a higher content of certain nutrients after forest restoration, such as N, P, K, Na, Ca, and Mg, [37,42,57,62].
In our study, the relict patches of native holm oak presented significant differences when compared with the rest of the vegetation types, in terms of lower soil bulk density, greater effective porosity, and higher K and Mg content. However, our 20-year-old pine afforestation area did not present significant differences, either in these ways or in the other measured variables. Nevertheless, organic matter content is very high in these recent afforestations (5.79%), compared with the content of other studied areas. For example, Chirino et al. [79] found 5.7% organic matter content in a 30-year-old pine plantation in southeastern Spain, Mongil & Navarro [27] reported 3.3% organic matter content in a 60-year-old pine reforestation area in the Duero basin (Spain), and Navarro et al. [40] found 1.11% organic matter content in an 80-year-old forest restoration area in Palencia (northern Spain). In our study, the organic matter content in the pine afforestation area (5.79%) was the lowest value, compared with that of the native oak forest (8.82%), the shrubs (7.52%) and the grasslands (6.43%).
In view of the obtained results, it seems that a forest restoration requires much more time to modify soil properties, such as fertility, because soil evolution in the past was very slow [6,59]. Moreover, the pine afforestation area studied is only 20 years old while, according to different authors, longer periods are required to establish significant changes in soil properties. For instance, Navarro et al. [40] did not find changes in soil pH, electrical conductivity, or bulk density after 80 years of gully reforestation, but they found changes in the level of some nutrients and in the organic matter content. Laudicina et al. [61] reported that some soil properties had not changed in six decades after reforestation. Likewise, in pine restoration areas on degraded land located in central Spain more than 60 years were required to change some of the physical and chemical properties of the soil [3,28].
In addition, the lower organic matter content in pine afforestation areas, compared with the content in shrub and grassland areas, could be explained by the MSP that was carried out, which caused surficial ridges, or mounding [56]. For instance, Jandl et al. [71] reported that, in general, there was a loss of carbon from soil following the MSP. In fact, mounding removed the surficial centimeters of the soil, which are richer in OM, which were mixed with the deeper mineral fraction, resulting in their accumulation at the top of the ridges. Then, the bottom of the furrows remained, without OM but with a higher soil bulk density, while the top of the ridges became poorer in OM with a lower soil bulk density than before the site preparation (Figure 9). For this reason, pine afforestation causes a reduction in OM in the short term, but in the medium or long term it is expected that OM will recover because of the permanent contribution of litter from the canopy tree.
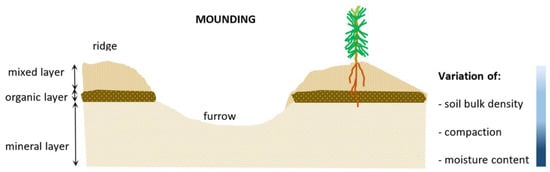
Figure 9.
Profile of the disturbed soil after forest site preparation (mounding).
4.4. Global Assessment
Our initial hypothesis was that afforestation improves hydrological conditions and soil properties, compared with the conditions and properties of grasslands and shrubs. This hypothesis has been established by the results obtained in terms of infiltration rates, but not by the results in terms of repellency and edaphic parameters, as no significant differences were obtained among these land uses. However, the results are not definitive, due to the great heterogeneity between plots of the same type of vegetation. Therefore, the sampling intensity must be increased to reduce this level of heterogeneity or to find the main causes of the differences. First, it should be emphasized that the plots for each type of land use presented enough homogeneity in terms of the type of vegetation, but also presented different historical backgrounds in terms of changes in land use, livestock density, and soil treatments, which can influence some edaphic properties. These lands have been severely affected by changes in agricultural works, livestock, and forest management carried out in different historical moments over centuries.
On the other hand, forest age is a very important factor, as the afforestation processes that were studied were relatively new (about 20 years old). Several researchers established that forest restorations require many years to affect the properties of the soil [11,28,40]. On the other hand, pedogenesis is a slow process, with a very slow evolution of soil organic matter in areas of low temperature and rainfall [78], such as the studied area. In our area, several changes have been detected in deforested and afforested land, but more years of study are needed to definitively confirm these changes, because the heterogeneity between plots is high. Mongil-Manso et al. [3] found much clearer differences in the chemical, physical, and hydrological properties of the soil in different types of land uses in a 60-year-old forest restoration in an area that was 75 km from Navalperal de Pinares. The short distance between the two zones and the similar edaphic conditions appear to indicate that forest age plays a significant role in the evolution of forested soils.
Nevertheless, we found a certain degree of evolution in the soils that was related to different types of vegetation cover. Some variables presented differing changes, such as changes in the steady-state infiltration rate, effective porosity, organic matter, the sum of bases, fertility, the hydrological soil group, the number of curves, and IA (Figure 10). In the study area, the original dense oak forest was cleared for centuries, mainly for livestock, and tree cover has finally been transformed into grasslands on a large surface. In some cases, grasslands evolved into a shrub when grazing was abandoned. In other cases, abandoned grasslands or shrub areas were forested, generating pinewood. At the same time, some changes in the edaphic and hydrological properties of the soil occurred, which were connected to land transformation. Parameters such as CN [66] and IA [67] are of great importance as indicators of the hydrological functioning of these ecosystems, as they are directly related to runoff generation. High values of CN (and low values of IA), as found in the grassland areas, indicate a high capacity to generate runoff, while small CNs (and high initial abstraction), such as those found in the pine afforestation areas and the native oak forest, imply that tree cover operates as a water sink in which most heavy rains are intercepted and infiltrated [80].
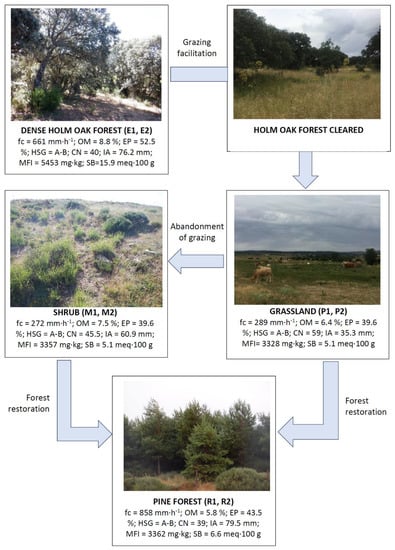
Figure 10.
Diagram of anthropic evolution of the vegetation in the study area. The original dense holm oak forest would be cleared for livestock, becoming a grassland without trees. This grassland could become a shrub area if grazing were abandoned. Both grasslands and shrubs could be forested, generating pinewood. At the same time, there would be changes in the edaphic and hydrological parameters of the soil. Abbreviations: fC = steady-state infiltration rate; HGS = hydrologic soil group; CN = curve number; IA = initial abstraction; EP = effective porosity; OM = organic matter; MFI = macrofertility index; SB = sum of bases.
The results obtained show the effects of forest restoration on land that was previously degraded by the combined actions of various human actions (agricultural works, livestock management, intense forestry use, or abandonment of land). In addition, some of these effects and factors are related to the hydrologic response of the basins and to global change. These observations will help land managers make environmental decisions regarding different land uses and foster the forest restoration of degraded lands.
5. Conclusions
Our study showed that forest restoration significantly improved water infiltration capacity in the soil. The recent pine afforestation area had significantly higher infiltration rates than those of land without trees (shrubs and grasslands) and slightly higher infiltration rates than that of the holm oak. Therefore, we concluded that forest restoration improved infiltration conditions in the forested lands of this basin. However, young pine forests presented soils with more hydrophobic conditions than oak forests, shrubs, and grasslands. It appeared that there was no relationship between soil infiltration rates and soil repellency in pine afforestation areas, which may be explained by the complexity of these two processes and the specific circumstances that affected the studied plots. For example, some of them could have been subject to different historical evolutions of land uses, the MSP for forestation, or slow decomposition of organic matter under cold and dry weather conditions, among other circumstances.
It was not possible to demonstrate clear differences between forestation areas and cleared land for the other edaphic properties. This may be a consequence of the recency of the afforestation process, as the time was still insufficient to alter the edaphic properties due to the slow speed of the edaphogenetic processes and the inadequate weather (cold and dry) conditions. Furthermore, the different historical conditions over these soils during centuries influenced soil evolution in terms of changes in land use, the intensity of livestock, forestry conditions, agricultural exploitation, and the MSP for agricultural or forestry objectives.
Ultimately, our results confirm that forest restoration plays an important role in the ecosystem services that regulate the hydrological conditions of the basins, as well as in the properties of the soil. However, the forest age and the historical evolution of the land, associated with the anthropic factor, can affect soil evolution. Greater differences can be expected if longer periods of time are studied. Work with a greater intensity of sampling to diminish plot heterogeneity and with a greater number of study cases will clarify the effects of forest restoration on land that was previously degraded by human activity. This will assist land managers in decision-making on land-use changes and their impacts on soil fertility, soil erosion, floods, carbon balance, hydrologic resources, and other environmental issues for the basins in the current scenario of global change.
Author Contributions
Conceptualization, J.M.-M. and J.N.-H.; methodology, J.M.-M., J.N.-H. and R.S.M.; data collection, J.M.-M.; statistical analysis, R.S.M.; writing—original draft preparation, J.M.-M., J.N.-H. and R.S.M.; writing—review and editing, J.M.-M., J.N.-H. and R.S.M. All authors have read and agreed to the published version of the manuscript.
Funding
This research received no external funding.
Institutional Review Board Statement
Not applicable.
Informed Consent Statement
Not applicable.
Data Availability Statement
Not applicable.
Acknowledgments
The authors express their gratitude to the Pasture Society of Navalperal de Pinares for the transfer of land for this research.
Conflicts of Interest
The authors declare no conflict of interest.
References
- García Ruiz, J.M. The effects of land uses on soil erosion in Spain: A review. Catena 2010, 81, 1–11. [Google Scholar] [CrossRef]
- Becker, A.; Bugman, H. (Eds.) Global Change and Mountain Regions. In The Mountain Research Initiative; Global Terrestrial Observing System: Stockholm, Sweden, 1999. [Google Scholar]
- Mongil-Manso, J.; Navarro-Hevia, J.; San Martín, R. Does forest restoration influence soil infiltrability? A case study in the restored woodland of Sierra de Ávila (Central Spain). J. Mt. Sci. 2021, 18, 1778–1793. [Google Scholar] [CrossRef]
- Locatelli, B. Ecosystem Services and Climate Change. In Routledge Handbook of Ecosystem Services; Potschin, M., Haines-Young, R., Fish, R., Turner, R.K., Eds.; Routledge: London, UK, 2016. [Google Scholar]
- Johnson, A.I. A Field Method for Measurement of Infiltration; Paper 1544-F; Geological Survey Water-Supply: Washington, DC, USA, 1963.
- Perkins, K.S.; Nimmo, J.R.; Medeiros, A.C. Effects of native forest restoration on soil hydraulic properties, Auwahi, Maui, Hawaiian Islands. Geophys. Res. Lett. 2012, 39, 1–4. [Google Scholar] [CrossRef] [Green Version]
- Mapa, R.B. Effect of reforestation using Tectona grandis on infiltration and soil water retention. Forest. Ecol. Manag. 1995, 77, 119–125. [Google Scholar] [CrossRef]
- Zhang, J.; Bruijnzeel, L.A.; Quiñones, C.M.; Tripoli, R.; Asio, V.B.; van Meerveld, H.J. Soil physical characteristics of a degraded tropical grassland and a ‘reforest’: Implications for runoff generation. Geoderma 2019, 333, 163–177. [Google Scholar] [CrossRef]
- Hayati, E.; Abdi, E.; Mohseni Saravi, M.; Nieber, J.L.; Majnounian, B.; Chirico, G.B.; Wilson, B.; Nazarirad, M. Soil water dynamics under different forest vegetation cover: Implications for hillslope stability. Earth Surf. Process. Landforms 2018, 43, 2106–2120. [Google Scholar] [CrossRef]
- Zwartendijk, B.W.; van Meerveld, H.J.; Ghimire, C.P.; Bruijnzeel, L.A.; Ravelona, M.; Jones, J.P.G. Rebuilding soil hydrological functioning after swidden agriculture in eastern Madagascar. Agric. Ecosyst. Environ. 2017, 239, 101–111. [Google Scholar] [CrossRef] [Green Version]
- Hrabovský, A.; Dlapa, P.; Cerdà, A.; Kollár, J. The impacts of vineyard afforestation on soil properties, water repellency and near-saturated infiltration in the Little Carpathians Mountains. Water 2020, 12, 2550. [Google Scholar] [CrossRef]
- Rahmati, M.; Weihermüller, L.; Vanderborght, J.; Pachepsky, Y.A.; Mao, L.; Sadeghi, S.H.; Moosavi, N.; Kheirfam, H.; Montzka, C.; Van Looy, K.; et al. Development and analysis of the Soil Water Infiltration Global database. Earth Syst Sci. Data 2018, 10, 1237–1263. [Google Scholar] [CrossRef] [Green Version]
- Liu, Z.; Yan, Z.; Qiu, Z.; Wang, X.; Li, J. Stability analysis of an unsaturated soil slope considering rainfall infiltration based on the Green-Ampt model. J. Mt. Sci. 2020, 17, 2577–2590. [Google Scholar] [CrossRef]
- Cerdá, A. Factors and Spatio-Temporal Variations of Infiltration in Mediterranean Ecosystems. In Scientific Monographs n. 5; Geoforma Editions: Logroño, Spain, 1995. (In Spanish) [Google Scholar]
- Bot, A.; Benites, J. The Importance of Soil Organic Matter: Key to Drought-Resistant Soil and Sustained Food Production; FAO: Rome, Italy, 2005. [Google Scholar]
- Saxton, K.E.; Rawls, W.J. Soil water characteristic estimates by texture and organic matter for hydrologic solutions. Soil Sci. Soc. Am. J. 2006, 70, 1569–1578. [Google Scholar] [CrossRef] [Green Version]
- Alaoui, A. Modelling susceptibility of grassland soil to macropore flow. J. Hydrol. 2015, 525, 536–546. [Google Scholar] [CrossRef]
- Touma, J.; Albergel, J. Determining soil hydrologic properties from rain simulator or double ring infiltrometer experiments: A comparison. J. Hydrol. 1992, 135, 73–86. [Google Scholar] [CrossRef]
- Rodrigues, R.; da Silva, J.E.; Barbosa, H.; Carbone, M.A.; Gomes, C.A.; Batista, M. Impact of an agricultural chronosequence in recharge areas of aquifers in the Brazilian savannah. Afr. J. Agric. Res. 2014, 9, 3267–3275. [Google Scholar]
- Ahirwal, J.; Kumari, S.; Singh, A.K.; Kumar, A.; Kumar, S. Changes in soil properties and carbon fluxes following afforestation and agriculture in tropical forest. Ecol. Indic. 2021, 123, 107354. [Google Scholar] [CrossRef]
- Savadogo, P.; Sawadogo, L.; Tiveau, D. Effects of grazing intensity and prescribed fire on soil physical and hydrological properties and pasture yield in the savanna woodlands of Burkina Faso. Agric. Ecosyst. Environ. 2007, 118, 80–92. [Google Scholar] [CrossRef]
- Ramos, M.C.; Lizaga, I.; Gaspar, L.; Quijano, L.; Navas, A. Effects of rainfall intensity and slope on sediment, nitrogen and phosphorous losses in soils with different use and soil hydrological properties. Agric. Water Manag. 2019, 226, 105789. [Google Scholar] [CrossRef]
- Kato, H.; Onda, Y.; Tanaka, Y.; Asano, M. Field measurement of infiltration rate using an oscillating nozzle rainfall simulator in the cold, semiarid grassland of Mongolia. Catena 2009, 76, 173–181. [Google Scholar] [CrossRef]
- Saha, R.; Tomar, J.M.S.; Ghosh, P.K. Evaluation and selection of multipurpose tree for improving soil hydro-physical behavior under hilly ecosystem of north east India. Agrofor. Syst. 2007, 69, 239–247. [Google Scholar] [CrossRef]
- Greenwood, W.J.; Buttle, J.M. Effects of reforestation on near-surface saturated hydraulic conductivity in a managed forest landscape, southern Ontario, Canada. Ecohydrology 2014, 7, 45–55. [Google Scholar] [CrossRef]
- Yu, M.; Zhang, L.; Xu, X.; Wang, Y.; Liu, W.; Schwärzel, K. Impact of land-use changes on soil hydraulic properties of Calcaric Regosols on the Loess Plateau, NW China. J. Plant Nutr. Soil Sci. 2015, 178, 486–498. [Google Scholar] [CrossRef]
- Mongil, J.; Navarro, J. Infiltration and hydrological groups of soils on the slopes of the páramos (Valladolid). Cuad. Investig. Geogr. 2012, 38, 131–153. (In Spanish) [Google Scholar] [CrossRef] [Green Version]
- Mongil-Manso, J.; Navarro-Hevia, J.; Díaz-Gutiérrez, V.; Cruz, V.; Ramos-Diez, I. Badlands forest restoration in Central Spain after 50 years under a Mediterranean-continental climate. Ecol. Eng. 2016, 97, 313–326. [Google Scholar] [CrossRef]
- Lozano-Baez, S.E.; Cooper, M.; Meli, P.; Ferraz, S.F.B.; Rodrigues, R.R.; Sauer, T.J. Land restoration by tree planting in the tropics and subtropics improves soil infiltration, but some critical gaps still hinder conclusive results. For. Ecol. Manag. 2019, 444, 89–95. [Google Scholar] [CrossRef]
- Gilmour, D.A.; Bonell, M.; Cassells, D.S. The effects of forestation on soil hydraulic properties in the Middle Hills of Nepal: A Preliminary Assessment. Mt. Res. Dev. 1987, 7, 239–249. [Google Scholar] [CrossRef]
- Buczko, U.; Bens, O.; Hüttl, R.F. Water infiltration and hydrophobicity in forest soils of a pine-beech transformation chronosequence. J. Hydrol. 2006, 331, 383–395. [Google Scholar] [CrossRef]
- Bens, O.; Wahl, N.A.; Fischer, H.; Hüttl, R. Water infiltration and hydraulic conductivity in sandy cambisols: Impacts of forest transformation on soil hydrological properties. Eur. J. For. Res. 2007, 126, 101–109. [Google Scholar] [CrossRef]
- Ilstedt, U.; Malmer, A.; Elke, V.; Murdiyarso, D. The effect of afforestation on water infiltration in the tropics: A systematic review and meta-analysis. For. Ecol. Manag. 2007, 251, 45–51. [Google Scholar] [CrossRef]
- Alaoui, A.; Caduff, U.; Gerke, H.H.; Weingartner, R. Preferential flow effects on infiltration and runoff in grassland and forest soils. Vadose Zone J. 2011, 10, 367–377. [Google Scholar] [CrossRef]
- Zhang, J.; Lei, T.; Qu, L.; Chen, P.; Gao, X.; Chen, C.; Yuan, L.; Zhang, M.; Su, G. Method to measure soil matrix infiltration in forest soil. J. Hydrol. 2017, 552, 241–248. [Google Scholar] [CrossRef]
- van Meerveld, H.J.; Jones, J.P.G.; Ghimire, C.P.; Zwartendijk, B.W.; Lahitiana, J.; Ravelona, M.; Mulligan, M. Forest regeneration can positively contribute to local hydrological ecosystem services: Implications for forest landscape restoration. J. Appl. Ecol. 2021, 58, 755–765. [Google Scholar] [CrossRef]
- Zheng, H.; Ouyang, Z.Y.; Wang, X.K.; Zhao, T.Q.; Peng, T.B. How different reforestation approaches affect red soil properties in Southern China. Land Degrad. Dev. 2005, 16, 387–396. [Google Scholar] [CrossRef] [Green Version]
- Yüksek, T.; Yüksek, F. The effects of restoration on soil properties in degraded land in the semi-arid region of Turkey. Catena 2011, 84, 47–53. [Google Scholar] [CrossRef]
- Fields-Johnson, C.W.; Zipper, C.E.; Burger, J.A.; Evans, D.M. Forest restoration on steep slopes after coal surface mining in Appalachian USA: Soil grading and seeding effects. For. Ecol. Manag. 2012, 270, 126–134. [Google Scholar] [CrossRef]
- Navarro, J.; Araújo, J.C.; Mongil, J. Assessment of 80 years of ancient-badlands restoration in Saldaña, Spain. Earth. Surf. Process. Landf. 2014, 39, 1563–1575. [Google Scholar] [CrossRef]
- Sun, D.; Yang, H.; Guan, D.; Yang, M.; Wu, J.; Yuan, F.; Jin, C.; Wang, A.; Zhang, Y. The effects of land use change on soil infiltration capacity in China: A meta-analysis. Sci. Total Environ. 2018, 626, 1394–1401. [Google Scholar] [CrossRef]
- Bierbaß, P.; Wündsch, M.; Michalzik, B. The impact of vegetation on the stability of dispersive material forming biancane badlands in Val d’Orcia, Tuscany, Central Italy. Catena 2014, 113, 260–266. [Google Scholar] [CrossRef]
- Ludwig, J.A.; Wilcox, B.P.; Breshears, D.D.; Tongway, D.J.; Imeson, A.C. Vegetation patches and runoff–erosion as interacting ecohydrological processes in semiarid landscapes. Ecology 2005, 86, 288–297. [Google Scholar] [CrossRef] [Green Version]
- Leigh, D.S.; Gragson, T.L.; Coughlan, M.R. Chronology and pedogenic effects of mid-to late-Holocene conversion of forests to pastures in the French western Pyrenees. Z. Für Geomorphol. 2015, 59, 225–245. [Google Scholar] [CrossRef]
- Ceballos, A.; Ferreira, A.J.D.; Coelho, C.O.A.; Boulet, A.K. Analysis of water repellency in a small hydrographic basin affected by controlled fire in the central mountain area of Portugal. Pirineos 1999, 153–154, 123–143. (In Spanish) [Google Scholar] [CrossRef] [Green Version]
- Doerr, S.H. Soil Hydrophobicity: A Review n° 5; Aveiro-Swansea Erosion Research Bulletin: Aveiro, Portugal, 1997. [Google Scholar]
- Bodí, M.B.; Cerdà, A.; Mataix-Solera, J.; Doerr, S.H. Water repellency in forest soils affected by fires and in agricultural soils under different management and abandonment. Cuad. Investig. Geogr. 2012, 38, 53–74. (In Spanish) [Google Scholar] [CrossRef] [Green Version]
- Alagna, V.; Iovino, M.; Bagarello, V.; Mataix-Solera, J.; Lichner, L. Application of minidisk infiltrometer to estimate water repellency in Mediterranean pine forest soils. J. Hydrol. Hydromech. 2017, 65, 254–263. [Google Scholar] [CrossRef] [Green Version]
- Doerr, S.H.; Llewellyn, C.T.; Douglas, P.; Morley, C.P.; Mainwaring, K.A.; Haskins, C.; Johnsey, L.; Ritsema, C.J.; Stagnitti, F.; Allinson, G.; et al. Extraction of compounds associated with water repellency in sandy soils of different origin. Soil Res. 2005, 43, 225–237. [Google Scholar] [CrossRef]
- García, F.J.M.; Dekker, L.W.; Oostindie, K.; Ritsema, C.J. Water repellency under natural conditions in sandy soils of southern Spain. Soil Res. 2005, 43, 291–296. [Google Scholar] [CrossRef]
- York, C. Water repellent soils as they occur on UK golf greens. In International Workshop on Soil Water Repellency: Origins, Assessment, Occurrence, Consequences, Modelling and Amelioration; DLO Winand Staring Centre for Integrated Land Soil and Water Research: Wageningen, The Netherlands, 1998. [Google Scholar]
- Rodríguez-Alleres, M.; Varela, M.E.; Benito, E. Natural severity of water repellency in pine forest soils from NW Spain and influence of wildfire severity on its persistence. Geoderma 2012, 191, 125–131. [Google Scholar] [CrossRef]
- Imeson, A.C.; Verstraten, J.M.; van Mulligen, E.J.; Sevink, J. The effects of fire and water repellency on infiltration and runoff under Mediterranean type forests. Catena 1992, 19, 345–361. [Google Scholar] [CrossRef]
- Doerr, S.H.; Ferreira, A.J.D.; Walsh, R.P.D. Soil water repellency as a potential parameter in rainfall-runoff modelling: Experimental evidence at point to catchment scales from Portugal. Hydrol. Process. 2003, 17, 363–377. [Google Scholar] [CrossRef]
- Lowe, M.A.; McGrath, G.; Leopold, M. The impact of soil water repellency and slope upon runoff and erosion. Soil Tillage Res. 2021, 205, 104756. [Google Scholar] [CrossRef]
- Löf, M.; Dey, D.C.; Navarro, R.M.; Jacobs, D.F. Mechanical site preparation for forest restoration. New For. 2012, 43, 825–848. [Google Scholar] [CrossRef]
- Zhang, Y.; Zhou, Z.; Cheng, J.; Zhang, H. Soil quality and plant diversity inmanaged forest in the hilly purple soil Southwestern China. J. Food Agric. Environ. 2013, 11, 945–951. [Google Scholar]
- Medeiros, P.H.A.; Güntner, A.; Franke, T.; Mamede, G.L.; de Araújo, J.C. Modelling spatio-temporal patterns of sediment yield and connectivity in a semi-arid catchment with the WASA-SED model. Hydrol. Sci. J. 2010, 55, 636–648. [Google Scholar] [CrossRef] [Green Version]
- Vallauri, D.R.; Aronson, J.; Barbero, M. An analysis of forest restoration 120 years after reforestation on badlands in the Southwestern Alps. Restor. Ecol. 2002, 10, 16–26. [Google Scholar] [CrossRef]
- Vallauri, D.; Grossi, J.L.; Brun, J.J. Les communautés lombriciennes 120 ans après la restauration forestière de sols érodés sur marnes. Life Sci. 1998, 321, 1023–1033. [Google Scholar] [CrossRef]
- Laudicina, V.A.; De Pasquale, C.; Conte, P.; Badalucco, L.; Alonzo, G.; Palazzolo, E. Effects of afforestation with four unmixed plant species on the soil-water interactions in a semiarid Mediterranean region (Sicily, Italy). J. Soils Sediments 2012, 12, 1222–1230. [Google Scholar] [CrossRef]
- Carter, C.T.; Ungar, I.A. Aboveground vegetation, seed bank and soil analysis of 31-year-ols forest restoration on coal mine spoil in Southeastern Ohio. Am. Midl. Nat. 2002, 147, 44–59. [Google Scholar] [CrossRef]
- Korenkova, L.; Simkovic, I.; Dlapa, P.; Urik, M. Statistical assessment of relationship between water repellency and selected properties of forest topsoil in the white Carpathian mts. Carpathian J. Earth Environ. Sci. 2016, 11, 405–414. [Google Scholar]
- Briggs, L.J.; Shantz, H.L. The Wilting Coefficient for Different Plants and Its Indirect Determination. In USDA Bureau of Plant Industry Bull 230; US Government Printing Office: Washington, DC, USA, 1912. [Google Scholar]
- NRCS. Hydrologic Soil Groups. In National Engineering Handbook, Part 630 Hydrology; Natural Resources Conservation Service: Washington, DC, USA, 2009; Chapter 7. [Google Scholar]
- NRCS. Hydrologic Soil-Cover Complexes. In National Engineering Handbook, Part 630 Hydrology; Natural Resources Conservation Service: Washington, DC, USA, 2004; Chapter 9. [Google Scholar]
- NRCS. Estimation of Direct Runoff from Storm Rainfall. In National Engineering Handbook, Part 630 Hydrology; Natural Resources Conservation Service: Washington, DC, USA, 2004; Chapter 10. [Google Scholar]
- Bessi, D.; Okamoto, M.; Aranha, L.; Correa, K.J.P.; Tonello, K.C. Forest restoration and hydrological parameters effects on soil water conditions: A structural equation modelling approach. Rev. Bras. Recur. Hidr. 2018, 23, 41. [Google Scholar] [CrossRef] [Green Version]
- Gajic, B.; Dugalic, G.; Sredojevic, Z.; Tomic, Z. Effect of different vegetation types on infiltration and soil water retention. Cereal. Res. Commun. 2008, 36, 991–994. [Google Scholar]
- Ghimire, C.P.; Bruijnzeel, L.A.; Bonell, M.; Coles, N.; Lubczynski, M.; Gilmour, D.A. The effects of sustained forest use on hillslope soil hydraulic conductivity in the Middle Mountains of Central Nepal. Ecohydrology 2014, 7, 478–495. [Google Scholar] [CrossRef]
- Jandl, R.; Lindner, M.; Vesterdal, L.; Bauwens, B.; Baritz, R.; Hagedorn, F.; Johnson, D.W.; Minkkinen, K.; Byrne, K.A. How strongly can forest management influence soil carbon sequestration? Geoderma 2007, 137, 253–268. [Google Scholar] [CrossRef]
- Daddow, R.L.; Warrington, G.E. Growth-Limiting Soil Bulk Densities as Influenced by Soil Texture; WSDG Report USDA Forest Service: Denver, CO, USA, 1993.
- Cerdà, A. Effects of rock fragment cover on soil infiltration, interrill runoff and erosion. Eur. J. Soil Sci. 2001, 52, 59–68. [Google Scholar] [CrossRef]
- Heydari, N.; Das Gupta, A.; Loof, R. Salinity and sodicity influences on infiltration during surge flow irrigation. Irrig. Sci. 2001, 20, 165–173. [Google Scholar] [CrossRef]
- Daly, E.; Porporato, A. A Review of soil moisture dynamics: From rainfall infiltration to ecosystem response. Environ. Eng. Sci. 2005, 22, 9–24. [Google Scholar] [CrossRef]
- Bisdom, E.B.A.; Dekker, L.W.; Schoute, J.F.T. Water repellent of sieve fractions from sandy soils and relationships with organic material and soil structure. Geoderma 1993, 56, 105–118. [Google Scholar] [CrossRef]
- Regalado, C.M.; Ritter, A. Characterizing water dependent soil repellency with minimal parameter requirement. Soil Sci. Soc. Am. J. 2005, 69, 1955–1966. [Google Scholar] [CrossRef]
- Tian, J.; He, N.; Hale, L.; Niu, S.; Yu, G.; Liu, Y.; Blagodatskaya, E.; Kuzyakov, Y.; Gao, Q.; Zhou, J. Soil organic matter availability and climate drive latitudinal patterns in bacterial diversity from tropical to cold temperate forests. Funct. Ecol. 2018, 32, 61–70. [Google Scholar] [CrossRef]
- Chirino, E.; Bonet, A.; Bellot, J.; Sánchez, J.R. Effects of 30-year-old Aleppo pine plantations on runoff, soil erosion, and plant diversity in a semi-arid landscape in south eastern Spain. For. Ecol. Manag. 2006, 224, 199–225. [Google Scholar] [CrossRef]
- Mongil, J.; Martín, L.T.; Navarro, J.; Martínez de Azagra, A. Vegetation series, curve numbers and soil water availabilities. Application to forest restoration in drylands. For. Syst. 2012, 21, 53–63. [Google Scholar] [CrossRef] [Green Version]
Publisher’s Note: MDPI stays neutral with regard to jurisdictional claims in published maps and institutional affiliations. |
© 2022 by the authors. Licensee MDPI, Basel, Switzerland. This article is an open access article distributed under the terms and conditions of the Creative Commons Attribution (CC BY) license (https://creativecommons.org/licenses/by/4.0/).