Abstract
Highway infrastructure construction is regarded as one of the effective policy tools used to promote the flow of production factors and upgrade the industrial structure in China, and it may also be an important precondition to improving Cultivated Land Use Efficiency (CLUE). This paper uses a slack-based model (SBM) based on provincial-level panel data from China from 2004 to 2017 to measure CLUE. Then a dynamic spatial Durbin model and a panel threshold regression model were established to analyze the spatial spillover effect and threshold effect of highway infrastructure construction on CLUE. The results showed that the CLUE of China has a fluctuating but overall rising trend. The dynamic spatial Durbin model demonstrated that the Chinese government’s policy of supporting highway infrastructure construction has played an important role in promoting CLUE by spatial spillover effects, and the driving effect of expressways and first–second highways on CLUE is particularly significant in this regard. More interestingly, the results of the panel threshold regression indicated that there is a single threshold effect in the influence of highway infrastructure construction on CLUE. This paper suggested that the spatial correlation between regions should be considered in the construction of regional highway infrastructure and land use planning to improve CLUE. Moreover, the planning of highway infrastructure construction should be balanced according to the actual demand of economic and agricultural development, so as to promote the full flow and reasonable allocation of cultivated land use factors among regions.
1. Introduction
Cultivated land is often mentioned as the foundation of food production and human survival, which is directly related to national food security, ecological security, and social stability [1,2]. In 2017, the total area of cultivated land in China was lower than the global level [3]. The shortage of cultivated land is particularly problematic given China’s steadily increasing population. There is, therefore, a pressing need to improve cultivated land use efficiency (CLUE) as an effective way to ensure national food security. As far as cultivated land use efficiency is concerned, growth is due, to a large extent, to changes in the input factors [4]. Since 2009, in order to alleviate the negative impact of the 2008 Financial Crisis, the Chinese government has taken transportation infrastructure construction as an important part of government investment policy. Within this, highway infrastructure construction has become one of the key undertakings of the Chinese government to “grasp people’s livelihood, strengthen security, and increase well-being” and constitutes an important part of transportation infrastructure construction. China has made outstanding achievements in the field of highway infrastructure construction. According to China Transportation Yearbook, the mileage of China’s highways has increased from less than 100,000 km in 1949 to more than 5 million kilometers in 2020. With the support of China’s unique land ownership system and the fact that Chinese local governments attach great importance to road infrastructure construction, China’s highway infrastructure construction has an easier time obtaining land resource use rights than those of other countries. The occupation of cultivated land for highway infrastructure construction is one of the reasons for the decrease in the amount of cultivated land. Despite this, highway infrastructure construction also facilitates the transfer of input factors for CLUE between regions and upgrades the industrial structure [5,6]. Therefore, highway infrastructure construction may affect the CLUE.
CLUE reflects the rationality of the allocation of various resources invested in cultivated land space and the degree to which the value of cultivated land production output is realized [4]. At present, much research has been conducted on CLUE, and most of these studies make use of data envelopment analysis (DEA) [7,8], the sequential generalized directional distance function (SGDDF) [9], and the slack-based model (SBM) [10,11,12,13] to quantify the cultivated land use efficiency. Using these tools, scholars have analyzed the key factors that affect CLUE from different perspectives, such as farmers’ behavior [14], government intervention [15], land pricing [16], and economic transition [17].
Existing studies have also explored the driving forces of CLUE. The primary forces driving improvements in CLUE are the increase of material input, the progress of agricultural technology, the realization of agricultural economies of scale, and the reductions of economic inefficiency [18]. Among the driving factors of CLUE, highway infrastructure construction is an important precondition [19,20]. As a material input, modernized highway infrastructure construction could promote the regional flow of labor and goods and the spread of technology and knowledge.
Existing studies have summarized the specific ways in which highway infrastructure construction affects CLUE into two aspects. First, highway infrastructure construction could affect CLUE by shortening the travel time between urban and rural areas and promoting the non-agriculturalization of agricultural labor [21,22,23]. Second, highway infrastructure construction is conducive to the widespread use of agricultural technology, especially agricultural machinery. Mottaleb et al. [24] surveyed 814,100 farmers in Bangladesh and found that road infrastructure affects the availability of agricultural machinery and affects farmers’ decision to purchase agricultural machinery and equipment. As a typical labor-saving technology, agricultural machinery can reduce total worker hours and improve CLUE [25,26,27]. On this basis, scholars have empirically verified the impact of highway infrastructure construction on the CLUE. For example, Mamatzakis et al. [28] pointed out that outdated highway infrastructure construction is an important factor that restricts the improvement of CLUE. Zhang [29] demonstrated that the inconvenience of highways has a negative impact on CLUE by increasing the highway transaction cost of farmers and hindering the dissemination of information. Branco et al. [30] proposed that reasonable highway infrastructure construction of Brazil could increase the output of corn and cotton by 66%.
As can be seen above, previous studies have carried out research on the impact of highway infrastructure construction on CLUE. However, this work still needs to be further improved and deepened. On the one hand, the similarity of natural conditions such as precipitation, temperature and the mobility of factor input in a certain region may cause the spatial convergence of cultivated land use. Meanwhile, the network characteristics of highway infrastructure construction make it possible for a region to construct a highway which results in spatial spillover effects that impact CLUE in neighboring regions [31,32,33]. If the spatial spillover effects are not considered, it may not be possible to accurately determine the impact of highway infrastructure construction on CLUE. On the other hand, most of the existing literature assumes that there is a linear relationship between highway infrastructure construction and CLUE [30,34]. However, some research found that the impact of highway infrastructure construction on social and economic development has significant non-linear characteristics. Lin et al. [35] pointed out that the influence of highway infrastructure on effective energy services in the context of income heterogeneity shows a nonlinear rising characteristic. Wang et al. [36] proposed that highway infrastructure construction positively affects industrial energy efficiency only when a certain threshold is exceeded. In the field of cultivated land use, although most studies proposed that highway infrastructure construction has a positive impact on CLUE, some studies have also put forward different views. Bongalia [37] examined Italy as a region and found that the highway infrastructure did not significantly promote cultivated land output. Fan et al. [38] found that the contribution of highway infrastructure construction to cultivated land output was negative based on the data from the China Agricultural Census. Therefore, the nonlinear characteristics of the impact of highway infrastructure construction on cultivated land use efficiency need to be verified.
Above all, this paper mainly solves two problems: (1) Does highway infrastructure construction have spatial spillover effects on CLUE? (2) Is there a threshold effect on the impact of highway infrastructure construction on CLUE? In order to solve these two problems, this paper firstly used a slack-based model (SBM), based on data from China’s provincial panel from 2004 to 2017, to quantify CLUE. Then, a dynamic spatial Durbin model was used to study the spatial spillover effect of highway infrastructure construction on CLUE. Lastly, a panel threshold model that considered the spatial spillover effects of highway infrastructure construction was built to analyze the nonlinear relationship between highway infrastructure construction and CLUE.
2. Materials and Methods
2.1. Mechanism Framework
2.1.1. The Effects of Highway Infrastructure Construction on CLUE
CLUE essentially refers to obtaining as much output as possible with as little resource input as possible. Under the realistic background of limited arable land resources which are occupied and turned into construction land to support urban development, improving the CLUE is the “key pulse” of agricultural development. According to the theory of spatial econometrics [39], the impact of highway infrastructure construction on CLUE can be divided into the direct effect on the local unit and the spatial spillover effect on the surrounding unit. This paper summarizes the effect of highway infrastructure construction on CLUE with the following aspects (Figure 1).
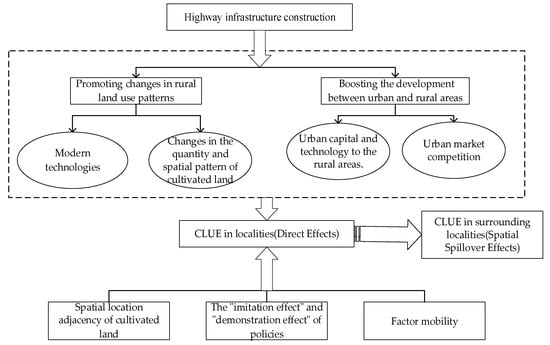
Figure 1.
Spatial spillover effects of highway infrastructure construction on CLUE.
- (1)
- Direct effects of highway infrastructure construction on CLUE
Highway infrastructure construction affects CLUE by promoting changes in rural land use patterns. Firstly, China’s urban development has created a large number of non-agricultural employment opportunities. The construction of a highway infrastructure has changed the travel conditions of rural labor and promoted the non-agricultural transfer of agricultural labor. Subsequently, the non-agricultural transfer of rural labor has increased labor costs, and farmers will use agricultural machinery, chemical fertilizers or other agricultural technical means to replace labor. Modern technologies such as agricultural mechanization could also significantly improve CLUE [33]. Meanwhile, the occupation of cultivated land for highway infrastructure construction reduced the amount of cultivated land, which could also promote farmers to change the factor input structure. Additionally, the construction of highway infrastructure linearly cuts the cultivated landscape, aggravating the fragmentation of the land. Land fragmentation increases the cost of labor commuting between plots and is not conducive to the use of agricultural machinery and equipment. From this perspective, land fragmentation caused by road infrastructure construction may inhibit the improvement of CLUE.
The construction of highway infrastructure also boosts the development between urban and rural areas and affects the CLUE. Highway infrastructure shortens commuting distances between urban and rural areas, which creates favorable conditions for bringing urban capital and technology to the rural areas. Driven by urban capital and technology, rural agricultural production methods and land management methods will be further innovated. At the same time, the construction of highway infrastructure is also conducive to the immediate transportation of rural agricultural products to urban markets for sale and promotes market competition. Farmers will also improve the utilization of cultivated land by using modern technical means, reduce production costs and obtain more benefits, thereby affecting CLUE.
- (2)
- Spatial effects of highway infrastructure construction on CLUE
The spatial location adjacency of cultivated land strengthens the spatial correlation between the cultivated land use of multiple cultivated land plots. Due to the adjacent positions of each swath of cultivated land, the use of chemical fertilizers and pesticides by farmers in one plot could affect the surrounding cultivated land plots under the influence of natural factors such as wind and water flow. Additionally, if the farmers in the surrounding plots have used modern technology to improve the CLUE, then the farmers in the local plots may also adopt the same methods. These instances improve the spatial linkage of cultivated land use efficiency.
There are “imitation effect” and “demonstration effect” of policies among local governments. At present, under the incentives of fiscal benefits, taxation and political promotion, Chinese local governments are willing to learn from the successful experiences of neighboring governments in the process of formulating public policies [40,41,42]. Therefore, the government of surrounding units has improved the CLUE and achieved economic growth through the reasonable formulation of highway infrastructure construction planning and land use policy, and the government of local units may also formulate similar development strategies. As a result, the spatial correlation of the impact of highway infrastructure construction on the CLUE may also be enhanced.
Highway infrastructure construction has driven factor mobility. The input factor system and output factor system coexist in the cultivated land space in the process of cultivated land use. The highway infrastructure has network attribute. Relying on highway infrastructure construction, various elements can flow across regions in geographic space. Specifically, the construction and improvement of highway infrastructure improves the accessibility of rural areas, which creates convenient conditions for agricultural machinery cross-regional services. The cross-regional service of agricultural machinery has also caused agricultural machinery to affect the cultivated land use in surrounding areas [43,44]. Meanwhile, the process of highway infrastructure construction promoting agricultural machinery cross-regional services is also accompanied by the flow of agricultural labor. Agricultural labor exchanges knowledge and technology of farmland use and management, realizing knowledge spillover and technology diffusion [36,45]. As a result, by promoting agricultural labor mobility, highway infrastructure construction has indirectly improved the farmland operation and management methods in surrounding areas, and thus realized the improvement of CLUE.
Above all, this paper proposes that while highway infrastructure construction has a direct effect on the CLUE in local units, it also has a spatial spillover effect on the CLUE in surrounding units.
2.1.2. Threshold Effect of Highway Infrastructure Construction on CLUE
Whether public investment activities, including highway infrastructure construction, could lead to permanent economic growth or temporary growth has always been the subject of discussion by scholars [35,46]. Scholars proposed that the increase in productive public capital investment could lead to a short period of high investment, and as time goes by, investors’ return on capital and investment motivation will further decline, leading to a slowdown in capital accumulation and economic growth [46]. Highway infrastructure construction has a positive impact on the CLUE by promoting the flow of factors in such a way as to realize the rational allocation of factors [29,30]. However, when highway infrastructure construction reaches a certain level, policy, culture, economy, technology and other deep factors will promote the CLUE more significantly than highway infrastructure construction [47]. Moreover, with limited government financial support, excessive highway infrastructure construction needs to reduce rural education, medical, health and other types of rural capital investment [48]. This is not conducive to the improvement of CLUE.
Therefore, this paper proposes that as highway infrastructure construction reaches a certain value, the promotion effect of highway infrastructure construction on CLUE will be weakened. That is to say, the impact of highway infrastructure construction on CLUE is non-linear.
2.2. Indicators and Variable Selection
2.2.1. Explained Variable—CLUE
CLUE is operatively linked to the ratio of developed land area to the number of resident inhabitants [49]. Previous studies have established a relatively complete and mature evaluation index system for CLUE [11,12]. The measurement of CLUE could be divided into two parts: input and output (Table 1). Land, labor and material production factors are generally regarded as the most basic input factors of CLUE. Specifically, cultivated land area is used to represent land input; the number of agricultural laborers is used to represent labor input; the input of material production factors includes agricultural machinery, chemical fertilizer, pesticide, agricultural plastic film, the total power of agricultural machinery, the amount of chemical fertilizer applied, the amount of pesticide used, and the amount of agricultural plastic film used. Output refers to the economic benefits generated by cultivated land use. For this study, the total output value of agriculture and the total output of grain are used to represent the output.

Table 1.
The indicators of CLUE.
2.2.2. Key Explanatory Variable
Due to the fact that highway infrastructure construction is more widely distributed in China’s rural areas than railways, water transport, and air transport, highway infrastructure construction has become the main flow carrier of the production factors of cultivated land use and agricultural products [34]. For this reason, this paper mainly explores the impact of highway infrastructure construction on CLUE.
Highway infrastructure construction is represented by highway density (highway mileage in km/land area in administrative area in km2.), this index makes it possible to compare the level of highway infrastructure in different provinces regardless of size [50,51]. Moreover, highway infrastructure density can more accurately reflect the convenience of highway infrastructure than simple highway mileage or highway infrastructure investment can. Highways in China also differ in pavement quality and traffic capacity. On this basis, highways can be divided into expressways, first highways, second highways, third highways and fourth highways (Table 2).
Table 2.
Classification of highways in China.
In order to facilitate the calculation, we combined the mileage of the first highways and the second highways into one category (first–second highway), and the mileage of the third highways and the fourth highways into one category (third–fourth highway). This study calculates the densities of these classes separately to better analyze their impact on CLUE. As there is no mileage data on third–fourth highways in the statistical yearbook, the following formula was used to estimate it [52]:
In the formula, denotes third–fourth highway mileage; denotes total class highway mileage; denotes expressway mileage; denotes first–second highways; represents province; and represents year.
2.2.3. Control Variables
Control variables include the main factors affecting CLUE. These are:
Agricultural Agglomeration: Agricultural agglomeration refers to the process of agglomerating agricultural production resources to a specific range; which could reflect the main characteristics of the centralization of factor distribution and production intensification. Agricultural agglomeration promotes CLUE through sharing; matching; and learning [53]. The average degree of geographical agglomeration of the agricultural industry could measure the regional agricultural agglomeration level and reflect the agricultural agglomeration degree. Thereby; this paper chooses the average degree of geographical agglomeration of the agricultural industry to measure agricultural agglomeration. This measure is calculated as follows:
In the formula, represents the average degree of geographical agglomeration of the agricultural industry; represents the output of agricultural production in a particular province; represents the output of agricultural production for the whole country; and represents the type of agricultural production (i.e., rice, wheat or corn).
Non-agricultural employment: The non-agriculturalization of agricultural labor forces farmers to use agricultural machinery and agricultural technology to replace agricultural labor, thereby affecting the CLUE [29]. This is calculated as
In the formula, denotes the level of non-agricultural employment; denotes the number of rural employees; and denotes the number of agricultural employees.
Regional economic development level: The regional economic development level is represented by the per capita GDP.
Multiple crop index: The multiple crop index is calculated as the ratio of the planting area of crops to the total cultivated area. This variable can reflect the influence of natural geographical conditions on CLUE [12]. The ratio of crop sown area to cultivated land area is used to represent it.
2.3. Methods
2.3.1. Slack-Based Model (SBM)
One of the mainstream tools used to quantify CLUE is data envelopment analysis (DEA). However, the DEA model mainly measures CLUE from radial or depth, and it does not consider the relaxation of input–output. Therefore, the results of DEA are not accurate [54]. The Slack-Based Model (SBM) effectively solves the above problems, as a result of two characteristics. First, the results of efficiency measurements are not affected by the units used to measure input and output items. Second, the differences between the efficiency value and each input and output are monotonically decreasing [55]. The SBM model quantifies the efficiency of DMU with inputs and outputs. The basic form of the SBM model is as follows:
In the formula, the value range of the objective function is [0, 1]. , are the total input and output of the -th decision-making unit, respectively. For a specific evaluated unit, when ,, that is to say, the CLUE is effective when . On the other hand, when at least one of , is not equal to zero, the CLUE is inefficient, and it is necessary to improve input–output.
2.3.2. Dynamic Spatial Durbin Model
The main purpose of the study is to analyze the spatial spillover effects of highway infrastructure construction on CLUE. Existing research mainly investigates the spatial spillover effect of highway infrastructure construction by constructing a spatial Durbin model [32,56]. However, the methods of cultivated land management may be influenced by the past experience of farmers [52], and the existing spatial Durbin model cannot reflect the dynamics in time. A dynamic spatial Durbin model with time and spatial lag terms for the explained variables is the best method for exploring such a system [57]. The dynamic spatial Durbin model has no restriction on the model setting form of the potential spatial spillover effect. The dynamic spatial Durbin model of CLUE is set as follows:
In the formula, represents province; represents year; represents cultivated land use efficiency; represents the first-order lag of cultivated land use efficiency; represents the spatial lag of CLUE; represents key explanatory variables—highway density; represents the spatial lag of the key explanatory variables; denotes the spatial weight matrix; denotes the individual effect of province ; denotes time effects; and denotes the random error term.
However, results from the spatial Durbin model cannot directly represent the marginal influence of explanatory variables. If one wants to compare and analyze the different effects of each explanatory variable, one should calculate the direct effect and indirect effect using the method of partial differential solution based on the spatial Durbin model [57]. It should be noted that the direct effect reflects the influence of highway infrastructure construction on CLUE in a specific local province. The indirect effect, also known as the spatial spillover effect, reflects the impact of highway infrastructure construction in a particular province on the CLUE in neighboring provinces. The total effect is the sum of the direct and indirect effects. Meanwhile, the effects can be divided into long-term effects (LE) and short-term effects (SE) across the time dimension [39]. Thereby, the effects of the dynamic spatial Durbin model can be divided into six parts: LE_direct, SE_direct, LE_indirect, SE_indirect, LE_total and SE_total.
2.3.3. Panel Threshold Regression Model
According to the above theoretical analysis, the impact of highway infrastructure construction on the CLUE may show a non-linear relationship due to the difference in the level of highway infrastructure construction; that is, there is a threshold effect. The threshold effect is a phenomenon that causes a sudden change in the direction or quantity of another economic parameter after the economic output reaches a certain critical value [58]. This critical value is the threshold value. The panel threshold model proposed by Hansen has become an important model tool for scholars to explore the threshold effect [10,59]. Meanwhile, this paper considers that highway infrastructure construction may have spatial spillover effects on CLUE. Therefore, the sum of highway density and the spatial lag of highway density in other provinces were chosen as threshold variables and as threshold explanatory variables. According to the research of Hansen [58], the model is as follows:
In the formula, , denote the estimated coefficient; represents the threshold variable; , represents threshold values; represents the specified objective function; could be used to reflect the unobserved characteristics of an individual; and denotes random disturbance.
2.4. Data Resources
The research time of this paper is from 2004 to 2017, and the following factors are mainly considered: (1) from 1995 to 2004 (Figure 2), the total mileage of China’s highways was basically maintained within 1 to 2 million kilometers, and the total mileage of highways increased by 6.16% annually. However, as the “Tenth Five-Year Plan” (2001–2005) proposed to improve a smooth, safe, and convenient modern comprehensive highway system, China’s highway infrastructure construction has entered into a period of rapid development since 2004. By the end of the Tenth Five-Year Plan (2005), China’s total highway mileage increased from 1.698 million kilometers in 2001 to 3.3452 million kilometers. Therefore, this paper chooses 2004 as the starting year of the study. (2) Cultivated land area is one of the main evaluation indicators of cultivated land use efficiency. The current China Rural Statistical Yearbook has been updated to 2019, but even in the 2019 China Rural Statistical Yearbook, only the area of cultivated land in 2017 can be obtained. Therefore, the end year of this study is 2017.
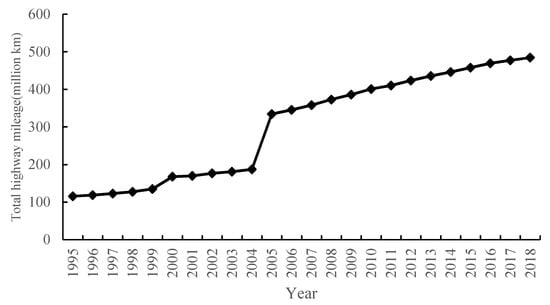
Figure 2.
Highway mileage change trend.
Thirty-four provinces, municipalities, and autonomous regions make up China. Based on the availability of data, this paper takes 31 Chinese mainland provinces as research units for the period from 2004–2017 (Taiwan, Hong Kong, and Macau, important parts of China, are not included in this study). The data used in this study came from the China Statistical Yearbook, China Rural Statistical Yearbook and China Traffic Statistics Yearbook for the years 2004–2017. The descriptive statistics of these variables are shown in Table 3.
Table 3.
Descriptive statistics of the data.
3. Results and Discussion
3.1. The Results of CLUE
With the help of the SBM-oriented module in the DEA solver Pro 5 software, the value of CLUE was obtained for each province of China (Figure 3). With regard to time, the CLUE shows an overall rising trend, but with some fluctuation (there was a slight downward trend in 2006, 2009 and 2014). Above all, with the development of social economy and the improvement of farmland use technology, the average index of CLUE increased from 0.59 in 2004 to 0.88 in 2017, with an average annual growth rate of 3.34%.
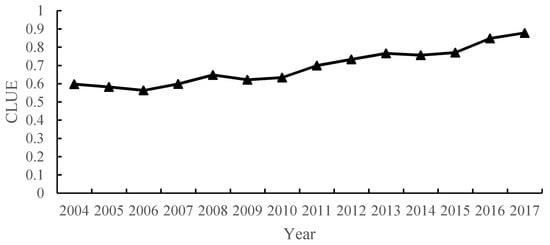
Figure 3.
The changing trend of CLUE.
When the data is examined at the province level (Table 4), it is found that from 2004–2017 nearly all provinces saw an increase in CLUE to some degree. The exceptions are Inner Mongolia (where CLUE decreased slightly) and Jilin and Guizhou (where CLUE remained the same). Tianjin, Zhejiang, Hubei and Beijing are the provinces with the fastest efficiency improvements, with respective increasing ranges of 0.58, 0.57, 0.51 and 0.50. Meanwhile, in most years, the CLUE in Shanghai, Jilin, and Tibet stayed DEA effective. The CLUE also shows certain spatial agglomeration characteristics. For instance, the geographically adjacent provinces of the middle and lower reaches of the Yangtze River (such as Shanghai, Jiangsu, Zhejiang, Jiangxi) have a high degree of spatial agglomeration of CLUE.
Table 4.
The results of CLUE in major years.
3.2. Initial Estimates
Based on the data of 31 provinces in China from 2004 to 2017, we weighted the highway density of the 30 provinces other than each province through the spatial weight matrix and constructed the spatial lag term of highway density. The scatter and linear fitting results of highway density vs. CLUE and of highway density spatial lag vs. CLUE are shown in Figure 4 and Figure 5, respectively. The slope coefficient of the fitting line between highway density and CLUE was found to be 0.07, while the slope coefficient of the fitting line between the spatial lag of highway density and CLUE is 0.19. This means that the increase of highway density within a province may have a more significant effect on the CLUE of the surrounding provinces than the local province. This also indicates that there may be a significant spatial spillover effect of highway infrastructure construction on CLUE.
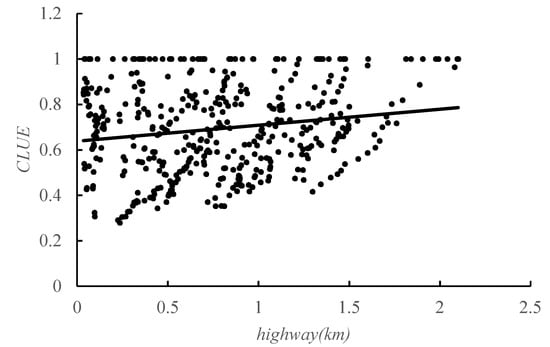
Figure 4.
Scatter diagram of the linear fitting between highway density and CLUE.
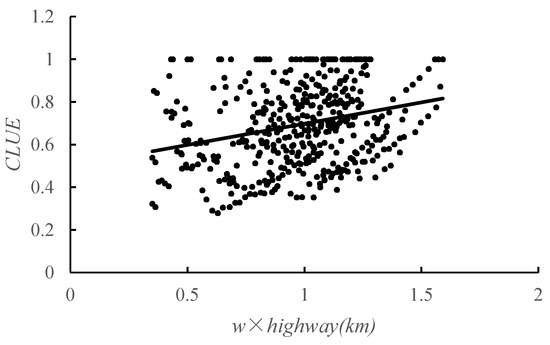
Figure 5.
Scatter diagram of the linear fitting between the spatial lag of highway density and CLUE.
3.3. Regression Analysis of the Dynamic Spatial Durbin Model
The results of the dynamic spatial Durbin model are shown in Table 5. The results of the dynamic panel fixed effect model, without considering the spatial spillover effect, are also in Table 5 for purposes of comparison. The regression coefficient of is positive and significant at the level of 1%. It can be inferred that there is significant time inertia in CLUE, the previous production experience and economic and environmental conditions have a significant impact on the current CLUE. Furthermore, the results of the dynamic panel fixed effect model indicate that highway density has no significant effect on CLUE, while the dynamic spatial Durbin model shows that the coefficient of the spatial lag term of highway density is significantly nonzero at the level of 5%. This means that if one does not consider the spatial correlation of highway infrastructure construction on CLUE, then the impact of highway infrastructure construction may be underestimated.
Table 5.
The regression results of dynamic spatial Durbin model.
The direct and indirect effects of highway density on CLUE were also calculated. It could be found that the effect of highway density on CLUE is positive, but the SE_indirect and LE_indirect of highway density on CLUE are more significant than the SE_direct and LE_direct, and the estimated coefficient value of the indirect effect is also higher. The reason is that highway infrastructure construction has significant network effect, which could greatly promote the flow of agricultural machinery, agricultural labor and agricultural technology. Therefore, the spatial spillover effect of highway infrastructure construction on CLUE efficiency is more significant than the direct effect. This result is consistent with the research of Tong et al. [34], Luo et al. [52], and Konno et al. [32].
Meanwhile, the regression coefficient of the LE_indirect effect is higher than that of the SE_indirect effect. The reason for this is that with the increase in highway density in the later period, the characteristics of the highway infrastructure network were also constantly improved, which could further reduce the transaction cost of agricultural production in neighboring areas [6,60].
Columns 4–6 of Table 5 report the estimated effects of expressway, first–second highway and third–fourth highway density, respectively. All regression coefficients for expressway are significantly positive. The estimation coefficients of the SE_direct and LE_direct of first–second highways’ and third–fourth highways’ density are not significant. Meanwhile, the SE_indirect and LE_indirect of first–second highways’ density are significantly positive, while the SE_indirect and LE_indirect of third–fourth highways’ density are significantly negative. It could be inferred that the higher the level of a highway, the more significant a role it has in promoting CLUE. The mileage of third–fourth highways accounts for more than 60% of China’s total highway mileage. This means that the low-grade highways, accounting for the majority of China’s highway mileage, do not significantly improve CLUE. This is consistent with the research results of Liu et al. [61]. The third–fourth highways are mainly used to serve as the connection between the county and the village and between the villages. Due to limited construction costs and topographical conditions, the traffic capacity is lower than that of higher-grade highways, and they cannot meet the traffic demand of large-scale agricultural machinery [62,63]. Therefore, third–fourth highways do not significantly promote CLUE.
Furthermore, the indirect effect is largely responsible for the total effect of highway infrastructure construction on CLUE, as indicated by the significantly positive spatial lag term . Among all classes of highways, the SE_direct and LE_direct of first–second highways are the highest. For each percentage point increase in first–second highway density, the CLUE increases by 0.24 percentage points in the short term and 0.65 percentage points in the long term, respectively. Although the expressway mileage only accounts for 3% of the total mileage, each increase of 1 percentage point in density will lead to an increase of 0.23 percentage points and 0.45 percentage points of CLUE, respectively, in the short term and the long term.
3.4. Threshold Regression Results
In this study, the sum of the highway density and the spatial lag of highway density in other provinces was selected as the threshold variable. This formed the basis of the panel threshold regression model of the influence of highway infrastructure construction on CLUE. Table 6 reports that the F value corresponding to the single threshold regression model is significant at the level of 1%, but the double threshold model fails to pass the significance test. This could mean that the impact of highway infrastructure construction on CLUE has nonlinear characteristics and a significant threshold effect.
Table 6.
Threshold effect test results.
Meanwhile, it can be seen from Table 7 that the sum of highway density and the spatial lag of highway density in other provinces has a significant impact on CLUE in the single threshold regression model, reaching a significance value of 1%. The value of the single threshold is 2.4152. When the sum of highway density and the spatial lag of highway density in other provinces is lower than the threshold value of 2.4152, the acceleration of highway infrastructure construction can lead to an improvement in CLUE, whereas if the sum is higher than the threshold value of 2.4152, this effect is significantly reduced. On this basis, the study samples were divided into two sections: low level (sum of highway density and the spatial lag of highway density in other provinces < 2.4152) and high level (sum of highway density and the spatial lag of highway density in other provinces ≥ 2.4152). In order to reflect the interval change and to take into account the current highway situation, this study divides the intervals according to the average highway density of each province over time and the highway density in 2017 (Shown in Figure 6).
Table 7.
Threshold effect test results.
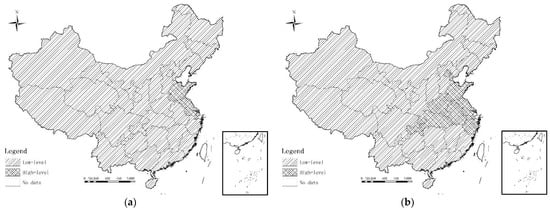
Figure 6.
Distribution of interval division by highway density. (a) Average of highway density, (b) highway density in 2017.
With regard to the average highway density, the provinces with high-level density are all in Eastern China. The provinces in Central China and Western China have low-level highway density. This indicates that the impact from highway construction on CLUE is asymmetric between developed regions and developing regions, with the latter standing to gain the most promotion in terms of CLUE [64]. In 2017, most of the provinces with high-level density were also located in Eastern China. Six provinces (Beijing, Tianjin, Shandong, Jiangsu, Shanghai and Zhejiang) of Eastern China reached high-level density in 2017. Anhui, Henan and Hubei provinces in Central China, which generally have better agricultural production conditions, also reached a high level of density in 2017. However, in Western China, only Chongqing had a high level of density in 2017. With the rapid development of highway construction in developed Eastern China, the highway density is becoming more and more concentrated and saturated. Highway infrastructure construction is no longer a vital factor impacting agricultural development and cultivated land use [63,65], and its role in promoting CLUE has declined. Central China is an important region of China’s grain production, the construction and improvement of highway infrastructure construction provide favorable conditions for promoting the cross-regional service of agricultural machinery and the flow of agricultural labor in Central China. Meanwhile, its geographical location makes Central China the highway “transit station” for China’s agricultural products, which promotes the optimal allocation of elements and the improvement of CLUE. Western China is in a vital period of development and construction, and the role of highway infrastructure construction in the improvement of CLUE is gradually increasing.
More interestingly, among the provinces with high-level density, Shandong, Jiangsu, Henan, Hubei and Hunan are also provinces in China’s major grain production areas. This could indicate that for these provinces in the major grain production areas, the role of highway infrastructure construction in improving CLUE has declined. Therefore, policy and technologies should be adopted to improve the CLUE.
4. Discussion
The CLUE defined by this paper refers to obtaining the largest possible output, including food, agriculture, forestry, animal husbandry and fishery, with as little input of labor and material production materials as possible on a certain area of cultivated land. China is a country with a large population. China feeds about 22% of the global population with 9% of the world’s cultivated land [65]. China is also a big agricultural country. The utilization of limited cultivated land resources also bears the burden of China’s social and economic development. On the one hand, people rely on farming to obtain food and economic sources. On the other hand, China’s industrialization and urbanization have been promoted by converting a large amount of arable land into construction land [66,67]. This reflected in current important measures to realize the sustainable development of China, that is, to improve CLUE. Through the study of China’s CLUE to summarize China’s cultivated land use model and to study the influencing factors of CLUE to share China’s experience, one can provide an important reference for the development of other underdeveloped countries or countries with scarce cultivated land resources.
This paper focus on analyzing the impact of highway infrastructure on CLUE from the perspective of the spatial spillover effect and threshold effect and broadens the research perspective of highway infrastructure construction and land use. Without doubt, China’s highway infrastructure construction plays a significant role in promoting sustained and rapid rural economic growth [61]. The results of this paper demonstrate that the construction of highway infrastructure provides favorable conditions for realizing the rational utilization of cultivated land, improving the utilization value of cultivated land and improving the CLUE. The findings of this paper have some policy implications for highway infrastructure construction and cultivated land use. First, as shown by Yang et al. [68] and Luo et al. [52], the impact of regional highway infrastructure on CLUE is not spatially independent. If the spatial dependence between regions is ignored, it may lead to the wrong conclusion for the formulation of rural development policies and the construction of regional highway infrastructure [69]. Therefore, in the construction of highway infrastructure, the Chinese government should promote interregional cooperation and strive to realize the interregional interconnection of highways. In this way, the connectivity between regions and the full flow of agricultural production factors among regions can be improved, and the spatial coordination of CLUE can be realized.
Meanwhile, it was found that expressways and first–second highways play a significant role in improving CLUE, while the promotion of third–fourth highways needs to be improved. In recent years, the Chinese government has accelerated the construction of third–fourth highways, and the mileage of third–fourth highways has also increased. However, the highway width of the third-fourth highways is narrow, and the poor connectivity with high-grade highways limits the effect of the third–fourth highways on CLUE. Therefore, combined with the needs of rural development, the Chinese government should expand the width of the third–fourth highways and improve the connectivity with high-grade highways. Even in the case of some of the third–fourth highways with large traffic volumes, the Chinese government can upgrade them to higher-class highways.
In particular, the threshold characteristics also require that different regions should further reasonably plan the construction of new highway infrastructure according to the current status of their own highway infrastructure. For provinces with high highway density, the government should use developed highway infrastructure to promote cross-regional services of agricultural machinery and other agricultural production technologies. Meanwhile, on the basis of ensuring basic grain output, the government should implement a strict farmland protection system to ensure that the quality of cultivated land does not decline. At present, the Chinese government should continue to increase construction in Western China where highway infrastructure construction is relatively lagging behind and speed up the connection inside the region. While Eastern China and Central China should increase construction of highway infrastructure in remote areas and adjust and control various cultivated land use factors through system design and improved cultivated land use policies to promote CLUE. Through these methods, the country can enhance the regional synergy between road infrastructure construction and cultivated land use.
The impact of highway construction on the land environment, especially the change in cultivated land, has always been an important topic in the analysis and research of highway construction projects [70]. It is worth noting that the research in this paper empirically tests the positive impact of highway construction on the improvement of CLUE, but there are also studies that focus on the negative impact of highway construction, such as Małgorzata Dudzi’nska et al. [71], which found that highway construction reduced large areas of arable land. The policy formulation and implementation of land consolidation projects provide direction in considering the impact of highway construction on improving CLUE and determining appropriate measures to make up for or eliminate the losses caused by highway construction. In China, land consolidation activities centered on the development, utilization and transformation of land resources have always accompanied China’s rural construction [72]. The technical projects of land consolidation mainly include land projects such as land leveling and soil improvement, infrastructure projects such as farmhouse consolidation and road construction, environmental projects such as landscape greening and sanitation improvement, and ecological projects such as water body treatment and mine restoration. As a result, land consolidation work has played an important role in guiding infrastructure construction, reducing the fragmentation of cultivated land, and improving CLUE [73,74,75]. Whether it is the formulation of agricultural sustainable development policies in various countries or the research on the impact of highway infrastructure construction on CLUE, continuous attention should be paid to this in the future.
However, more research needs to be implemented. One possible direction for future work is to use more detailed county data, even township data. Another research direction is to explore the impact of railway and waterway infrastructure on cultivated land use efficiency.
5. Conclusions
Based on interprovincial panel data from China from 2004 to 2017, this study used a slack-based model (SBM) to measure CLUE, established a dynamic spatial Durbin model to explore the spatial spillover effect of highway infrastructure construction on CLUE and a panel threshold regression model to analyze the threshold effect. It primarily draws the following three conclusions: (1) The average CLUE index of China increased from 0.59 in 2004 to 0.88 in 2017, showing a steady rising trend, albeit with some fluctuations, and there are significant differences in spatial distribution. (2) Highway infrastructure construction significantly and positively promoted CLUE, among which expressways and first–second highways have the most significant promoting effect on CLUE. The promotion effect on CLUE has a spatial spillover effect. (3) The results of panel threshold regression indicate that there is a single threshold effect on the effect of highway infrastructure construction on CLUE. When the sum of highway density and the spatial lag of highway density in other provinces is lower than the threshold value of 2.4152, the acceleration of highway infrastructure construction can lead to an improvement in CLUE. On the other hand, if the sum is higher than the threshold value of 2.4152, the promotion effect of highway infrastructure construction on CLUE is significantly reduced. Highway infrastructure construction is related to production and development as well as residents’ quality of life and social welfare. With China entering a period of high-quality economic development [76,77], China has accelerated the construction of all kinds of highway infrastructure. By the end of 2018, the mileage of rural highways in China was 4.205 million kilometers, an increase of 0.16 million kilometers over the previous year. The policy of highway infrastructure construction has created better conditions for the transfer of labor force, capital, land, and other cultivated land use factors. The Chinese government’s policy of supporting highway infrastructure construction has played an important role in promoting CLUE, and the promotion effect is mainly realized through the spatial spillover effect; therefore, by promoting inter-regional cooperation in highway infrastructure construction and strengthening inter-regional highway connectivity, the government can help improve CLUE. In this process, different regions should rationally plan the construction of new highway infrastructure according to their own highway infrastructure.
Author Contributions
Conceptualization, J.H., X.L. and Y.T.; Methodology, J.H.; Software, X.Z.; Validation, T.W.; Formal analysis, J.H.; Investigation, X.L.; Resources, T.L.; Data curation, T.W. and X.Z.; Writing—original draft preparation, J.H.; Writing—review and editing, X.L. and Y.T.; Visualization, T.W.; Supervision, Y.T.; Project administration, X.Z.; Funding acquisition, X.L. All authors have read and agreed to the published version of the manuscript.
Funding
This research is funded by the Program of the National Natural Science Foundation of China (Grant No. 42101263; 41501589).
Institutional Review Board Statement
Not applicable.
Informed Consent Statement
Not applicable.
Data Availability Statement
Not applicable.
Conflicts of Interest
The authors declare no conflict of interest.
References
- Costanza, R.; d’Arge, R.; De Groot, R.; Farber, S.; Grasso, M.; Hannon, B.; Limburg, K.; Naeem, S.; O’neill, R.V.; Paruelo, J.J.; et al. The value of the world’s ecosystem services and natural capital. Nature 1997, 387, 253–260. [Google Scholar] [CrossRef]
- Lambin, E.F.; Gibbs, H.K.; Ferreira, L.; Grau, R.; Mayaux, P.; Meyfroidt, P.; Morton, D.C.; Rudel, T.K.; Gasparri, I.; Munger, J. Estimating the world’s potentially available cropland using a bottom-up approach. Glob. Environ. Chang. 2013, 23, 892–901. [Google Scholar] [CrossRef]
- Du, J.; Liang, L.; Zhu, J. A slacks-based measure of super-efficiency in data envelopment analysis: A comment. Eur. J. Oper. Res. 2010, 204, 694–697. [Google Scholar] [CrossRef]
- Zhang, R.; Jiao, H. Spatial-temporal pattern differentiation and its mechanism analysis of using efficiency for provincial cultivated land in China. Trans. Chin. Soc. Agric. Eng. 2015, 31, 277–287. [Google Scholar]
- Cantos, P.; Gumbau-Albert, M.; Maudos, J. Transport infrastructures, spillover effects and regional growth: Evidence of the Spanish case. Transp. Rev. 2005, 25, 25–50. [Google Scholar] [CrossRef]
- Wang, Z.Y.; Sun, S.Z. Transportation infrastructure and rural development in China. China Agric. Econ. Rev. 2016, 8, 516–525. [Google Scholar] [CrossRef]
- Liang, L.; Qu, F.; Wang, C.J.R.E.Y.B. Analysis on cultivated land use efficiency based on DEA. Resour. Environ. Yangtze Basin 2008, 2, 242–246. [Google Scholar]
- Chen, Y.; Chen, Z.G.; Xu, G.L.; Tian, Z.Q. Built-up land efficiency in urban China: Insights from the General Land Use Plan (2006–2020). Habitat Int. 2016, 51, 31–38. [Google Scholar] [CrossRef]
- Xie, H.L.; Chen, Q.R.; Lu, F.C.; Wu, Q.; Wang, W. Spatial-temporal disparities, saving potential and influential factors of industrial land use efficiency: A case study in urban agglomeration in the middle reaches of the Yangtze River. Land Use Policy 2018, 75, 518–529. [Google Scholar] [CrossRef]
- Mohaddes, K.; Raissi, M.; Weber, A.J.E.l. Can Italy grow out of its NPL overhang? A panel threshold analysis. Econ. Lett. 2017, 159, 185–189. [Google Scholar] [CrossRef][Green Version]
- Han, H.B.; Zhang, X.Y. Static and dynamic cultivated land use efficiency in China: A minimum distance to strong efficient frontier approach. J. Clean Prod. 2020, 246, 119002. [Google Scholar] [CrossRef]
- Kuang, B.; Lu, X.H.; Zhou, M.; Chen, D.L. Provincial cultivated land use efficiency in China: Empirical analysis based on the SBM-DEA model with carbon emissions considered. Technol. Forecast Soc. 2020, 151, 119800. [Google Scholar] [CrossRef]
- Yang, B.; Wang, Z.Q.; Zou, L.; Zou, L.L.; Zhang, H.W. Exploring the eco-efficiency of cultivated land utilization and its influencing factors in China’s Yangtze River Economic Belt, 2001–2018. J. Environ. Manag. 2021, 294, 112939. [Google Scholar] [CrossRef] [PubMed]
- Li, J.Q.; Yang, L.J.; Zhu, T.; Fu, J.J.S.A.R. The study on effects of concurrent business on cultivated land use efficiency-based on empirical analysis of Gansu and Qinghai Province. Sustain. Agric. Res. 2012, 1, 7. [Google Scholar] [CrossRef]
- Tu, F.; Yu, X.F.; Ruan, J.Q. Industrial land use efficiency under government intervention: Evidence from Hangzhou, China. Habitat Int. 2014, 43, 1–10. [Google Scholar] [CrossRef]
- Du, J.F.; Thill, J.C.; Peiser, R.B. Land pricing and its impact on land use efficiency in post-land-reform China: A case study of Beijing. Cities 2016, 50, 68–74. [Google Scholar] [CrossRef]
- Wu, C.Y.; Wei, Y.H.D.; Huang, X.J.; Chen, B.W. Economic transition, spatial development and urban land use efficiency in the Yangtze River Delta, China. Habitat Int. 2017, 63, 67–78. [Google Scholar] [CrossRef]
- Lau, L.J.; Zheng, H.J.C.E.R. How much slack was there in the Chinese economy prior to its economic reform of 1978? China Econ. Rev. 2017, 45, 124–142. [Google Scholar] [CrossRef]
- Estache, A. Survey of Impact Evaluations of Infrastructure Projects, Programs and Policies; European Centre for Advanced Research in Economics (ECARES) Working Paper; ECARES: Brussels, Belgium, 2010. [Google Scholar]
- Straub, S. Infrastructure and Development: A Critical Appraisal of the Macro-level Literature. J. Dev. Stud. 2011, 47, 683–708. [Google Scholar] [CrossRef]
- Haggblade, S.; Hazell, P.B.; Reardon, T. Transforming the Rural Nonfarm Economy: Opportunities and Threats in the Developing World; International Food Policy Research Institute: Washington, DC, USA, 2007. [Google Scholar]
- Chiodi, V.; Jaimovich, E.; Montes-Rojas, G. Migration, Remittances and Capital Accumulation: Evidence from Rural Mexico. J. Dev. Stud. 2012, 48, 1139–1155. [Google Scholar] [CrossRef]
- Nguyen, L.D.; Raabe, K.; Grote, U.J.W.D. Rural–urban migration, household vulnerability, and welfare in Vietnam. World Dev. 2015, 71, 79–93. [Google Scholar] [CrossRef]
- Mottaleb, K.A.; Krupnik, T.J.; Erenstein, O. Factors associated with small-scale agricultural machinery adoption in Bangladesh: Census findings. J. Rural Stud. 2016, 46, 155–168. [Google Scholar] [CrossRef] [PubMed]
- Diao, X.S.; Cossar, F.; Houssou, N.; Kolavalli, S. Mechanization in Ghana: Emerging demand, and the search for alternative supply models. Food Policy 2014, 48, 168–181. [Google Scholar] [CrossRef]
- Mottaleb, K.A.; Mohanty, S.; Nelson, A. Strengthening Market Linkages of Farm Households in Developing Countries. Appl. Econ. Perspect. Policy 2015, 37, 226–242. [Google Scholar] [CrossRef]
- Jiang, M.J.; Hu, X.J.; Chunga, J.; Lin, Z.Y.; Fei, R.L. Does the popularization of agricultural mechanization improve energy-environment performance in China’s agricultural sector? J. Clean. Prod. 2020, 276, 124210. [Google Scholar] [CrossRef]
- Mamatzakis, E.J.A.E. Public infrastructure and productivity growth in Greek agriculture. Agric. Econ. 2003, 29, 169–180. [Google Scholar] [CrossRef]
- Zhang, J.; Mishra, A.K.; Zhu, P.X.; Li, X.S. Land rental market and agricultural labor productivity in rural China: A mediation analysis. World Dev. 2020, 135, 105089. [Google Scholar] [CrossRef]
- Branco, J.E.H.; Bartholomeu, D.B.; Alves, P.N.; Caixeta, J.V. Mutual analyses of agriculture land use and transportation networks: The future location of soybean and corn production in Brazil. Agr. Syst. 2021, 194, 103264. [Google Scholar] [CrossRef]
- Condeco-Melhorado, A.; Tillema, T.; de Jong, T.; Koopal, R. Distributive effects of new highway infrastructure in the Netherlands: The role of network effects and spatial spillovers. J. Transp. Geogr. 2014, 34, 96–105. [Google Scholar] [CrossRef]
- Konno, A.; Kato, H.; Takeuchi, W.; Kiguchi, R. Global evidence on productivity effects of road infrastructure incorporating spatial spillover effects. Transp. Policy 2021, 103, 167–182. [Google Scholar] [CrossRef]
- Tang, Y.; Lu, X.; Yi, J.; Wang, H.; Zhang, X.; Zheng, W.J.E.I. Evaluating the spatial spillover effect of farmland use transition on grain production–An empirical study in Hubei Province, China. Ecol. Indic. 2021, 125, 107478. [Google Scholar] [CrossRef]
- Tong, T.T.; Yu, T.H.E.; Cho, S.H.; Jensen, K.; Ugarte, D.D. Evaluating the spatial spillover effects of transportation infrastructure on agricultural output across the United States. J. Transp. Geogr. 2013, 30, 47–55. [Google Scholar] [CrossRef]
- Lin, B.Q.; Chen, Y. Transportation infrastructure and efficient energy services: A perspective of China’s manufacturing industry. Energ Econ 2020, 89, 104809. [Google Scholar] [CrossRef]
- Wang, J.T.; Cai, S.Y. The construction of high-speed railway and urban innovation capacity: Based on the perspective of knowledge Spillover. China Econ. Rev. 2020, 63, 101539. [Google Scholar] [CrossRef]
- Bonaglia, F.; La Ferrara, E.; Marcellino, M. Public capital and economic performance: Evidence from Italy. G. Econ. Ann. Econ. 2000, 60, 221–244. [Google Scholar]
- Shenggen, F.; Zhang, X.J. Infrastructure and regional economic development in rural China. China Econ. Rev. 2004, 15, 203–214. [Google Scholar]
- Elhorst, J.P. Spatial Econometrics: From Cross-Sectional Data to Spatial Panels; Springer: Amsterdam, The Netherlands, 2014; Volume 479. [Google Scholar]
- Shih, Y.N.; Li, H.C.; Qin, B. Housing price bubbles and inter-provincial spillover: Evidence from China. Habitat Int. 2014, 43, 142–151. [Google Scholar] [CrossRef]
- Que, W.; Zhang, Y.; Liu, S. Computation. The spatial spillover effect of fiscal decentralization on local public provision: Mathematical application and empirical estimation. Appl. Math. Comput. 2018, 331, 416–429. [Google Scholar]
- Zeng, C. Spatial spillover effect on land conveyance fee—A multi-scheme investigation in Wuhan agglomeration. Land Use Policy 2019, 89, 104196. [Google Scholar] [CrossRef]
- Lay, J.; Nolte, K.; Sipangule, K. Large-scale farms in Zambia: Locational patterns and spillovers to smallholder agriculture. World Dev. 2021, 140, 105277. [Google Scholar] [CrossRef]
- Li, F.; Feng, S.; Lu, H.; Qu, F.; D’Haese, M.J.L.U.P. How do non-farm employment and agricultural mechanization impact on large-scale farming? A spatial panel data analysis from Jiangsu Province, China. Land Use Policy 2021, 107, 105517. [Google Scholar] [CrossRef]
- Lapple, D.; Renwick, A.; Cullinan, J.; Thorne, F. What drives innovation in the agricultural sector? A spatial analysis of knowledge spillovers. Land Use Policy 2016, 56, 238–250. [Google Scholar] [CrossRef]
- Solow, R.M. A contribution to the theory of economic growth. Q. J. Econ. 1956, 70, 65–94. [Google Scholar] [CrossRef]
- Rudel, T.K.; Coomes, O.T.; Moran, E.; Achard, F.; Angelsen, A.; Xu, J.C.; Lambin, E. Forest transitions: Towards a global understanding of land use change. Glob. Environ. Chang. 2005, 15, 23–31. [Google Scholar] [CrossRef]
- Deng, T.T.; Shao, S.; Yang, L.L.; Zhang, X.L. Has the transport-led economic growth effect reached a peak in China? A panel threshold regression approach. Transportation 2014, 41, 567–587. [Google Scholar] [CrossRef]
- Zitti, M.; Ferrara, C.; Perini, L.; Carlucci, M.; Salvati, L. Long-Term Urban Growth and Land Use Efficiency in Southern Europe: Implications for Sustainable Land Management. Sustainability 2015, 7, 3359–3385. [Google Scholar] [CrossRef]
- Tang, Y.F.; Lu, X.H.; Wang, M.C.; Jiang, B.; Chen, D.L.; Ge, K. Assessing the threshold effects of road infrastructure construction on farmland use transition: An empirical study in China. Environ. Sci. Pollut. Res. 2022, 27, 32809–32819. [Google Scholar] [CrossRef]
- Tan, R.P.; Liu, K.; Lin, B.Q. Transportation infrastructure development and China’s energy intensive industries—A road development perspective. Energy 2018, 149, 587–596. [Google Scholar] [CrossRef]
- Luo, S.; He, K.; Zhang, J. Can road construction promote agricultural growth? An analysis based on the perspective of cross-regional operation of agricultural machinery. China Rural. Econ. 2018, 6, 67–83. [Google Scholar]
- Duranton, G.; Puga, D. Micro-foundations of urban agglomeration economies. In Handbook of Regional and Urban Economics; Elsevier: Amsterdam, The Netherlands, 2004; Volume 4, pp. 2063–2117. [Google Scholar]
- Simar, L.; Wilson, P.W. Non-parametric tests of returns to scale. Eur. J. Oper. Res. 2002, 139, 115–132. [Google Scholar] [CrossRef]
- Tone, K.; Tsutsui, M.J.O. Dynamic DEA: A slacks-based measure approach. Omega 2010, 38, 145–156. [Google Scholar] [CrossRef]
- Yang, W.Y.; Wang, W.L.; Ouyang, S.S. The influencing factors and spatial spillover effects of CO2 emissions from transportation in China. Sci. Total Environ. 2019, 696, 133900. [Google Scholar] [CrossRef] [PubMed]
- Elhorst, J.P. Specification and estimation of spatial panel data models. Int. Reg. Sci. Rev. 2003, 26, 244–268. [Google Scholar] [CrossRef]
- Hansen, B.E. Threshold effects in non-dynamic panels: Estimation, testing, and inference. J. Econom. 1999, 93, 345–368. [Google Scholar] [CrossRef]
- Zeitun, R.; Goaied, M. The nonlinear effect of foreign ownership on capital structure in Japan: A panel threshold analysis. Pac-Basin Financ. J. 2021, 68, 101594. [Google Scholar] [CrossRef]
- Hulten, C.R.; Bennathan, E.; Srinivasan, S. Infrastructure, externalities, and economic development: A study of the Indian manufacturing industry. World Bank Econ. Rev. 2006, 20, 291–308. [Google Scholar] [CrossRef]
- Liu, B.-l.; Wu, P.; Liu, Y.H. Transportation infrastructure and the increase in TFP in China: Spatial econometric analysis on provincial panel data. China Ind. Econ. 2010, 3, 54–64. [Google Scholar]
- Zeng, F.; Cai, B. Rural infrastructure is the basis of the Rural Vitalization Strategy. Issues Agric. Econ. 2018, 7, 88–95. [Google Scholar]
- Yu, Z.; Zhao, P.J. The factors in residents’ mobility in rural towns of China: Car ownership, road infrastructure and public transport services. J. Transp. Geogr. 2021, 91, 102950. [Google Scholar] [CrossRef]
- Adamopoulos, T. Transportation Costs, Agricultural Productivity, and Cross-Country Income Differences. Int. Econ. Rev. 2011, 52, 489–521. [Google Scholar] [CrossRef]
- Sun, Q.; Wu, M.; Du, P.; Qi, W.; Yu, X. Spatial Layout Optimization and Simulation of Cultivated Land Based on the Life Community Theory in a Mountainous and Hilly Area of China. Sustainability 2022, 14, 3821. [Google Scholar] [CrossRef]
- Liu, T.; Liu, H.; Qi, Y. Construction land expansion and cultivated land protection in urbanizing China: Insights from national land surveys, 1996–2006. Habitat Int. 2015, 46, 13–22. [Google Scholar] [CrossRef]
- Li, Y.; Li, Y.; Westlund, H.; Liu, Y. Urban–rural transformation in relation to cultivated land conversion in China: Implications for optimizing land use and balanced regional development. Land Use Policy 2015, 47, 218–224. [Google Scholar] [CrossRef]
- Yang, J.; Huang, Z.; Zhang, X.; Reardon, T. The rapid rise of cross-regional agricultural mechanization services in China. Am. J. Agric. Econ. 2013, 95, 1245–1251. [Google Scholar] [CrossRef]
- Ertura, C.; Koch, W. Growth, technological interdependence and spatial externalities: Theory and evidence. J. Appl. Economet. 2007, 22, 1033–1062. [Google Scholar] [CrossRef]
- Balawejder, M.; Leń, P. The realization of complex work of consolidation and exchange of land in the villages divided by a highway. Geomat. Environ. Eng. 2016, 10, 27–37. [Google Scholar] [CrossRef]
- Dudzińska, M.; Bacior, S.; Prus, B.J.S. Motorway Route Planning with Regarding the Adverse Effects on Agricultural Production Space. Sustainability 2019, 11, 6770. [Google Scholar] [CrossRef]
- Zhou, Y.; Li, Y.; Xu, C. Land consolidation and rural revitalization in China: Mechanisms and paths. Land Use Policy 2020, 91, 104379. [Google Scholar] [CrossRef]
- Yurui, L.; Yi, L.; Pengcan, F.; Hualou, L. Impacts of land consolidation on rural human–environment system in typical watershed of the Loess Plateau and implications for rural development policy. Land Use Policy 2019, 86, 339–350. [Google Scholar] [CrossRef]
- Long, H. Land consolidation: An indispensable way of spatial restructuring in rural China. J. Geogr. Sci. 2014, 24, 211–225. [Google Scholar] [CrossRef]
- Qi, J.; Li, W.; Wang, Z.; Fang, H. Measurement and path selection of rural development level in enclave areas: A case study of jingyuan county, gansu province. Sustainability 2021, 13, 9904. [Google Scholar] [CrossRef]
- Bei, J. Study on the “high-quality development” economics. China Political Econ. 2018, 1, 163–180. [Google Scholar] [CrossRef]
- Wei, M.; Li, S.H.; Economics, T. Study on the measurement of economic high-quality development level in China in the new era. J. Quant. Tech. Econ. 2018, 35, 3–20. [Google Scholar]
Publisher’s Note: MDPI stays neutral with regard to jurisdictional claims in published maps and institutional affiliations. |
© 2022 by the authors. Licensee MDPI, Basel, Switzerland. This article is an open access article distributed under the terms and conditions of the Creative Commons Attribution (CC BY) license (https://creativecommons.org/licenses/by/4.0/).