
Quantitative Estimation of Saline-Soil Amelioration Using Remote-Sensing Indices in Arid Land for Better Management


 , , , and
Abstract
1. Introduction
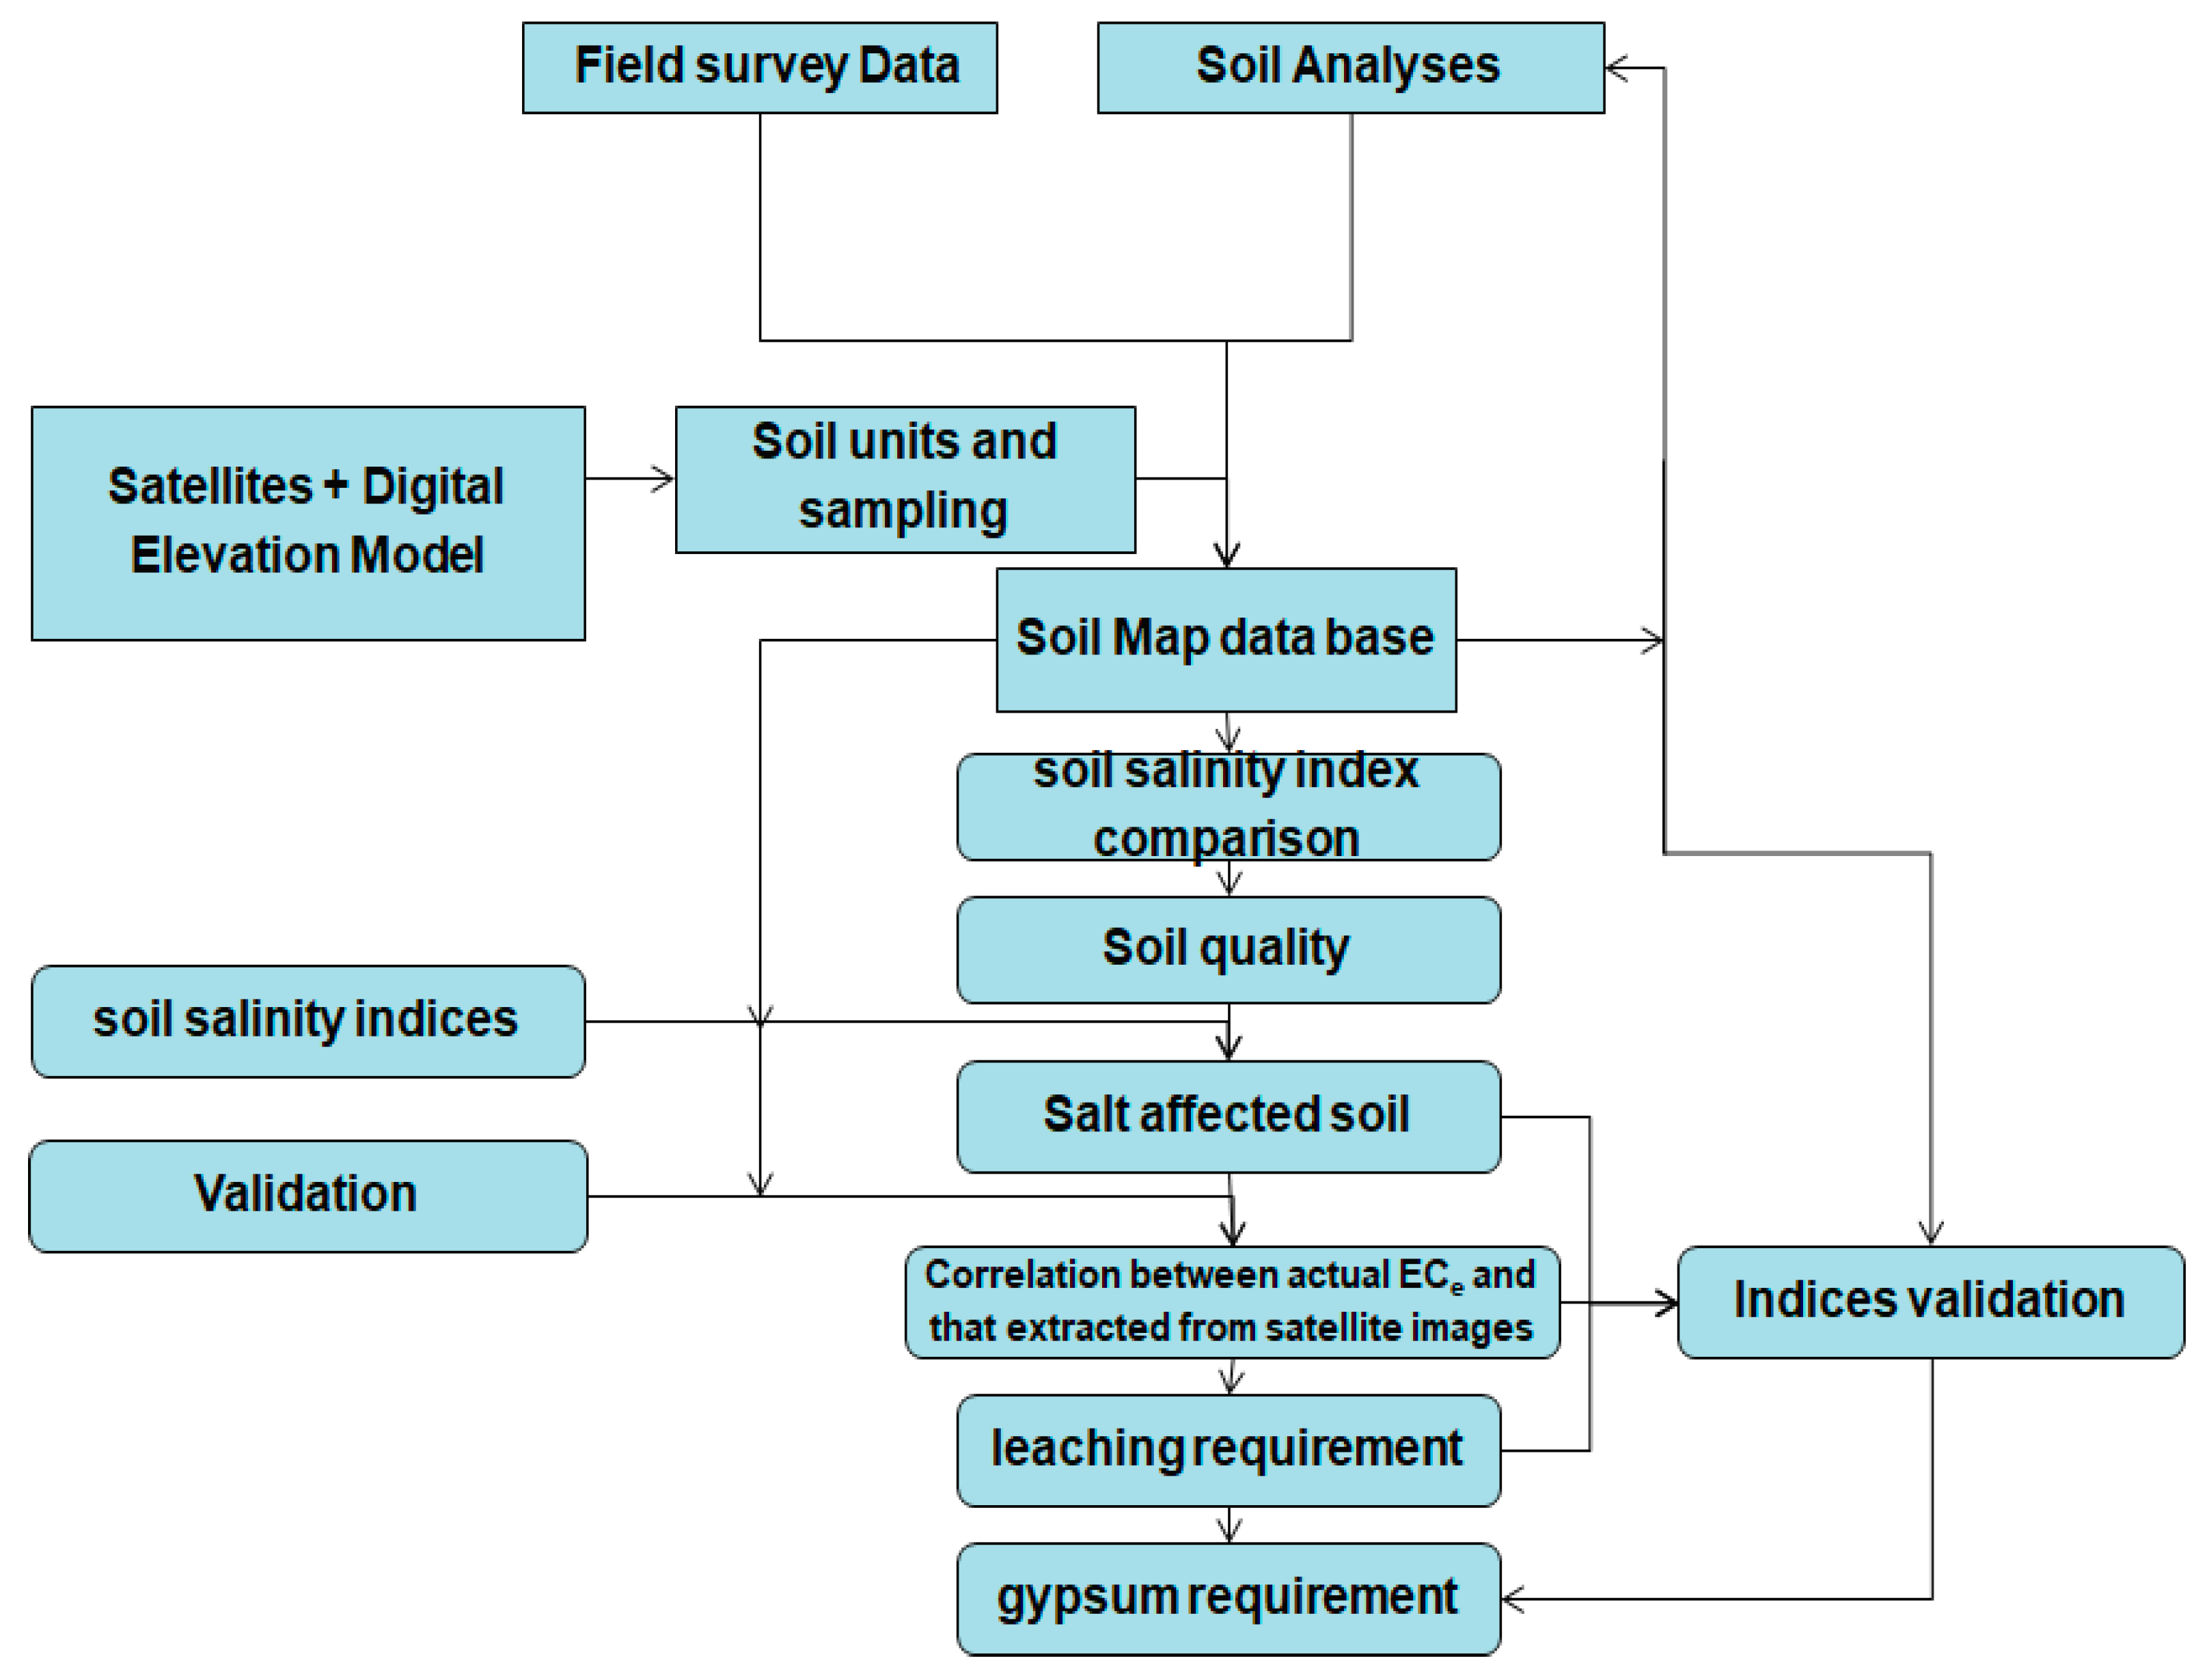
2. Materials and Methods
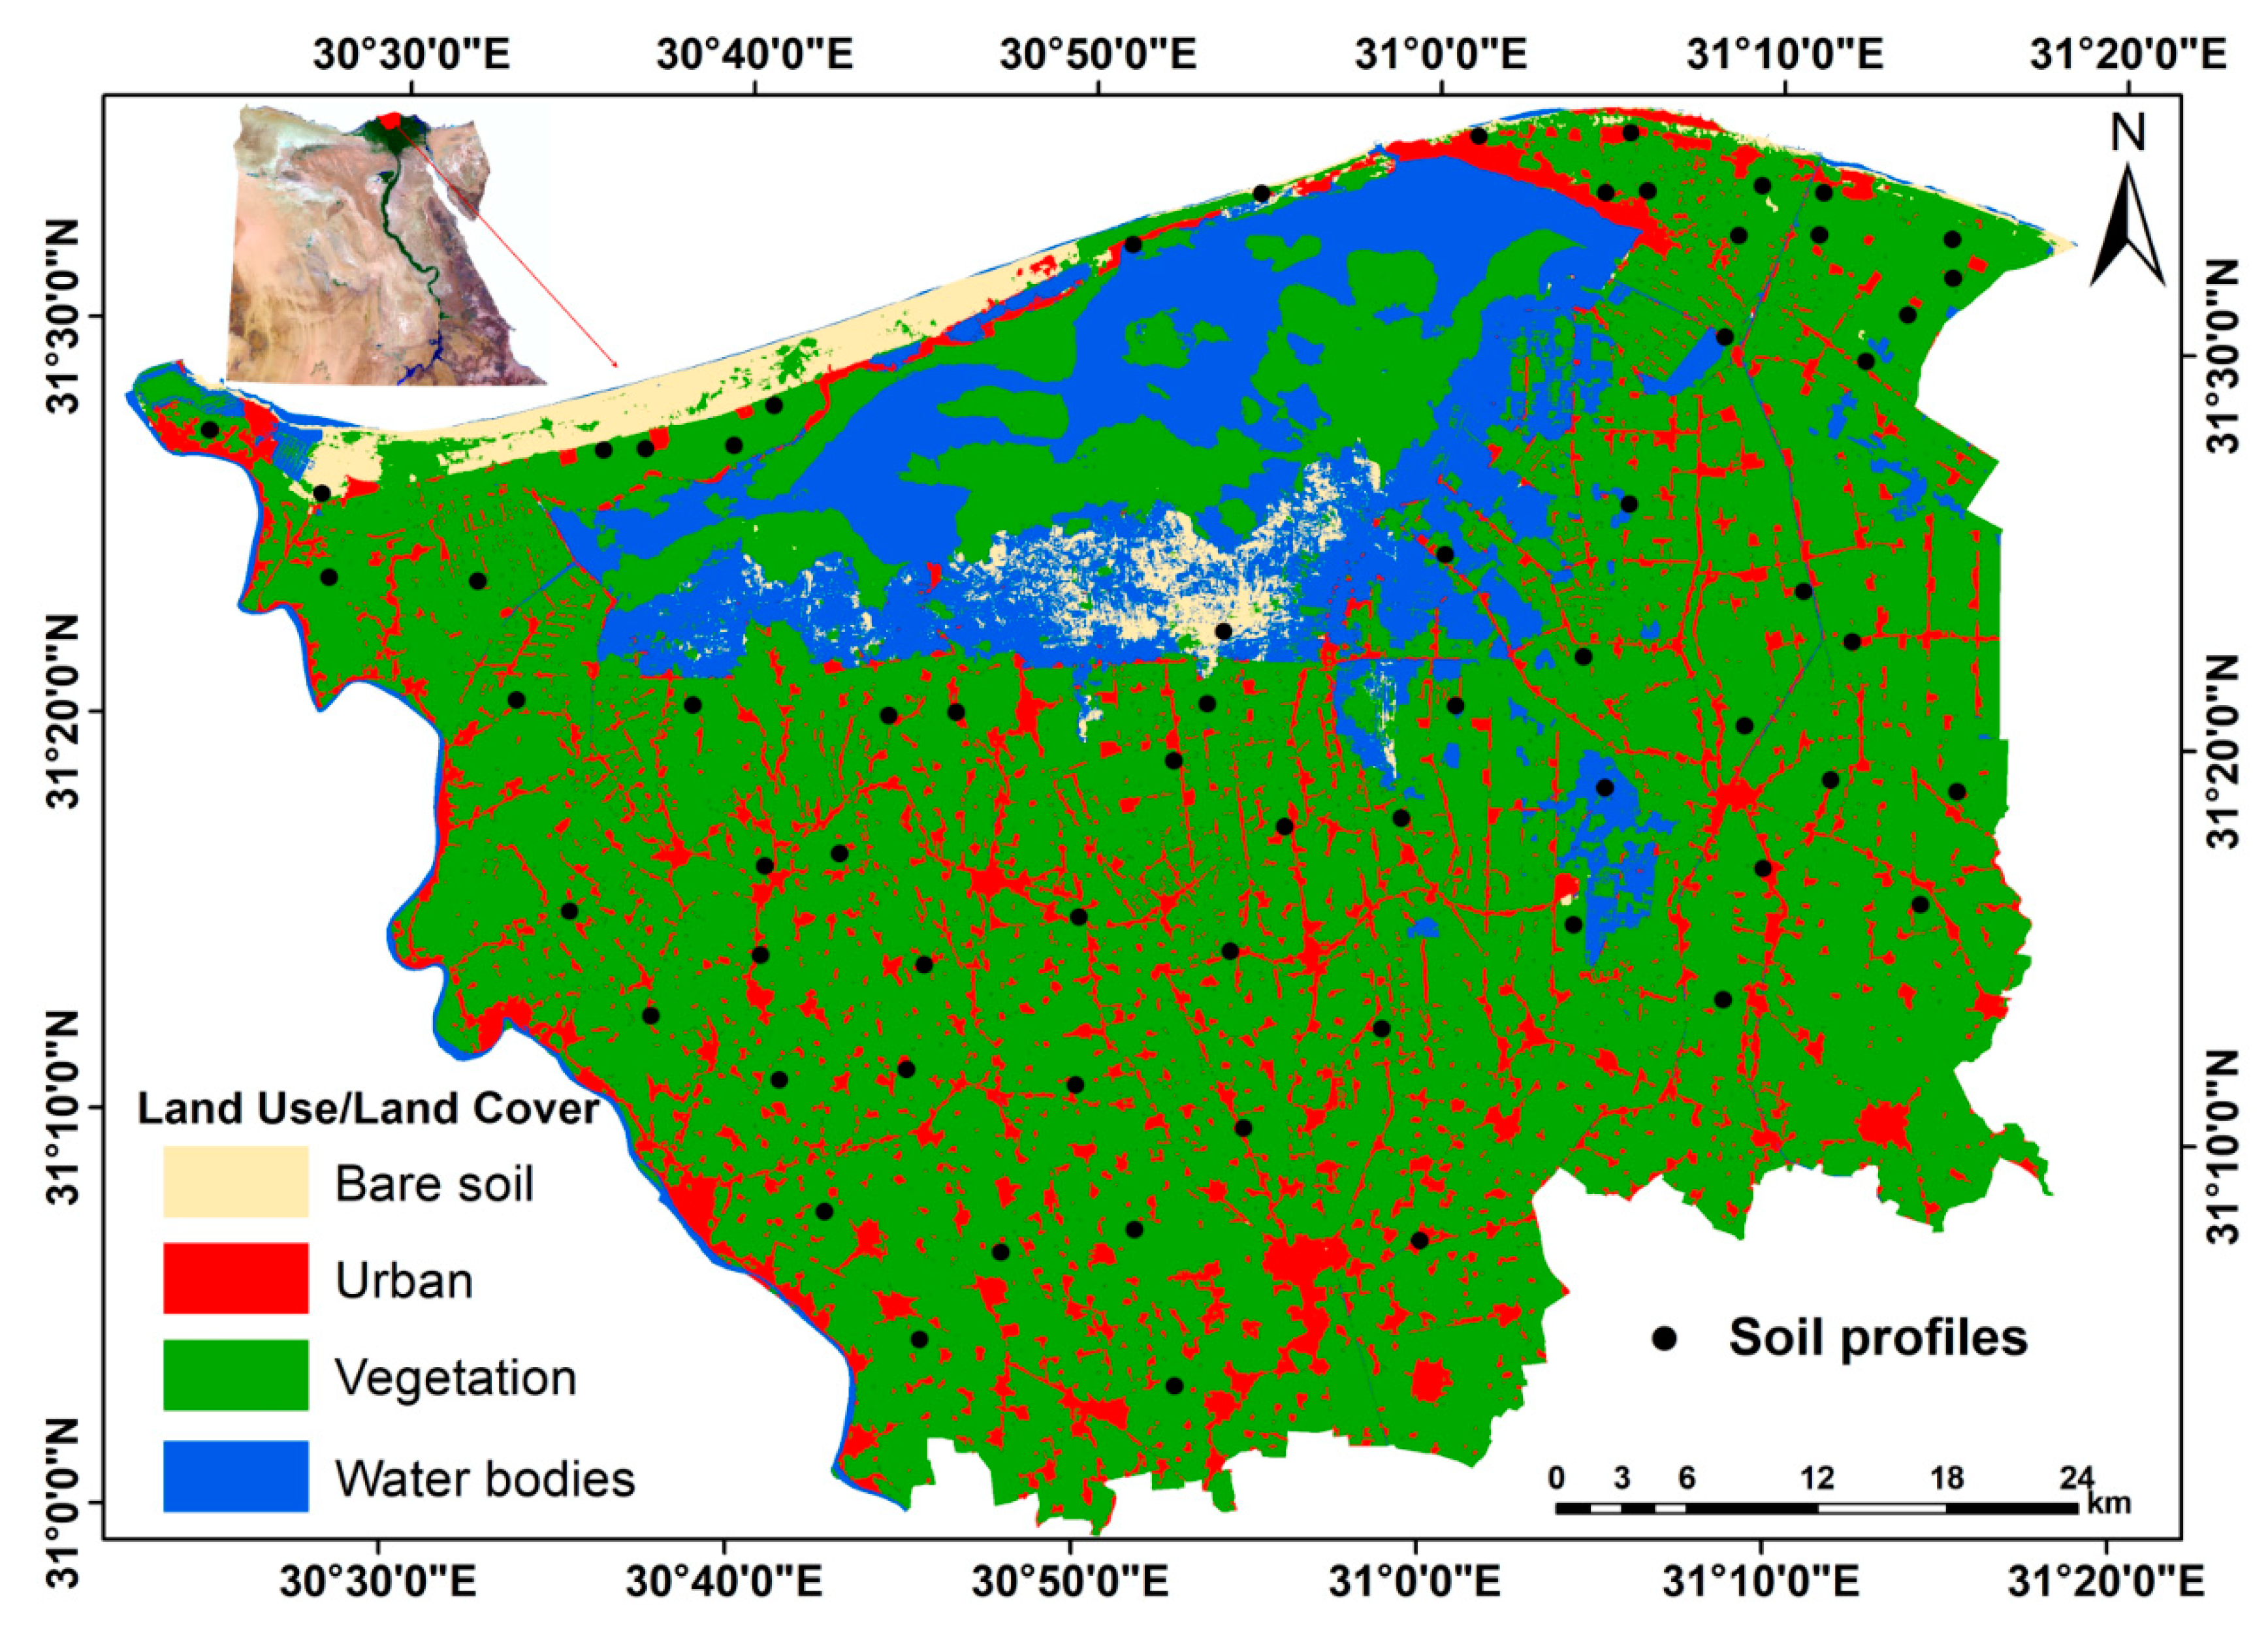
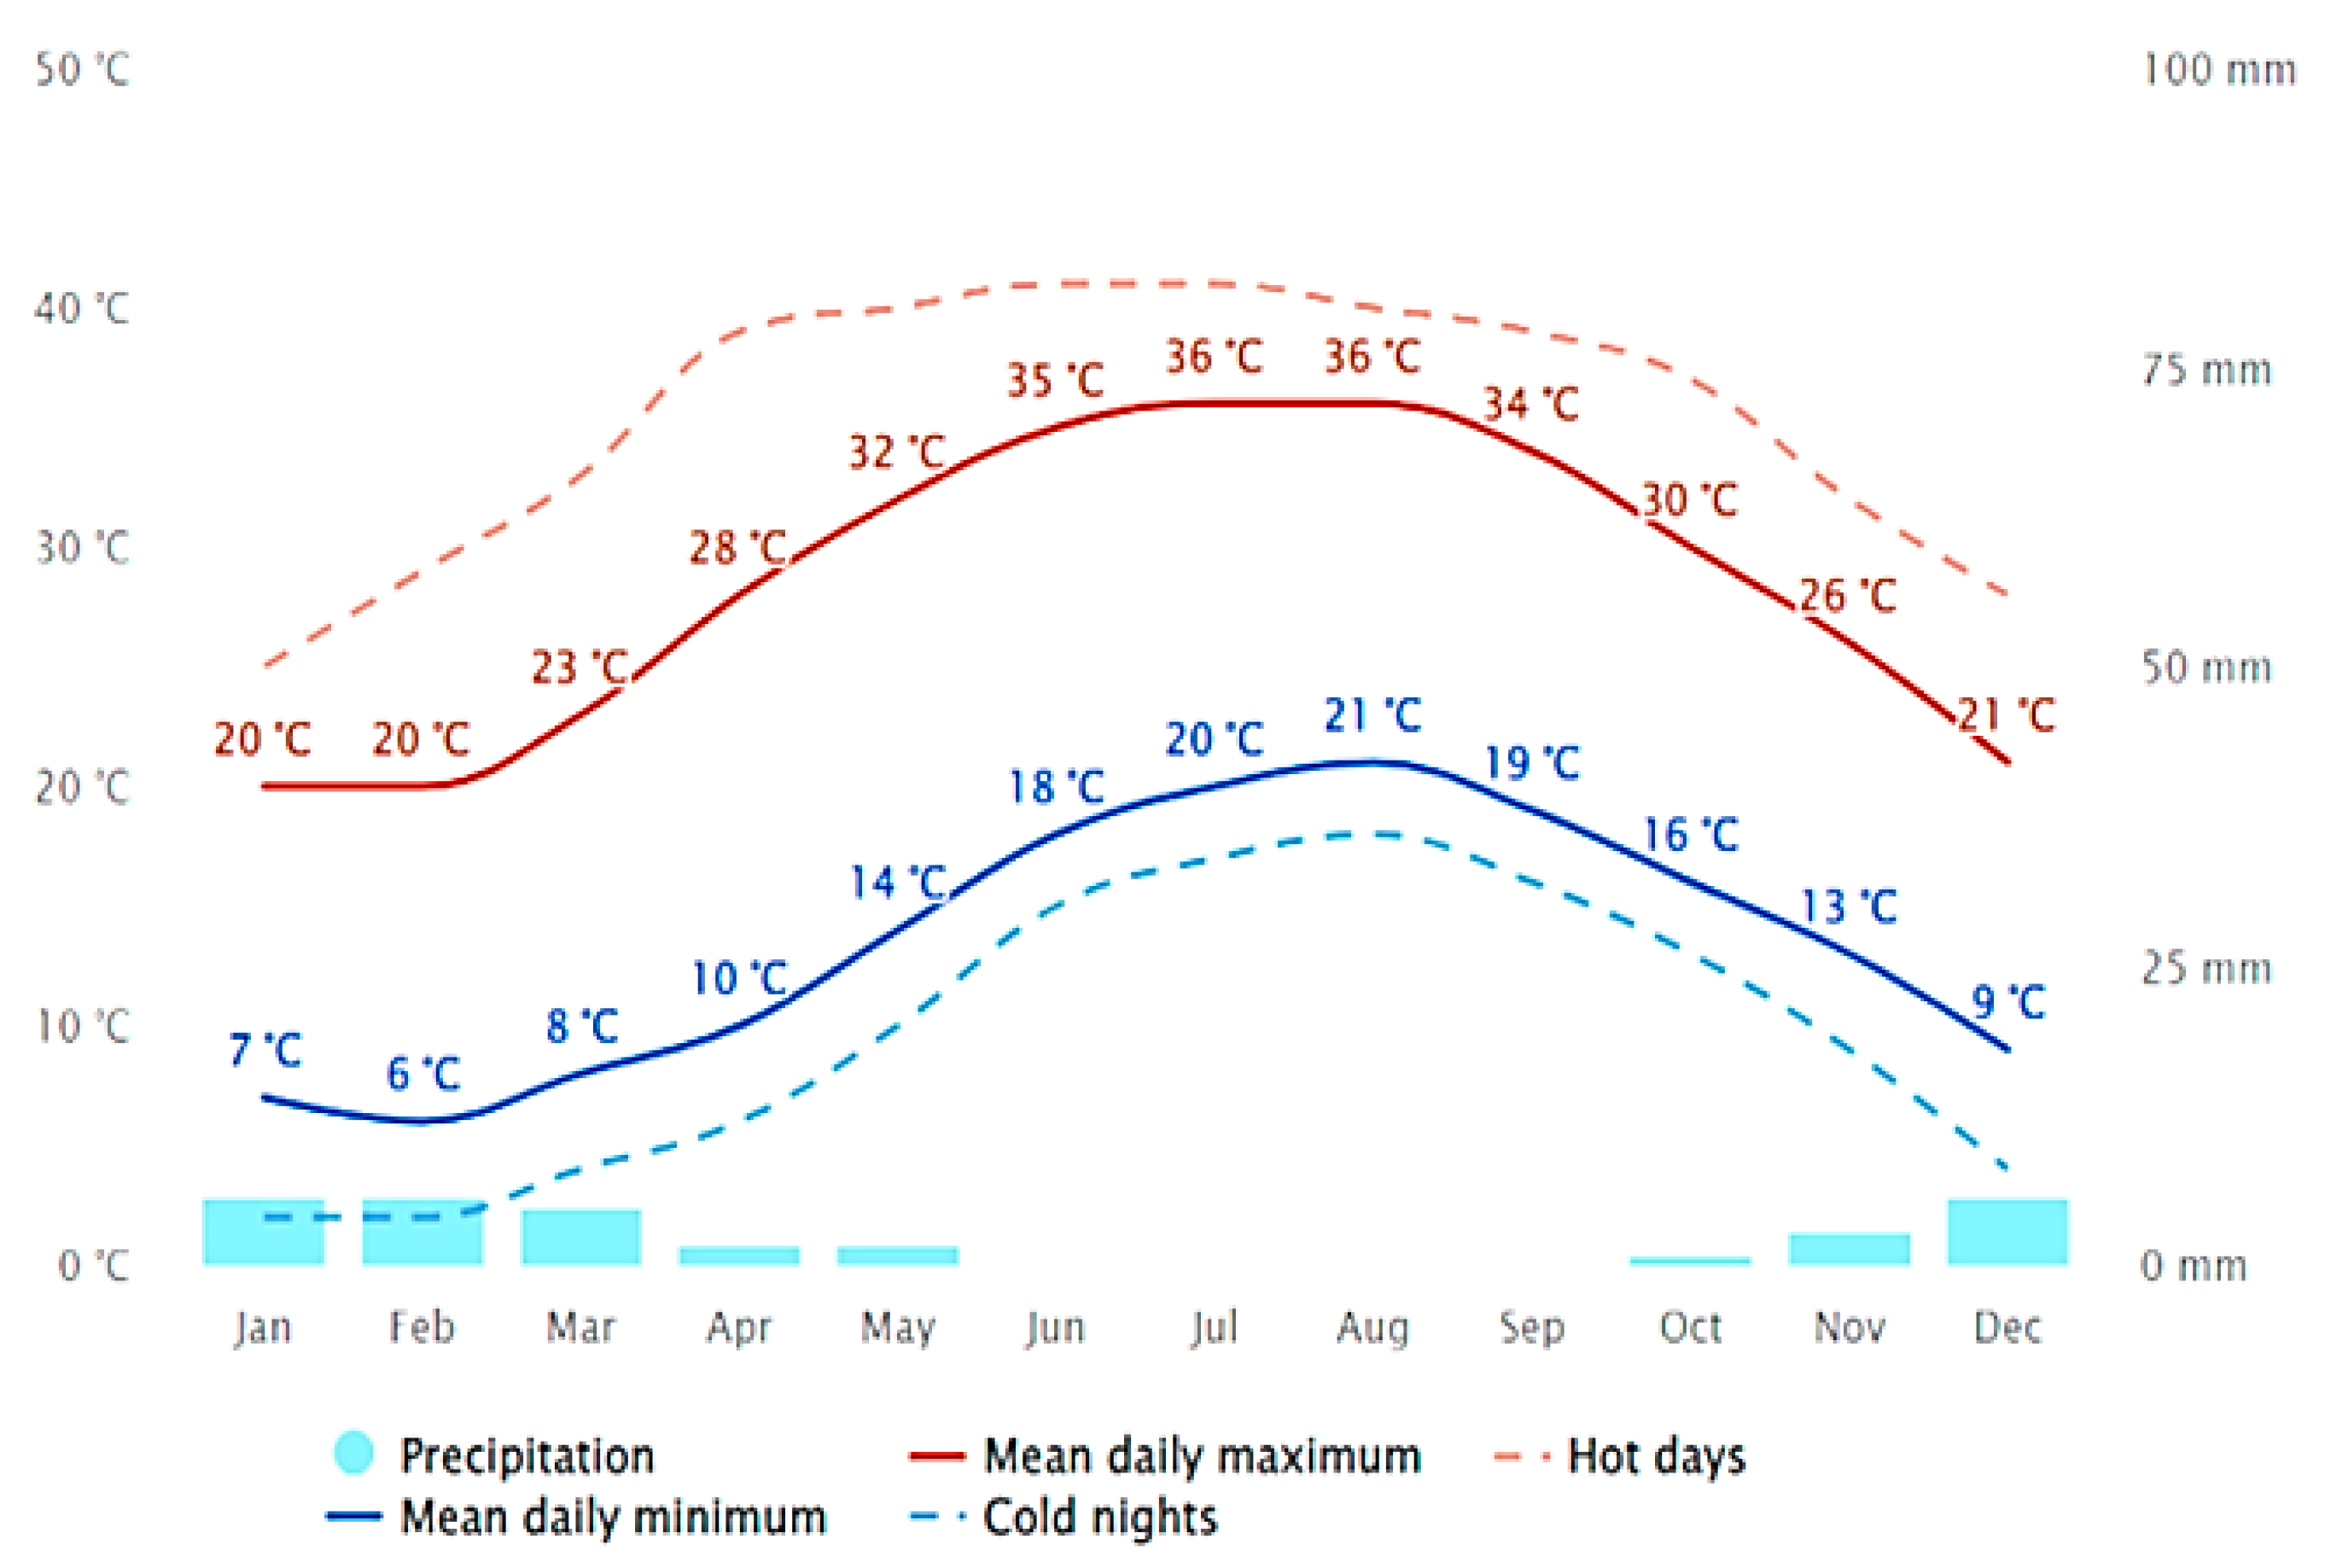
2.1. Description of the Studied Area
2.2. Soil Analysis
2.3. Soil Amelioration
2.4. Image Preprocessing and Analysis
2.4.1. Remote-Sensing Data
2.4.2. Image Preprocessing
2.4.3. Atmospheric Correction Using FLAASH Tool
2.5. Surface Interpolation Using the Ordinary Kriging Technique
2.6. Soil Salinity Indices
3. Results
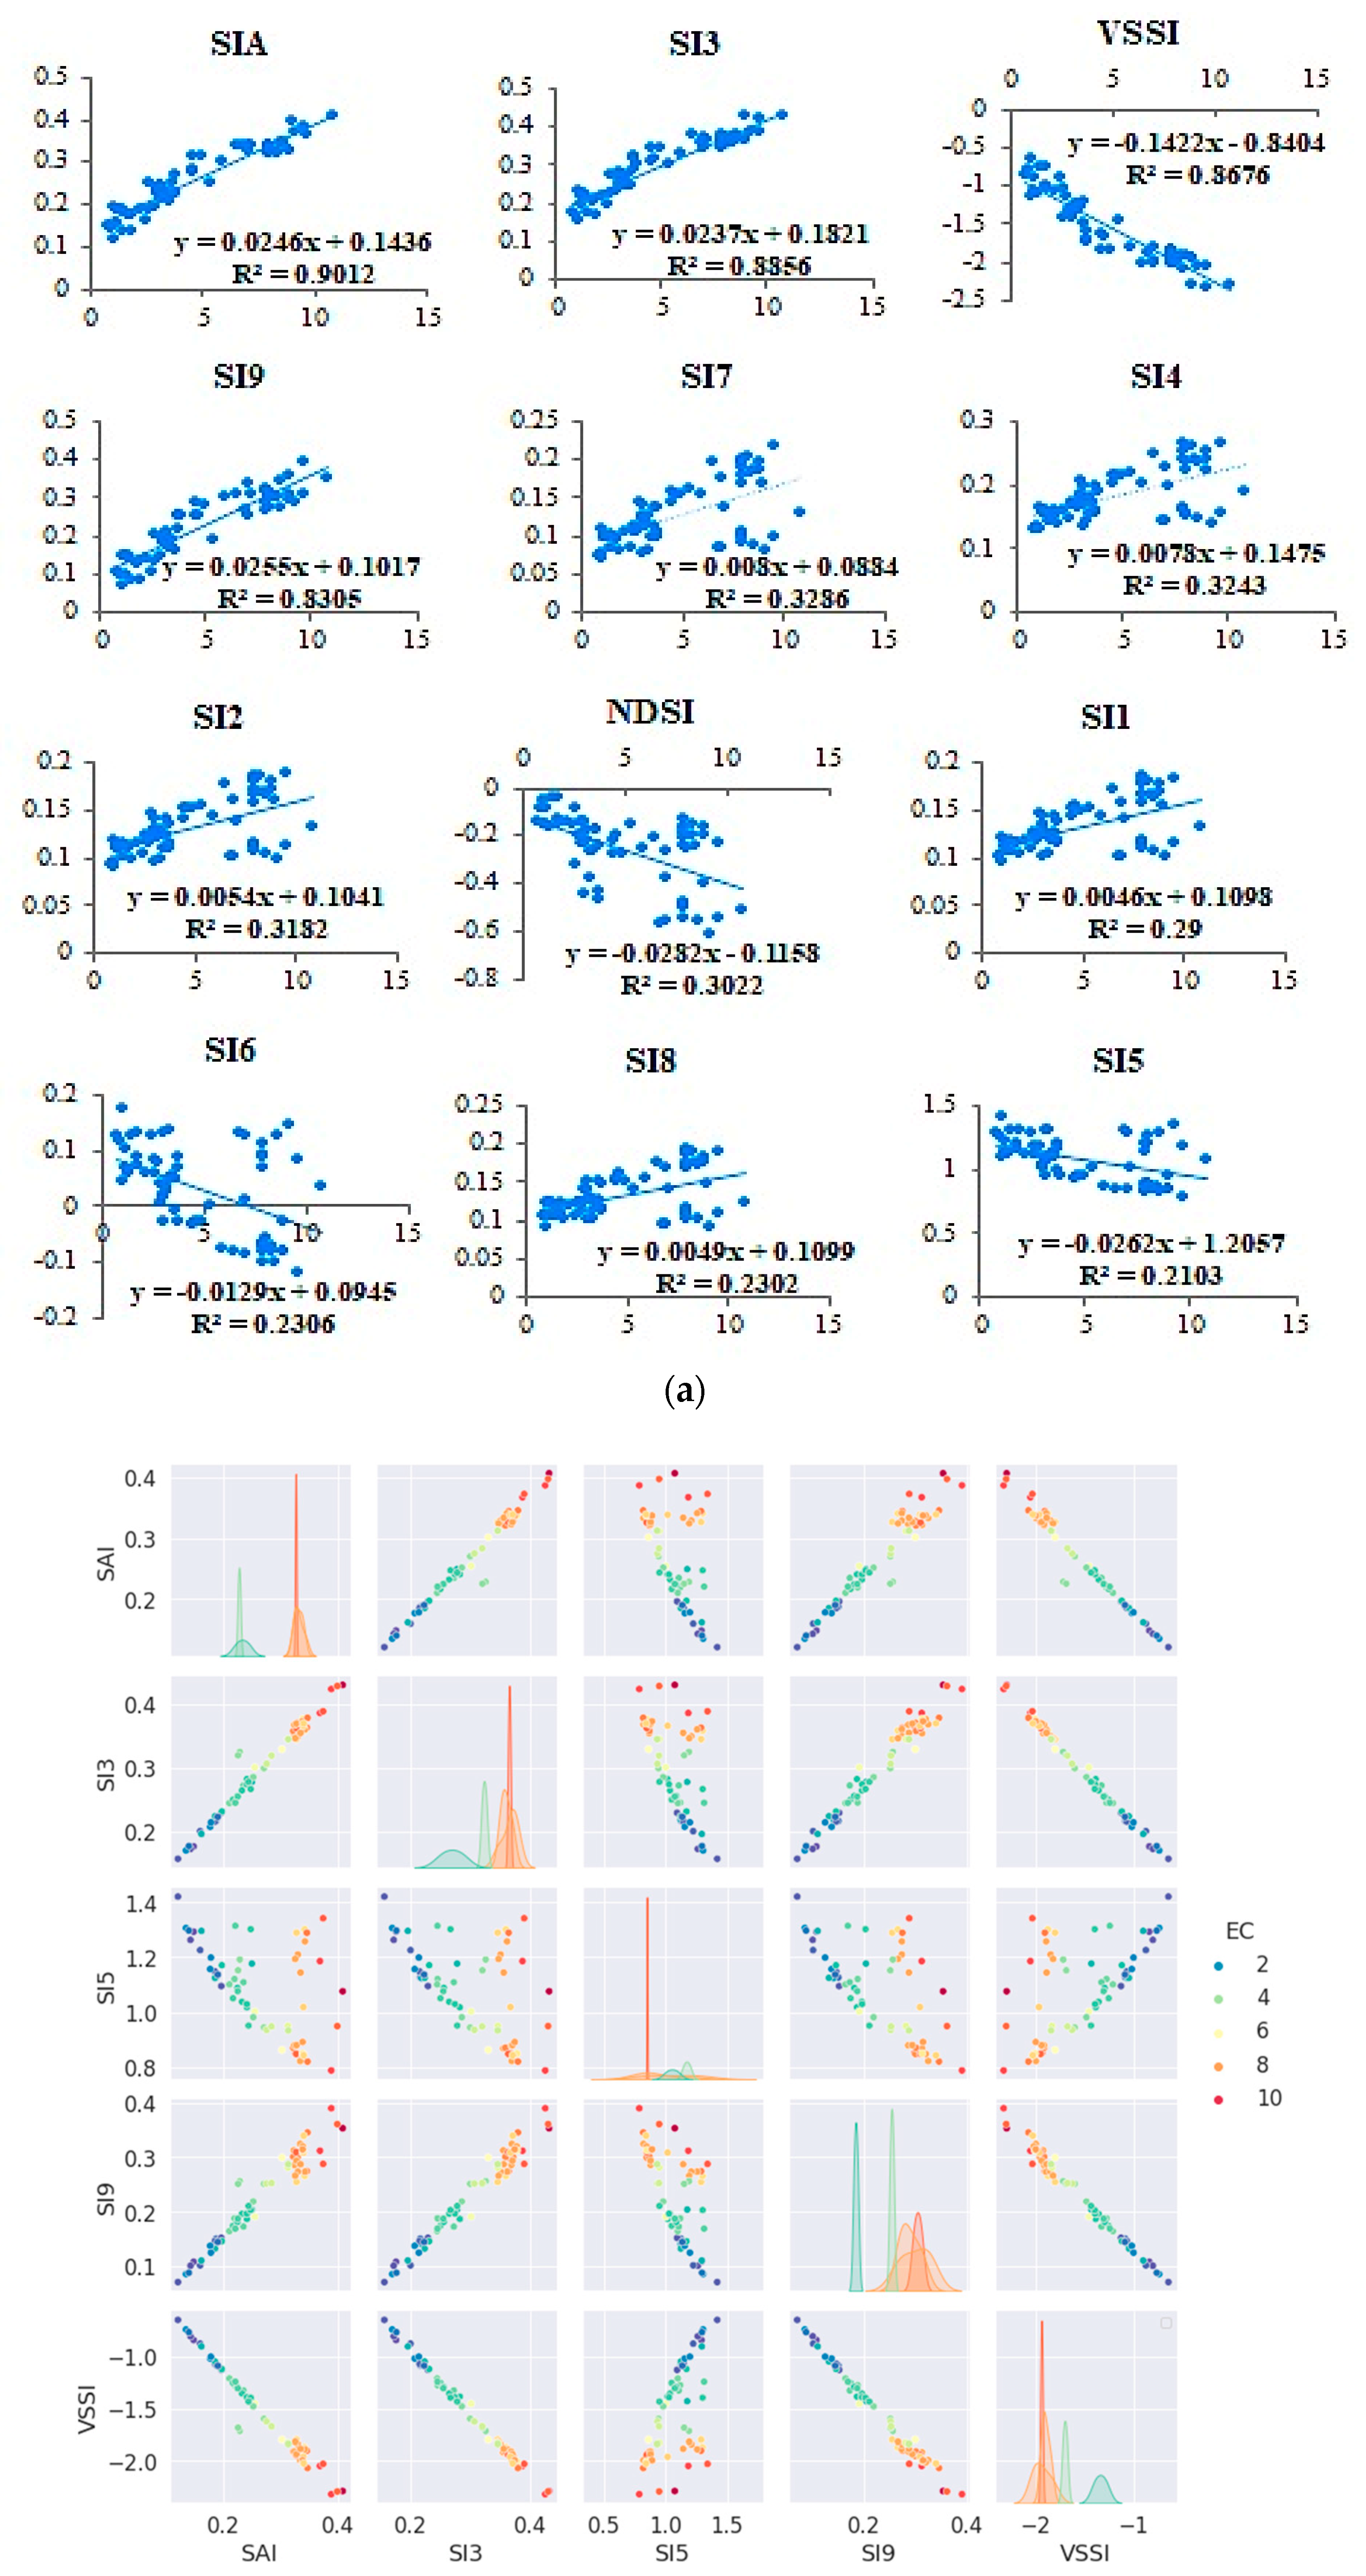
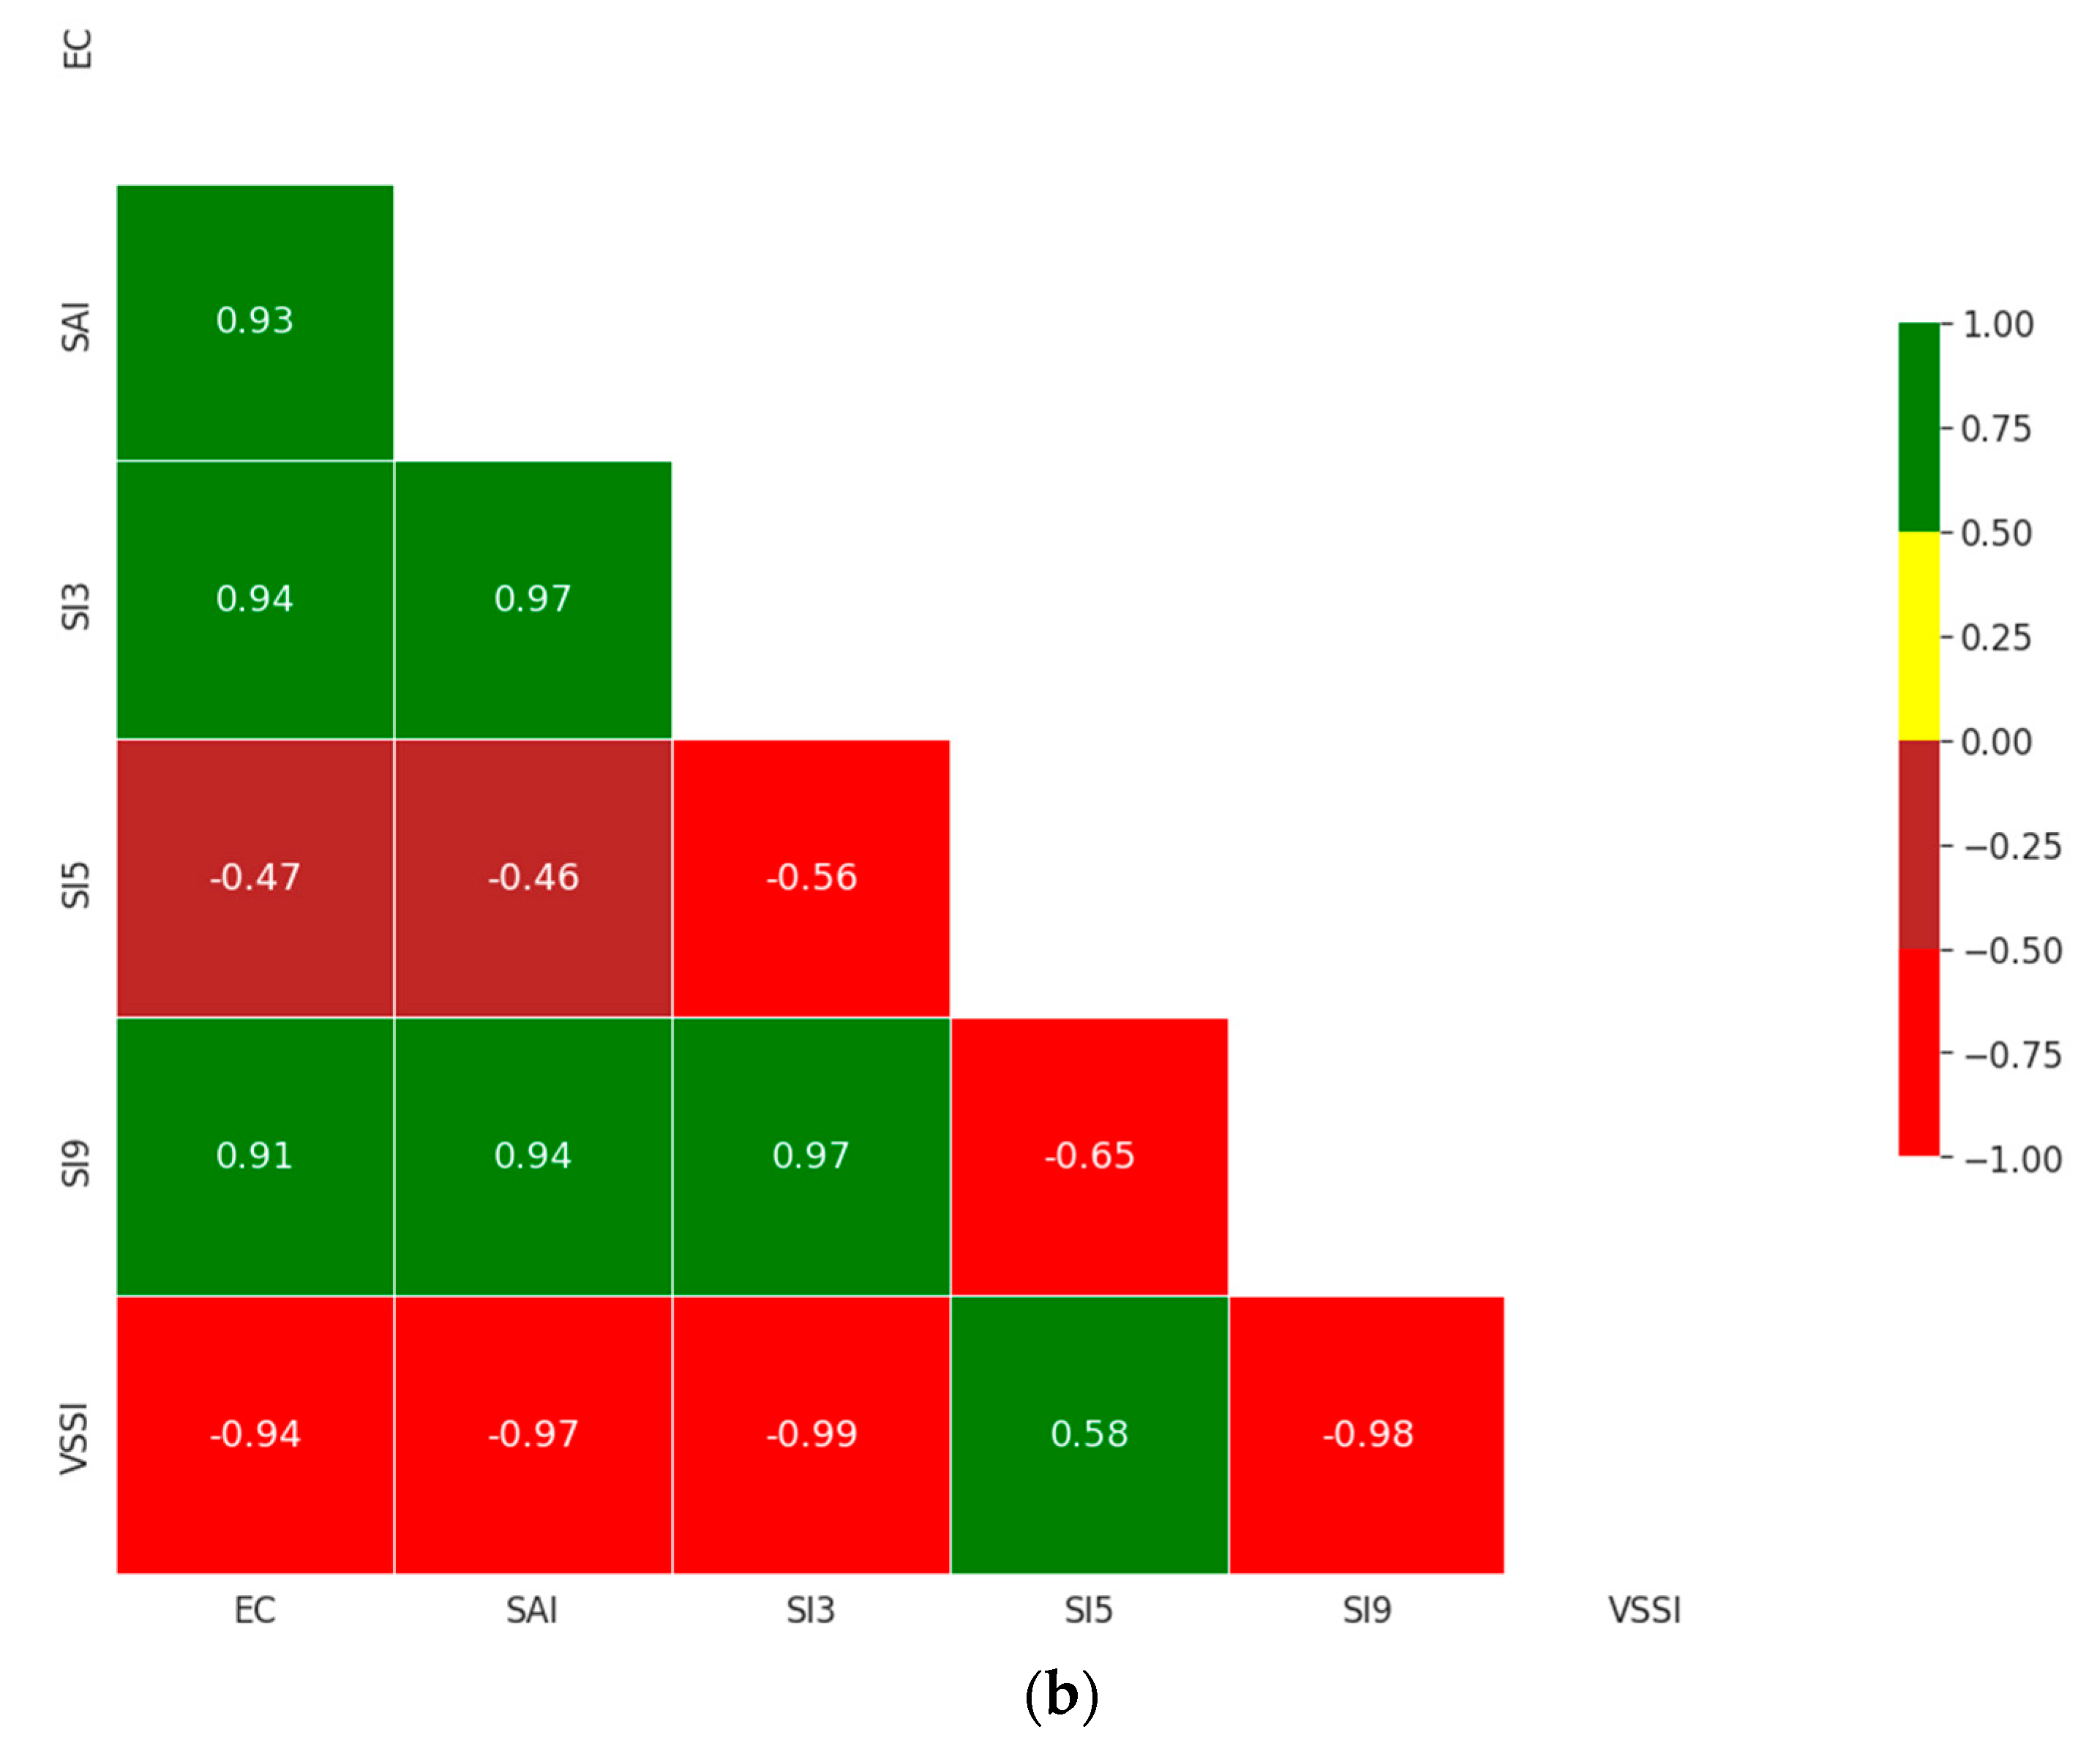
3.1. The Relationship between ECe and Remote-Sensing Spectral Indices
3.2. Land Use
3.3. Soil Quality Index (SQI)
3.4. Soil Amelioration
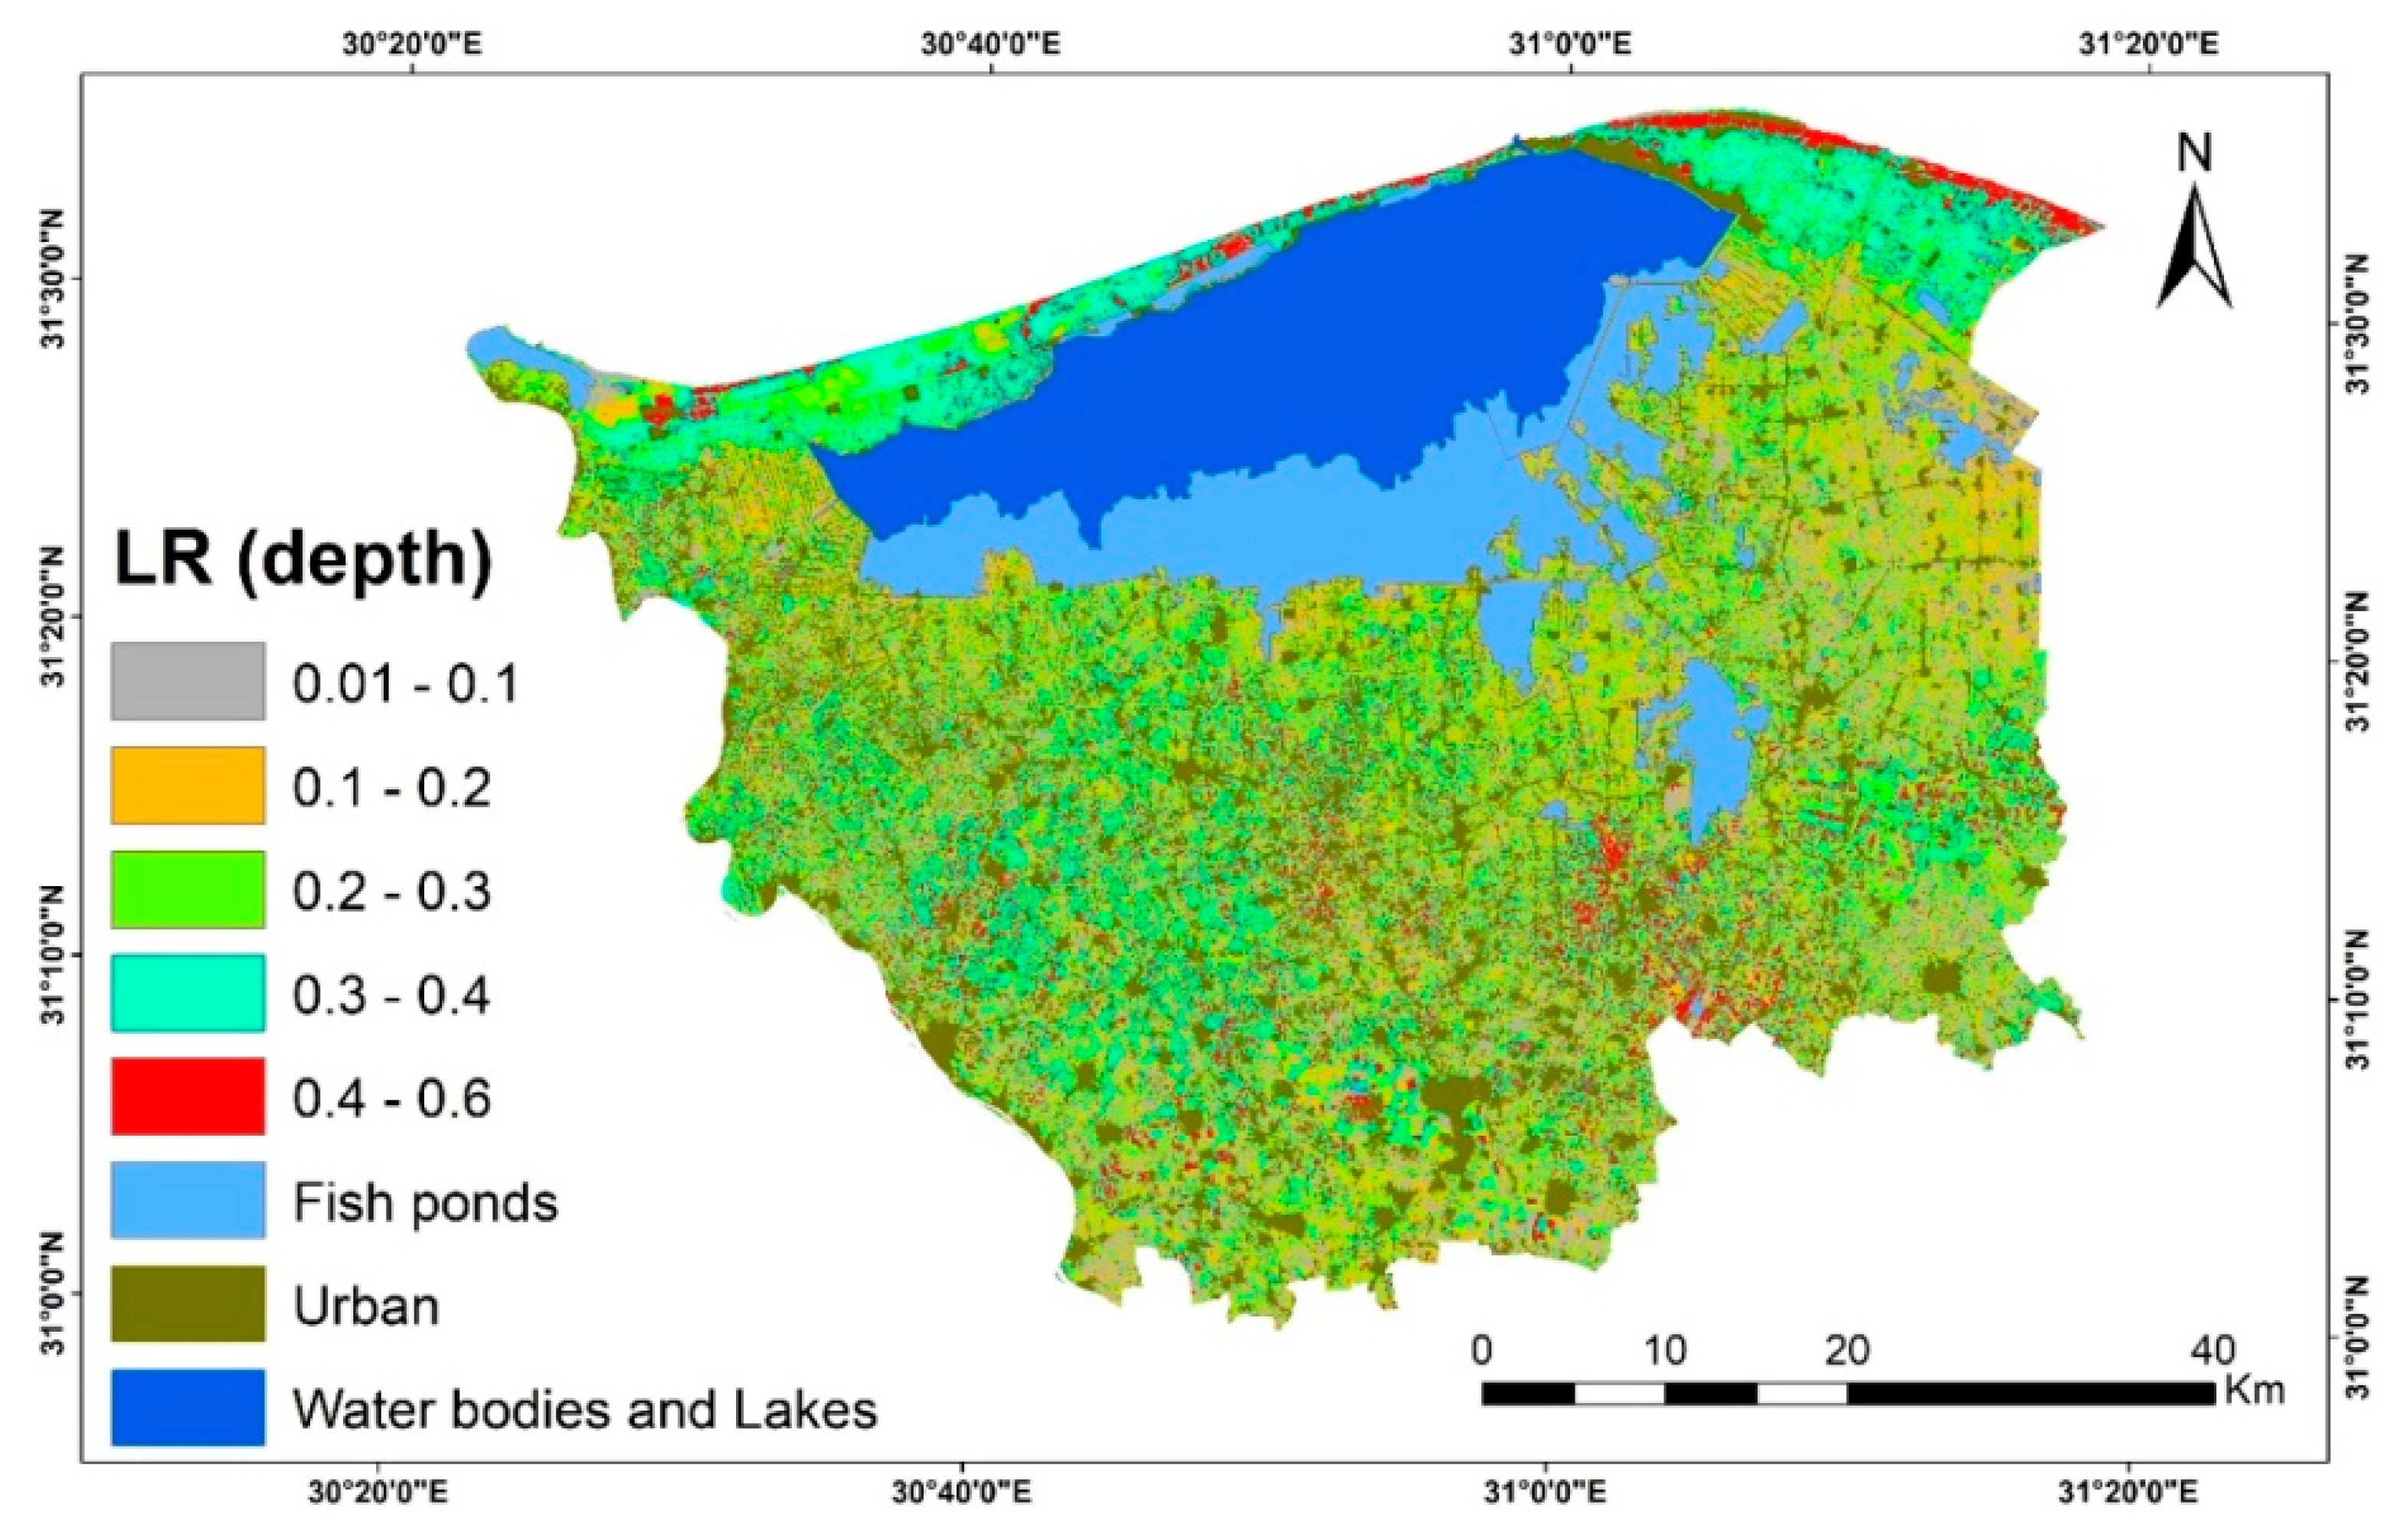
3.4.1. Leaching Water Requirements
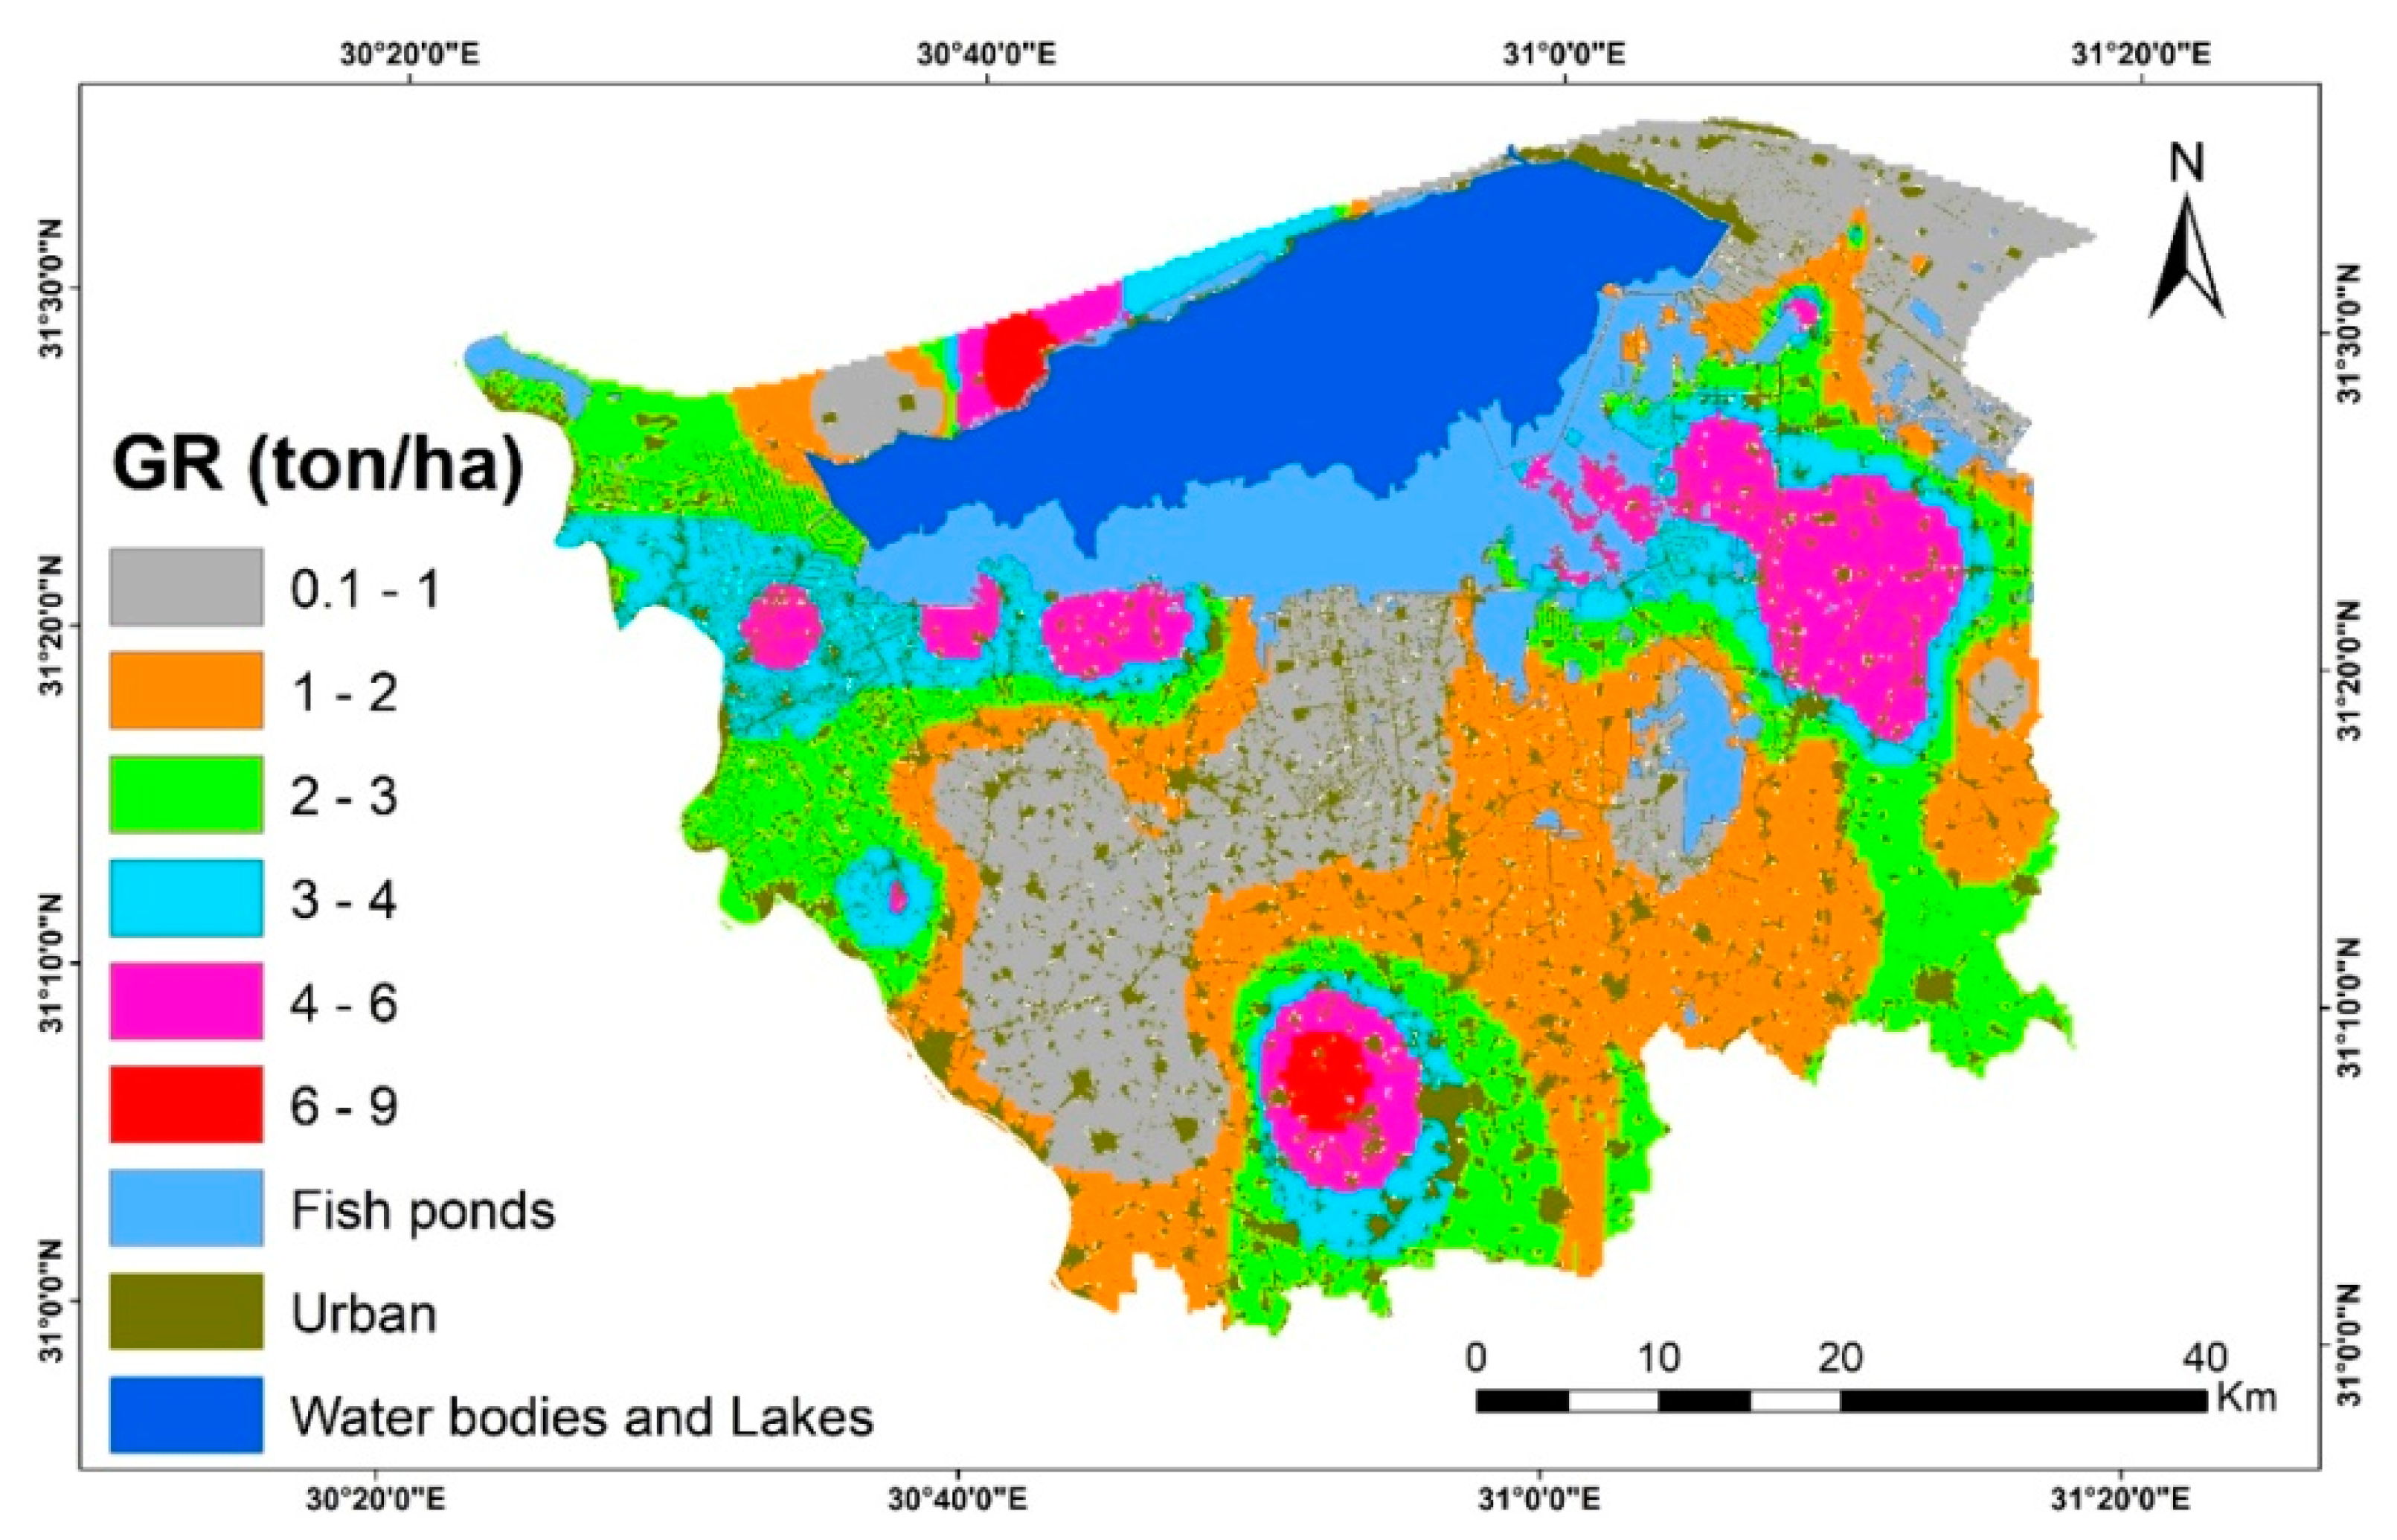
3.4.2. Gypsum Requirements
4. Discussion
5. Conclusions
Author Contributions
Funding
Data Availability Statement
Acknowledgments
Conflicts of Interest
References
- Jiang, L.; Bao, A.; Jiapaer, G.; Liu, R.; Yuan, Y.; Yu, T. Monitoring Land Degradation and Assessing Its Drivers to Support Sustainable Development Goal 15.3 in Central Asia. Sci. Total Environ. 2022, 807, 150868. [Google Scholar] [CrossRef] [PubMed]
- Ziadat, F.M.; Zdruli, P.; Christiansen, S.; Caon, L.; Abdel Monem, M.; Fetsi, T. An Overview of Land Degradation and Sustainable Land Management in the Near East and North Africa. Sustain. Agric. Res. 2022, 11, 11–24. [Google Scholar] [CrossRef]
- Kangalawe, R.Y. Land Degradation, Community Perceptions and Environmental Management Implications in the Drylands of Central Tanzania. In Sustainable Development—Authoritative and Leading Edge Content for Environmental Management [Internet]; Curkovic, S., Ed.; IntechOpen: London, UK, 2012; Available online: https://www.intechopen.com/chapters/38100 (accessed on 27 June 2022). [CrossRef]
- Palmate, S.S.; Pandey, A.; Pandey, R.P.; Mishra, S.K. Assessing the Land Degradation and Greening Response to Changes in Hydro-climatic Variables Using a Conceptual Framework: A Case-study in Central India. Land Degrad. Dev. 2021, 32, 4132–4148. [Google Scholar] [CrossRef]
- Manorama, K.; Behera, S.K.; Suresh, K.; Prasad, M.V.; Mathur, R.K.; Harinarayana, P. Mulching and Technological Interventions Avoid Land Degradation in an Intensive Oil Palm (Elaeis guineensis Jacq.) Production System. Land Degrad. Dev. 2021, 32, 3785–3797. [Google Scholar] [CrossRef]
- Cerretelli, S.; Poggio, L.; Yakob, G.; Boke, S.; Habte, M.; Coull, M.; Peressotti, A.; Black, H.; Gimona, A. The Advantages and Limitations of Global Datasets to Assess Carbon Stocks as Proxy for Land Degradation in an Ethiopian Case Study. Geoderma 2021, 399, 115117. [Google Scholar] [CrossRef]
- Rawat, L.S.; Maikhuri, R.K.; Bahuguna, Y.M.; Jugran, A.K.; Maletha, A.; Jha, N.K.; Phondani, P.C.; Dhyani, D.; Pharswan, D.S.; Chamoli, S. Rejuvenating Ecosystem Services through Reclaiming Degraded Land for Sustainable Societal Development: Implications for Conservation and Human Wellbeing. Land Use Policy 2022, 112, 105804. [Google Scholar] [CrossRef]
- Chotte, J.L.; Orr, B.J. Mitigating “Displaced” Land Degradation and the Risk of Spillover through the Decommoditization of Land Products. Land Use Policy 2021, 109, 105659. [Google Scholar] [CrossRef]
- Hossain, M.S. Present Scenario of Global Salt Affected Soils, Its Management and Importance of Salinity Research. Int. Res. J. Biol. Sci. 2019, 1, 1–3. [Google Scholar]
- Mukhopadhyay, R.; Sarkar, B.; Jat, H.S.; Sharma, P.C.; Bolan, N.S. Soil Salinity under Climate Change: Challenges for Sustainable Agriculture and Food Security. J. Environ. Manag. 2021, 280, 111736. [Google Scholar] [CrossRef]
- Sahab, S.; Suhani, I.; Srivastava, V.; Chauhan, P.S.; Singh, R.P.; Prasad, V. Potential Risk Assessment of Soil Salinity to Agroecosystem Sustainability: Current Status and Management Strategies. Sci. Total Environ. 2021, 764, 144164. [Google Scholar] [CrossRef]
- Ullah, A.; Bano, A.; Khan, N. Climate Change and Salinity Effects on Crops and Chemical Communication Between Plants and Plant Growth-Promoting Microorganisms Under Stress. Front. Sustain. Food Syst. 2021, 5, 618092. [Google Scholar] [CrossRef]
- Giller, K.E.; Delaune, T.; Silva, J.V.; Descheemaeker, K.; Ven, G.V.; Schut, A.G.T.; Wijk, M.V.; Hammond, J.; Hochman, Z.; Taulya, G.; et al. The future of farming: Who will produce our food? Food Secur. 2021, 13, 1073–1099. [Google Scholar] [CrossRef]
- Miao, Q.; Zhou, L.; Gonçalves, J.M.; Duarte, I.M.; Li, R.; Shi, H. Effects of Sand Addition to Heavy Saline-Alkali Soil on the Infiltration and Salt Leaching in Hetao Irrigation District, China. Biol. Life Sci. Forum 2021, 3, 33. [Google Scholar] [CrossRef]
- Yadav, M.S.; Yadav, P.P.S.; Yaduvanshi, M.; Verma, D.; Singh, A.N. Sustainability assessment of sodic land reclamation using remote sensing and GIS. J. Indian Soc. Remote Sens. 2010, 38, 269–278. [Google Scholar] [CrossRef]
- Sayed, Y.A.; Fadl, M.E. Agricultural Sustainability Evaluation of the New Reclaimed Soils at Dairut Area, Assiut, Egypt using GIS Modeling. Egypt. J. Remote Sens. Space Sci. 2021, 24, 707–719. [Google Scholar] [CrossRef]
- Saeed, M.; Khafagi, O.; Bedair, R. Soil Quality Assessment for Wheat Cultivation in El–Menoufia Governorate, Nile Delta, Egypt. J. Soil Sci. Agric. Eng. 2018, 9, 693–698. [Google Scholar] [CrossRef]
- Sandeep, P.; Reddy, G.P.O.; Jegankumar, R.; Kumar, K.C.A. Modeling and Assessment of Land Degradation Vulnerability in Semi-Arid Ecosystem of Southern India Using Temporal Satellite Data, AHP and GIS. Environ. Model. Assess. 2021, 26, 143–154. [Google Scholar] [CrossRef]
- Pásztor, L. Advanced GIS and RS Applications for Soil and Land Degradation Assessment and Mapping. ISPRS Int. J. Geo-Inf. 2021, 10, 128. [Google Scholar] [CrossRef]
- Feng, R.; Wang, F.; Wang, K. Spatial-Temporal Patterns and Influencing Factors of Ecological Land Degradation-Restoration in Guangdong-Hong Kong-Macao Greater Bay Area. Sci. Total Environ. 2021, 794, 148671. [Google Scholar] [CrossRef]
- Vieira, R.M.D.S.P.; Tomasella, J.; Barbosa, A.A.; Polizel, S.P.; Ometto, J.P.H.B.; Santos, F.C.; Ferreira, Y.D.C.; de Toledo, P.M. Land Degradation Mapping in the MATOPIBA Region (Brazil) Using Remote Sensing Data and Decision-Tree Analysis. Sci. Total Environ. 2021, 782, 146900. [Google Scholar] [CrossRef]
- Farah, A.; Algouti, A.; Algouti, A.; Ifkirne, M.; Ezziyani, A. Mapping of Soil Degradation in Semi-Arid Environments in the Ouarzazate Basin in the South of the Central High Atlas, Morocco, Using Sentinel 2A Data. Remote Sens. Appl. Soc. Environ. 2021, 23, 100548. [Google Scholar] [CrossRef]
- Higginbottom, T.P.; Symeonakis, E. Assessing Land Degradation and Desertification Using Vegetation Index Data: Current Frameworks and Future Directions. Remote Sens. 2014, 6, 9552–9575. [Google Scholar] [CrossRef]
- Gorji, T.; Sertel, E.; Tanik, A. Monitoring Soil Salinity via Remote Sensing Technology under Data Scarce Conditions: A Case Study from Turkey. Ecol. Indic. 2017, 74, 384–391. [Google Scholar] [CrossRef]
- Nouri, H.; Chavoshi Borujeni, S.; Alaghmand, S.; Anderson, S.J.; Sutton, P.C.; Parvazian, S.; Beecham, S. Soil Salinity Mapping of Urban Greenery Using Remote Sensing and Proximal Sensing Techniques; The Case of Veale Gardens within the Adelaide Parklands. Sustainability 2018, 10, 2826. [Google Scholar] [CrossRef]
- Mougenot, B.; Pouget, M.; Epema, G.F. Remote Sensing of Salt Affected Soils. Remote Sens. Rev. 1993, 7, 241–259. [Google Scholar] [CrossRef]
- Reddy, G.P.O. Spatial Data Management, Analysis, and Modeling in GIS: Principles and Applications. In Geospatial Technologies in Land Resources Mapping, Monitoring and Management; Springer: New York, NY, USA, 2018; pp. 127–142. [Google Scholar]
- Abuelgasim, A.; Ammad, R. Mapping Soil Salinity in Arid and Semi-Arid Regions Using Landsat 8 OLI Satellite Data. Remote Sens. Appl. Soc. Environ. 2019, 13, 415–425. [Google Scholar] [CrossRef]
- Alexakis, D.D.; Tapoglou, E.; Vozinaki, A.-E.K.; Tsanis, I.K. Integrated Use of Satellite Remote Sensing, Artificial Neural Networks, Field Spectroscopy, and GIS in Estimating Crucial Soil Parameters in Terms of Soil Erosion. Remote Sens. 2019, 11, 1106. [Google Scholar] [CrossRef]
- Prokop, P. Remote Sensing of Severely Degraded Land: Detection of Long-Term Land-Use Changes Using High-Resolution Satellite Images on the Meghalaya Plateau, Northeast India. Remote Sens. Appl. Soc. Environ. 2020, 20, 100432. [Google Scholar] [CrossRef]
- Hassani, A.; Azapagic, A.; Shokri, N. Global predictions of primary soil salinization under changing climate in the 21st century. Nat. Commun. 2021, 12, 666. [Google Scholar] [CrossRef]
- Hassani, A.; Azapagic, A.; Shokri, N. Predicting long-term dynamics of soil salinity and sodicity on a global scale. Proc. Natl. Acad. Sci. USA 2020, 117, 33017–33027. [Google Scholar] [CrossRef]
- Richards, L.A. Diagnosis and Improvement of Saline and Alkali Soils. LWW 1954, 78, 154. [Google Scholar] [CrossRef]
- Mohanavelu, A.; Naganna, S.R.; Al-Ansari, N. Irrigation Induced Salinity and Sodicity Hazards on Soil and Groundwater: An Overview of Its Causes, Impacts and Mitigation Strategies. Agriculture 2021, 11, 983. [Google Scholar] [CrossRef]
- Wang, Z.; Zhang, F.; Zhang, X.; Chan, N.W.; te Kung, H.; Ariken, M.; Zhou, X.; Wang, Y. Regional Suitability Prediction of Soil Salinization Based on Remote-Sensing Derivatives and Optimal Spectral Index. Sci. Total Environ. 2021, 775, 145807. [Google Scholar] [CrossRef] [PubMed]
- Nabiollahi, K.; Taghizadeh-Mehrjardi, R.; Shahabi, A.; Heung, B.; Amirian-Chakan, A.; Davari, M.; Scholten, T. Assessing Agricultural Salt-Affected Land Using Digital Soil Mapping and Hybridized Random Forests. Geoderma 2021, 385, 114858. [Google Scholar] [CrossRef]
- Elnaggar, A.A.; Noller, J.S. Application of Remote-Sensing Data and Decision-Tree Analysis to Mapping Salt-Affected Soils over Large Areas. Remote Sens. 2010, 2, 151–165. [Google Scholar] [CrossRef]
- Nguyen, K.-A.; Liou, Y.-A.; Tran, H.-P.; Hoang, P.-P.; Nguyen, T.-H. Soil Salinity Assessment by Using Near-Infrared Channel and Vegetation Soil Salinity Index Derived from Landsat 8 OLI Data: A Case Study in the Tra Vinh Province, Mekong Delta, Vietnam. Prog. Earth Planet. Sci. 2020, 7, 1–16. [Google Scholar] [CrossRef]
- Jiang, X.; Duan, H.; Liao, J.; Guo, P.; Huang, C.; Xue, X. Estimation of Soil Salinization by Machine Learning Algorithms in Different Arid Regions of Northwest China. Remote Sens. 2022, 14, 347. [Google Scholar] [CrossRef]
- Scudiero, E.; Skaggs, T.H.; Corwin, D.L. Regional-Scale Soil Salinity Assessment Using Landsat ETM+ Canopy Reflectance. Remote Sens. Environ. 2015, 169, 335–343. [Google Scholar] [CrossRef]
- Nguyen, A.K.; Liou, Y.-A.; Li, M.-H.; Tran, T.A. Zoning Eco-Environmental Vulnerability for Environmental Management and Protection. Ecol. Indic. 2016, 69, 100–117. [Google Scholar] [CrossRef]
- Liou, Y.-A.; Nguyen, A.K.; Li, M.-H. Assessing Spatiotemporal Eco-Environmental Vulnerability by Landsat Data. Ecol. Indic. 2017, 80, 52–65. [Google Scholar] [CrossRef]
- AL-Khakani, E.T.; Al-Janabi, W.F.; Sa’ad, R.Y.; Al-Kazaali, H.M. Using Landsat 8 OLI Data to Predict and Mapping Soil Salinity for Part of An-Najaf Governorate. Ecol. Environ. Conserv. 2018, 24, 572–578. [Google Scholar]
- Essahlaoui, A.; Teodoro, A.C.; Mohajane, M. Modeling and Mapping of Soil Salinity in Tafilalet Plain (Morocco). Arab. J. Geosci. 2019, 12, 1–7. [Google Scholar]
- El Baroudy, A.A. Monitoring land degradation using remote sensing and GIS techniques in an area of the middle Nile Delta, Egypt. Catena 2011, 87, 201–208. [Google Scholar] [CrossRef]
- Mohamed, E.S.; Belal, A.; Saleh, A. Assessment of Land Degradation East of the Nile Delta, Egypt Using Remote Sensing and GIS Techniques. Arab. J. Geosci. 2013, 6, 2843–2853. [Google Scholar] [CrossRef]
- Arnous, M.O.; Green, D.R. Monitoring and Assessing Waterlogged and Salt-Affected Areas in the Eastern Nile Delta Region, Egypt, Using Remotely Sensed Multi-Temporal Data and GIS. J. Coast. Conserv. 2015, 19, 369–391. [Google Scholar] [CrossRef]
- El Baroudy, A.A. Mapping and Evaluating Land Suitability Using a GIS-Based Model. Catena 2016, 140, 96–104. [Google Scholar] [CrossRef]
- Ali, R.R.; Saber, M.; Nizinski, J.J.; Montoroi, J.-P.; Zaghloul, A.M. Land Surface Analysis of Salt Affected Soils Using DEM and GIS. Eur. J. Sci. Res. 2016, 138, 197–202. [Google Scholar]
- Elbasiouny, H.; Elbehiry, F.; Abowaly, M. Soil Quality Indices; Special Focus on Salt-Affected Soil: Review and Case Study in Northern Egypt. Environ. Biodivers. Soil Secur. 2017, 1, 85–100. [Google Scholar] [CrossRef][Green Version]
- Yossif, M.H.T. Change Detection of Land Cover and Salt Affected Soils at Siwa Oasis, Egypt. Alex. Sci. Exch. J. 2017, 38, 446–462. [Google Scholar]
- Abou Samra, R.M.; Ali, R.R. The Development of an Overlay Model to Predict Soil Salinity Risks by Using Remote Sensing and GIS Techniques: A Case Study in Soils around Idku Lake, Egypt. Environ. Monit. Assess. 2018, 190, 1–16. [Google Scholar] [CrossRef]
- AbdelRahman, M.A.E.; Metwaly, M.M.; Shalaby, A. Quantitative Assessment of Soil Saline Degradation Using Remote Sensing Indices in Siwa Oasis. Remote Sens. Appl. Soc. Environ. 2019, 13, 53–60. [Google Scholar]
- AbdelRahman, M.A.E.; Natarajan, A.; Hegde, R.; Prakash, S.S. Assessment of Land Degradation Using Comprehensive Geostatistical Approach and Remote Sensing Data in GIS-Model Builder. Egypt. J. Remote Sens. Space Sci. 2019, 22, 323–334. [Google Scholar] [CrossRef]
- El Baroudy, A.A.; Moghanm, F.S. Combined use of remote sensing and GIS for degradation risk assessment in some soils of the Northern Nile Delta, Egypt. Egypt. J. Remote Sens. Space Sci. 2014, 17, 77–85. [Google Scholar] [CrossRef]
- Shokr, M.S.; Abdellatif, M.; El Baroudy, A.A.; Elnashar, A.; Ali, E.F.; Belal, A.A.; Attia, W.; Ahmed, M.; Aldosari, A.A.; Szantoi, Z. Development of a Spatial Model for Soil Quality Assessment under Arid and Semi-Arid Conditions. Sustainability 2021, 13, 2893. [Google Scholar] [CrossRef]
- Gabriel, J.L.; Vanclooster, M.; Quemada, M. Integrating Water, Nitrogen, and Salinity in Sustainable Irrigated Systems: Cover Crops versus Fallow. J. Irrig. Drain. Eng. 2014, 140, A4014002. [Google Scholar] [CrossRef]
- Zayed, A.M.A.; Al-Toukhy, A.A.; El-Tapey, H.M.A. Pedological features of some Western Delta soils, Egypt and their relationships with different taxonomic systems. Middle East J. Agric. Res. 2021, 10, 852–865. [Google Scholar] [CrossRef]
- El-Ramady, H.; Abowaly, M.; Elbehiry, F.; Omara, A.E.; Elsakhawy, T.; Mohamed, E.S.; Belal, A.; Elbasiouny, H.; Fawzy, Z.F. Stressful Environments and Sustainable Soil Management: A Case Study of Kafr El-Sheikh, Egypt. Environ. Biodivers. Soil Secur. 2019, 3, 193–213. [Google Scholar] [CrossRef]
- Mahdy, E.E.; Mahrous, H.; Sayed, M.A.; Housein, M.G. Salinity indices and path analysis in Egyptian long-staple cotton cultivars. SVU-Int. J. Agric. Sci. 2021, 13, 105–118. [Google Scholar] [CrossRef]
- Shaddad, S.M.; Hendawi, M.Y. Site-Specific Leaching Map of a Salt Affected Soil in Egypt. Biomed. J. Sci. Tech. Res. 2018, 2, 2768–2773. [Google Scholar] [CrossRef]
- Shahid, S.A.; Zaman, M.; Heng, L. Introduction to Soil Salinity, Sodicity and Diagnostics Techniques. In Guideline for Salinity Assessment, Mitigation and Adaptation Using Nuclear and Related Techniques; Springer: Cham, Switzerland, 2018. [Google Scholar] [CrossRef]
- Li, J.; Pu, L.; Zhu, M.; Zhang, R. The Present Situation and Hot Issues in the Salt-Affected Soil Research. Acta Geogr. Sin 2012, 67, 1233–1245. [Google Scholar]
- Zhang, Y.; Li, X.; Šimůnek, J.; Shi, H.; Chen, N.; Hu, Q.; Tian, T. Evaluating Soil Salt Dynamics in a Field Drip-Irrigated with Brackish Water and Leached with Freshwater during Different Crop Growth Stages. Agric. Water Manag. 2021, 244, 106601. [Google Scholar] [CrossRef]
- Gupta, M.; Srivastava, P.K.; NIRANJAN, A.; TEWARI, S.K. Use of a Bioaugmented Organic Soil Amendment in Combination with Gypsum for Withania Somnifera Growth on Sodic Soil. Pedosphere 2016, 26, 299–309. [Google Scholar] [CrossRef]
- Alcívar, M.; Zurita-Silva, A.; Sandoval, M.; Muñoz, C.; Schoebitz, M. Reclamation of Saline–Sodic Soils with Combined Amendments: Impact on Quinoa Performance and Biological Soil Quality. Sustainability 2018, 10, 3083. [Google Scholar] [CrossRef]
- Kost, D.; Ladwig, K.J.; Chen, L.; DeSutter, T.M.; Espinoza, L.; Norton, L.D.; Smeal, D.; Torbert, H.A.; Watts, D.B.; Wolkowski, R.P. Meta-Analysis of Gypsum Effects on Crop Yields and Chemistry of Soils, Plant Tissues, and Vadose Water at Various Research Sites in the USA. J. Environ. Qual. 2018, 47, 1284–1292. [Google Scholar] [CrossRef] [PubMed]
- Presley, D.; He, Y.; Tomlinson, P. Soil Health and Yields on Non-Sodic Soils Amended with Flue Gas Desulfurization Gypsum. Crop. Forage Turfgrass Manag. 2018, 4, 1–6. [Google Scholar] [CrossRef]
- Safdar, H.; Amin, A.; Shafiq, Y.; Ali, A.; Yasin, R.; Shoukat, A.; Hussan, M.U.; Sarwar, M.I. A Review: Impact of Salinity on Plant Growth. Nat. Sci. 2019, 17, 34–40. [Google Scholar]
- Fontoura, S.M.V.; de Castro Pias, O.H.; Tiecher, T.; Cherubin, M.R.; de Moraes, R.P.; Bayer, C. Effect of Gypsum Rates and Lime with Different Reactivity on Soil Acidity and Crop Grain Yields in a Subtropical Oxisol under No-Tillage. Soil Tillage Res. 2019, 193, 27–41. [Google Scholar] [CrossRef]
- Aboelsoud, H.; Engel, B.; Gad, K. Effect of Planting Methods and Gypsum Application on Yield and Water Productivity of Wheat under Salinity Conditions in North Nile Delta. Agronomy 2020, 10, 853. [Google Scholar] [CrossRef]
- Zhang, Y.; Jingsong, Y.; Rongjiang, Y.A.O.; Xiangping, W.; Wenping, X.I.E. Short-Term Effects of Biochar and Gypsum on Soil Hydraulic Properties and Sodicity in a Saline-Alkali Soil. Pedosphere 2020, 30, 694–702. [Google Scholar] [CrossRef]
- El-Hady, A.; Abdrabelnabi, M.; Abdelaty, E.F. GIS—Comprehensive Analytical Approach for Soil Use by Linking Crop Soil Suitability to Soil Management and Reclamation. Alex. Sci. Exch. J. 2019, 40, 60–81. [Google Scholar] [CrossRef]
- Kotb, T.H.S.; Watanabe, T.; Ogino, Y.; Tanji, K.K. Soil salinization in the Nile Delta and related policy issues in Egypt. Agric. Water Manag. 2000, 43, 239–261. [Google Scholar] [CrossRef]
- Mohamed, E.; Belal, A.-A.; Ali, R.R.; Saleh, A.; Hendawy, E.A. Land Degradation. In The Soils of Egypt; Springer: Cham, Switzerland, 2019; pp. 159–174. [Google Scholar]
- Aitta, A.; El-Ramady, H.; Alshaal, T.; El-Henawy, A.; Shams, M.; Talha, N.; Elbehiry, F.; Brevik, E.C. Seasonal and Spatial Distribution of Soil Trace Elements around Kitchener Drain in the Northern Nile Delta, Egypt. Agriculture 2019, 9, 152. [Google Scholar] [CrossRef]
- Abd-Elwahed, M.S. Influence of long-term wastewater irrigation on soil quality and its spatial distribution. Ann. Agric. Sci. 2018, 63, 191–199. [Google Scholar] [CrossRef]
- El-Alfy, M.A.; El-Amier, Y.A.; Abd El-Hamid, H.T. Soil quality and health risk assessment of heavy metals in agricultural areas irrigated with wastewater from Kitchener Drain, Nile Delta, Egypt. J. Sci. Agric. 2017, 1, 158–170. [Google Scholar] [CrossRef][Green Version]
- Eid, E.M.; Galal, T.M.; Sewelam, N.A.; Talha, N.I.; Abdallah, S.M. Phytoremediation of heavy metals by four aquatic macrophytes and their potential use as contamination indicators: A comparative assessment. Environ. Sci. Pollut. Res. 2020, 27, 12138–12151. [Google Scholar] [CrossRef]
- AbdelRahman, M.A.E.; Shalaby, A.; Aboelsoud, M.H.; Moghanm, F.S. GIS Spatial Model Based for Determining Actual Land Degradation Status in Kafr El-Sheikh Governorate, North Nile Delta. Model. Earth Syst. Environ. 2018, 4, 359–372. [Google Scholar] [CrossRef]
- AbdelRahman, M.A.E.; Afifi, A.A.; Scopa, A. A Time Series Investigation to Assess Climate Change and Anthropogenic Impacts on Quantitative Land Degradation in the North Delta, Egypt. ISPRS Int. J. Geo-Inf. 2022, 11, 30. [Google Scholar] [CrossRef]
- Conoco Geologic Map of Egypt. Egyptian General Authority for Petroleum (UNESCO Joint Map Project), 20 Sheets, Scale 1:50,000; Conoco Geologic Map of Egypt: Cairo, Egypt, 1987. [Google Scholar]
- Said, R. The River Nile Geology and Hydrology and Utilization by Rushdi Said; Pergman Press: Oxford, UK, 1993. [Google Scholar]
- MWRI. Water Resources Plan for Kafr El-Sheikh Governorate, The National Water Resources Plan Project; MWRI: Pittsburgh, PA, USA, 2016. [Google Scholar]
- Alkhawaga, A.; Zeidan, B.; Elshemy, M. Climate change impacts on water security elements of Kafr El-Sheikh governorate, Egypt. Agric. Water Manag. 2022, 259, 107217. [Google Scholar] [CrossRef]
- Ali, H.M.; EL-Mahrouk, E.M.; Hassan, F.A.; EL-Tarawy, M.A. Usage of sewage effluent in irrigation of some woody tree seedlings. Part 3: Swietenia mahagoni (L.) Jacq. Saudi J. Biol. Sci. 2011, 18, 201–207. [Google Scholar] [CrossRef]
- Page, A.L.; Miller, R.H.; Keeney, D.R. Methods of Soil Analysis, Part 2—Chemical and Microbiological Properties, 2nd ed.; American Society of Agronomy, Inc. Soil Science Society of America, Inc. Publishers: Madison, WI, USA, 1982. [Google Scholar]
- Nelson, D.W.; Sommers, L. Total Carbon, Organic Carbon, and Organic Matter. Methods Soil Anal. Part 2 Chem. Microbiol. Prop. 1983, 9, 539–579. [Google Scholar]
- Cottenie, A.; Verloo, M.; Kiekens, L.; Velghe, G.; Camerlynck, R. Chemical Analysis of Plants and Soils; Laboratory Agrochemicals State University: Gent, Belgium, 1982; p. 63. [Google Scholar]
- Rhoades, J.D. Drainage for Salinity Control. Drain. Agric. 1974, 17, 433–461. [Google Scholar]
- ESRI. ArcGIS Desktop Spatial Analyst Extension: Release 10.1; Enviromental Systems Research Institute: Redlands, CA, USA, 2012. [Google Scholar]
- Dehni, A.; Lounis, M. Remote Sensing Techniques for Salt Affected Soil Mapping: Application to the Oran Region of Algeria. Procedia Eng. 2012, 33, 188–198. [Google Scholar] [CrossRef]
- AbdelRahman, M.A.E.; Afifi, A.A.; D’Antonio, P.; Gabr, S.S.; Scopa, A. Detecting and Mapping Salt-Affected Soil with Arid Integrated Indices in Feature Space using Multi-Temporal Landsat Imagery. Remote Sens. 2022, 14, 2599. [Google Scholar] [CrossRef]
- Khan, N.M.; Rastoskuev, V.V.; Sato, Y.; Shiozawa, S. Assessment of hydrosaline land degradation by using a simple approach of remote sensing indicators. Agric. Water Manag. 2005, 77, 96–109. [Google Scholar] [CrossRef]
- Alhammadi, M.S.; Glenn, E.P. Detecting Date Palm Trees Health and Vegetation Greenness Change on the Eastern Coast of the United Arab Emirates Using SAVI. Int. J. Remote Sens. 2008, 29, 1745–1765. [Google Scholar] [CrossRef]
- Nicolas, H.; Walter, C. Detecting Salinity Hazards within a Semiarid Context by Means of Combining Soil and Remote-Sensing Data. Geoderma 2006, 134, 217–230. [Google Scholar]
- Bannari, A.; Guedon, A.M.; El-Harti, A.; Cherkaoui, F.Z.; El-Ghmari, A. Characterization of Slightly and Moderately Saline and Sodic Soils in Irrigated Agricultural Land Using Simulated Data of Advanced Land Imaging (EO-1) Sensor. Commun. Soil Sci. Plant Anal. 2008, 39, 2795–2811. [Google Scholar] [CrossRef]
- Khan, S.; Abbas, A. Using Remote Sensing Techniques for Appraisal of Irrigated Soil Salinity; Integrated Systems for Sustainability MODSIM07; Modelling and Simulation Society of Australia and New Zealand: Christchurch, New Zealand, 2007; pp. 2632–2638. [Google Scholar]
- Kaufman, Y.J.; Wald, A.E.; Remer, L.-A.; Gao, B.C.; Li, R.R.; Flynn, L. The MODIS 2.1-mm channel-correlation with visible reflectance for use in remote sensing of aerosol. IEEE Trans. Geosci. Remote Sens. 1997, 35, 1286–1298. [Google Scholar] [CrossRef]
- Felde, G.W.; Anderson, G.P.; Adler-Golden, S.M.; Matthew, M.W.; Berk, A. Analysis of Hyperion data with the FLAASH atmospheric correction algorithm. In Proceedings of the Algorithms and Technologies for Multispectral, Hyperspectral, and Ultraspectral Imagery IX, SPIE Aerosense Conference, Orlando, FL, USA, 21–25 April 2003. [Google Scholar]
- Zanter, K. Landsat 8 (L8) Data Users Handbook, LSDS-1574, Version 2.0, March 29 2016; Department of the Interior U.S. Geological Survey, EROS: Sioux Falls, SD, USA, 2016. [Google Scholar]
- Allbed, A.; Kumar, L.; Sinha, P. Mapping and Modelling Spatial Variation in Soil Salinity in the Al Hassa Oasis Based on Remote Sensing Indicators and Regression Techniques. Remote Sens. 2014, 6, 1137–1157. [Google Scholar] [CrossRef]
- Asfaw, E.; Suryabhagavan, K.V.; Argaw, M. Soil Salinity Modeling and Mapping Using Remote Sensing and GIS: The Case of Wonji Sugar Cane Irrigation Farm, Ethiopia. J. Saudi Soc. Agric. Sci. 2018, 17, 250–258. [Google Scholar] [CrossRef]
- Elhag, M. Evaluation of Different Soil Salinity Mapping Using Remote Sensing Techniques in Arid Ecosystems, Saudi Arabia. J. Sens. 2016, 2016, 1–8. [Google Scholar] [CrossRef]
- Enar, K.A.; El Baroudy, A.A.; Shokr, M.S. Assessment and mapping land degradation in some areas of North Nile Delta, using new techniques. Menoufia J. Soil Sci. 2021, 6, 265–274. [Google Scholar] [CrossRef]
- Antar, S.A.; El-Sanat, G.M.A.; Khafagy, H.A. Improving Heavy Clay Salt Affected Soil and Its Production Using Some Amendments Application In North Delta. J. Soil Sci. Agric. Eng. 2014, 5, 1717–1730. [Google Scholar] [CrossRef]
- Kassem, H.S.; Bello, A.R.S.; Alotaibi, B.M.; Aldosri, F.O.; Straquadine, G.S. Climate Change Adaptation in the Delta Nile Region of Egypt: Implications for Agricultural Extension. Sustainability 2019, 11, 685. [Google Scholar] [CrossRef]
- Fawaz, M.M.; Soliman, S.A. The potential scenarios of the impacts of climate change on Egyptian resources and agricultural plant production. Open J. Appl. Sci. 2016, 6, 270–286. [Google Scholar] [CrossRef]
- Eid, H.M.; El-Marsafawy, S.M.; Ouda, S.A. Assessing the Economic Impacts of Climate Change on Agriculture in Egypt: A Ricardian Approach; Policy Research Working Paper 4293; World Bank: Washington, DC, USA, 2007. [Google Scholar]
- Kheir, M.S.; El Baroudy, A.; Aiad, M.A.; Zoghdan, M.G.; Abd El-Aziz, M.A.; Ali, M.G.; Fullen, M.A. Impacts of rising temperature, carbon dioxide concentration and sea level on wheat production in North Nile Delta. Sci. Total Environ. 2019, 651, 3161–3173. [Google Scholar] [CrossRef]
- El-Amier, Y.A.; Zahran, M.A.; Gebreil, A.S.; Abd El-Salam, E.H. Anthropogenic activities and their impact on the environmental status of Kitchener drain, Nile Delta, Egypt. J. Environ. Sci. 2017, 46, 251–262. [Google Scholar]
- Nehela, Y.; Mazrou, Y.S.A.; Alshaal, T.; Rady, A.M.S.; El-Sherif, A.M.A.; Omara, A.E.-D.; Abd El-Monem, A.M.; Hafez, E.M. The Integrated Amendment of Sodic-Saline Soils Using Biochar and Plant Growth-Promoting Rhizobacteria Enhances Maize (Zea mays L.) Resilience to Water Salinity. Plants 2021, 10, 1960. [Google Scholar] [CrossRef]
- Abou El Hassan, W.H. Impact Assessment Of Long Term Climate Change On Reference Evapotranspiration And Water Management In North Delta. J. Soil Sci. Agric. Eng. 2011, 2, 623–634. [Google Scholar] [CrossRef]
- Sun, B.; Li, Z.; Gao, Z.; Guo, Z.; Wang, B.; Hu, X.; Bai, L. Grassland Degradation and Restoration Monitoring and Driving Forces Analysis Based on Long Time-Series Remote Sensing Data in Xilin Gol League. Acta Ecol. Sin. 2017, 37, 219–228. [Google Scholar] [CrossRef]
- Scudiero, E.; Skaggs, T.H.; Corwin, D.L. Regional Scale Soil Salinity Evaluation Using Landsat 7, Western San Joaquin Valley, California, USA. Geoderma Reg. 2014, 2, 82–90. [Google Scholar] [CrossRef]
- CHU, L.; KANG, Y.; WAN, S. Effect of Different Water Application Intensity and Irrigation Amount Treatments of Microirrigation on Soil-Leaching Coastal Saline Soils of North China. J. Integr. Agric. 2016, 15, 2123–2131. [Google Scholar] [CrossRef]
- Machado, R.M.A.; Serralheiro, R.P. Soil Salinity: Effect on Vegetable Crop Growth. Management Practices to Prevent and Mitigate Soil Salinization. Horticulturae 2017, 3, 30. [Google Scholar] [CrossRef]
- Roy, S.; Chowdhury, N. Effects of leaching on the reclamation of saline soils as affected by different organic and inorganic amendments. J. Environ. Sci. Sustain. Dev. 2020, 3, 7. [Google Scholar] [CrossRef]
- Wang, N.; Xue, J.; Peng, J.; Biswas, A.; He, Y.; Shi, Z. Integrating Remote Sensing and Landscape Characteristics to Estimate Soil Salinity Using Machine Learning Methods: A Case Study from Southern Xinjiang, China. Remote Sens. 2020, 12, 4118. [Google Scholar] [CrossRef]
- El-Saka, M.S. Evaluation of Drainage Water Quality of El Hoks Drain at North Nile Delta, Kafr El-Sheihk Governorate, Egypt. J. Soil Sci. Agric. Eng. 2020, 11, 291–297. [Google Scholar] [CrossRef]
- Dong, R.; Na, X. Quantitative Retrieval of Soil Salinity Using Landsat 8 OLI Imagery. Appl. Sci. 2021, 11, 11145. [Google Scholar] [CrossRef]
- Wang, J.; Wang, W.; Hu, Y.; Tian, S.; Liu, D. Soil Moisture and Salinity Inversion Based on New Remote Sensing Index and Neural Network at a Salina-Alkaline Wetland. Water 2021, 13, 2762. [Google Scholar] [CrossRef]
- Barrett-Lennard, E.G.; Munir, R.; Mulvany, D.; Williamson, L.; Riethmuller, G.; Wesley, C.; Hall, D. Micro-Water Harvesting and Soil Amendment Increase Grain Yields of Barley on a Heavy-Textured Alkaline Sodic Soil in a Rainfed Mediterranean Environment. Agronomy 2021, 11, 713. [Google Scholar] [CrossRef]
- .Naimi, S.; Ayoubi, S.; Zeraatpisheh, M.; Dematte, J.A.M. Ground Observations and Environmental Covariates Integration for Mapping of Soil Salinity: A Machine Learning-Based Approach. Remote Sens. 2021, 13, 4825. [Google Scholar] [CrossRef]


| Variable | Unit | Min | Max | Mean |
|---|---|---|---|---|
| pH (1:2.5 suspension) | - | 7.83 | 8.81 | 8.32 |
| ECe (paste extract) | dS m−1 | 0.81 | 10.80 | 5.81 |
| SAR | - | 1.56 | 39.33 | 20.45 |
| ESP | - | 1.02 | 36.20 | 18.61 |
| SOM | g kg−1 | 10.5 | 21.9 | 16.2 |
| CaCO3 | g kg−1 | 0.33 | 14.27 | 7.30 |
| No | Index Name | Formula | Ref. |
|---|---|---|---|
| 1 | Salinity index (SI) | [92] | |
| 2 | Soil salinity index for arid and semi-arid conditions (SIA) | [93] | |
| 3 | Normalized difference salinity index (NDSI) | [94] | |
| 4 | Vegetation soil salinity index (VSSI) | [92] | |
| 5 | Normalized differential vegetation index (NDVI) | [94] | |
| 6 | Soil adjusted vegetation index (SAVI) | [95] | |
| 7 | Salinity index 2 | [92] | |
| 8 | Salinity index 3 | [96] | |
| 9 | Salinity index 4 | [96] | |
| 10 | Salinity index 5 | [97] | |
| 11 | Salinity index 6 | [97] | |
| 12 | Salinity index 7 | [97] | |
| 13 | Salinity index 8 | [98] |
| Land Use Categories | Area (%) | Area (ha) |
|---|---|---|
| Cultivated land (C.A.) | 72% | 269,628 |
| Water bodies and lake Burrulus | 12% | 43,512 |
| Fish ponds | 10% | 37,739 |
| Urban | 6% | 22,310 |
| Total studied area | 100% | 373,189 |
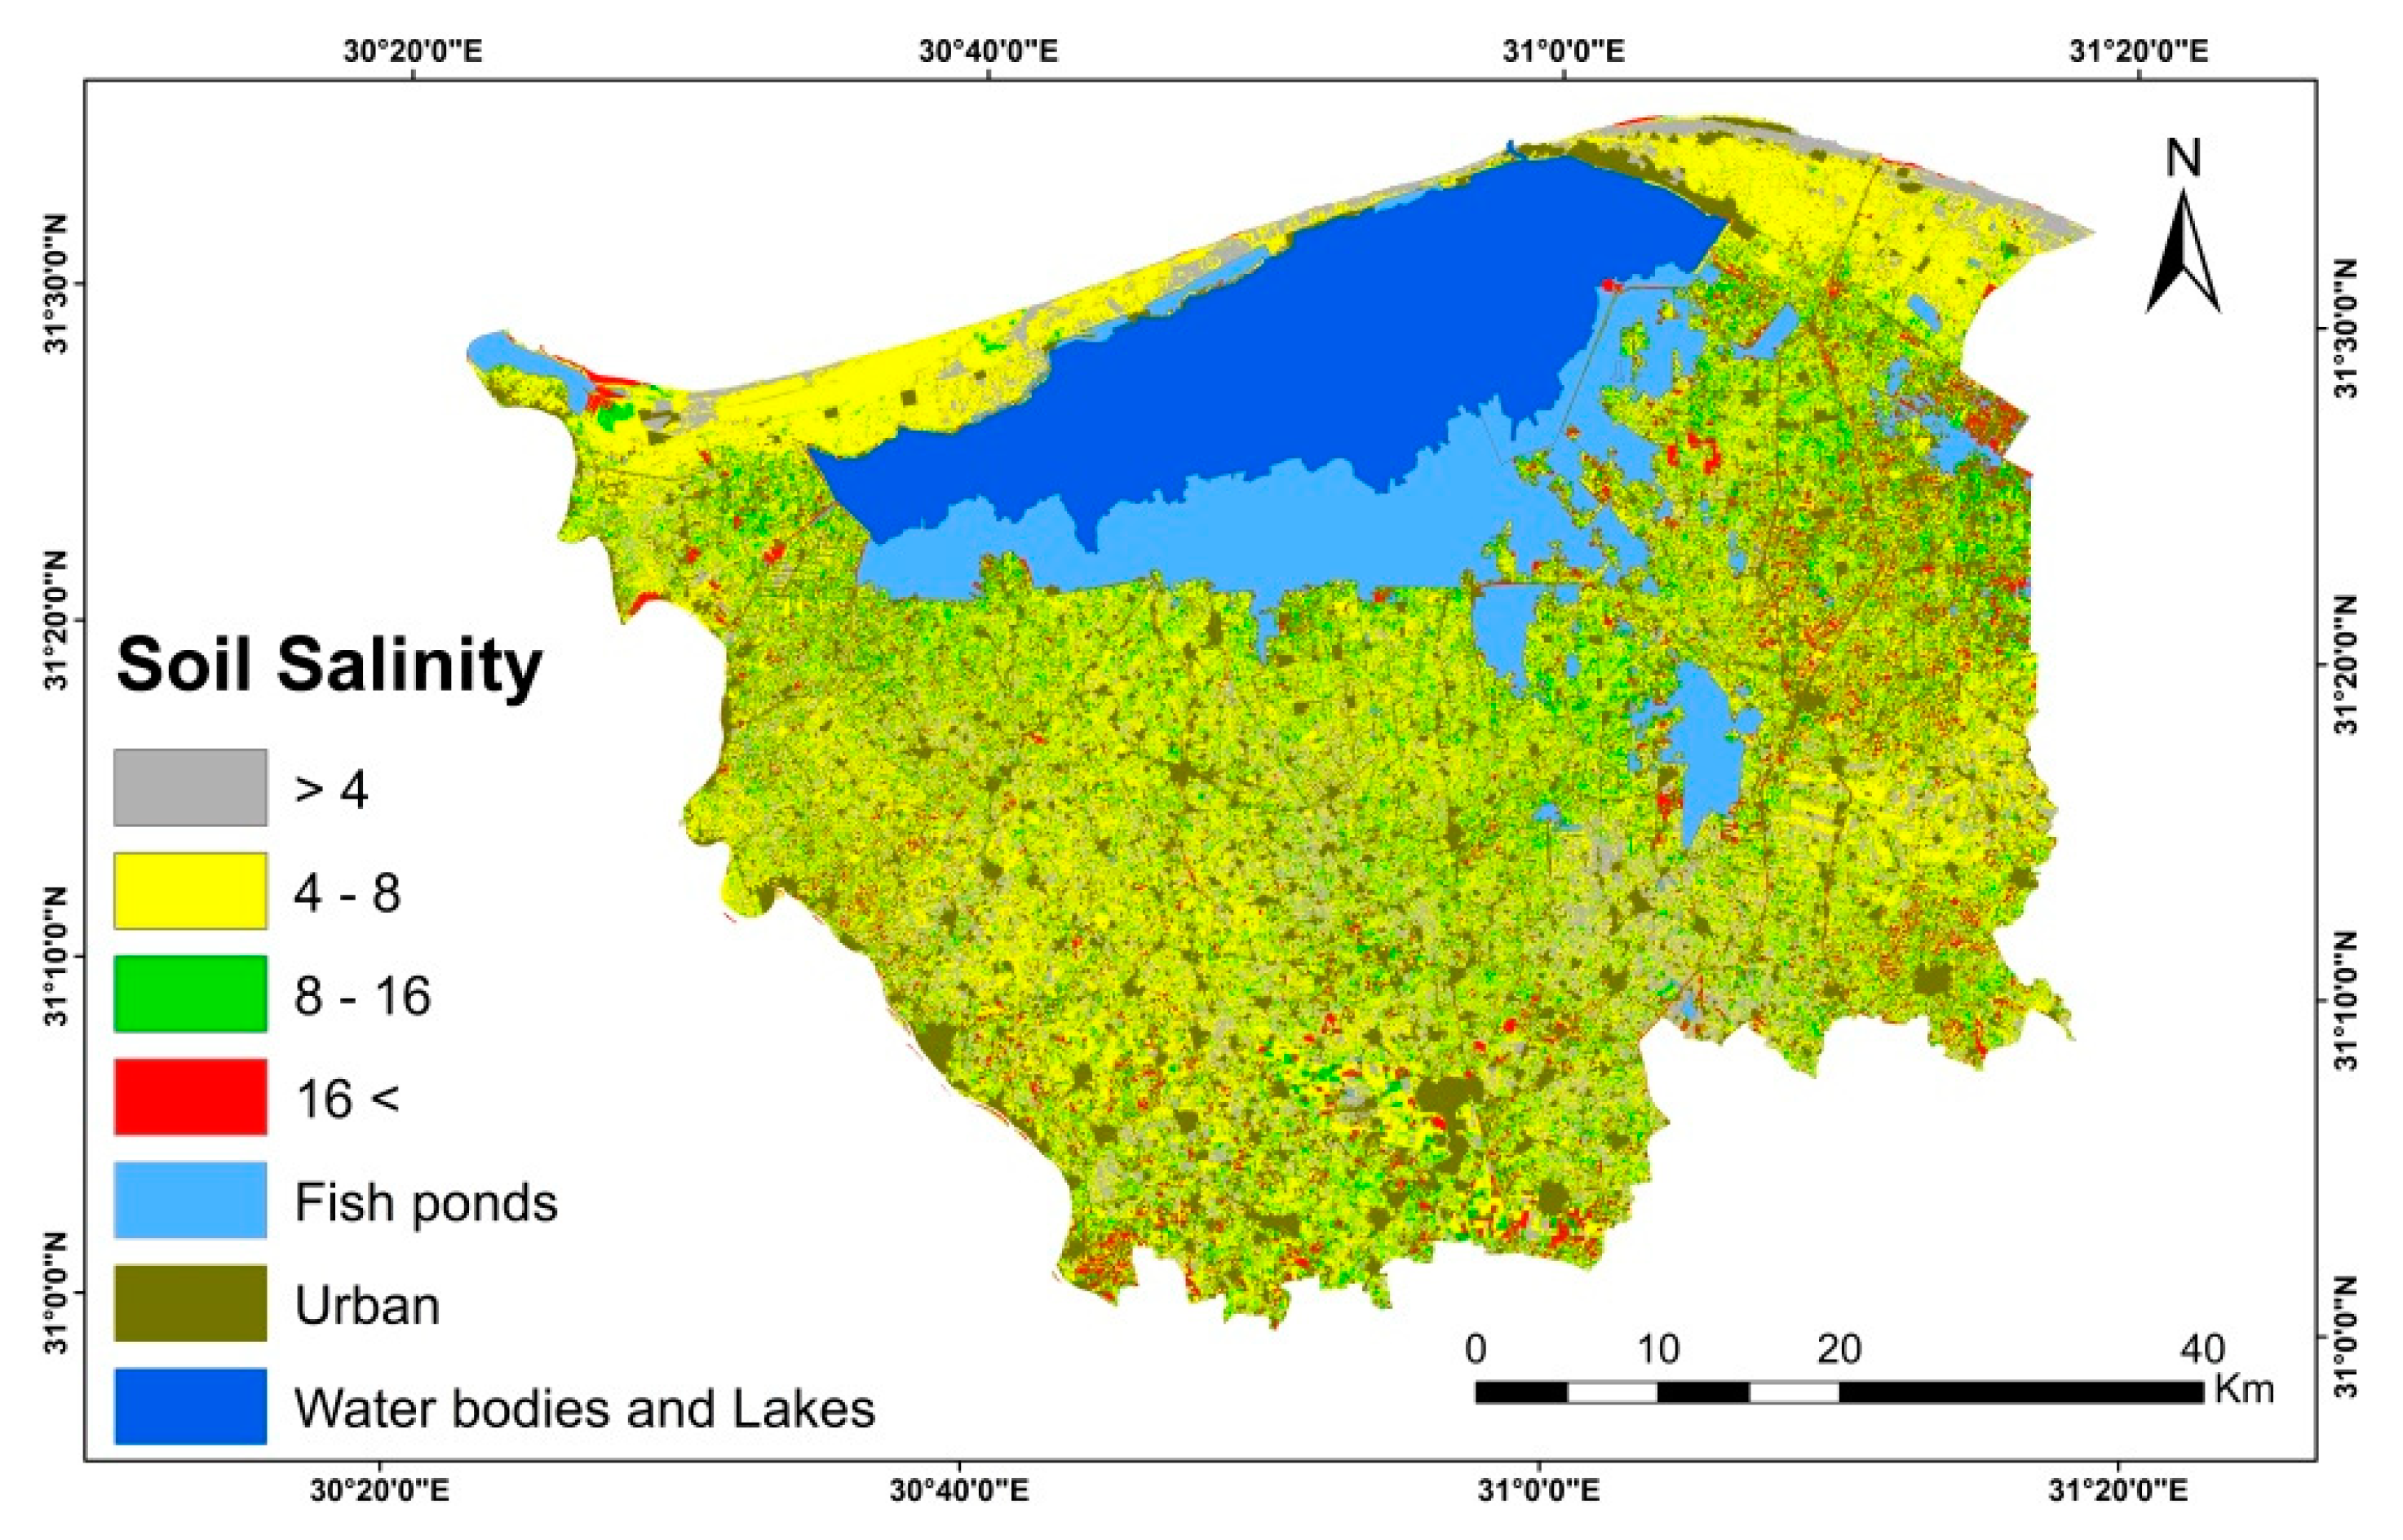
| Salinity Class (dS m−1) | Area ha | Area (%) |
|---|---|---|
| 4< | 118,580 | 44 |
| 4–8 | 73,177 | 27 |
| 8–16 | 77,726 | 28 |
| 16> | 145 | 1 |
| The cultivated study area | 269,628 | 100% |
Publisher’s Note: MDPI stays neutral with regard to jurisdictional claims in published maps and institutional affiliations. |
© 2022 by the authors. Licensee MDPI, Basel, Switzerland. This article is an open access article distributed under the terms and conditions of the Creative Commons Attribution (CC BY) license (https://creativecommons.org/licenses/by/4.0/).
Share and Cite
Aboelsoud, H.M.; AbdelRahman, M.A.E.; Kheir, A.M.S.; Eid, M.S.M.; Ammar, K.A.; Khalifa, T.H.; Scopa, A. Quantitative Estimation of Saline-Soil Amelioration Using Remote-Sensing Indices in Arid Land for Better Management. Land 2022, 11, 1041. https://doi.org/10.3390/land11071041
Aboelsoud HM, AbdelRahman MAE, Kheir AMS, Eid MSM, Ammar KA, Khalifa TH, Scopa A. Quantitative Estimation of Saline-Soil Amelioration Using Remote-Sensing Indices in Arid Land for Better Management. Land. 2022; 11(7):1041. https://doi.org/10.3390/land11071041
Chicago/Turabian StyleAboelsoud, Hesham M., Mohamed A. E. AbdelRahman, Ahmed M. S. Kheir, Mona S. M. Eid, Khalil A. Ammar, Tamer H. Khalifa, and Antonio Scopa. 2022. "Quantitative Estimation of Saline-Soil Amelioration Using Remote-Sensing Indices in Arid Land for Better Management" Land 11, no. 7: 1041. https://doi.org/10.3390/land11071041
APA StyleAboelsoud, H. M., AbdelRahman, M. A. E., Kheir, A. M. S., Eid, M. S. M., Ammar, K. A., Khalifa, T. H., & Scopa, A. (2022). Quantitative Estimation of Saline-Soil Amelioration Using Remote-Sensing Indices in Arid Land for Better Management. Land, 11(7), 1041. https://doi.org/10.3390/land11071041