Article

Vegetation Disturbance and Recovery Dynamics of Different Surface Mining Sites via the LandTrendr Algorithm: Case Study in Inner Mongolia, China

1
School of Land Science and Technology, China University of Geosciences, Beijing 100083, China
2
Key Laboratory of Land Consolidation, Ministry of Natural Resources of the PRC, Guanying Yuan West 37, Beijing 100035, China
3
State Key Laboratory of Water Environment Simulation, School of Environment, Beijing Normal University, Beijing 100875, China
*
Author to whom correspondence should be addressed.
Land 2022, 11(6), 856; https://doi.org/10.3390/land11060856
Submission received: 7 May 2022 / Revised: 1 June 2022 / Accepted: 3 June 2022 / Published: 6 June 2022

Abstract

:
Mining sites are areas where mining and restoration coexist and are constantly changing. The vegetation condition can reflect the process of surface mining and restoration, while quantifying the impacts of different mining patterns and surrounding environments on vegetation is the key to balancing mining activities and ecological restoration. In this study, long-term monitoring from 1986 to 2020 was implemented by the LandTrendr algorithm to reveal the ecological impacts of two concentrated and contiguous surface mining sites with different mining patterns (scattered and aggregated mining) and surrounding environments in Inner Mongolia, China. The results show that it is reasonable to use the LandTrendr algorithm for long-term monitoring of surface mining sites, and that the ecological impacts of different surface mining sites in ecologically fragile areas have the same regularity. As the duration increases, the magnitude of disturbance decreases, and the magnitude of recovery first decreases and then reaches a natural fluctuation state after 20 years of recovery. Different mining patterns and surrounding environments bring different ecological impacts. Scattered mining areas are more likely to produce natural recovery while the restored ecosystem is more stable. The performance of mining development disturbance is more obvious in places with better ecological environment, while the effect of ecological restoration is also more significant. This study can provide guidance for the rational planning of mining and restoration activities in ecologically fragile areas.

1. Introduction

Rapid socio-economic development makes human life inseparable from mineral resources. Still, mine development has brought a lot of environmental problems [1], with vegetation destruction, soil pollution, air pollution and other ecological degradation becoming more and more serious [2], and the contradiction between resource demand and environmental protection becoming more and more prominent [3]. Surface mining has caused the destruction of surface vegetation, alteration of original landforms, and even secondary landslides and other disasters, which seriously threaten the ecological safety of mining sites [4]. The impact of mining development on the ecological environment is reflected in the changes of the ecosystem. On the temporal scale of decades affected by mining activities and the spatial scale of the impact area of about 10 km2, vegetation is most suitable to characterize the ecosystem changes brought about by mining and restoration [5]. Timely monitoring of spatial and temporal changes in vegetation in surface mining sites can reflect the dynamic response of the ecosystem and further explore the ecological impacts of mining and restoration, which is a complex task [6].
Vegetation, as an indicator of ecosystem change, is central to disturbance and recovery monitoring, which can be monitored by field survey [7,8] and remoter sensing platforms, such as MODIS and Landsat [9,10,11]. Spatial and temporal changes in vegetation include changes in the vegetation growth environment, which in turn affect changes in the vegetation communities and the broader vegetation cover. Vegetation spectral indices can be used to characterize vegetation [12], and time-series remote sensing images can be used to analyze the dynamic changes of vegetation spectral indices—the Normalized Difference Vegetation Index (NDVI) and the Normalized Burn Ratio (NBR) are often used for disturbance and recovery monitoring in surface mining sites [13,14]. Algorithm-based time-series remote sensing change monitoring has developed rapidly in recent years, with breakpoint detection algorithms such as the LandTrendr [15], the BFAST [16,17] using iterative change, and the CCDC [18] based on multiclass times series curve detection.
The LandTrendr algorithm is a suitable method for monitoring vegetation dynamics, which includes both disturbance and recovery [15]. It was initially applied to monitor changes in forests [19,20], and then gradually developed to areas such as watersheds [21] and mining sites [22]. The algorithm captures mining and restoration events at the mining sites by the point in time when the change in the spectral–temporal trajectory occurs [23]. Thus, it enables post-disturbance recovery and repeated disturbance monitoring in mining sites with significant interannual variability. The key information on the time and magnitude of disturbance and recovery contained in the raster data in the algorithm output provides a database for quantitative analysis and is a necessary concern to ensure mining sustainability [24,25,26]. Surface mining site vegetation degradation and restoration monitoring needs time-series remote sensing data. With the construction and development of the Google Earth Engine (GEE) cloud platform, the LandTrendr algorithm can be implemented on this platform [27], thus there is no need to store large amounts of data in the pre-running period. Meanwhile its powerful data processing and analysis capabilities simplify the process for users [28].
Mining activities impact the regional ecosystem through cumulative effects especially in mineral resource-rich areas, which increases with the continuous interaction and aggregation of mining development activities [6]. It has been shown that multiple mines and mine overlays cause more severe vegetation degradation than single mines [29]. Mining sites represent different patterns of mine overlays, and different mines may cause different responses of vegetation to the development of mining, but which lacks quantitative analysis. The ecological impacts under different mining patterns and surrounding environments in ecologically fragile areas that need quantitative and dynamic analysis guide the rational layout of regional mining and restoration. In addition to mining pattern, the diversity and stability of the areas surrounding mining development are impaired, the impact may be different under the various surrounding environments [30]. Qian et al. [31] found that the impact of mining activities on the surrounding environments is not only related to the patterns and extent of mining, but also to the background conditions of the surrounding environments.
The purpose of this study was to reveal the impacts of different mining patterns and surrounding environments on vegetation through quantitative analysis. The vegetation disturbance and recovery characteristics were actively focused on providing a basis for quantitative comparisons of different mining sites in ecologically fragile areas. The LandTrendr algorithm was used to simultaneously monitor the characteristics of vegetation disturbance and recovery in surface mining sites. Two concentrated and contiguous surface mining sites with different mining patterns and surrounding environments in Wuhai City and surrounding areas in Inner Mongolia, China, are presented as examples of monitoring from 1987 to 2020.

2. Materials and Methods
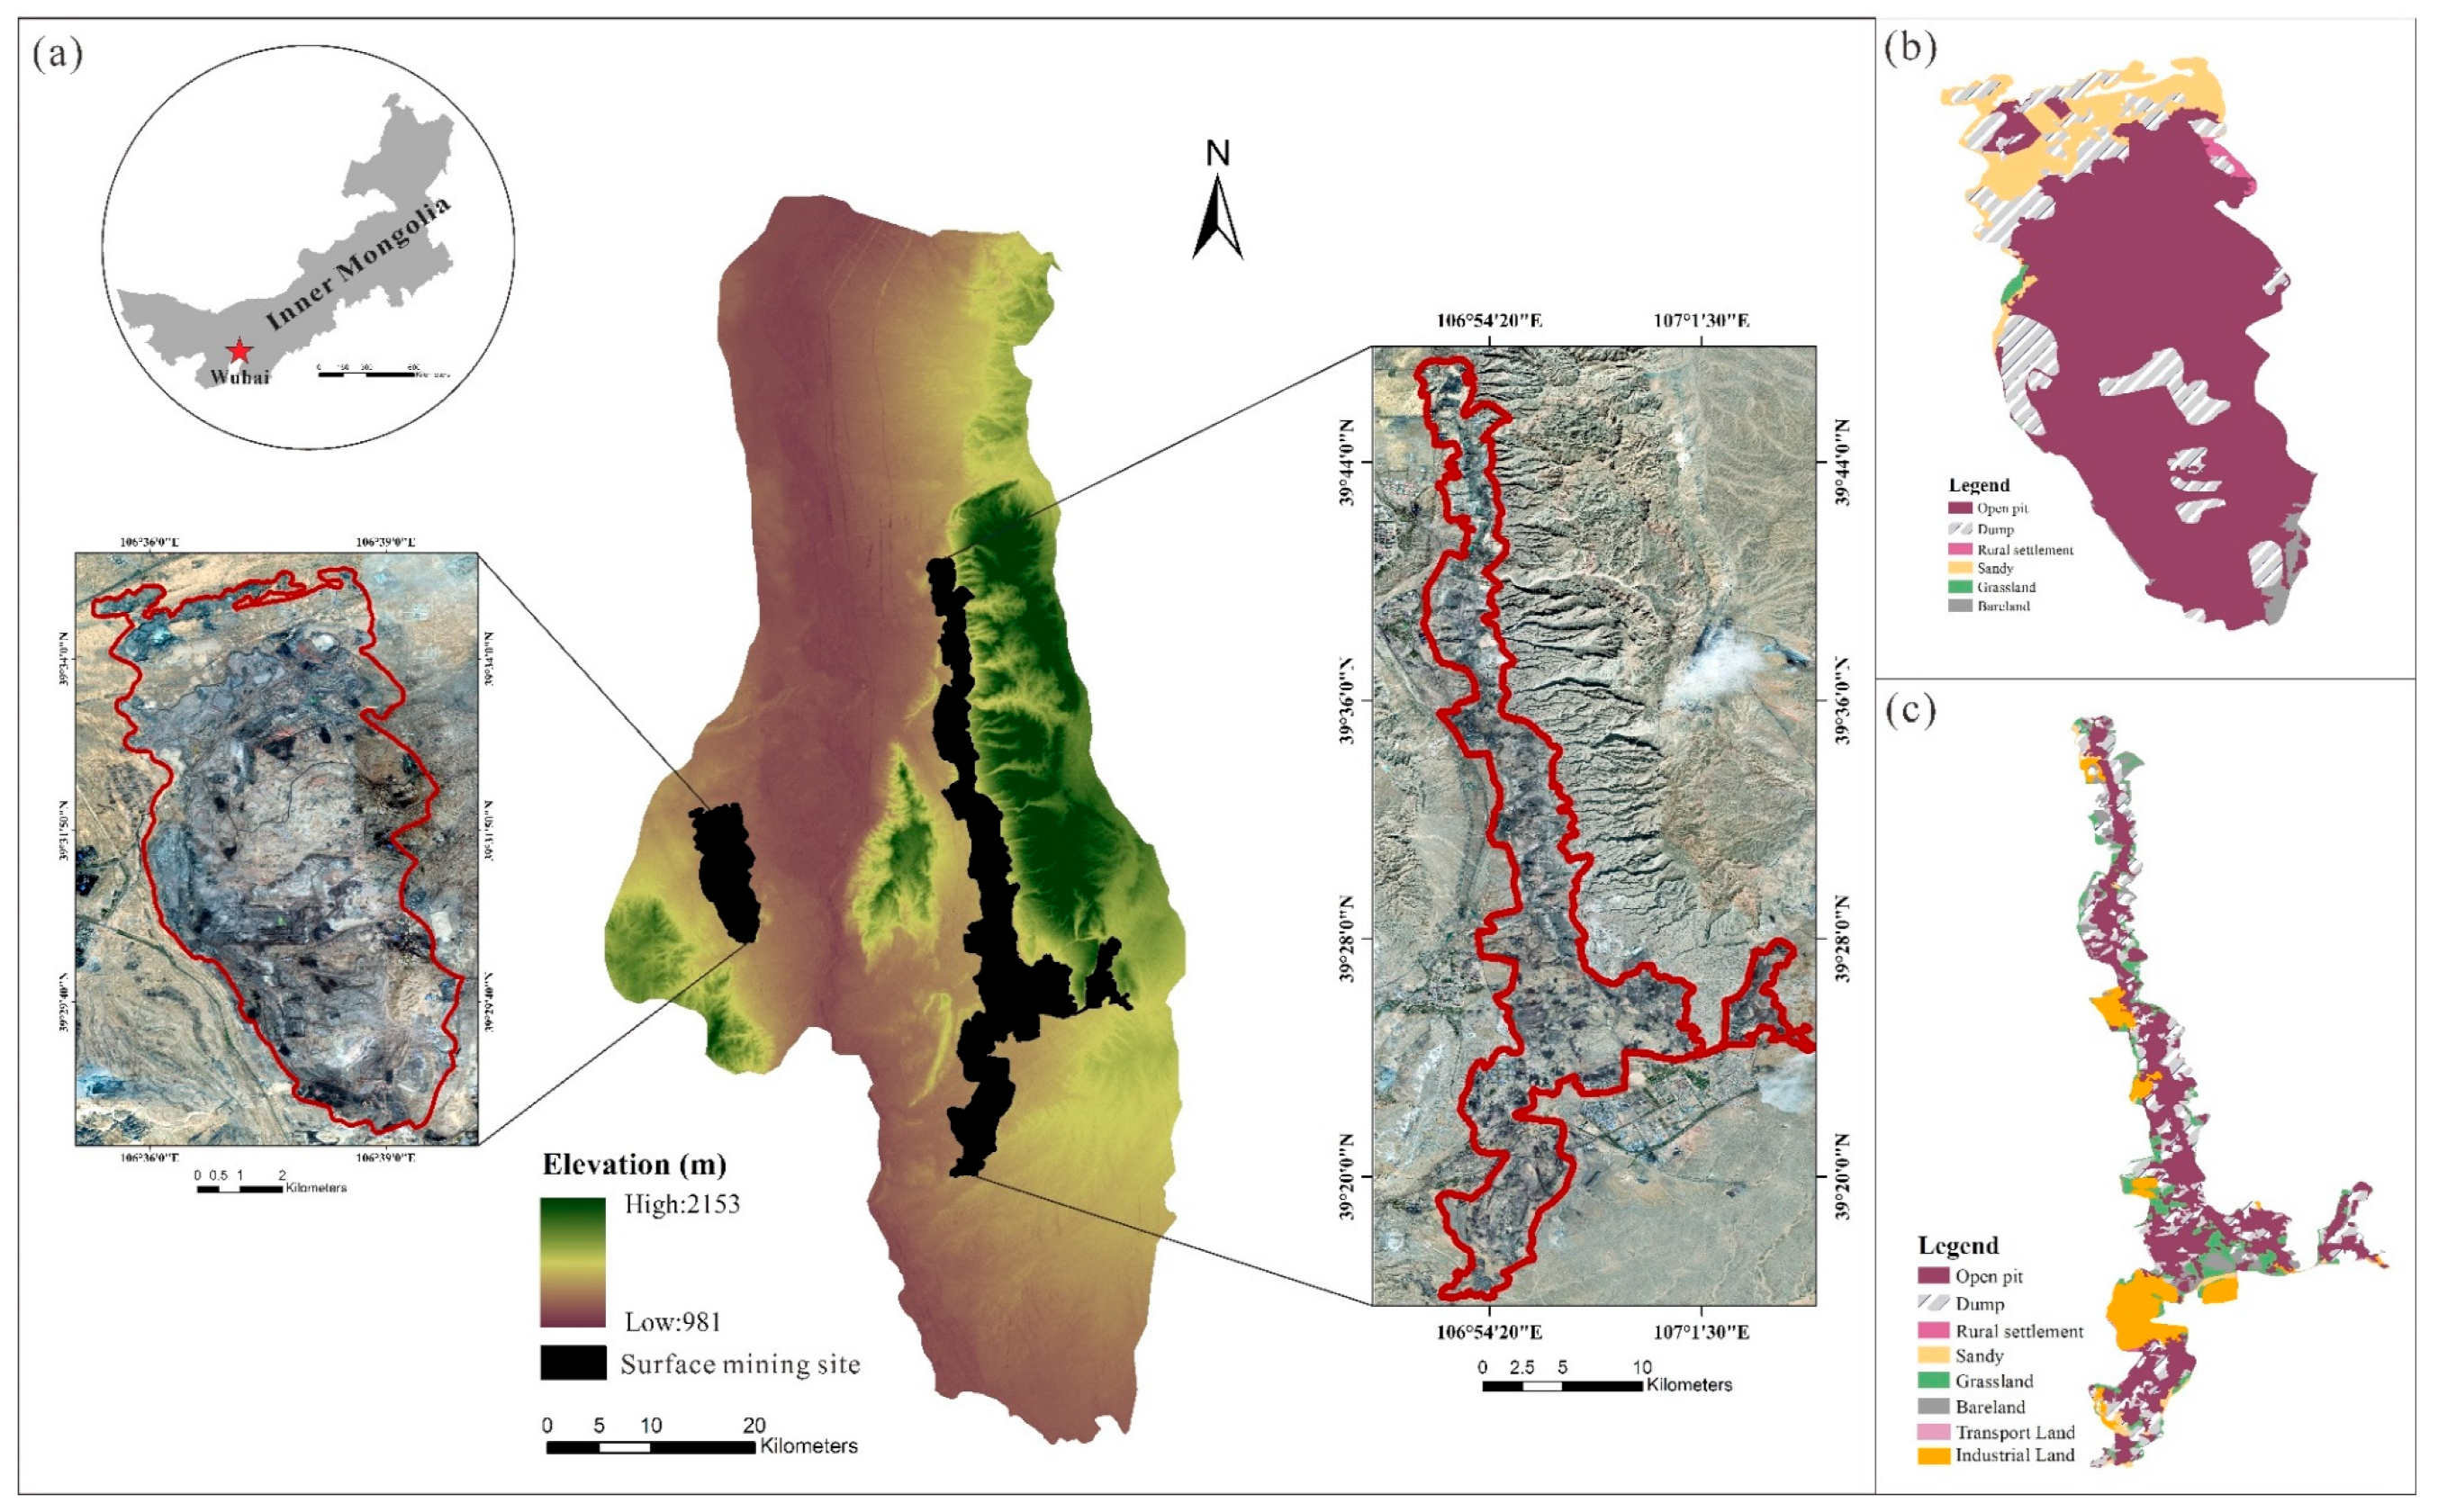
2.1. Study Area

The study area consists of the two largest concentrated and contiguous surface mining sites in Wuhai City and surrounding areas (Figure 1). Wuhai City is located in central Inner Mongolia, China (39.15°−39.52° N, 106.36°−107.05° E), with three districts under the jurisdiction of Wuda, Haibowan, and Hainan. It is adjacent to the Ordos Plateau in the east, across the river from Shizuishan City in Ningxia in the south, the Alxa League in the west, and the fertile Loop Plain in the north, forming the geomorphic feature of “three mountains, two valleys and one river”. The region is located deep in the continent with dry winters and hot summers. The annual average temperature is 10 °C, the annual average sunshine duration is 3139 h, the annual average rainfall is 160 mm, the annual average evaporation is 3289 mm, and the annual average wind speed is 3 m/s. The soil type is mainly brown calcium soil and gray desert soil with low organic matter content.
Wuhai City is a typical resource-based city “built and flourished by coal”. There are 46 coal mines in the city with a total design capacity of 43.85 million tons/year, having many types of minerals of superior quality, and known as the “sea of black gold (coal)”. Wuhai City has a long history of coal mining. The private small coal kiln manual mining gradually developed into unified management and operation of modern mining companies, the Shenhua Group Wuda and Haibowan Mining Company Limited, two mining companies. Surface mining has formed a large area of pits and dumps [32]. The two concentrated and continuous surface mining sites are the western mine in Wuda and the eastern mine located at the junction of Haibowan, Hainan, and Ordos—mining at both was started in 1987 and has been continued until now. The distribution of pits in the eastern mine is relatively scattered and disorderly, forming large concentrated and contiguous surface mining sites. The scope of the eastern mine is 230 km2, which is much larger than the 53 km2 of the western mine. The eastern mine is close to the Tetraena mongolica reserve and has a better ecological environment than the western mine. The influences of coal resource mining, land desertification, land destruction, and vegetation degradation are becoming more and more serious [33,34], so that ecological engineering construction is imperative. The main targets of land reclamation in surface mining sites are open pits and dumps, while a combination of artificial restoration and natural protection is used for revegetation.

2.2. Data Acquisition and Preprocessing

In this study, all archived Landsat TM/ETM+/OLI image data on the GEE cloud platform from June 10 to September 20 of each year from 1987 to 2020 were selected. The datasets from which the images were collected include Landsat 5, 7, and 8. Landsat image data collected on the GEE cloud platform were atmospherically corrected using the LEDAPS (Landsat Ecosystem Disturbance Adaptive Processing System) [35]. The cloud identification algorithm provided by the GEE platform itself, which is derived from the CFMask (The C Function of Mask) image comes with a QA (Quality Assessment) band to identify clouds, shadows, etc. for cloud removal and de-shadowing [36]. The digital elevation model (30 × 30 m) was from ASTER GDEM 2 (http://www.gscloud.cn/, accessed on 1 October 2021). The 2020 land use data were obtained from Resource and Environment Science and Data Center (http://www.resdc.cn/, accessed on 18 October 2021), presenting the spatial distribution of surface mining sites.

2.3. Description of Different Patterns for the Two Mining Sites

In different mineral resource-rich areas, many separate mine sites are combined in different spatial forms, forming different mining patterns. We used landscape metrics to describe the different patterns of the two mining sites in Wuhai, that could quantitatively reflect the structural composition and spatial configuration of the landscape pattern [37,38].
In this study, Fragstats 4.2 was used to calculate the indexes for the class level of industrial and mining land as follows: Number of patches (NP); Patch density (PD); Largest patch index (LPI); Landscape shape index (LSI), and Mean patch size (AREA_MN) to quantitatively characterize the differences in mining patterns between the western and eastern mines.

2.4. Ecological Impacts Monitoring of Surface Mining Sites

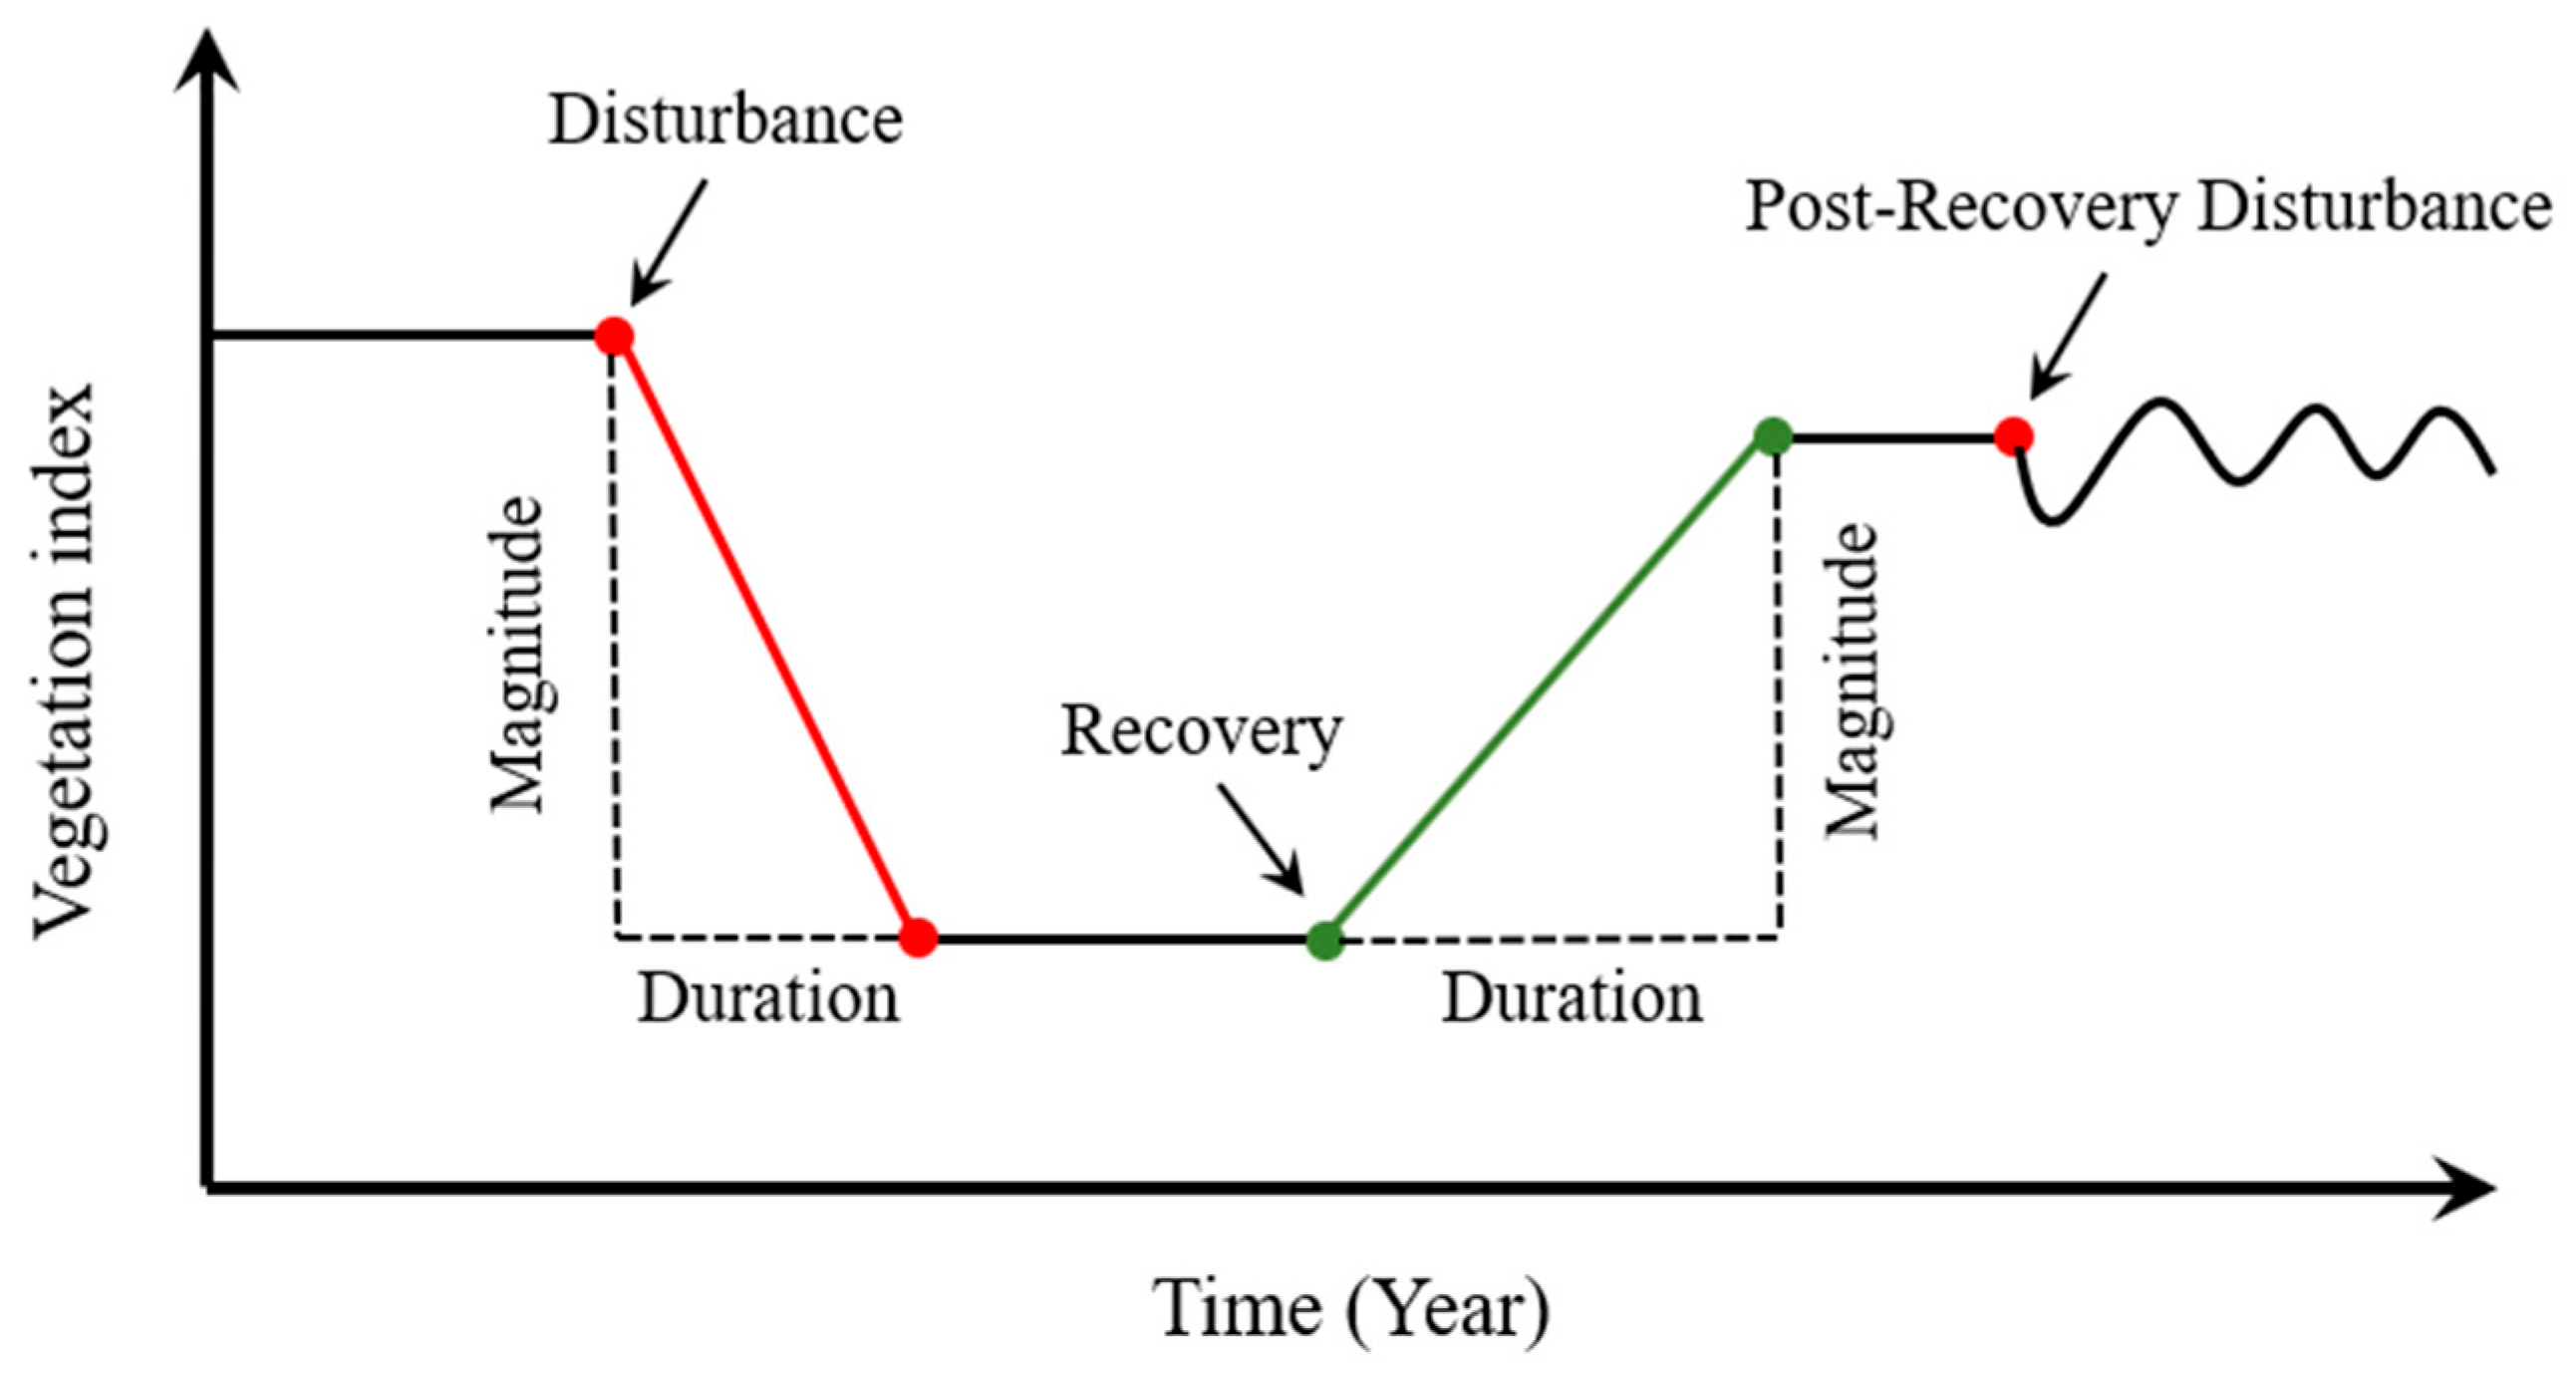
2.4.1. Vegetation Disturbance and Recovery Conceptual Model in Surface Mining Site

Surface mining and restoration activities manifest as abrupt changes in vegetation cover [39]. The vegetation is severely damaged during surface mining due to activities such as rock and soil stripping and land occupation, and mine pits and dumps replace the original vegetation landscape. Soil reconstruction and re-vegetation are carried out on these damaged lands to achieve land and ecological recovery in surface mining sites [40]. The temporal change trajectory of the vegetation index in Figure 2. can reflect the dynamic process of ecological impacts of vegetation disturbance and recovery. The duration and magnitude indicate the time experienced by the event and the degree of change in the vegetation index, which depends on the background ecological conditions [24], spatial distribution pattern [41], and mining development process.

2.4.2. Vegetation Disturbance and Recovery Detection by the LandTrendr Algorithm

The LandTrendr algorithm is based on Landsat images and monitors trends in vegetation disturbance and recovery at the pixel level. Time-series segmentation is the core of the algorithm, which divides the complex curve into straight-line segments. The final change trajectory consists of connected multiple straight-line components. The information of time and spectral values contained in the endpoints of the straight-line segments provides support to portray the disturbance and recovery situation. Based on Kennedy et al. [15], the central processing flows of the LandTrendr algorithm includes the following: removing the spikes caused by noise in the time series, identifying the vertices and fitting the time trajectory, simplifying the trajectory model by iterations, selecting the best modeling, and finally removing the changes considered as noise based on vegetation cover.
The LandTrendr algorithm can monitor vegetation loss and gain. The vegetation loss in this paper represents mining, which is called vegetation disturbance in the LandTrendr algorithm. The vegetation gain represents restoration (both reclamation works and natural processes), which is called vegetation recovery in the LandTrendr algorithm. The algorithm ensures monitoring quality by setting control parameters, and default parameters and are used in this paper to simplify processing. A raster map (30 × 30 m), including the year, duration, and magnitude of disturbance and recovery is generated by determining the amount of vegetation loss and gain. Year, duration, and magnitude indicate the year of occurrence, duration of experience, and intensity of change in vegetation indicators for disturbance and recovery events, respectively. Studies have shown that NDVI is the best indicator for monitoring vegetation changes in a mining site [42]. Based on the NDVI characteristics of the study area, a vegetation loss greater than 0.02 is set as disturbance and a vegetation increase greater than 0.06 as recovery.

2.5. Accuracy Assessment and Validation

In this study, based on the disturbance and recovery areas identified by the LandTrendr algorithm, 30 sample points of accuracy assessment were selected by ArcGIS 10.2 in both disturbance and recovery areas of the two mining sites, while the total number of sample points was 120.
Based on the high-resolution images of each year on Google Earth Pro, the year of disturbance or recovery of each sample point was determined by visual interpretation. A confusion matrix was constructed to compare the sample interpretation results with the algorithm identification results, and the user accuracy, producer accuracy, overall accuracy, and Kappa coefficient of mining disturbance and recovery were calculated [43,44]. Due to the lack of high-resolution images before 2010 on Google Earth Pro, high-resolution images from 2010 to 2020 were selected for accuracy verification in this study.

3. Results

3.1. Patterns of the Two Mining Sites

The landscape metrics of industrial and mining land in the two mining sites were calculated separately (Table 1). The number and density of patches are larger in the eastern mine, while the largest patch index and mean patch size are smaller, which indicates that the landscape fragmentation in the eastern mine is significant. The larger landscape shape index of the eastern mine indicates that its internal patch shape tends to be complex and irregular. In summary, the mining patterns in the two mines are different, with surface mining in the eastern mine tending to be scattered and disorderly, while the western mine displays an aggregation pattern.

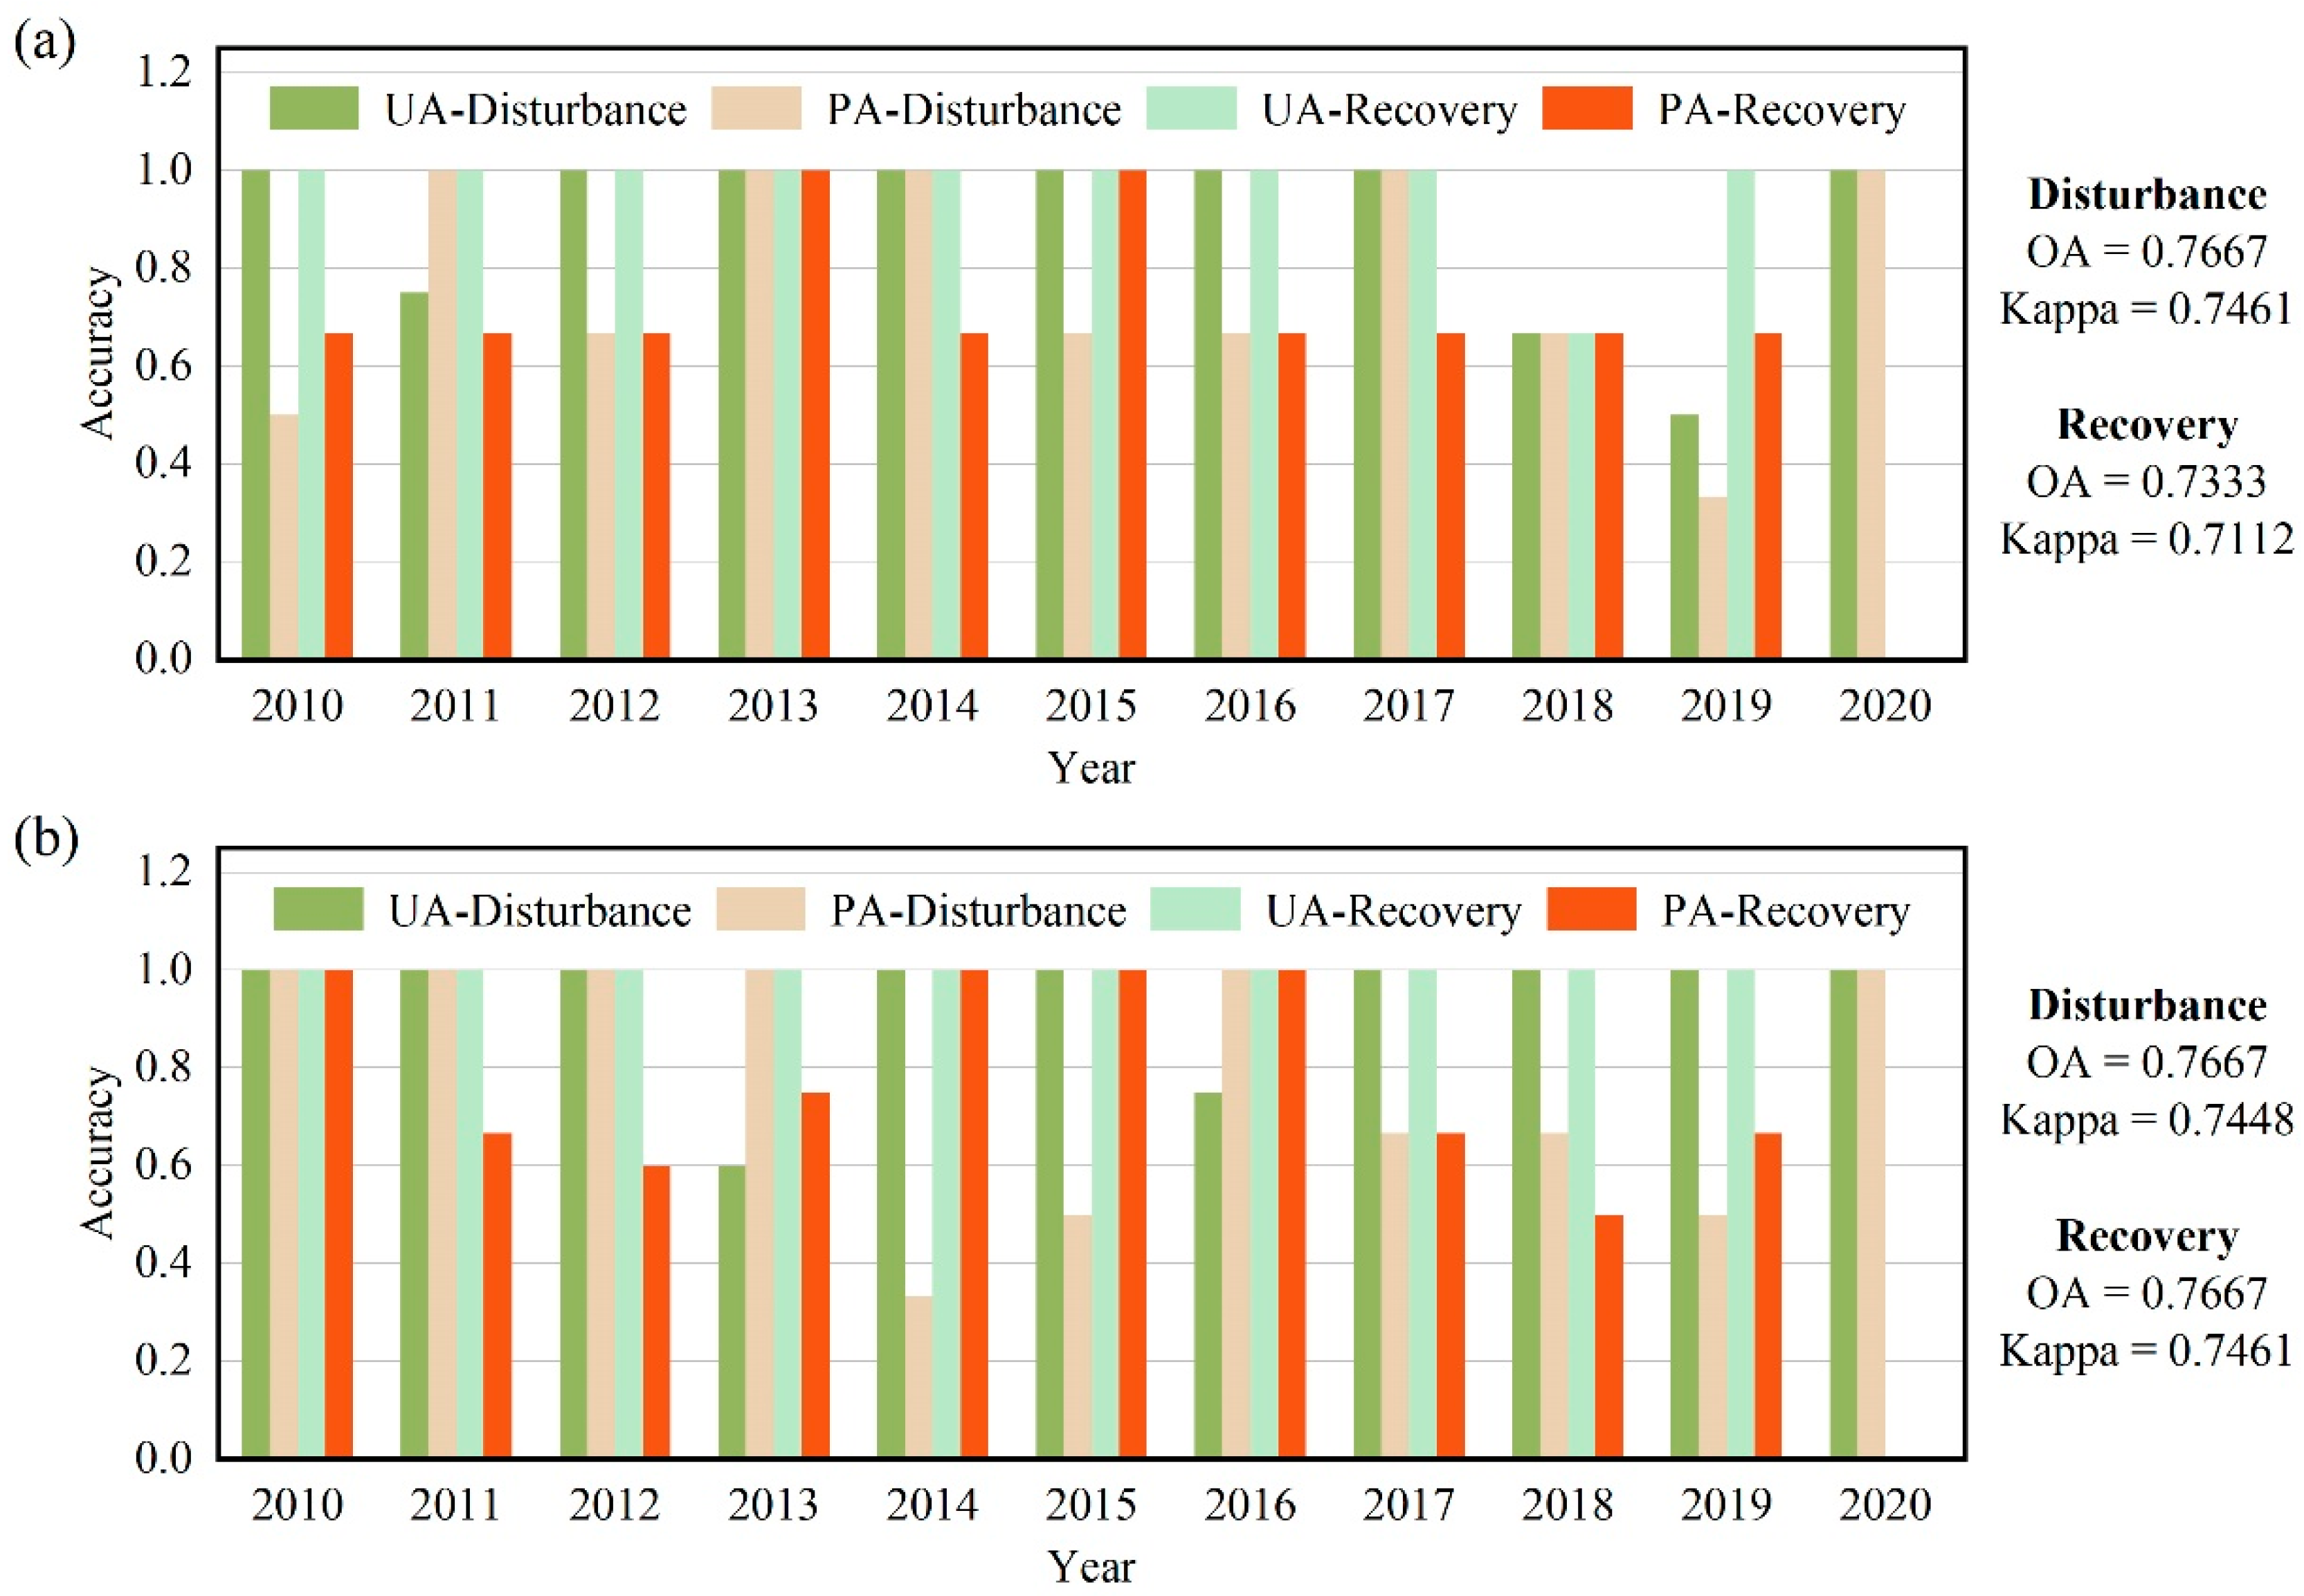
3.2. Accuracy Assessment of Disturbance and Recovery Identification

The LandTrendr algorithm is based on the premise that vegetation changes with disturbance and recovery. Figure 3. shows three different patterns of vegetation change in the surface mining site, representing the undisturbed area, the post-disturbance recovery area, and the post-disturbance unrecovered area. The NDVI in the undisturbed area shows a stable trend of about 0.087. The NDVI in the restored area after disturbance shows a decreasing trend followed by an increasing trend, then gradually stabilizes after natural disturbance, and finally the NDVI reaches 0.183. The NDVI in the unrestored area after mining disturbance shows a decreasing trend, then rises and stabilizes due to natural factors, and is about 0.076.
The overall accuracies of disturbance and recovery occurrence year identification in the western mine are 0.77 and 0.73, respectively, and the Kappa coefficients are 0.75 and 0.71, respectively (Figure 4). The overall accuracies of both disturbance and recovery identification are better, and the overall accuracies of disturbance identification are slightly higher than the overall accuracies of recovery identification. The producer accuracy and user accuracy mainly lie between 60% and 100% in all years, but in some years, such as 2019, the producer accuracy of disturbance is as low as 33.33%.
The overall accuracy of disturbance and recovery occurrence year identification in the eastern mine is 0.77, with Kappa coefficients of 0.74 and 0.75, respectively (Figure 4). The overall accuracy of both disturbance and recovery identification is good. Producer accuracy and user accuracy mainly lie between 50% and 100% for all years, but in some years, such as 2014, the producer accuracy of disturbance can be as low as 33.33%.
The overall accuracy and Kappa coefficients of disturbance identification in the eastern and western mines are similar. However, the overall accuracy and Kappa coefficients of recovery identification in the western mine are slightly lower than those in the eastern mine.

3.3. Spatiotemporal Characteristics of Vegetation Disturbance and Recovery

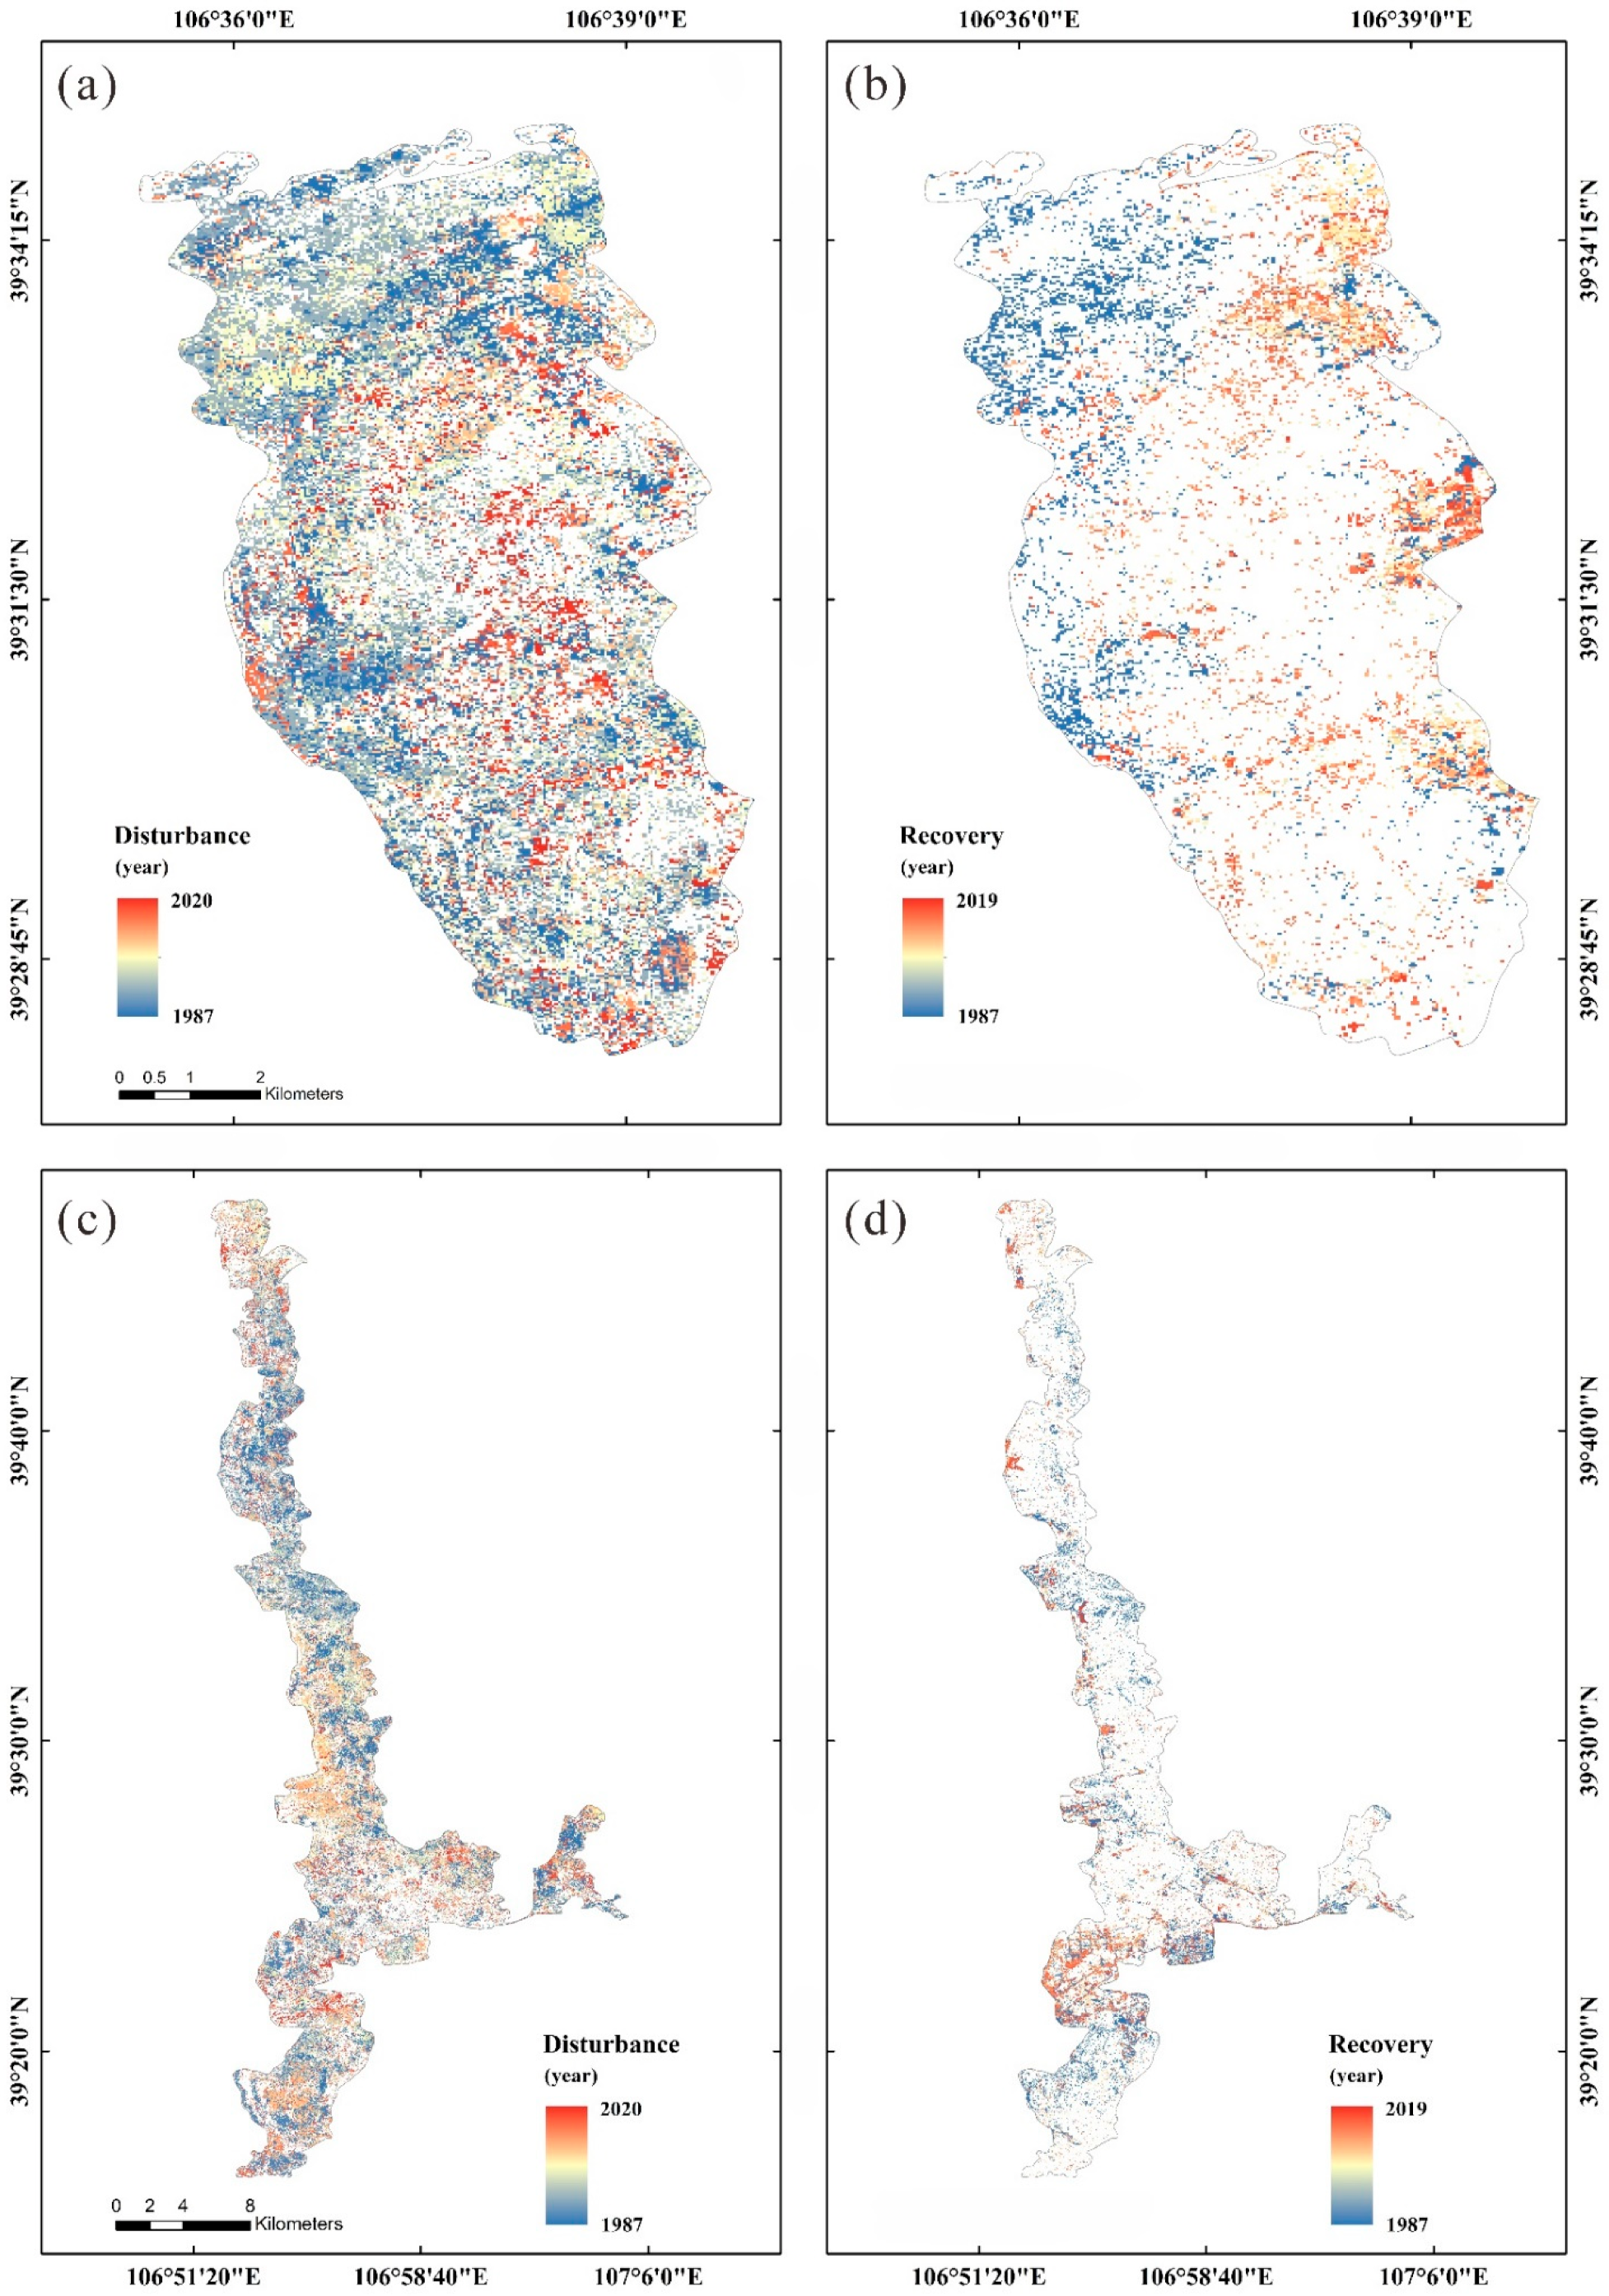
3.3.1. The Occurrence Year of Vegetation Disturbance and Recovery

The disturbance occurred from 1987 to 2020, and the recovery occurred from 1987 to 2019. Based on the spatial distribution characteristics of disturbance and recovery occurrence (Figure 5), the occurrence of mining activities in both mining sites is spatially irregular, which is related to the long history of mining in Wuhai and the mining form of concentrated and continuous multiple coal mines in a disorderly manner. The recovery activities are spatially continuous, showing a pattern of starting from one side and gradually advancing, with the western mine showing a west-to-east recovery pattern and the eastern mine showing an east-to-west recovery pattern.
The statistical results (Table A1 and Table A2) show that the year with the highest number of disturbance and recovery in both mining sites is 1987, due to a classification error, so 1988 was selected as the starting year for this study. The western mine expanded mining activities from 1993 which peaked in 1995 and 2003, respectively, due to the formation of the coal bureau in 1995, and the historical high coal price introduced in 2003. In the eastern mine, from the beginning of the statistical year, except for 1988 and 1990, the mining stage was more concentrated, and due to the high coal price in 2008, the peak of mining was reached in 2008. The recovery in the western mine was mainly concentrated in 2002–2017, so the cumulative recovery ratio shows a trend of decreasing then increasing and gradually stabilizing, and the final cumulative recovery ratio reached 25.76%. The recovery years in the eastern mine were mainly concentrated in 1989 and 2002–2018, and the cumulative recovery ratio shows a trend of decreasing then increasing, and the final cumulative recovery ratio reached 27.58%. The mining and restoration time in the two mining sites was approximately the same, with the final cumulative recovery ratio slightly higher for the eastern mine.

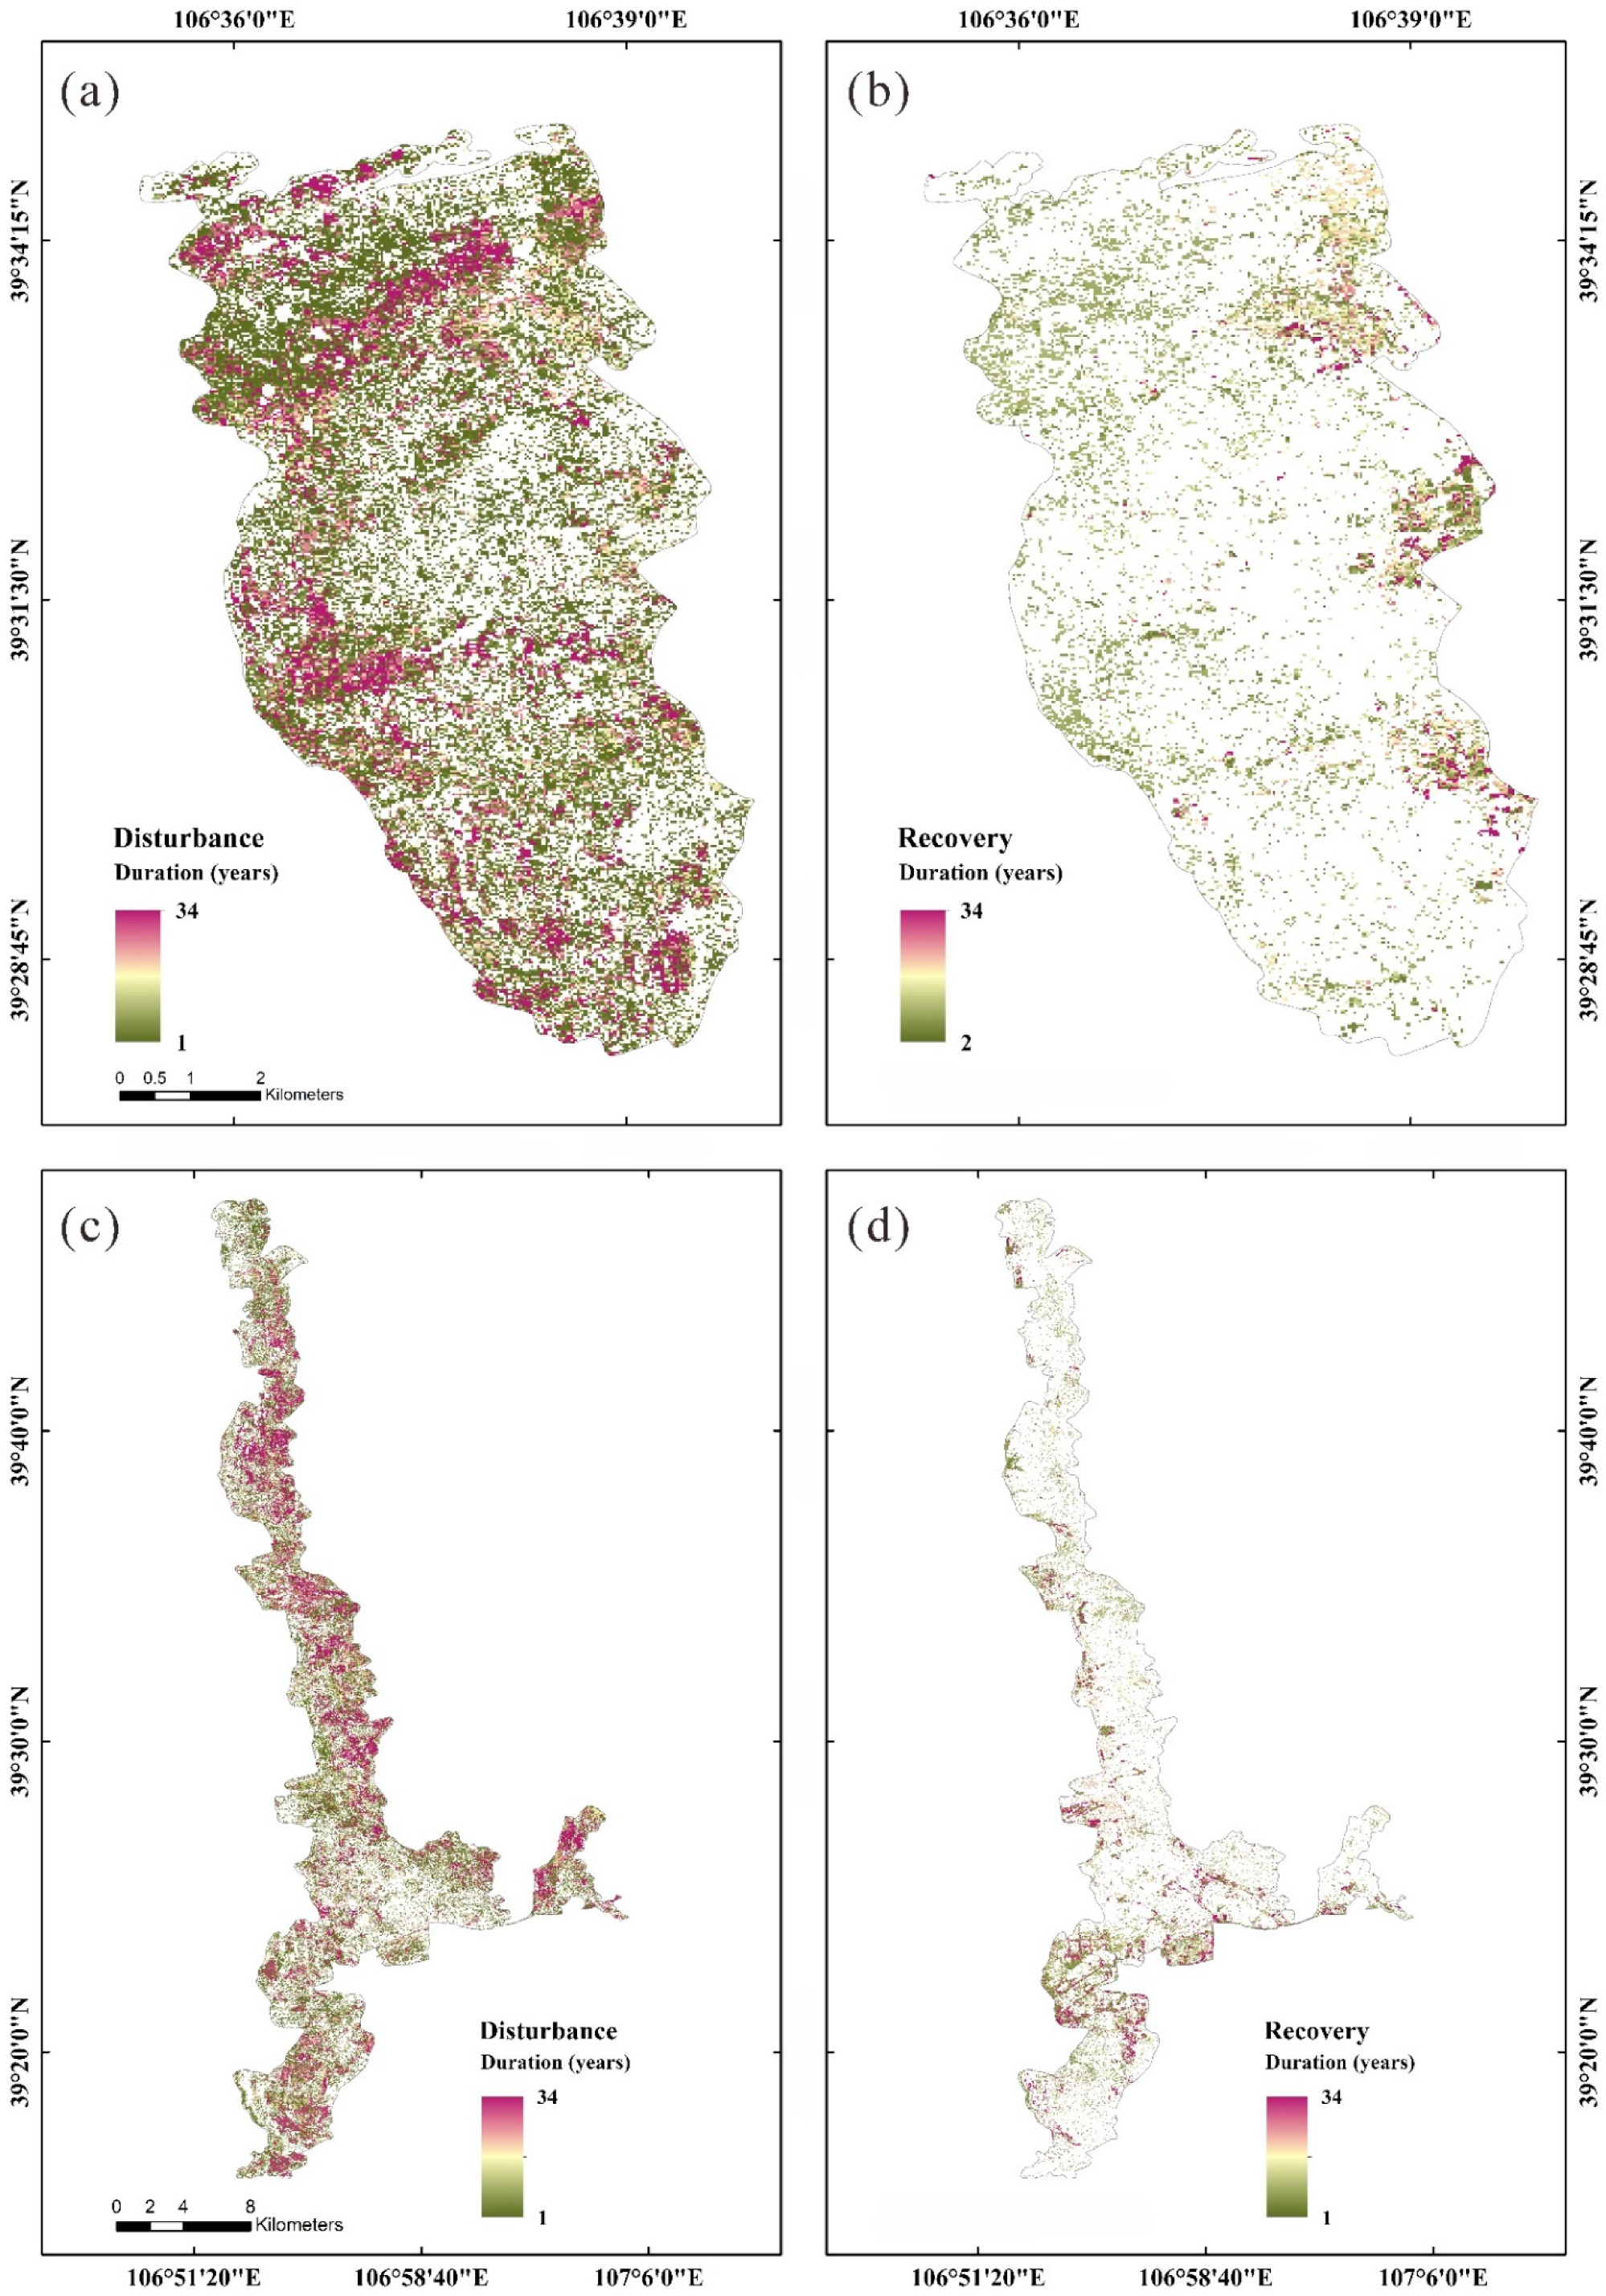
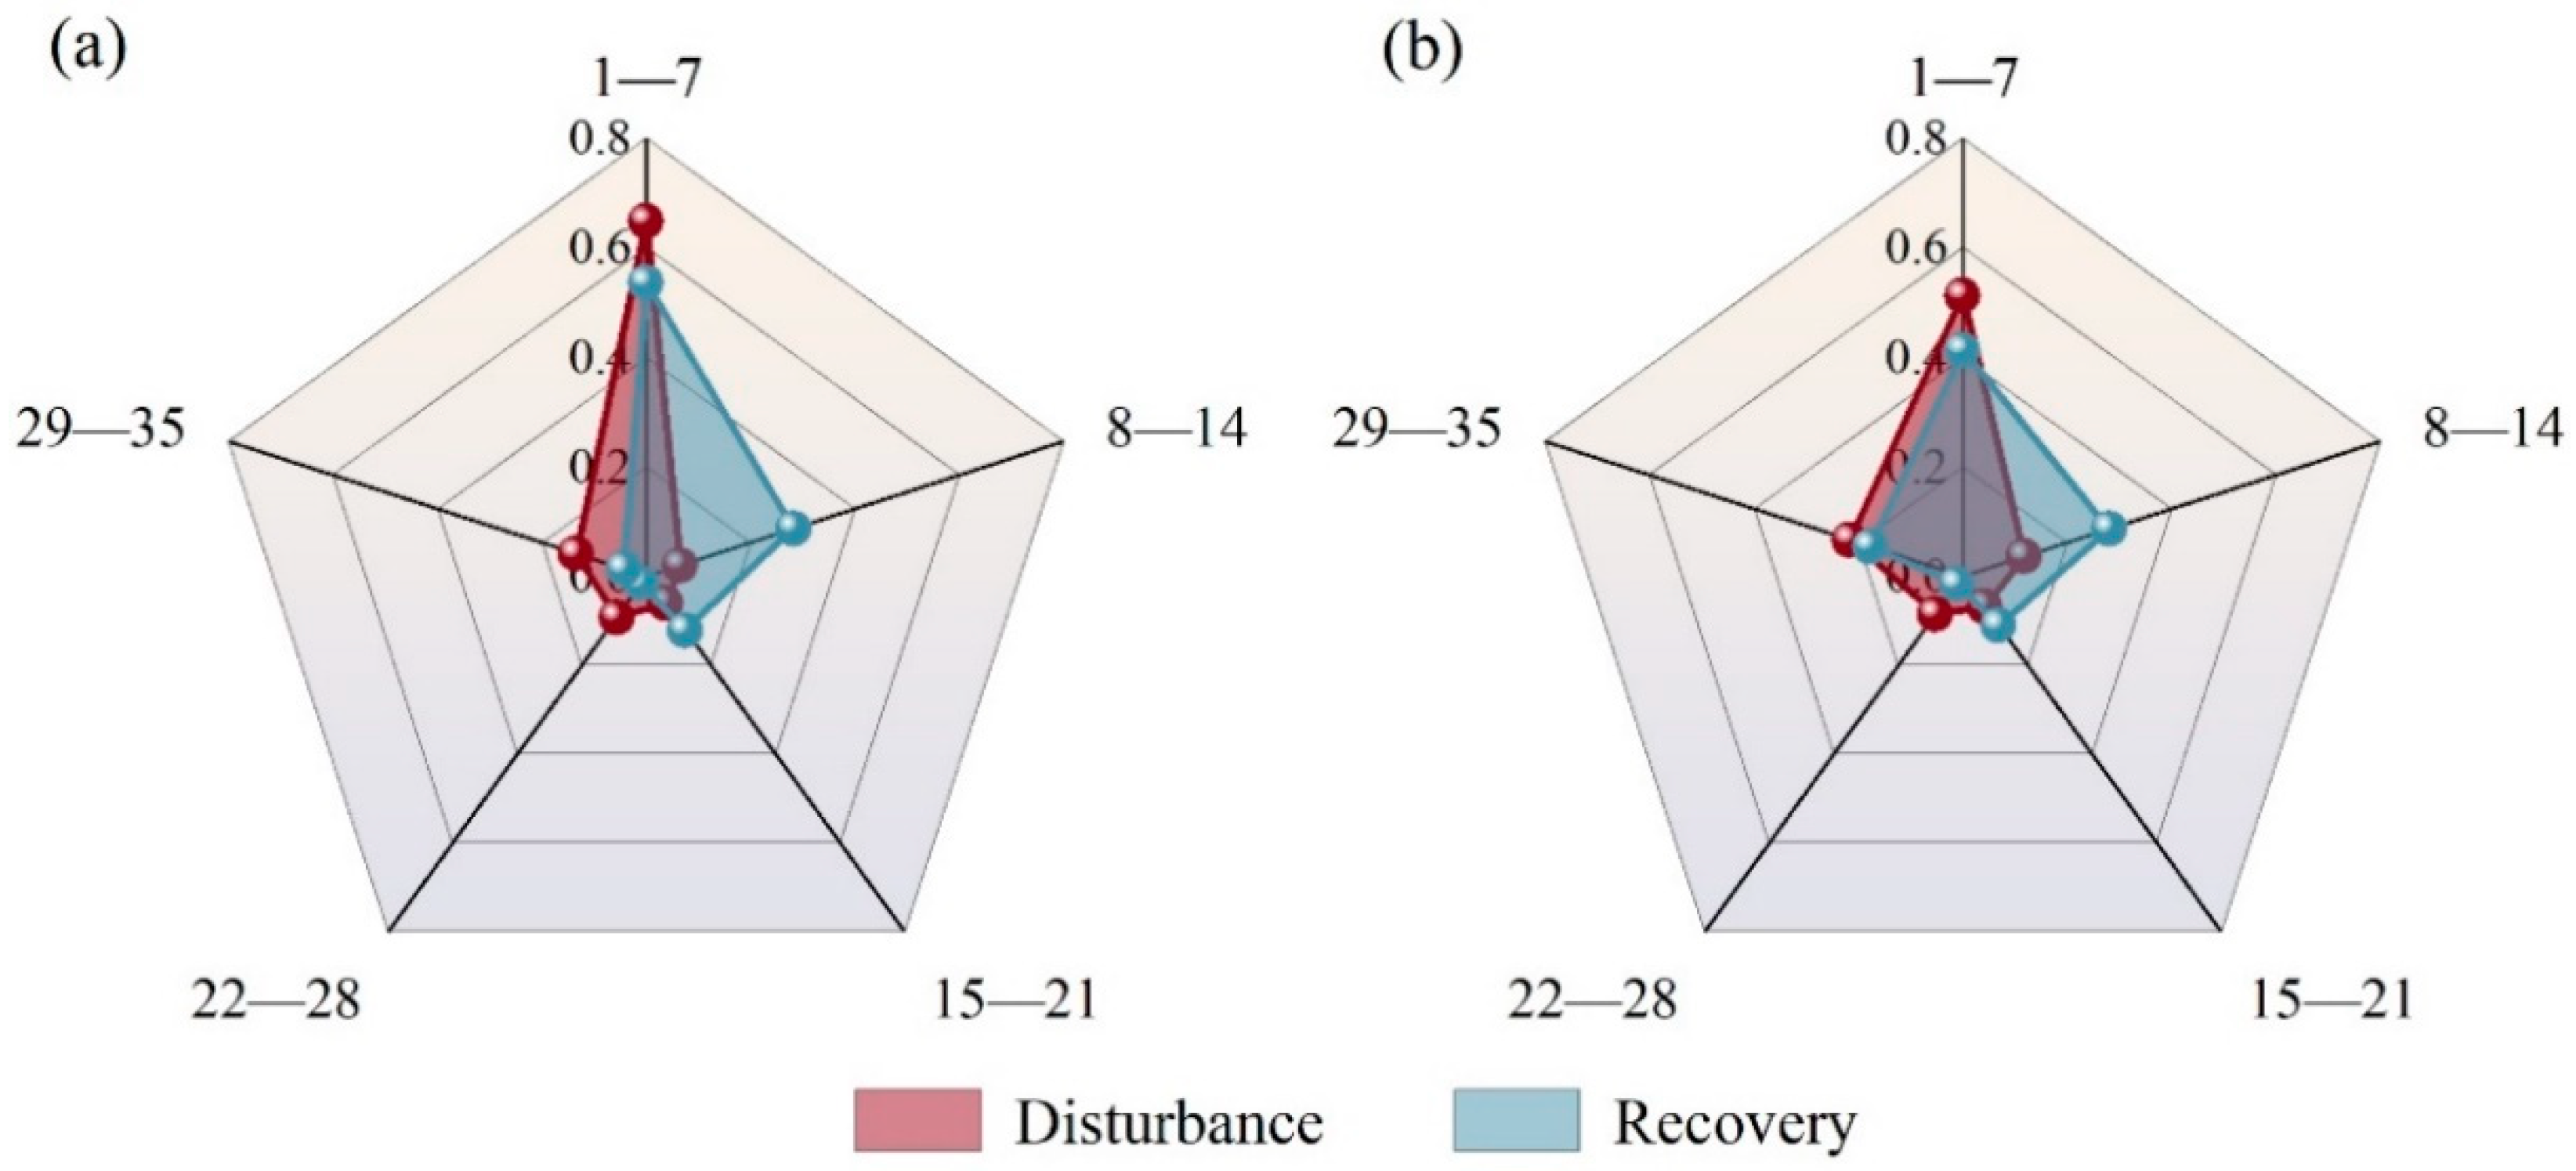
3.3.2. The Duration of Vegetation Disturbance and Recovery

The duration of disturbance in both mining sites is 1–34 years, with the recovery duration in the western mine being 2–34 years and in the eastern mine 1–34 years (Figure 6). The areas with longer disturbance duration in the western mine are distributed east–west in the north, central and southwest of the mining site, and the areas with longer recovery duration are scattered in the east. The areas with a longer period of disturbance in the eastern mine are more widely distributed spatially, and the areas with a longer period of recovery are mainly located in the southwestern part of the mine.
The highest percentage of disturbance and recovery durations in the eastern and western mines is 1–7 years (Figure 7). The percentage of disturbance duration of 1–7 years in the western mine is 64.80%, which is slightly higher than that of 51.26% in the eastern mine. The second-highest percentage of disturbance duration in both the eastern and western mines is 29–35 years, with 21.60% and 13.41%, respectively. The recovery duration of 1–7 years in the western mine accounted for 53.63%, slightly higher than the 41.27% in the eastern mine. The second-highest percentage of recovery duration in both the eastern and western mines is 8–14 years, both about 28%.

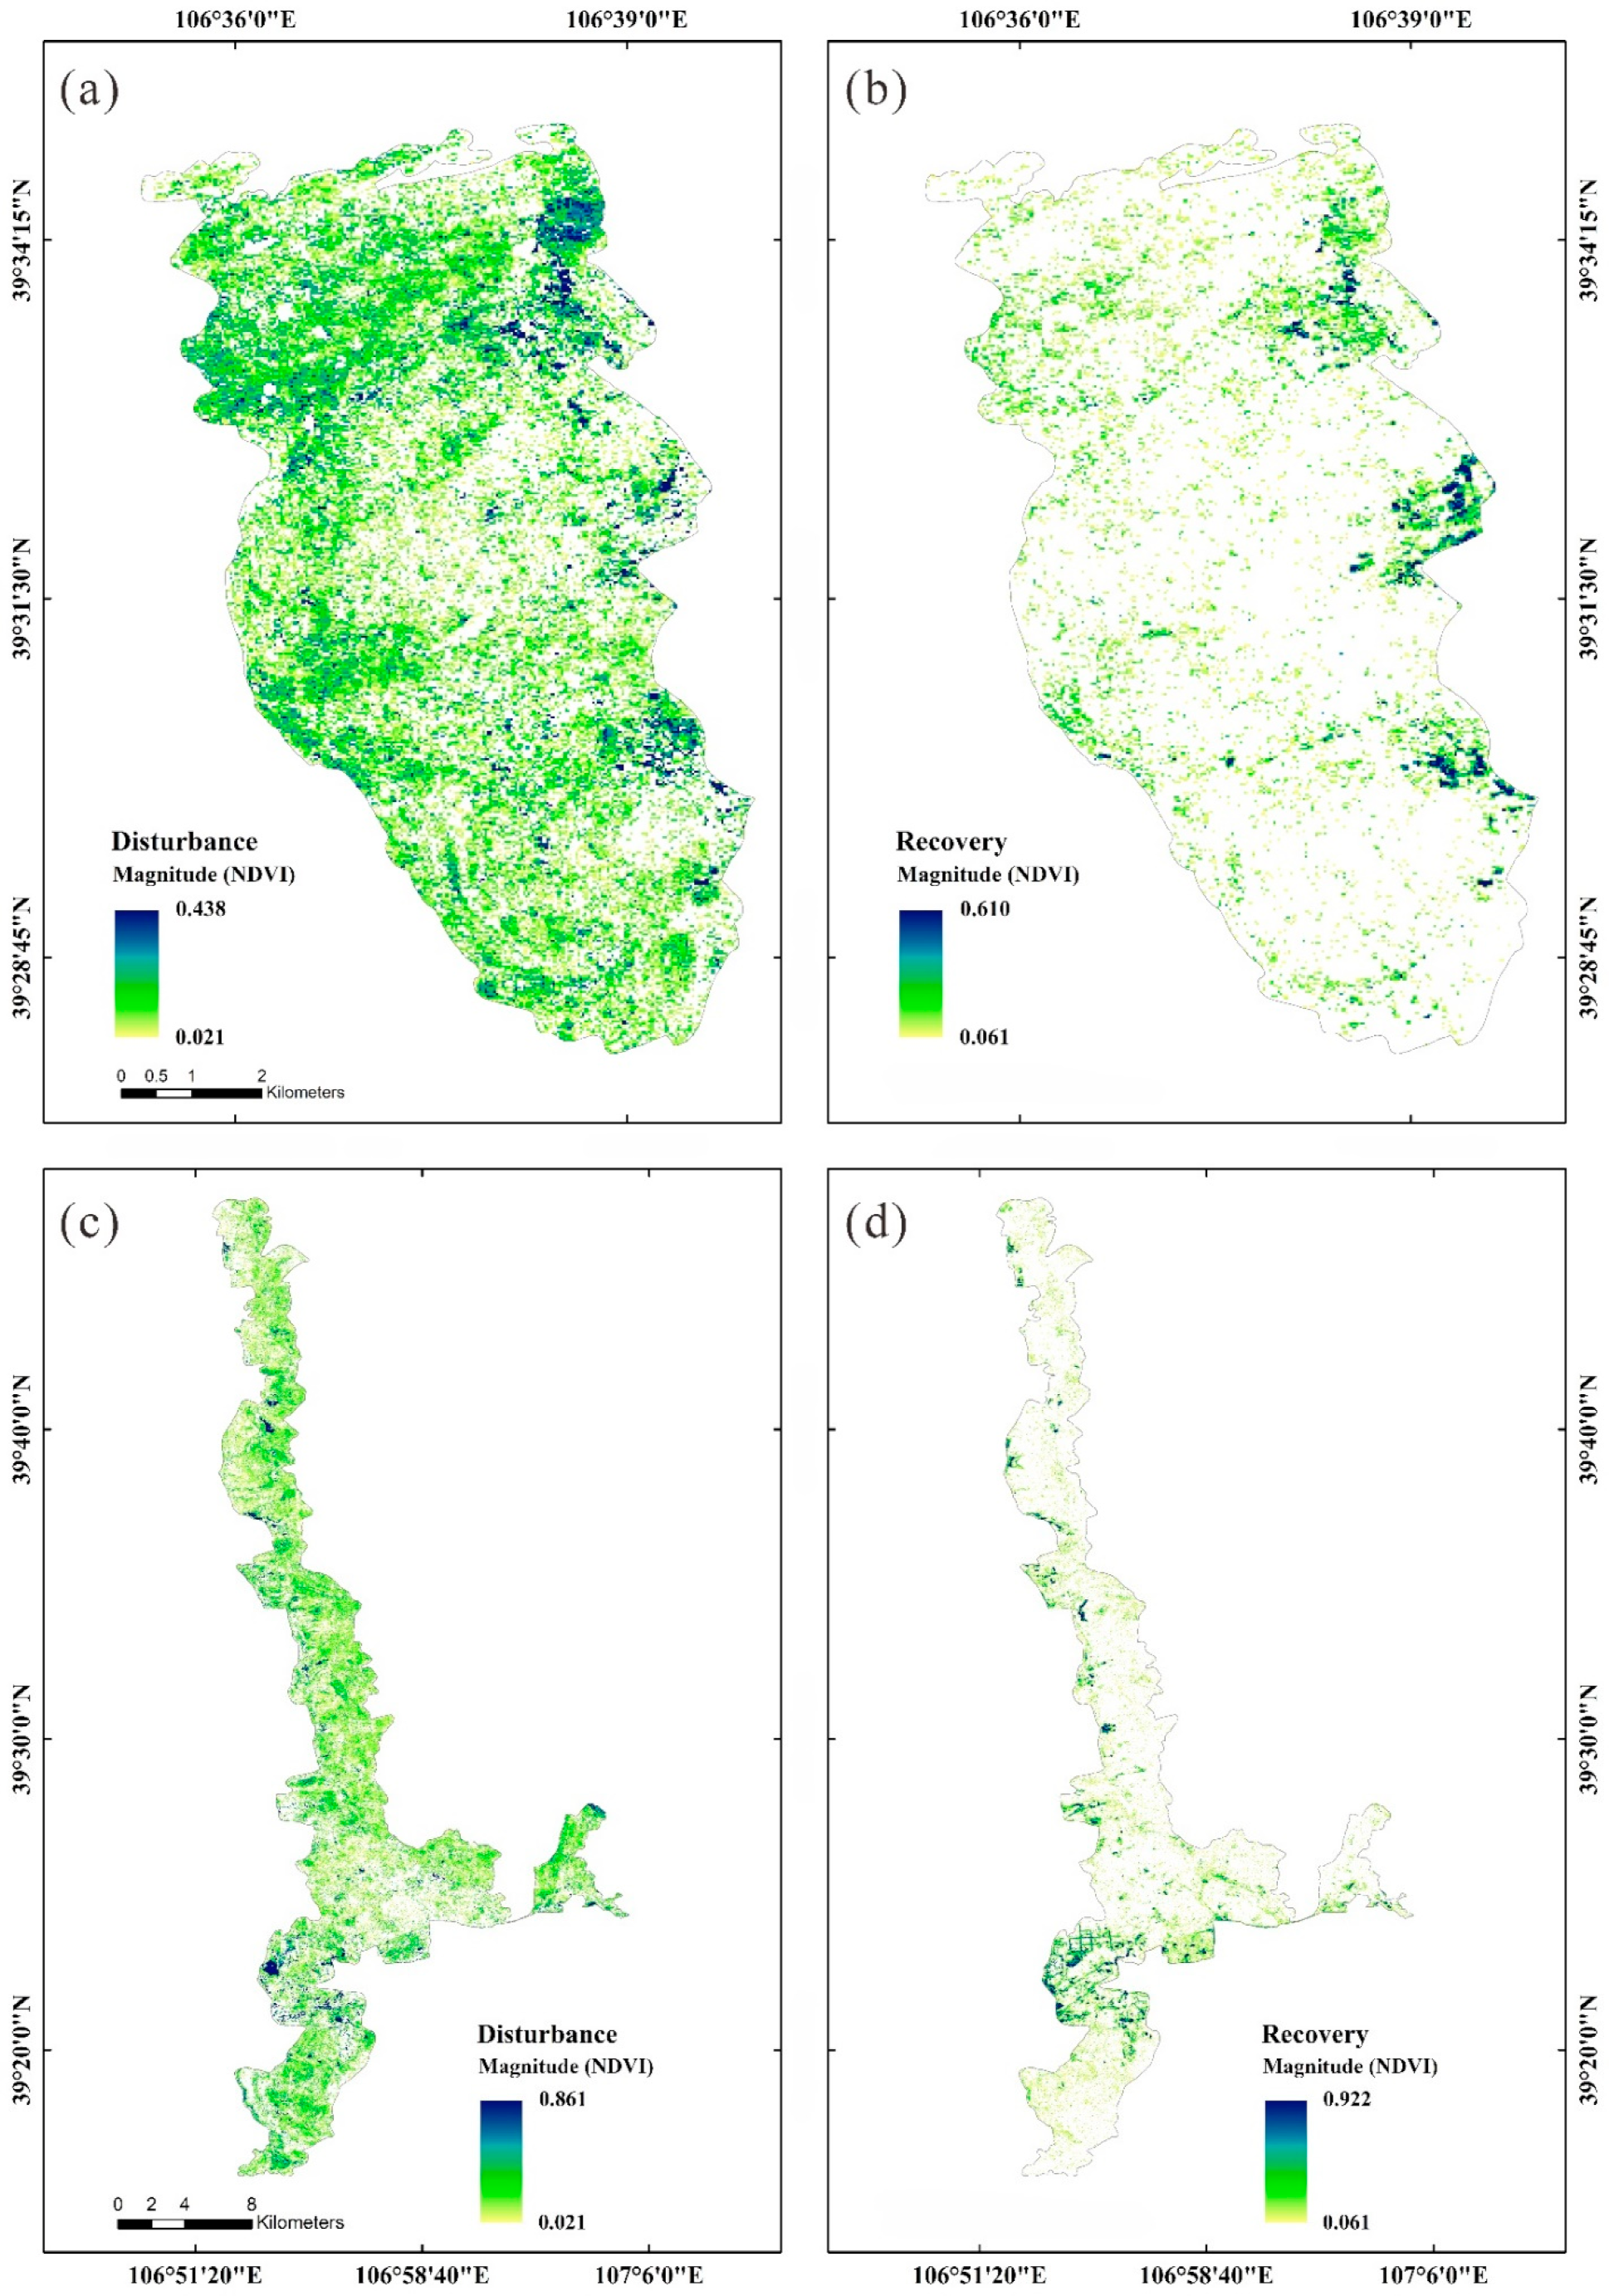
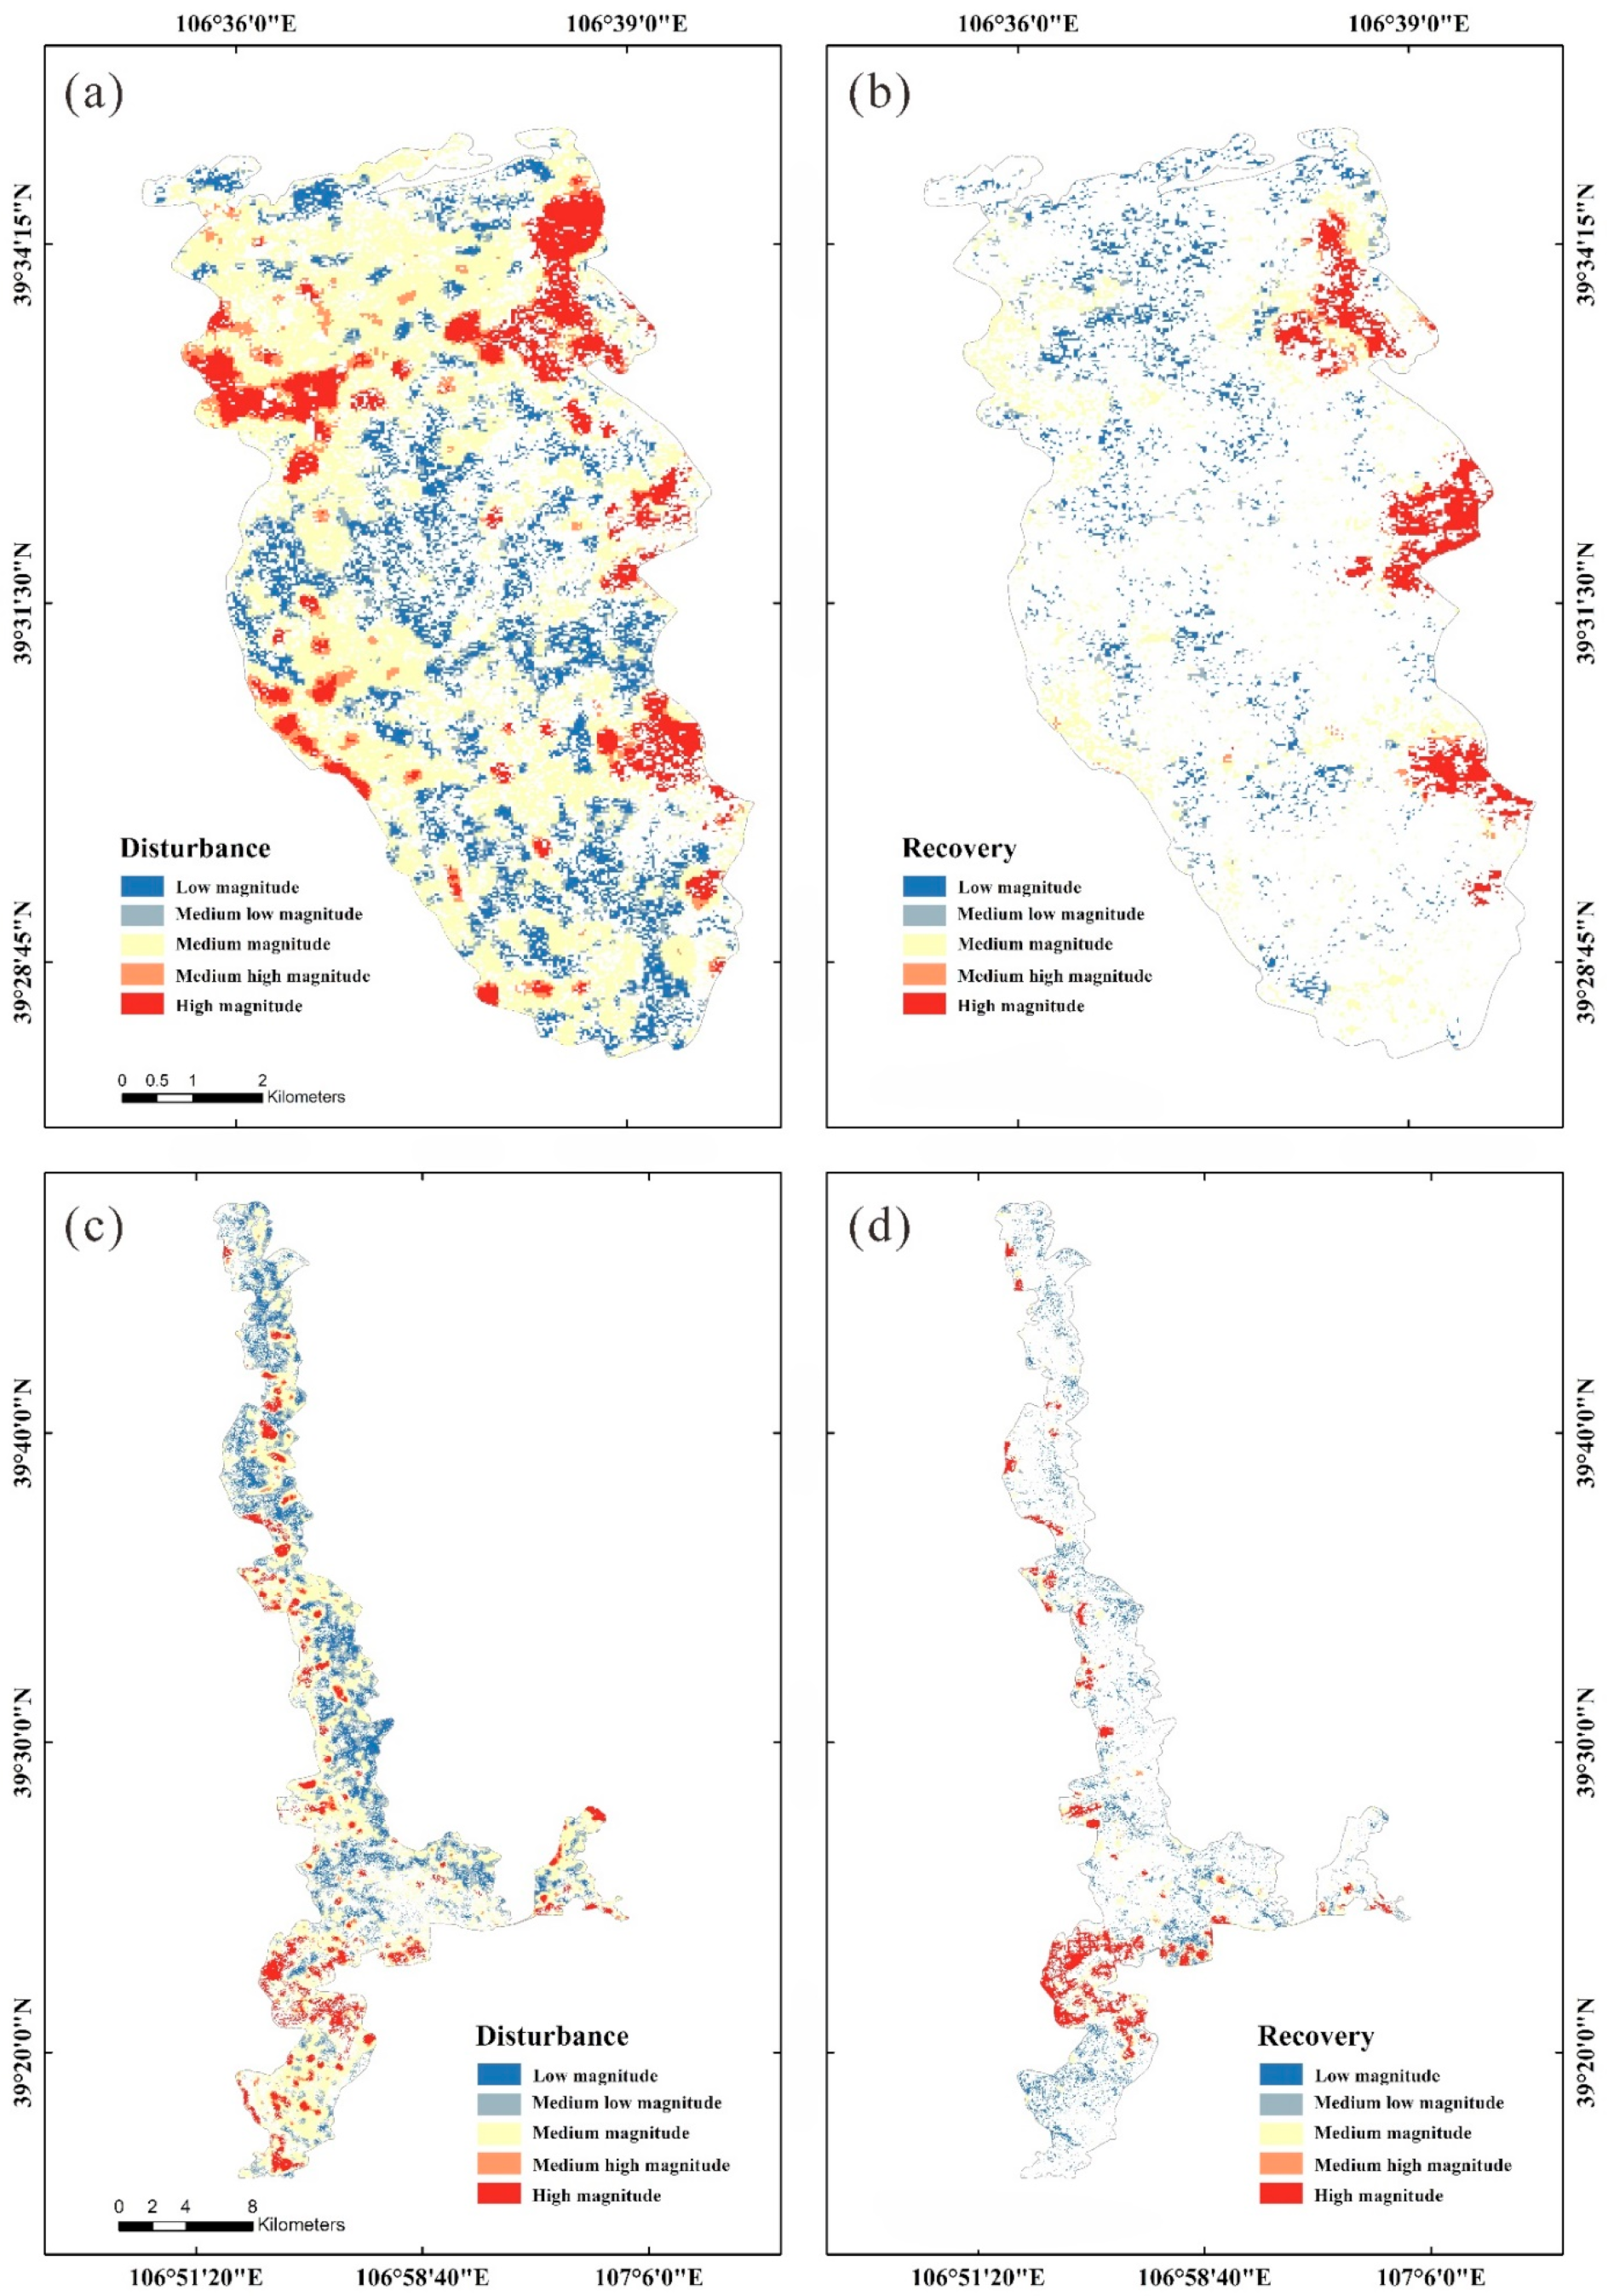
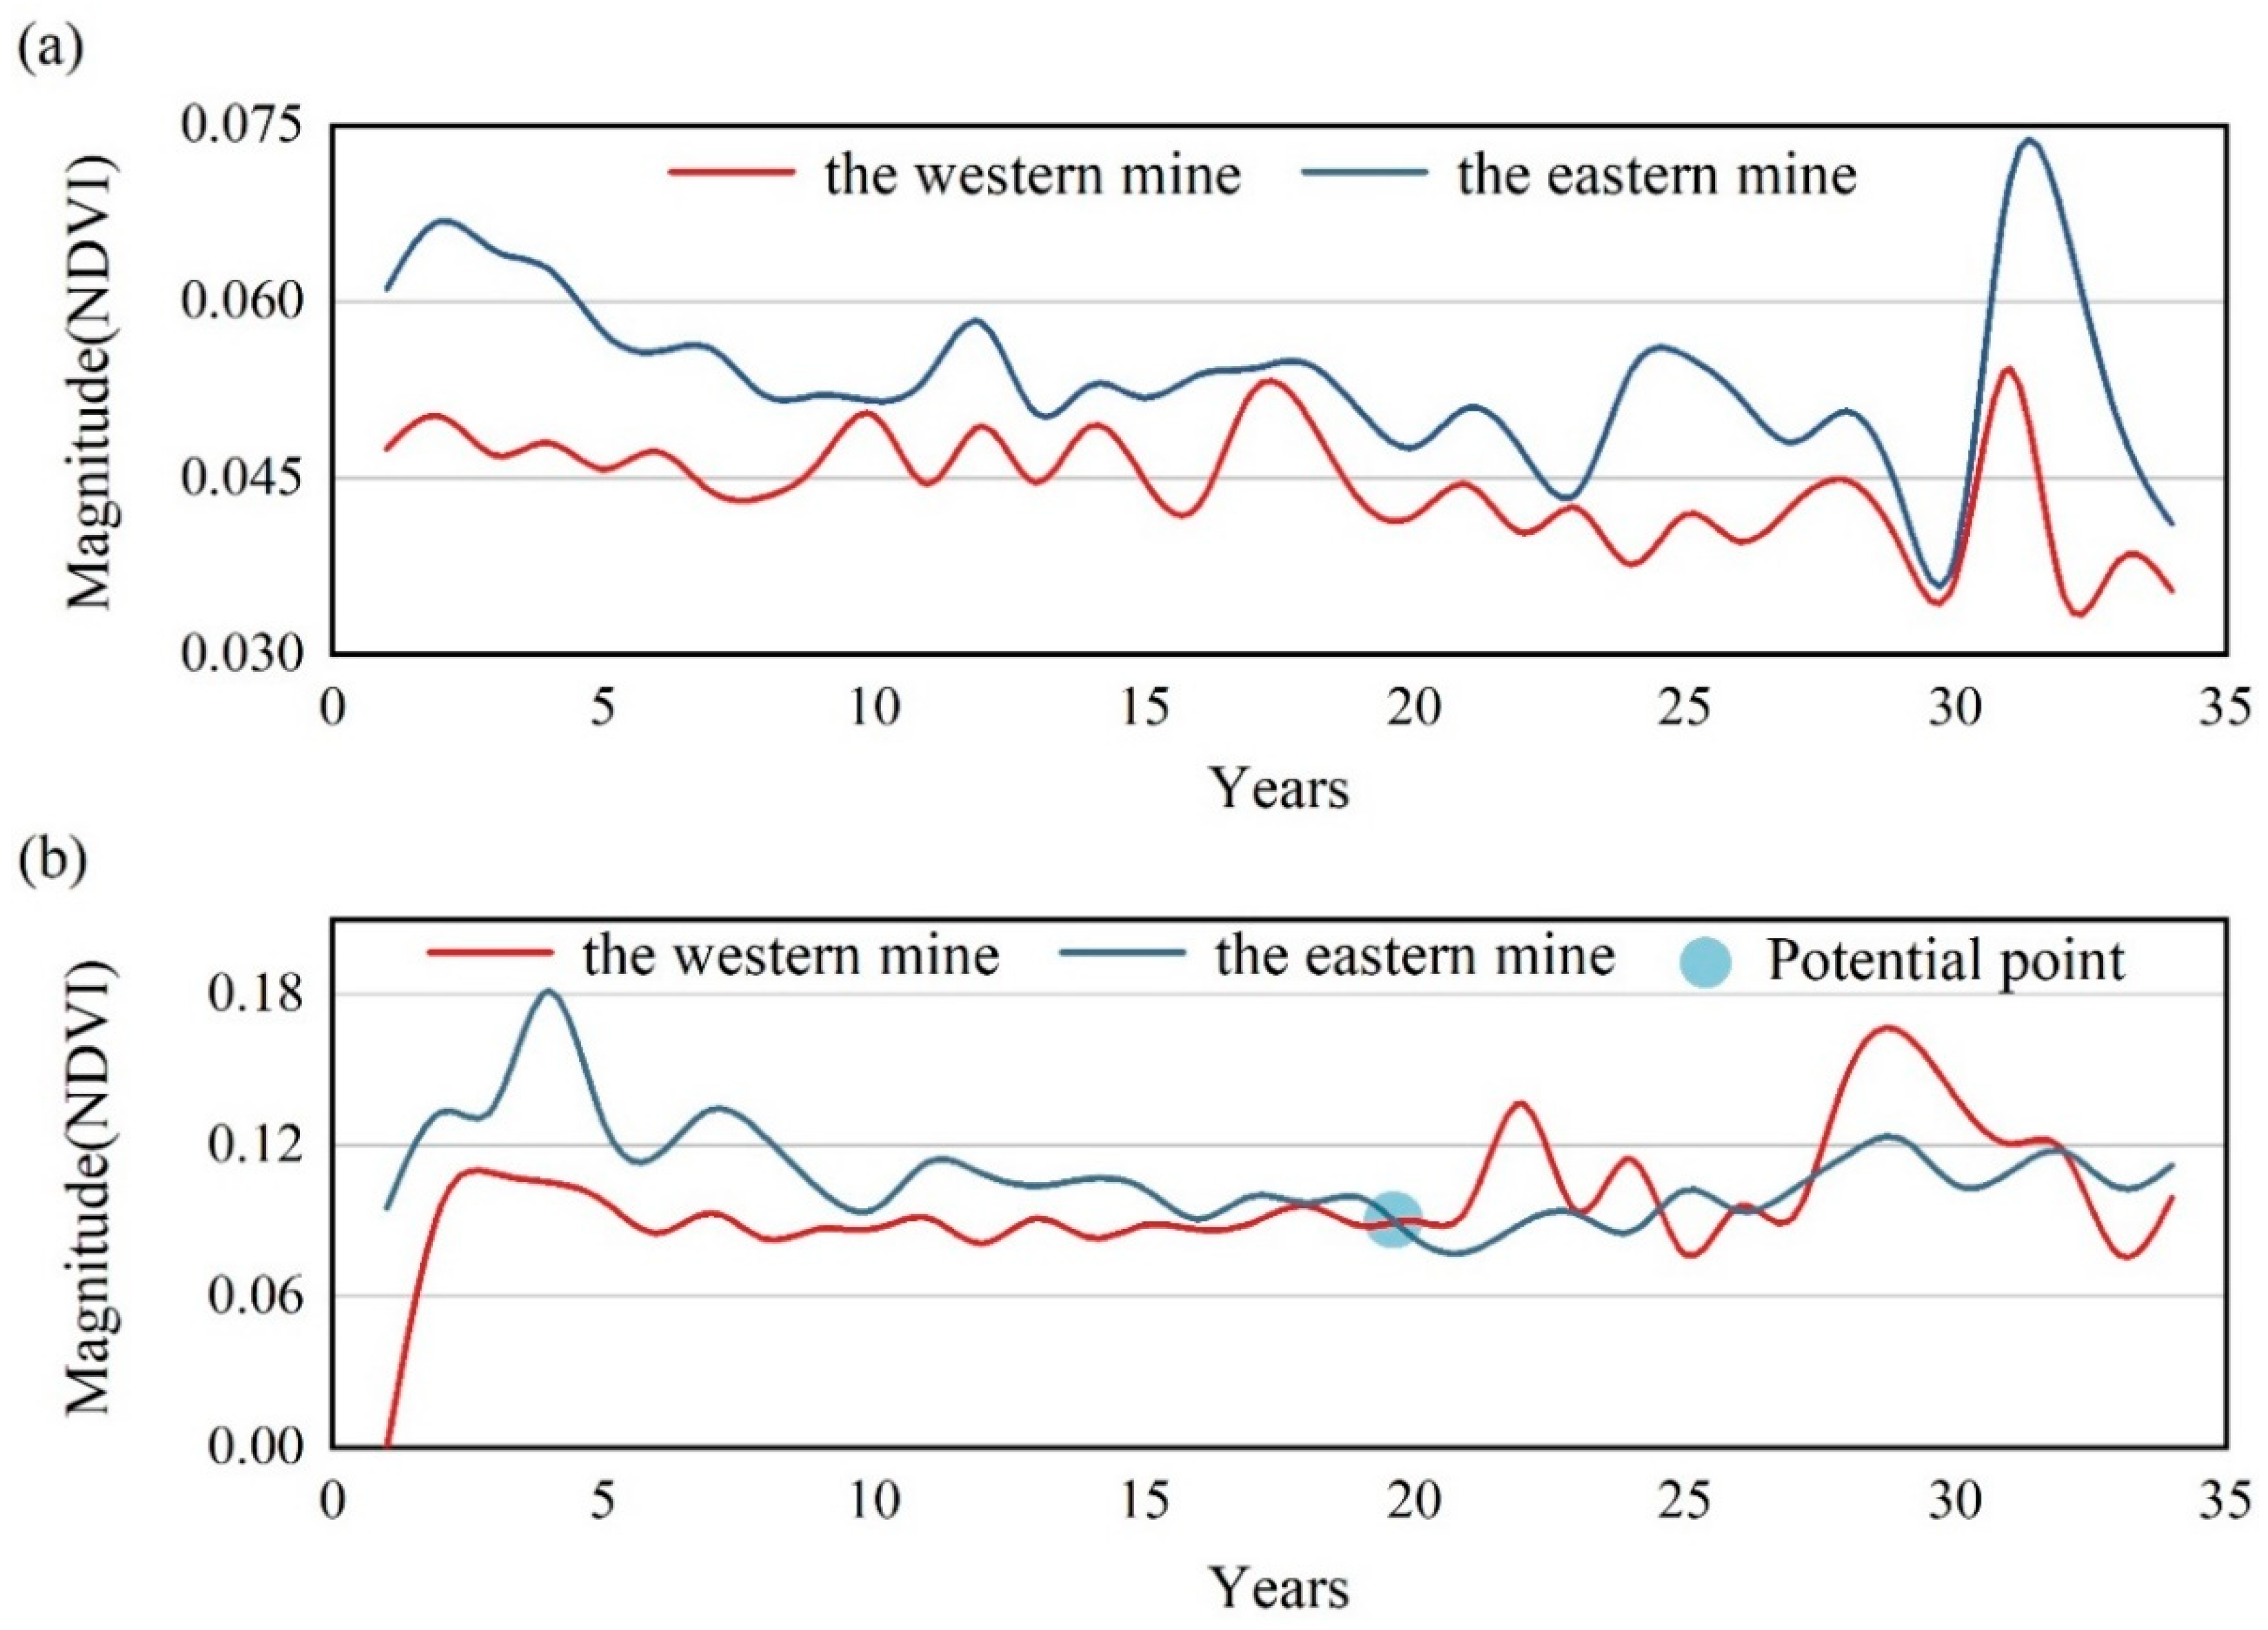
3.3.3. The Magnitude of Vegetation Disturbance and Recovery

The NDVI decrease brought by the disturbance in the western mine ranged from 0.02 to 0.44, where the more significant decrease is mainly located in the northeast and southeast of the mining site, with scattered distribution in the west. The decrease in NDVI in the eastern mine is more substantial than that in the western mine, ranging from 0.02 to 0.86. The recovery area in the western mine is spatially very consistent with the disturbed area, mainly located in the northeast and southeast of the mining site, with the NDVI increases ranging from 0.06 to 0.61. In the eastern mine, the recovery also increases with the NDVI ranging from 0.06 to 0.92. The areas of solid disturbance and recovery in the eastern mine are more sporadic, with a solid spatial consistency in the southwestern part of the mine (Figure 8).
To better understand the performance of disturbance and recovery magnitude in space, the hotspot analysis (Getis-Ord Gi*) tool of ArcGIS was used to identify the cold hotspot areas of disturbance and recovery magnitude (Figure 9). Disturbance hotspot areas in the western mine are mainly concentrated in the eastern and western edges of the mining site, with robust spatial clustering. The recovery hotspot areas are spatially consistent with those distributed in the eastern edge of the mining site. The hot spot areas disturbed and recovered in the eastern mine have spatial solid consistency but are more scattered and mainly concentrated in the southwestern part of the mining site.

3.4. Ecological Impacts under Different Mining Patterns and Surrounding Environments

The magnitude of vegetation disturbance and recovery with increasing duration showed the same regularity in both mining sites located in ecologically fragile areas (Figure 10). With the increase of duration, the disturbance magnitude generally showed a decreasing trend, and the recovery magnitude first decreased and then reached the natural fluctuation state. With the increase of disturbance duration, the surrounding ecological environments played a role in promoting the natural recovery of the mine vegetation. The magnitude of disturbance in both mining sites was reduced. The magnitude of ecological impacts produced strong fluctuations in some years due to the anomalous climate, but the overall trend decreased. Therefore, long-term mining activities in ecologically fragile areas will reduce the damage to the ecosystem compared to short-term concentrated mining. After artificial participation in restoration, natural disturbance occurs again in the mining areas, which affects the stability of the reconstructed ecosystem. The dynamic changes in the magnitude of recovery indicate that it generally takes 20 years to reach natural fluctuation state, so the monitoring of mine recovery in ecologically fragile areas should be longer than 20 years.
Based on the trend of disturbance and recovery magnitude with duration in the two mining sites in Figure 10, it is found that different mining patterns bring different ecological impacts, and the dispersed pits increase the adjacency with the surrounding ecosystems. With the increase of duration, the scattered mining pits in the eastern mine makes the natural recovery better due to the obvious spatial adjacency effect, with a higher NDVI increase of 0.02 than that of 0.012 in the western mine (Figure 10a). Meanwhile, the scattered mining pit makes the ecosystem in the eastern mine more stable after artificial restoration, and the natural fluctuation of NDVI is less than 0.046, much lower than 0.089 in the western mine (Figure 10b).
Based on the characteristics of disturbance and recovery (Table 2), the disturbance and recovery times of the two mining sites were roughly the same, but the magnitude of change differed. The maximum, mean and standard deviation of disturbance and recovery magnitude are greater in the eastern mine than in the western mine in both disturbance and recovery (Table 3). The eastern mine is located in a better natural environment, and the above data indicate that the ecological impacts of disturbance and recovery are more intense in areas with good ecological conditions. Spatially, the places where the magnitude of disturbance and restoration is the greatest, such as the southwestern part of the eastern mine, are adjacent to areas with better ecological environments.
According to the results of Spearman’s correlation analysis (Table 4), the magnitude of disturbance shows significant negative correlation with duration in both mining sites, the magnitude of recovery shows significant negative correlation with duration in the eastern mine, and no significant correlation in the western mine, all correlations are more significant in the eastern mine. In a fragmentation mining site, the magnitude of recovery depends more on the duration of restoration.

4. Discussion

4.1. Assessing Surface Mining Site Disturbance and Recovery

Mining and restoration lead to changes in vegetation in mining sites. Monitoring spatial and temporal changes of vegetation in mining sites are particularly important to assess ecological impacts and the sustainability of mining [45,46]. The LandTrendr algorithm is flexible enough to capture both sudden change events and long-term change processes, while it is helpful for monitoring dynamic ecological impacts in surface mining sites [7,24]. The algorithm can directly utilize Landsat data, which is freely available on the GEE cloud platform, and use cloud computing to process and analyze the data, simplifying the data collection and processing process [47,48]. The LandTrendr algorithm has been usually used in retrieving information such as the magnitude of change and year of occurrence, which can be used to analyze the ecological impacts of surface mining site disturbance and recovery. The occurrence and duration of activities are approximately similar in both mines, but the eastern mine has a more intense change magnitude than the western mine.
Beyond monitoring the status of vegetation disturbance and recovery, this study also analyzed the ecological impacts under different mining patterns and surrounding environments. The ecological impacts of different surface mining sites in ecologically fragile areas have the same regularity of change with duration, but the strength of change varies, which is related to the mining patterns and surrounding environments. The spatial adjacency effect of scattered pits is more obvious with the surrounding ecosystem and is susceptible to the influence of the surrounding ecological environment. Mining development in areas with better ecological environment will bring greater ecological pressure.

4.2. Comparison of the Two Mining Sites

The Yellow River runs from south to north through the city, and the two mining sites are located in the west and east of the Yellow River. Although both are concentrated and continuous mining sites, the mining patterns and the surrounding environments in which they are located are different. It is known from the landscape indexes that the eastern mine has a more fragmented landscape because of the larger number and density of patches and the smaller largest patch index and mean patch size, and a more irregular patch shape due to the larger landscape shape index. The western mine is smaller, with more concentrated pits, surrounded by sandy land and a fragile ecological background. The eastern mine has scattered pits, forming a sizeable north–south strip of the concentrated and contiguous mining site, bordering the Tetraena mongolica reserve, with better ecological restoration conditions. The results of the study show that different mining patterns and surrounding environments bring different ecological impacts and scattered and disorderly mining in areas with better natural environment will intensify the impact on the ecological environment.
For a resource-based region like Wuhai, the mining development pattern is complex on the regional scale. With the development of the mining industry, the agglomeration effect of mining activities in area is increasing, and single impacts gradually converge and interact to produce cumulative impacts [49]; the spatial heterogeneity of the cumulative effect can be responded to by the vegetation growth status [29]. It has been shown that ecosystem health is influenced by the extent of mining development, landscape pattern characteristics and the background ecological condition of the area in which it is located, and that scattered and disorderly mining in areas with higher ecological value usually exacerbates the impact on the ecosystem health of the surrounding area. Therefore, the sustainability of mining development is often reflected in areas with lower ecological value, and the ecological restoration effect is more significant in dispersed mining sites [31].

4.3. Research Limitations and Future Work

As the LandTrendr algorithm is based on the change of surface vegetation spectral indices to assess the disturbance and recovery of mining, it is only applicable to surface mining sites. It cannot be used for underground mines that do not cause surface changes [50]. NDVI changes due to mining disturbance and recovery in the ecologically fragile areas are not significant, so there is a case that the NDVI decrease due to land degradation is incorrectly identified as mining disturbance, which affects the evaluation accuracy of the algorithm. In addition, due to the lack of high-resolution images on Google Earth Pro before 2010, only the years 2010–2020 were selected for accuracy verification in this study. The results can only roughly characterize the accuracy of the LandTrendr algorithm for monitoring surface mining site disturbance and recovery.
The LandTrendr algorithm was implemented on the GEE to simplify the user process. However, monitoring of surface mining site disturbance and recovery based only on different vegetation spectral indices is rather crude, and other parameter settings need to be added according to different scenarios. For example, the monitoring of surface mining site disturbance and recovery can add several indicators such as topographic elevation [51,52], the physical and chemical properties of soil [53,54,55,56], surface temperature [57], etc., to supplement the relevant vegetation indices to measure the extent of mine disturbance and the effect of recovery. Meanwhile, due to the lack of accurate information on reclamation works, we could not distinguish whether or not the vegetation recovery monitored by the LandTrendr algorithm was due to reclamation works or natural processes.

5. Conclusions

In this study, two concentrated and contiguous surface mining sites were chosen as study areas to show the impacts of different mining patterns and the surrounding environment on vegetation. The western mine represents surface mining sites with a more concentrated mining pattern located in a poorer ecological environment, while the eastern mine represents surface mining sites located in a better ecological environment with scattered and disorderly mining. The LandTrendr algorithm and Landsat imagery were applied to monitor the vegetation disturbance and recovery characteristics, providing critical information for quantitative analysis and comparison.
Results show that the application of the LandTrendr algorithm for surface mining site monitoring is appropriate, with an overall accuracy of around 75% for disturbance and recovery. The ecological impacts of different surface mining sites in ecologically fragile areas have the same regularity, the magnitude of the disturbance shows a significant negative correlation with the duration, and the magnitude of the disturbance decreases as the duration increases. The magnitude of recovery decreases first with increasing duration and then reaches the natural fluctuation state after 20 years of recovery. Therefore, surface mining sites in ecologically fragile areas are more suitable for long-term mining, and monitoring should extend more than 20 years after restoration. According to the data obtained by the LandTrendr algorithm, the ecological impacts are different under different mining patterns and surrounding environments. Scattered mining areas are more likely to produce natural recovery due to the obvious spatial adjacency effect, while the restored ecosystem is more stable. The performance of disturbance is more obvious when mining development is carried out in places with better ecological environment, while the effect of ecological restoration is also more significant.

Author Contributions

Conceptualization, Y.L. and M.X.; methodology, Y.L.; software, Y.L., H.W. and J.L.; validation, Y.L., H.W. and J.L.; formal analysis, Y.L.; investigation, Y.L., H.W. and J.L; resources, Y.L. and H.W.; data curation, Y.L.; writing—original draft, Y.L.; writing—review editing, M.X., H.W. and B.C.; visualization, H.W. and J.L.; supervision, J.L. and B.C.; project administration, M.X.; funding acquisition, M.X. All authors have read and agreed to the published version of the manuscript.

Funding

This work was supported by the National Key R&D Program of the Ministry of Science and Technology of China (Grant number 2017YFC0504401).

Acknowledgments

The authors would thank Jiafeng Zang for the improved representation of the figures.

Conflicts of Interest

The authors declare no conflict of interest.

Appendix A

Table A1. The number of yearly and cumulative disturbed and recovery pixels from 1987 to 2020 in the western mine.
YearRecoveryDisturbanceCumulative RecoveryCumulative DisturbanceCumulative R/D Ratio
1987510010,995n/an/an/a
19884392439246.74%
1989201396323127.27%
1990622012525149.80%
1991613618628764.81%
1992821419450138.72%
19937177120122728.85%
19945062725128998.66%
199519685127097502.77%
199619255228912,3022.35%
199711124630013,5482.21%
199811283841214,3862.86%
199911233542316,7212.53%
20005228947517,0102.79%
200113550961017,5193.48%
200230621191617,7305.17%
2003996010101523,7404.28%
20041109233212423,9738.86%
2005283151240724,1249.98%
200627678268324,20211.09%
2007360551304324,75312.29%
20083932029343626,78212.83%
2009849597428527,37915.65%
2010442478472727,85716.97%
2011397603512428,46018.00%
2012944154606828,61421.21%
20131091269715928,88324.79%
2014367523752629,40625.59%
2015355538788129,94426.32%
2016412539829330,48327.21%
2017488450878130,93328.39%
201865519884631,45228.13%
201941481885032,93326.87%
202001423885034,35625.76%
Table A2. The number of yearly and cumulative disturbed and recovery pixels from 1987 to 2020 in the eastern mine.
YearRecoveryDisturbanceCumulative RecoveryCumulative DisturbanceCumulative R/D Ratio
198732,27249,650n/an/an/a
198827132713207.69%
1989164985171676853019.65%
1990187541863858421.70%
1991631291926871322.10%
1992432383196911,09617.75%
1993656122203417,21811.81%
19942152271224919,48911.54%
1995816170233025,6599.08%
199613010,447246036,1066.81%
19978714,023254750,1295.08%
1998513911306051,0406.00%
19991073234316754,2745.84%
20001031661327055,9355.85%
20013333738360359,6736.04%
200221071223571060,8969.38%
2003111813,702682874,5989.15%
200417541728858276,32611.24%
20051712250110,29478,82713.06%
20061324100711,61879,83414.55%
20072711299514,32982,82917.30%
2008162121,68615,950104,51515.26%
20093343435619,293108,87117.72%
20101959496921,252113,84018.67%
20111458714622,710120,98618.77%
20125608158328,318122,56923.10%
20133706267632,024125,24525.57%
20142280297134,304128,21626.75%
20151344403535,648132,25126.95%
20162276238837,924134,63928.17%
20172546497040,470139,60928.99%
2018842245341,312142,06229.08%
201982360241,394145,66428.42%
20200439841,394150,06227.58%

References

  1. Xiao, W.; Lv, X.J.; Zhao, Y.L.; Sun, H.X.; Li, J.Q. Ecological resilience assessment of an arid coal mining area using index of entropy and linear weighted analysis: A case study of Shendong Coalfield, China. Ecol. Indic. 2020, 109, 105843. [Google Scholar] [CrossRef]
  2. Lv, X.J.; Xiao, W.; Zhao, Y.L.; Zhang, W.K.; Li, S.C.; Sun, H.X. Drivers of spatio-temporal ecological vulnerability in an arid, coal mining region in Western China. Ecol. Indic. 2019, 106, 105475. [Google Scholar] [CrossRef]
  3. Hodge, R.A. Mining company performance and community conflict: Moving beyond a seeming paradox. J. Clean. Prod. 2014, 84, 27–33. [Google Scholar] [CrossRef]
  4. Dong, S.G.; Feng, H.B.; Xia, M.H.; Li, Y.; Wang, C.; Wang, L. Spatial-temporal evolutions of groundwater environment in prairie opencast coal mine area: A case study of Yimin Coal Mine, China. Environ. Geochem. Health 2020, 42, 3101–3118. [Google Scholar] [CrossRef] [PubMed]
  5. Pericak, A.A.; Thomas, C.J.; Kroodsma, D.A.; Wasson, M.F.; Ross, M.R.V.; Clinton, N.E.; Campagna, D.J.; Franklin, Y.; Bernhardt, E.S.; Amos, J.F. Mapping the yearly extent of surface coal mining in Central Appalachia using Landsat and Google Earth Engine. PLoS ONE 2018, 13, e0197758. [Google Scholar] [CrossRef] [Green Version]
  6. Lechner, A.M.; McIntyre, N.; Witt, K.; Raymond, C.M.; Arnold, S.; Scott, M.; Rifldn, W. Challenges of integrated modelling in mining regions to address social, environmental and economic impacts. Environ. Model. Softw. 2017, 93, 268–281. [Google Scholar] [CrossRef]
  7. Xiao, W.; Deng, X.Y.; He, T.T.; Chen, W.Q. Mapping Annual Land Disturbance and Reclamation in a Surface Coal Mining Region Using Google Earth Engine and the LandTrendr Algorithm: A Case Study of the Shengli Coalfield in Inner Mongolia, China. Remote Sens. 2020, 12, 1612. [Google Scholar] [CrossRef]
  8. Bao, N.S.; Lechner, A.; Fletcher, A.; Erskine, P.; Mulligan, D.; Bai, Z.K. SPOTing long-term changes in vegetation over short-term variability. Int. J. Min. Reclam. Environ. 2014, 28, 2–24. [Google Scholar] [CrossRef]
  9. Li, X.J.; Chen, W.T.; Cheng, X.W.; Wang, L.Z. A Comparison of Machine Learning Algorithms for Mapping of Complex Surface-Mined and Agricultural Landscapes Using ZiYuan-3 Stereo Satellite Imagery. Remote Sens. 2016, 8, 514. [Google Scholar] [CrossRef] [Green Version]
  10. Chen, W.T.; Li, X.J.; He, H.X.; Wang, L.Z. Assessing Different Feature Sets’ Effects on Land Cover Classification in Complex Surface-Mined Landscapes by ZiYuan-3 Satellite Imagery. Remote Sens. 2018, 10, 23. [Google Scholar] [CrossRef] [Green Version]
  11. Sonter, L.J.; Moran, C.J.; Barrett, D.J.; Soares, B.S. Processes of land use change in mining regions. J. Clean. Prod. 2014, 84, 494–501. [Google Scholar] [CrossRef] [Green Version]
  12. Yang, Z.; Li, J.; Zipper, C.E.; Shen, Y.Y.; Miao, H.; Donovan, P.F. Identification of the disturbance and trajectory types in mining areas using multitemporal remote sensing images. Sci. Total Environ. 2018, 644, 916–927. [Google Scholar] [CrossRef]
  13. Gypser, S.; Herppich, W.B.; Fischer, T.; Lange, P.; Veste, M. Photosynthetic characteristics and their spatial variance on biological soil crusts covering initial soils of post-mining sites in Lower Lusatia, NE Germany. Flora 2016, 220, 103–116. [Google Scholar] [CrossRef]
  14. Kennedy, R.E.; Yang, Z.Q.; Cohen, W.B.; Pfaff, E.; Braaten, J.; Nelson, P. Spatial and temporal patterns of forest disturbance and regrowth within the area of the Northwest Forest Plan. Remote Sens. Environ. 2012, 122, 117–133. [Google Scholar] [CrossRef]
  15. Kennedy, R.E.; Yang, Z.G.; Cohen, W.B. Detecting trends in forest disturbance and recovery using yearly Landsat time series: 1. LandTrendr—Temporal segmentation algorithms. Remote Sens. Environ. 2010, 114, 2897–2910. [Google Scholar] [CrossRef]
  16. Verbesselt, J.; Hyndman, R.; Newnham, G.; Culvenor, D. Detecting trend and seasonal changes in satellite image time series. Remote Sens. Environ. 2010, 114, 106–115. [Google Scholar] [CrossRef]
  17. Verbesselt, J.; Hyndman, R.; Zeileis, A.; Culvenor, D. Phenological change detection while accounting for abrupt and gradual trends in satellite image time series. Remote Sens. Environ. 2010, 114, 2970–2980. [Google Scholar] [CrossRef] [Green Version]
  18. Zhu, Z.; Woodcock, C.E. Continuous change detection and classification of land cover using all available Landsat data. Remote Sens. Environ. 2014, 144, 152–171. [Google Scholar] [CrossRef] [Green Version]
  19. Liu, S.S.; Wei, X.L.; Li, D.Q.; Lu, D.S. Examining Forest Disturbance and Recovery in the Subtropical Forest Region of Zhejiang Province Using Landsat Time-Series Data. Remote Sens. 2017, 9, 479. [Google Scholar] [CrossRef] [Green Version]
  20. Cohen, W.B.; Yang, Z.Q.; Heale, S.P.; Kennedy, R.E.; Gorelic, N. A LandTrendr multispectral ensemble for forest disturbance detection. Remote Sens. Environ. 2018, 205, 131–140. [Google Scholar] [CrossRef]
  21. Zou, Z.H.; Xiao, X.M.; Dong, J.W.; Qin, Y.W.; Doughty, R.B.; Menarguez, M.A.; Zhang, G.L.; Wang, J. Divergent trends of open-surface water body area in the contiguous United States from 1984 to 2016. Proc. Natl. Acad. Sci. USA 2018, 115, 3810–3815. [Google Scholar] [CrossRef] [Green Version]
  22. He, T.T.; Xiao, W.; Zhao, Y.L.; Deng, X.Y.; Hu, Z.Q. Identification of waterlogging in Eastern China induced by mining subsidence: A case study of Google Earth Engine time-series analysis applied to the Huainan coal field. Remote Sens. Environ. 2020, 242, 111742. [Google Scholar] [CrossRef]
  23. Cohen, W.B.; Yang, Z.G.; Kennedy, R. Detecting trends in forest disturbance and recovery using yearly Landsat time series: 2. TimeSync—Tools for calibration and validation. Remote Sens. Environ. 2010, 114, 2911–2924. [Google Scholar] [CrossRef]
  24. Yang, Y.J.; Erskine, P.D.; Lechner, A.M.; Mulligan, D.; Zhang, S.L.; Wang, Z.Y. Detecting the dynamics of vegetation disturbance and recovery in surface mining area via Landsat imagery and LandTrendr algorithm. J. Clean. Prod. 2018, 178, 353–362. [Google Scholar] [CrossRef]
  25. Yaylaci, E.D.; Duzgun, H.S. Evaluating the mine plan alternatives with respect to bottom-up and top-down sustainability criteria. J. Clean. Prod. 2017, 167, 837–849. [Google Scholar] [CrossRef]
  26. Marnika, E.; Christodoulou, E.; Xenidis, A. Sustainable development indicators for mining sites in protected areas: Tool development, ranking and scoring of potential environmental impacts and assessment of management scenarios. J. Clean. Prod. 2015, 101, 59–70. [Google Scholar] [CrossRef]
  27. Kennedy, R.E.; Yang, Z.Q.; Gorelick, N.; Braaten, J.; Cavalcante, L.; Cohen, W.B.; Healey, S. Implementation of the LandTrendr Algorithm on Google Earth Engine. Remote Sens. 2018, 10, 691. [Google Scholar] [CrossRef] [Green Version]
  28. Gorelick, N.; Hancher, M.; Dixon, M.; Ilyushchenko, S.; Thau, D.; Moore, R. Google Earth Engine: Planetary-scale geospatial analysis for everyone. Remote Sens. Environ. 2017, 202, 18–27. [Google Scholar] [CrossRef]
  29. Li, H.T.; Xie, M.M.; Wang, H.H.; Li, S.L.; Xu, M. Spatial Heterogeneity of Vegetation Response to Mining Activities in Resource Regions of Northwestern China. Remote Sens. 2020, 12, 3247. [Google Scholar] [CrossRef]
  30. Zeng, Q.; Shen, L.; Yang, J. Potential impacts of mining of super-thick coal seam on the local environment in arid Eastern Junggar coalfield, Xinjiang region, China. Environ. Earth Sci. 2020, 79, 88. [Google Scholar] [CrossRef]
  31. Qian, D.W.; Yan, C.Z.; Xiu, L.N.; Feng, K. The impact of mining changes on surrounding lands and ecosystem service value in the Southern Slope of Qilian Mountains. Ecol. Complex. 2018, 36, 138–148. [Google Scholar] [CrossRef]
  32. Gong, C.G.; Lei, S.G.; Bian, Z.F.; Liu, Y.; Zhang, Z.; Cheng, W. Analysis of the Development of an Erosion Gully in an Open-Pit Coal Mine Dump During a Winter Freeze-Thaw Cycle by Using Low-Cost UAVs. Remote Sens. 2019, 11, 1356. [Google Scholar] [CrossRef] [Green Version]
  33. Zibret, G.; Gosar, M.; Miler, M.; Alijagic, J. Impacts of mining and smelting activities on environment and landscape degradation-Slovenian case studies. Land Degrad. Dev. 2018, 29, 4457–4470. [Google Scholar] [CrossRef] [Green Version]
  34. Jing, Z.R.; Wang, J.M.; Zhu, Y.C.; Feng, Y. Effects of land subsidence resulted from coal mining on soil nutrient distributions in a loess area of China. J. Clean. Prod. 2018, 177, 350–361. [Google Scholar] [CrossRef]
  35. Masek, J.G.; Vermote, E.F.; Saleous, N.E.; Wolfe, R.; Hall, F.G.; Huemmrich, K.F.; Gao, F.; Kutler, J.; Lim, T.K. A Landsat surface reflectance dataset for North America, 1990–2000. IEEE Geosci. Remote Sens. Lett. 2006, 3, 68–72. [Google Scholar] [CrossRef]
  36. Foga, S.; Scaramuzza, P.L.; Guo, S.; Zhu, Z.; Dilley, R.D.; Beckmann, T.; Schmidt, G.L.; Dwyer, J.L.; Hughes, M.J.; Laue, B. Cloud detection algorithm comparison and validation for operational Landsat data products. Remote Sens. Environ. 2017, 194, 379–390. [Google Scholar] [CrossRef] [Green Version]
  37. Wu, J.G.; Shen, W.J.; Sun, W.Z.; Tueller, P.T. Empirical patterns of the effects of changing scale on landscape metrics. Landsc. Ecol. 2002, 17, 761–782. [Google Scholar] [CrossRef]
  38. Gustafson, E.J. Quantifying landscape spatial pattern: What is the state of the art? Ecosystems 1998, 1, 143–156. [Google Scholar] [CrossRef]
  39. Brom, J.; Nedbal, V.; Prochazka, J.; Pecharova, E. Changes in vegetation cover, moisture properties and surface temperature of a brown coal dump from 1984 to 2009 using satellite data analysis. Ecol. Eng. 2012, 43, 45–52. [Google Scholar] [CrossRef]
  40. Liu, X.Y.; Zhou, W.; Bai, Z.K. Vegetation coverage change and stability in large open-pit coal mine dumps in China during 1990–2015. Ecol. Eng. 2016, 95, 447–451. [Google Scholar] [CrossRef]
  41. Han, Y.; Ke, Y.H.; Zhu, L.J.; Feng, H.; Zhang, Q.; Sun, Z.; Zhu, L. Tracking vegetation degradation and recovery in multiple mining areas in Beijing, China, based on time-series Landsat imagery. GiSci. Remote Sens. 2021, 58, 1477–1496. [Google Scholar] [CrossRef]
  42. Karan, S.K.; Samadder, S.R.; Maiti, S.K. Assessment of the capability of remote sensing and GIS techniques for monitoring reclamation success in coal mine degraded lands. J. Environ. Manag. 2016, 182, 272–283. [Google Scholar] [CrossRef]
  43. Foody, G.M. Status of land cover classification accuracy assessment. Remote Sens. Environ. 2002, 80, 185–201. [Google Scholar] [CrossRef]
  44. Congalton, R.G.; Green, K. A Practical Look at the Sources of Confusion in Error Matrix Generation. Photogramm. Eng. Remote Sens. 1993, 59, 641–644. [Google Scholar]
  45. Vintro, C.; Sanmiquel, L.; Freijo, M. Environmental sustainability in the mining sector: Evidence from Catalan companies. J. Clean. Prod. 2014, 84, 155–163. [Google Scholar] [CrossRef] [Green Version]
  46. Worrall, R.; Neil, D.; Brereton, D.; Mulligan, D. Towards a sustainability criteria and indicators framework for legacy mine land. J. Clean. Prod. 2009, 17, 1426–1434. [Google Scholar] [CrossRef]
  47. Long, T.F.; Zhang, Z.M.; He, G.J.; Jiao, W.L.; Tang, C.; Wu, B.F.; Zhang, X.M.; Wang, G.Z.; Yin, R.Y. 30 m Resolution Global Annual Burned Area Mapping Based on Landsat Images and Google Earth Engine. Remote Sens. 2019, 11, 489. [Google Scholar] [CrossRef] [Green Version]
  48. Dong, J.W.; Xiao, X.M.; Menarguez, M.A.; Zhang, G.L.; Qin, Y.W.; Thau, D.; Biradar, C.; Moore, B. Mapping paddy rice planting area in northeastern Asia with Landsat 8 images, phenology-based algorithm and Google Earth Engine. Remote Sens. Environ. 2016, 185, 142–154. [Google Scholar] [CrossRef] [PubMed] [Green Version]
  49. Franks, D.M.; Brereton, D.; Moran, C.J. The cumulative dimensions of impact in resource regions. Resour. Policy 2013, 38, 640–647. [Google Scholar] [CrossRef]
  50. Lechner, A.M.; Baumgartl, T.; Matthew, P.; Glenn, V. The Impact of Underground Longwall Mining on Prime Agricultural Land: A Review and Research Agenda. Land Degrad. Dev. 2016, 27, 1650–1663. [Google Scholar] [CrossRef]
  51. Gilland, K.E.; McCarthy, B.C. Microtopography Influences Early Successional Plant Communities on Experimental Coal Surface Mine Land Reclamation. Restor. Ecol. 2014, 22, 232–239. [Google Scholar] [CrossRef]
  52. Gonzalez-Alday, J.; Marrs, R.H.; Martinez-Ruiz, C. The influence of aspect on the early growth dynamics of hydroseeded species in coal reclamation areas. Appl. Veg. Sci. 2008, 11, 405–412. [Google Scholar] [CrossRef]
  53. Cao, Y.G.; Wang, J.M.; Bai, Z.K.; Zhou, W.; Zhao, Z.Q.; Ding, X.; Li, Y.N. Differentiation and mechanisms on physical properties of reconstructed soils on open-cast mine dump of loess area. Environ. Earth Sci. 2015, 74, 6367–6380. [Google Scholar] [CrossRef]
  54. Cizkova, B.; Wos, B.; Pietrzykowski, M.; Frouz, J. Development of soil chemical and microbial properties in reclaimed and unreclaimed grasslands in heaps after opencast lignite mining. Ecol. Eng. 2018, 123, 103–111. [Google Scholar] [CrossRef]
  55. Ezeokoli, O.T.; Mashigo, S.K.; Paterson, D.G.; Bezuidenhout, C.C.; Adeleke, R.A. Microbial community structure and relationship with physicochemical properties of soil stockpiles in selected South African opencast coal mines. Soil Sci. Plant Nutr. 2019, 65, 332–341. [Google Scholar] [CrossRef]
  56. Wang, J.M.; Wang, H.D.; Cao, Y.G.; Bai, Z.K.; Qin, Q. Effects of soil and topographic factors on vegetation restoration in opencast coal mine dumps located in a loess area. Sci. Rep. 2016, 6, 22058. [Google Scholar] [CrossRef] [Green Version]
  57. Gao, S.H.; He, R.X.; Jin, H.J.; Huang, Y.D.; Zhang, J.M.; Luo, D.L. Thermal recovery process of a backfilled open-pit in permafrost area at the Gulian strip coal mine in Northeast China. J. Mt. Sci. 2017, 14, 2212–2229. [Google Scholar] [CrossRef]
Figure 1. (a) Location of the study area in Wuhai and surrounding areas, Inner Mongolia, China; (b) land use in the western mine; (c) land use in the eastern mine.
Land 11 00856 g001
Figure 2. Model for the trajectory of disturbance and recovery in surface mining site.
Land 11 00856 g002
Figure 3. Three patterns of pixel-based disturbance and recovery.
Land 11 00856 g003
Figure 4. Accuracy of disturbance and recovery occurrence year identification between 2010 and 2020: UA: user accuracy; PA: producer accuracy; OA: overall accuracy. (a) the western mine; (b) the eastern mine.
Land 11 00856 g004
Figure 5. The year of disturbance and recovery occurrence. (a) disturbance in the western mine; (b) recovery in the western mine; (c) disturbance in the eastern mine; (d) recovery in the eastern mine.
Land 11 00856 g005
Figure 6. The duration of disturbance and recovery. (a) disturbance in the western mine; (b) recovery in the western mine; (c) disturbance in the eastern mine; (d) recovery in the eastern mine.
Land 11 00856 g006
Figure 7. Percentage of different durations. (a) the western mine; (b) the eastern mine.
Land 11 00856 g007
Figure 8. The magnitude of disturbance and recovery. (a) disturbance in the western mine; (b) recovery in the western mine; (c) disturbance in the eastern mine; (d) recovery in the eastern mine.
Land 11 00856 g008
Figure 9. Spatial distribution of disturbance and recovery magnitude cold and hot spots. (a) disturbance in the western mine; (b) recovery in the western mine; (c) disturbance in the eastern mine; (d) recovery in the eastern mine.
Land 11 00856 g009
Figure 10. Trend of disturbance and recovery magnitude with duration. (a) disturbance; (b) recovery. Potential point: the duration point to reach natural fluctuation state.
Land 11 00856 g010
Table 1. Industrial and mining land class level index.
NPPDLPILSIAREA_MN
The western mine30.026128.2682.20471083.48
The eastern mine610.03922.543814.2622149.3705
Note: NP: Number of patches; PD: Patch density; LPI: Largest patch index; LSI: Landscape shape index; AREA_MN: Mean patch size.
Table 2. Characteristics of disturbance and recovery.
DisturbanceRecovery
YearDurationMagnitudeYearDurationMagnitude
The western mine1987–20201–340.021–0.4381987–20192–340.061–0.610
The eastern mine1987–20201–340.021–0.8611987–20191–340.061–0.922
Table 3. Magnitude of disturbance and recovery.
DisturbanceRecovery
MaximumMeanStandard DeviationMaximumMeanStandard Deviation
The western mine0.4380.1570.0970.6100.2110.106
The eastern mine0.8610.3040.1770.9220.3670.183
Table 4. Spearman’s correlation of the duration and magnitude.
DisturbanceRecovery
The western mine Duration Duration
Magnitude−0.218 **Magnitude−0.004
The eastern mine Duration Duration
Magnitude−0.243 **Magnitude−0.163 **
** Represent significance at the levels of 0.01.
Publisher’s Note: MDPI stays neutral with regard to jurisdictional claims in published maps and institutional affiliations.

