Article

PAHs Source Identification in Sediments and Surrounding Soils of Poyang Lake in China Using Non-Negative Matrix Factorization Analysis

1
Key Laboratory of Poyang Lake Environment and Resource Utilization of MOE, School of Environmental and Chemical Engineering, Nanchang University, Nanchang 330047, China
2
Key Laboratory of Ecosystem Network Observation and Modeling, Institute of Geographical Sciences and Natural Resources Research, Chinese Academy of Sciences, Beijing 100101, China
*
Author to whom correspondence should be addressed.
Land 2022, 11(6), 843; https://doi.org/10.3390/land11060843
Submission received: 21 April 2022 / Revised: 29 May 2022 / Accepted: 1 June 2022 / Published: 4 June 2022

Abstract

:
Identifying sources of soil and sediment PAHs and apportioning their contributions are key in building effective pollution abatement strategies, especially for Poyang Lake—the largest freshwater lake in China. PAHs were detected in all the monitored soil and sediment samples under three land use types, with the concentrations varying by area, ranging from moderate to relatively high. The order of PAHs content in different the land use types was as follows: industrial soil > grassland soil > agricultural soil. Although agricultural soil was dominated by LMW PAHs, industrial grassland soils were dominated by HMW PAHs. Based on factor analysis, non-negative matrix factorization analysis was effective in non-negative constrained skew rotation, especially for clear and interpretable source analysis of PAHs.

1. Introduction

Thus far, 70–90% of the known cancers in humans and animals are caused by chemicals in the environment [1]. PAHs comprise the largest category of environmental carcinogenic chemicals, with the number of individual carcinogenic PAHs and their derivatives exceeding 400 [2,3]. PAHs composed of two or more fused aromatic rings of carbon and hydrogen atoms are mostly caused by the incomplete combustion of fossil fuels, burning of waste and biomass, automobile exhaust, and domestic heating [4,5]. As a form of global pollutant, PAHs are widely distributed in water, soil, sediments, and crops [6,7,8,9]. Since the 1990s, a series of studies have been conducted on PAHs pollution in soil and sediment in China, focusing mainly on four areas: (1) there has been focus on the content and source of PAHs [10,11]; (2) the distribution, migration, and transformation characteristics of PAHs [12,13]; (3) the impact of environmental factors on PAHs [14,15]; and (4) risk assessment and management of PAHs [16,17]. Research on PAHs in multi-environmental media in China has mainly concentrated on relatively developed coastal areas such as the Pearl River Delta, the Yangtze River Delta, and the Bohai Sea Region [2,18,19]. The study of aromatic hydrocarbons has also focused on the 16 PAHs prioritized for control by US EPA.
Poyang Lake is not only the largest freshwater lake in China, but also the largest bird sanctuary in the world [20]. It is known as “White Crane World” and “Recipe Kingdom”. To preserve the water quality in the lake, the protection of the surrounding soils and sediments is critical [21]. In actuality, various pollutants from Jiangxi Province are channeled into Poyang Lake Basin, and are detected at high rates in various media [22]. Research on the Poyang Lake eco-economic zone has mainly been socio-political [23,24], with only a small fraction of research directed at water pollution. Heavy metal pollution and eutrophication by nitrogen and phosphorus are the two most widely researched areas concerning Poyang Lake [21,25], with relatively few studies conducted on the processes of distribution, transfer, and impact of PAHs [26] on the lake. PAHs were detected in the soil around Poyang Lake, and the detection rate of PAHs was 6–100%. As the most representative and toxic substance in PAHs, the detection rate of benzo (a) pyrene (BAP) is 22.2%, and the content range is 1.82–2.55 mg/kg (average content is 2.31 mg/kg) [5]. This implies that the sampling size of these studies is small and lacks any multimedia data. With the rapid economic development of the Poyang Lake basin, and the acceleration of urbanization, there has been rapid change in land use structure and the obvious intensity of land development [24]. Here, the construction land area has increased by 39.1%, and urban land, rural settlement and industrial land has increased by 51.2%, 14.5%, and 40.2%, respectively [27]. These are the potential sources of PAHs and the drivers of the general increasing trend and ecological risk in the Poyang Lake basin.
Receptor models are used to identify pollution sources and to apportion their relative contributions to the overall PAHs pollution load in the environment [10,19] and for developing effective abatement strategies. Multivariate and chemical mass balance models are all relatively advanced and widely used in such conditions [28,29]. Multivariate models such as principal component analysis/multiple linear regression (PCA/MLR) recognize and quantify the factors contributing to pollution with no prior knowledge of source profiles [11,30], despite the tendency for a negative solution or no solution. Non-negative matrix factorization (NMF) is distinguished from other methods through its use of non-negativity constraints [29]. These constraints cause part-based representation because neither factor load nor negative factor score have a specific meaning [31]. Thus, analyzing the PAHs source in sediments and the surrounding soils of Poyang Lake could be key in controlling the polluting emissions from that source.
This study aims to: (1) evaluate the PAHs pollution levels in the soils and sediments in Poyang Lake; (2) compare and analyze the content of PAHs in different soil types in the region; and (3) use the ratio and NFM methods to comprehensively analyze the main sources of PAHs in the study area. The results could lay the scientific basis for regional PAHs pollution control and environmental protection.

2. Materials and Methods

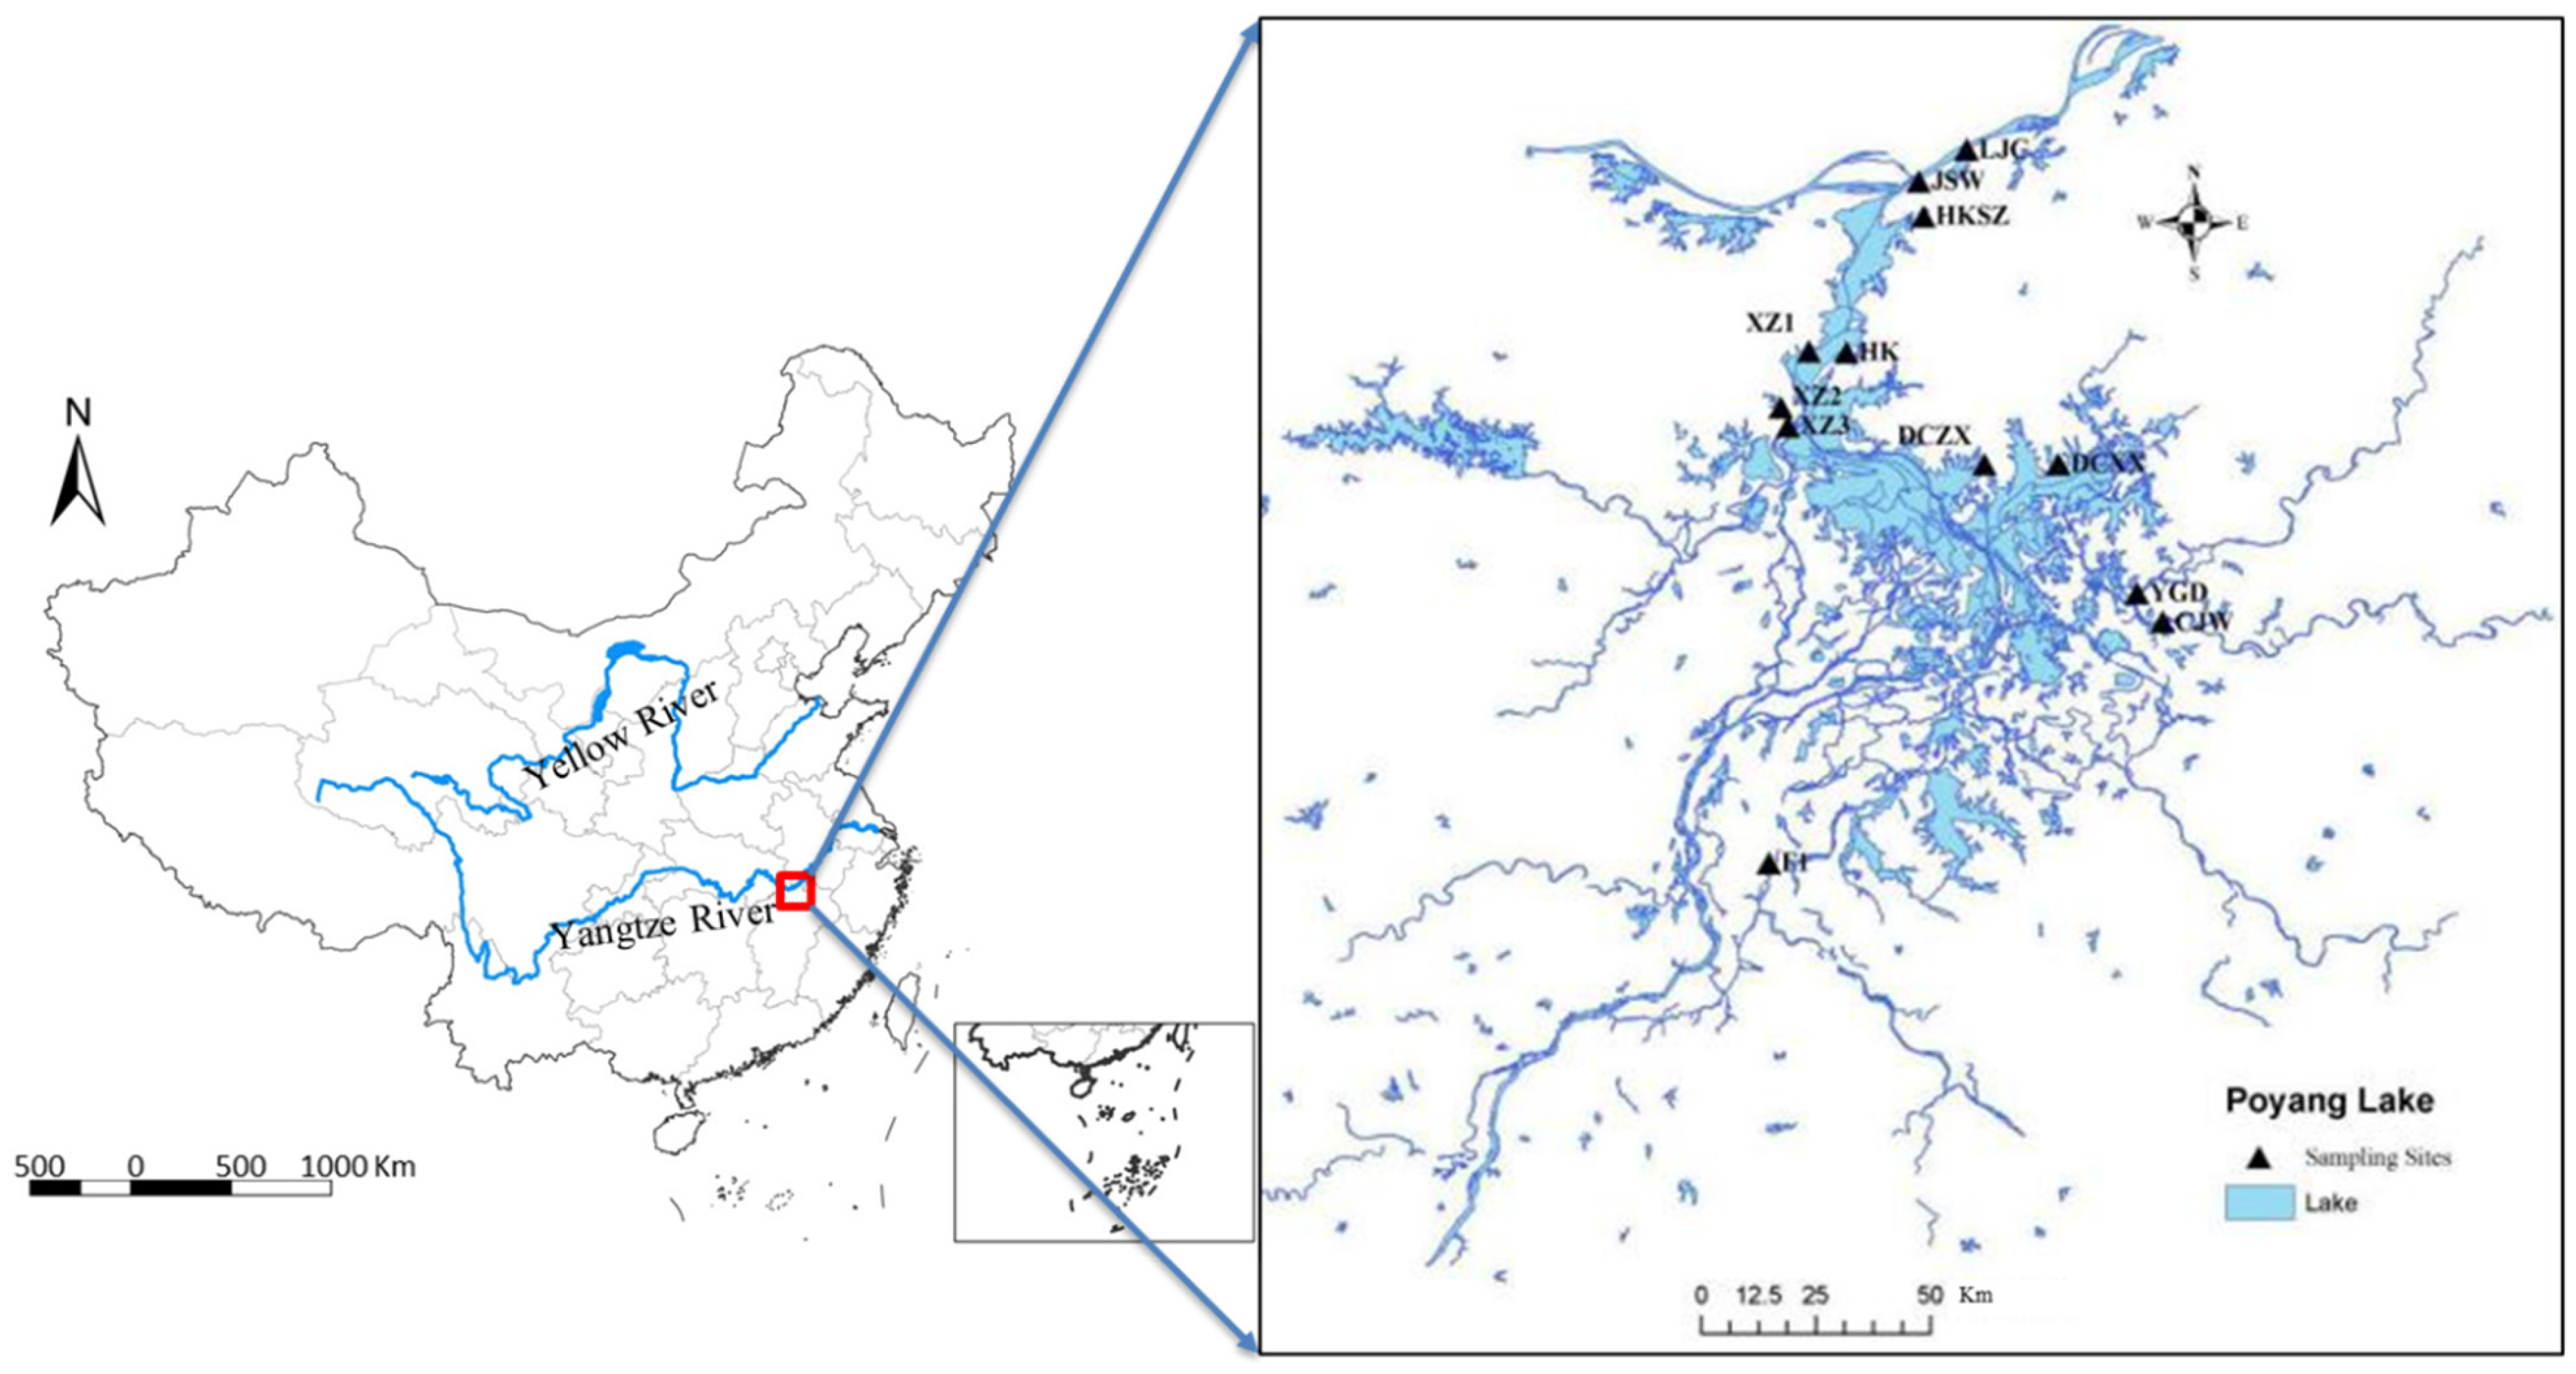
2.1. Research Area and Sampling

Poyang Lake (28°22′–29°45′ N, 115°47′–116°45′ E) is the largest freshwater lake in China and a key wetland in the world. The lake district is a base for commercial grain production and freshwater products in China. The basin is characterized by a subtropical humid monsoon climate with temperatures reaching 30 °C and higher in summer. The annual precipitation is 1700 mm, with an average relative humidity of 80%. The region is largely flat and lies at an elevation range of 11–12 m. Most of the landform is composed of fluvo-alluvial plains or low hills.
Spatial uniformity and intensive sampling was conducted to investigate the three main land uses in the inlet areas where rivers flow into lakes. The main land use types are cultivated land, grassland, and industrial/construction land. There is also a developed traffic network, including national and provincial roads. A total of 33 sampling sites were established in the Poyang Lake district, covering the four counties (Hukou, Duchang, Xingzi, and Poyang County) and the estuary plains of the lake (Figure 1). Although the soil samples were collected from native, industrial, and agricultural soils, the sediment samples were from the rivers passing through each soil type. At each site, 5 soil samples were collected within a radius of 5 m. The topsoils and sediments (0–20 cm) were collected at the four cardinal points (north, south, east, and west), following the circumference of the 5 m radius circle, using a 5.0 cm diameter stainless steel auger. This was completed after removing straw and litter on the soil surface, thoroughly mixing the samples from the 5 points, and then taking only l.0 kg of the mixed samples for analysis. Moreover, the surrounding environmental information and GPS points of the sample points were recorded. The samples were dried in a dedicated sample processing room and stored in the refrigerator for later processing.

2.2. Experimental Analysis

The collected soil and sediment samples were freeze-dried and passed through a 1 mm sieve to get 5.0 g weights. The extraction solvent used in the accelerated solvent extraction process was a mixture of n-hexane:dichlormethane—1:1, which was run twice at 100 °C and 1500 psi (about 10 min per run). After concentration by rotary evaporator, it was reduced to 1.0 mL and then transferred to an activated silica gel cartridge with multiple dilutions of dichloromethane solvent. The eluate was collected in a 20 mL brown vial, which was nitrogen-blown, and stored in a refrigerator at 4 °C for testing.
The analytical instrument used was the gas chromatography-mass spectrometer (Agilent 7890A GC/5975C MSD). The ion source was 70 eV, and the electron bombardment (EI) and electron multiplier voltage (EMV) source was 1600 eV. The column was DB-5MS (60 m × 0.25 mm × 0.25 mm, J&W Scientific, Folsom, CA, USA). The carrier gas was high purity He, column flow rate 1.0 mL/min, and column front pressure 11.2 psi. The inlet temperature was 285 °C, the transfer line temperature was 280 °C, the ion source temperature was 230 °C, the injection volume was 1.0 mL, and there was no split injection. The heating program was set to an initial temperature of 50 °C for 2.0 min, then the temperature rose to 200 °C at a rate of 30 °C/min for 1.0 min, and then increased to 300 °C at a rate of 3 °C/min for 15 min. The total measurement time of each sample was 56.333 min.
The quality control process included the blank method, matrix spike, and sample parallel sample for quality assurance. The internal standard was added to each sample for quality control. Both precision and recovery experiments were conducted. The recovery rate of the three test additions was 82.64–116.28%. The relative standard deviation of the parallel samples was controlled within 15%. The detection limit of the instrument was 2.0–10.0 μg·kg−1.

2.3. Non-Negative Matrix Factorization (NMF)

The NMF analysis was calculated with the R-software and NMF definition problems and notations of the Gaujoux [32] vignette used. For an n × p non-negative matrix X, (i.e., xij ≥ 0, denoted as X ≥ 0), it can be factorized by two matrices and defined as:
X W H
where W, H are n × r and r × p non-negative matrices (r > 0), respectively. In practice, the factorization rank r often complies with r << min (n,p), which summarizes and splits the information contained in X into r factors with columns of W.
Based on the practical conditions, these factors are named as—basis image, metagene, and source signal. In this vignette, the terms basis matrix or metagene were equivalently and alternatively used to refer to matrix W. Then, the mixture coefficient matrix and metagene expression profiles were used to refer to matrix H.
A useful method for NMF is to achieve a local minimum of matrices W and H is:
min W , H 0 [ D ( X , W H ) + R ( W , H ) ] = F ( W , H )
where D is a loss function which measures the performance of the approximation. Common loss functions are determined by either the Frobenius distance as:
D : A , B T r ( A B t ) 2 = 1 2 i j ( a i j b i j ) 2
or the Kullback–Leibler divergence as:
D : A , B K L ( A B ) = i , j a i j log a i j b i j a i j + b i j
R is an optional function aiming to enforce desirable properties such as smooth and sparse regulation on matrices W and H [32].
To determine the specific PAHs source represented by the selected factors, a similarity comparison criterion SS was introduced to compare the similarity of factor loading with a PAHs fingerprint from different sources [33] as:
S S = j = 1 l i = 1 m ( C i k C i j ) 2
where Ĉik(k = 1, 2, …, p) and Cij(j = 1, 2, …, q) are the ratios of each PAHs obtained by the non-negative constraint factor and the ratio to the corresponding to PAHs in the fingerprint spectrum, respectively; p and q are the numbers of the factor load and the PAHs source, respectively; l is the number of PAHs on the pollution source spectrum, as measured and reported in the literature; and m is the number of PAHs per compound. The smaller the value of SS, the more similar the model-inferred PAHs fingerprint characteristic is to the measured PAHs pollution source. From this, the type of PAHs contamination can be determined.

2.4. Data Analysis

The mass spectral data of the samples were obtained by processing using the Agilent Chemstation (Agilent 7890, Santa Clara, CA, USA). Skewness and kurtosis coefficients were calculated to depict the frequency distributions of PAHs concentrations. The violin plot was used to reflect the probability density of PAHs distribution finished by the R-software (Vienna, Austria).

3. Results and Discussion

3.1. Soil Residual PAHs

The concentrations of PAHs were calculated for all the soil samples collected in the Poyang Lake District. Except for Nap, Acy, Ace, and Flu which were present in 43%, 71%, 86%, and 93% of the samples collected, the other 12 PAHs were present in all the samples. The concentrations of the PAHs are given as violin plots; not only reflecting the probability density of the distribution, but also the median and quartile values (Figure 2). In the middle of the violin curve, the central dot depicted the median, whereas the bottom and the top denoted the minimum and maximum concentrations. The concentrations of the PAHs in the topsoil composites ranged 45.1–3158.4 μg·kg−1 dw, with an average of 531.4 μg·kg−1 dw.
At present, there is no evaluation standard for PAHs in the soil in China, except for the maximum allowable content of agricultural sludge set at 3000 μg·kg−1 (GB4284-84). Moreover, there is no unified evaluation standard for PAHs in the world. Only 10 of the 16 PAHs in Table 1 (Nap, Phe, Ane, Flu, Chr, BaA, BaP, BkF, B(ghi)P, and InP) are considered in the soil restoration standard formulated in the Netherlands, with limits of 15, 50, 50, 15, 20, 25, 20, and 25 μg·kg−1, respectively. The evaluation and governance criteria adopted by the Canadian Environment Commission were for 7 PAHs (Nap, Phe, Pyr, BaA, BaP, InP, and D(ah)A), with a value limit of 100 μg·kg−1. Based on the target value of PAHs in the soil formulated by the Netherlands and the Canadian Environment Commission, all the individual components were above the standard to varying degrees, except for Nap. This implied that there was a certain level of environmental risk in the lake district. Pyr, Phe, and Chr were the main monomer PAHs pollutants in the region. According to Maliszewska-Kordybach’s soil quality standard (1996), only 36% of the soil samples can be defined as being non-polluted by PAHs (<200 μg·kg−1∑PAHs dw). Slightly polluted soil (200–600 μg·kg−1∑PAHs dw) occupied 43%, moderately polluted soil (600–1000 μg·kg−1∑PAHs dw) occupied 7%, and severely polluted (>1000 μg·kg−1∑PAHs dw) soil occupied 14%.
The concentrations of individual components remarkably varied among the locations and PAHs. The highest PAHs value was found in the lakeside grassland at Xingzi Observatory (which belongs to the Nanjing Institute of Geography and Limnology, Chinese Academy of Sciences, Xingzi County) and the grassland soil in Xiazhang village, in Hukou. For the spatial distribution of PAHs concentration, the ranking based on the average values was as follows: Xiangyang County > Xingzi County > Duchang County > Hukou County > Shatan Bridge (to the point where the Fu River discharges into Poyang Lake). Analysis of the different PAHs components showed that the ratio of the 2-ring (Nap), 3-ring (Ace, Acy, Flu, Phe, and Ant), 4-ring (Fla, Pyr, Chr, and BaA), 5-ring (BbF, BkF, BaP, and D(ah)A), and 6-ring (B(ghi)p, Inp) PAHs accounted for 0.1, 30.8, 33.6, 24.6, and 10.8% of the total PAHs, respectively. Phe had the highest mean concentration of an individual component at 26.2 μg·kg−1 dw, followed by Ant (25.6 μg·kg−1 dw), and the lowest concentration was D(ah)A (0.8 μg·kg−1 dw), with the other PAHs ranging from 1.3–16.7 μg·kg−1 dw. The amount of high molecular weight macrocycle (HMW, ≥4 rings) PAHs was 2.2 times that of the low molecular weight small ring number PAHs (LMW, ≤3 rings).

3.2. Sediment Residual PAHs

The PAHs content in the sediment was higher than that in soil. Similar to the soil, PAHs occurred in sediment samples in the Poyang Lake District. Except for Nap and Flu (occurring in 44% and 89% of the samples, respectively) the other 14 PAHs occurred in all samples. As in Figure 2, the range of PAHs concentrations in the sediments was 142.1–3205.4 μg·kg−1 dw, with an average of 692.1 μg·kg−1 dw. In China, there are 2693 natural lakes of various types with areas larger than 1 km2 [36]. All lakes in China are classified here into five regions, including the Eastern Plain Region, the Yunnan–Guizhou Plateau, the Qinghai–Tibet Plateau, the Mongolia–Xinjiang Plateau, and the Northeast China Region [37]. After comparing ΣPAH concentrations in the sediment in Poyang Lake with those in the Great Lakes region, the distribution of ΣPAH concentrations in descending order is as follows: Northeast Lakes District > Eastern Lakes District > Yunnan–Guizhou Lakes District > Poyang Lake District > Mongolia–Xinjiang Lakes District > Qinghai–Tibet Plateau Lakes District (Table 2) [38]. Lakes with more serious pollution are usually close to cities with developed industries and dense population. Differences in geographic conditions, and degrees of human impact on these lakes and their watersheds, may lead to different magnitudes and types of pollution. Additionally, there are relatively few studies on PAHs in lakes, and the collected data is limited, so it is necessary to strengthen monitoring of PAHs pollution in China [38].
Long et al. (1995) used the ERL (effects range—low, biohazard probability < 10%) and ERM (effects range—median, biohazard probability > 50%) to determine the potential ecological risk of organic pollutants in marine and estuarine sediments; this is regarded as the ecological risk standard of sediment quality and is widely used today. If the PAHs concentration is less than the ERL, there is little negative ecological effect. If, on the other hand, the PAHs concentration is more than the ERM, there are frequent negative ecological effects. Moreover, if the PAHs concentration lies between the ERL and ERM, then there are occasional negative ecological risks. There is yet no environmental standard for PAHs in sediments in China. In this study, sediment PAHs in the Poyang Lake District were compared with the corresponding ecological risk indicators of sediments; see Table 1. The results showed that the average concentrations of the PAHs and 16 individual PAHs were less than the ERL, thus indicating that the river water in Poyang Lake posed a relatively small potential ecological risk to the surrounding aquatic organisms; however, the contents of Flu and Phe at some sites were between the ERL and ERM, suggesting the possibility of some ecological risk. Poyang Lake is the main area for many aquatic products in China and should therefore have a special focus.
Analysis of different PAHs components showed that 2-ring, 3-ring, 4-ring, 5-ring, and 6-ring PAHs accounted for 0.1%, 32.5%, 33.8%, 22.5%, and 11.3% of the total PAHs examined in the study, respectively. The highest mean concentration of individual components was for Phe (182.3 μg·kg−1 dw), and the lowest was for Nap (0.3 μg·kg−1 dw), with the concentration range of the other PAHs extending from 3.0–99.6 μg·kg−1 dw. HMW PAHs accounted for 67.5% of the total content, which was 2.1 times that of LMW PAHs.

3.3. Soil Residual PAHs for Different Land Use Types

The associated soils of the three main land use types in the study area were native soil, industrial soil, and agricultural soil. The native soil refers to the long-term uncultivated soils in Poyang Lake, which included only grassland soil with growing weeds. Industrial soil refers to the land in industrial zones or near factories. Agricultural soil includes farmland soils, such as cotton, paddy, and vegetable fields. Figure 3 shows the residual amounts and component contributions of individual PAHs in different land use types.
The values in parentheses represent the number of individual PAHs detected. In terms of the total amount, PAHs content in industrial, agricultural, and native soils were 710.3, 238.0, and 672.6 μg·kg−1, respectively. As shown in Table 3, these levels were similar to that in Yangtze River (221–3205 μg·kg−1 dw) [16] and Qinhuangdao (341.61–4703.80 μg·kg−1 dw) [41], and had higher PAHs contents than others that were previously reported in China, such as the levels in the Caofeidian (52–806 μg·kg−1 dw) [10], Bohai (149.4–1212.0 μg·kg−1 dw) [2], Taihu Lake Basin (12.1–2281.1 μg·kg−1 dw) [39], and Pearl River Delta surface soils (67–1172.8 μg·kg−1 dw) [42].
For component analysis, the contributions of individual PAHs in industrial and native soils were similar. In original soil samples, the 2-ring Nap content was lowest (7.48 μg·kg−1) and the 3-ring Phe content was highest (1349.99 μg·kg−1). The ranking of the average PAHs content was as follows: 4-ring (34.3%) > 3-ring (26.9%) > 5-ring (26.5%) > 6-ring (12.2%) > 2-ring (0.1%) PAHs. The 4-ring PAH was the dominant component in native soil samples, followed by the HMW PAHs (≥4 rings), which accounted for 72.96% of the total PAHs content, and was 2.7 times that of the LMW PAHs (≤3 rings). Similarly, in industrial soil, HMW PAHs accounted for 56% of the total PAH content, which was 1.3 times that of the LMW PAHs. The ranking of the average content of PAHs was as follows: 3-ring (41.1%) > 5-ring (25.4%) > 4-ring (25.1%) > 6-ring (7.6%) > 2-ring (0.8%). Conversely, in cultivated soil samples, the composition of 3-ring PAHs was the most dominant component. The content of 2-ring Nap was lowest (2.77 μg·kg−1), and that of the 3-ring Phe content was highest (477.96 μg·kg−1). The ranking of the average PAH contents was as follows: 3-ring (55.1%) > 4-ring (28.8%) > 5-ring (12.3%) > 6-ring (2.5%) > 2-ring (0.3%). PAHs in primary and industrial soils were mainly HMW PAHs that were derived from the high-temperature combustion of fossil fuels. The sampling site with the highest concentration of PAHs in industrial soil was surrounded by factories that had incompletely combusted coal.

3.4. Ratio Analysis of PAHs Sources in Poyang Lake District

PAHs from different sources have certain composition ratios [28]. Phe/Ant, Flu/Pyr, and Pyr/Bap are combined with the environmental characteristics of the study area, such as industrial layout and pollution discharge type, to trace possible sources of PAHs in the soil [11,30]. Table 4 lists these three ratios of compounds for each sampling point used in the study. The Phe/Ant ratio for Hukou, Xingzi, and the Shatan Bridge was less than 10, possibly due to industrial production processes and crude oil processing via cracking [31]. The ratio of Phe/Ant in Duchang and Fuyang was greater than 10, due to combustion in the region [10]. The site with the maximum Phe/Ant ratio was DCXX, as it is located in the sediment zone of Jingtou village, Duchang County; because it is close to the village, this could be due to the combustion process [28]. The average Flu/Pyr ratio for the study area was less than 1, and the source of contamination was likely the input from petroleum cracking [19]. The site with the maximum Flu/Pyr ratio was DCXX (1.37), which is located in the vegetable soil of Jingtou village, Duchang County; as it is near the village, the source of pollution could be wood burning. Moreover, the average Pyr/BaP ratio was greater than 1 for the study area, the probable source being emissions from vehicular exhausts [29]. It was concluded that all the counties were polluted with different levels of vehicular exhaust and petroleum products. The pollutants in Hukou, Xingzi, and the Shatan Bridge could have originated from industrial production processes and producing crude oil via cracking [30]. The pollutants in Duchang and Fuyang were more likely to come from combustion processes.
The ratio of LMW/HMW PAHs was used in combination with specific indicators to distinguish the petroleum sources from the combustion sources of PAHs. Although HMW PAHs are mainly produced by combustion, LMW PAHs are generated during petroleum processing [43]. HMW PAHs such as Flu, Pyr, Chr, BbF, BkF, BaP, InP, and B(ghi)P are considered to be derived primarily from combustion [44]. On the basis of soil type, LMW PAHs were highest in agricultural soils (due to exhaust pollution from biomass burning and petroleum combustion). HMW PAHs were second highest in industrial and native soils, mainly due to the high-temperature combustion of fossil fuels.

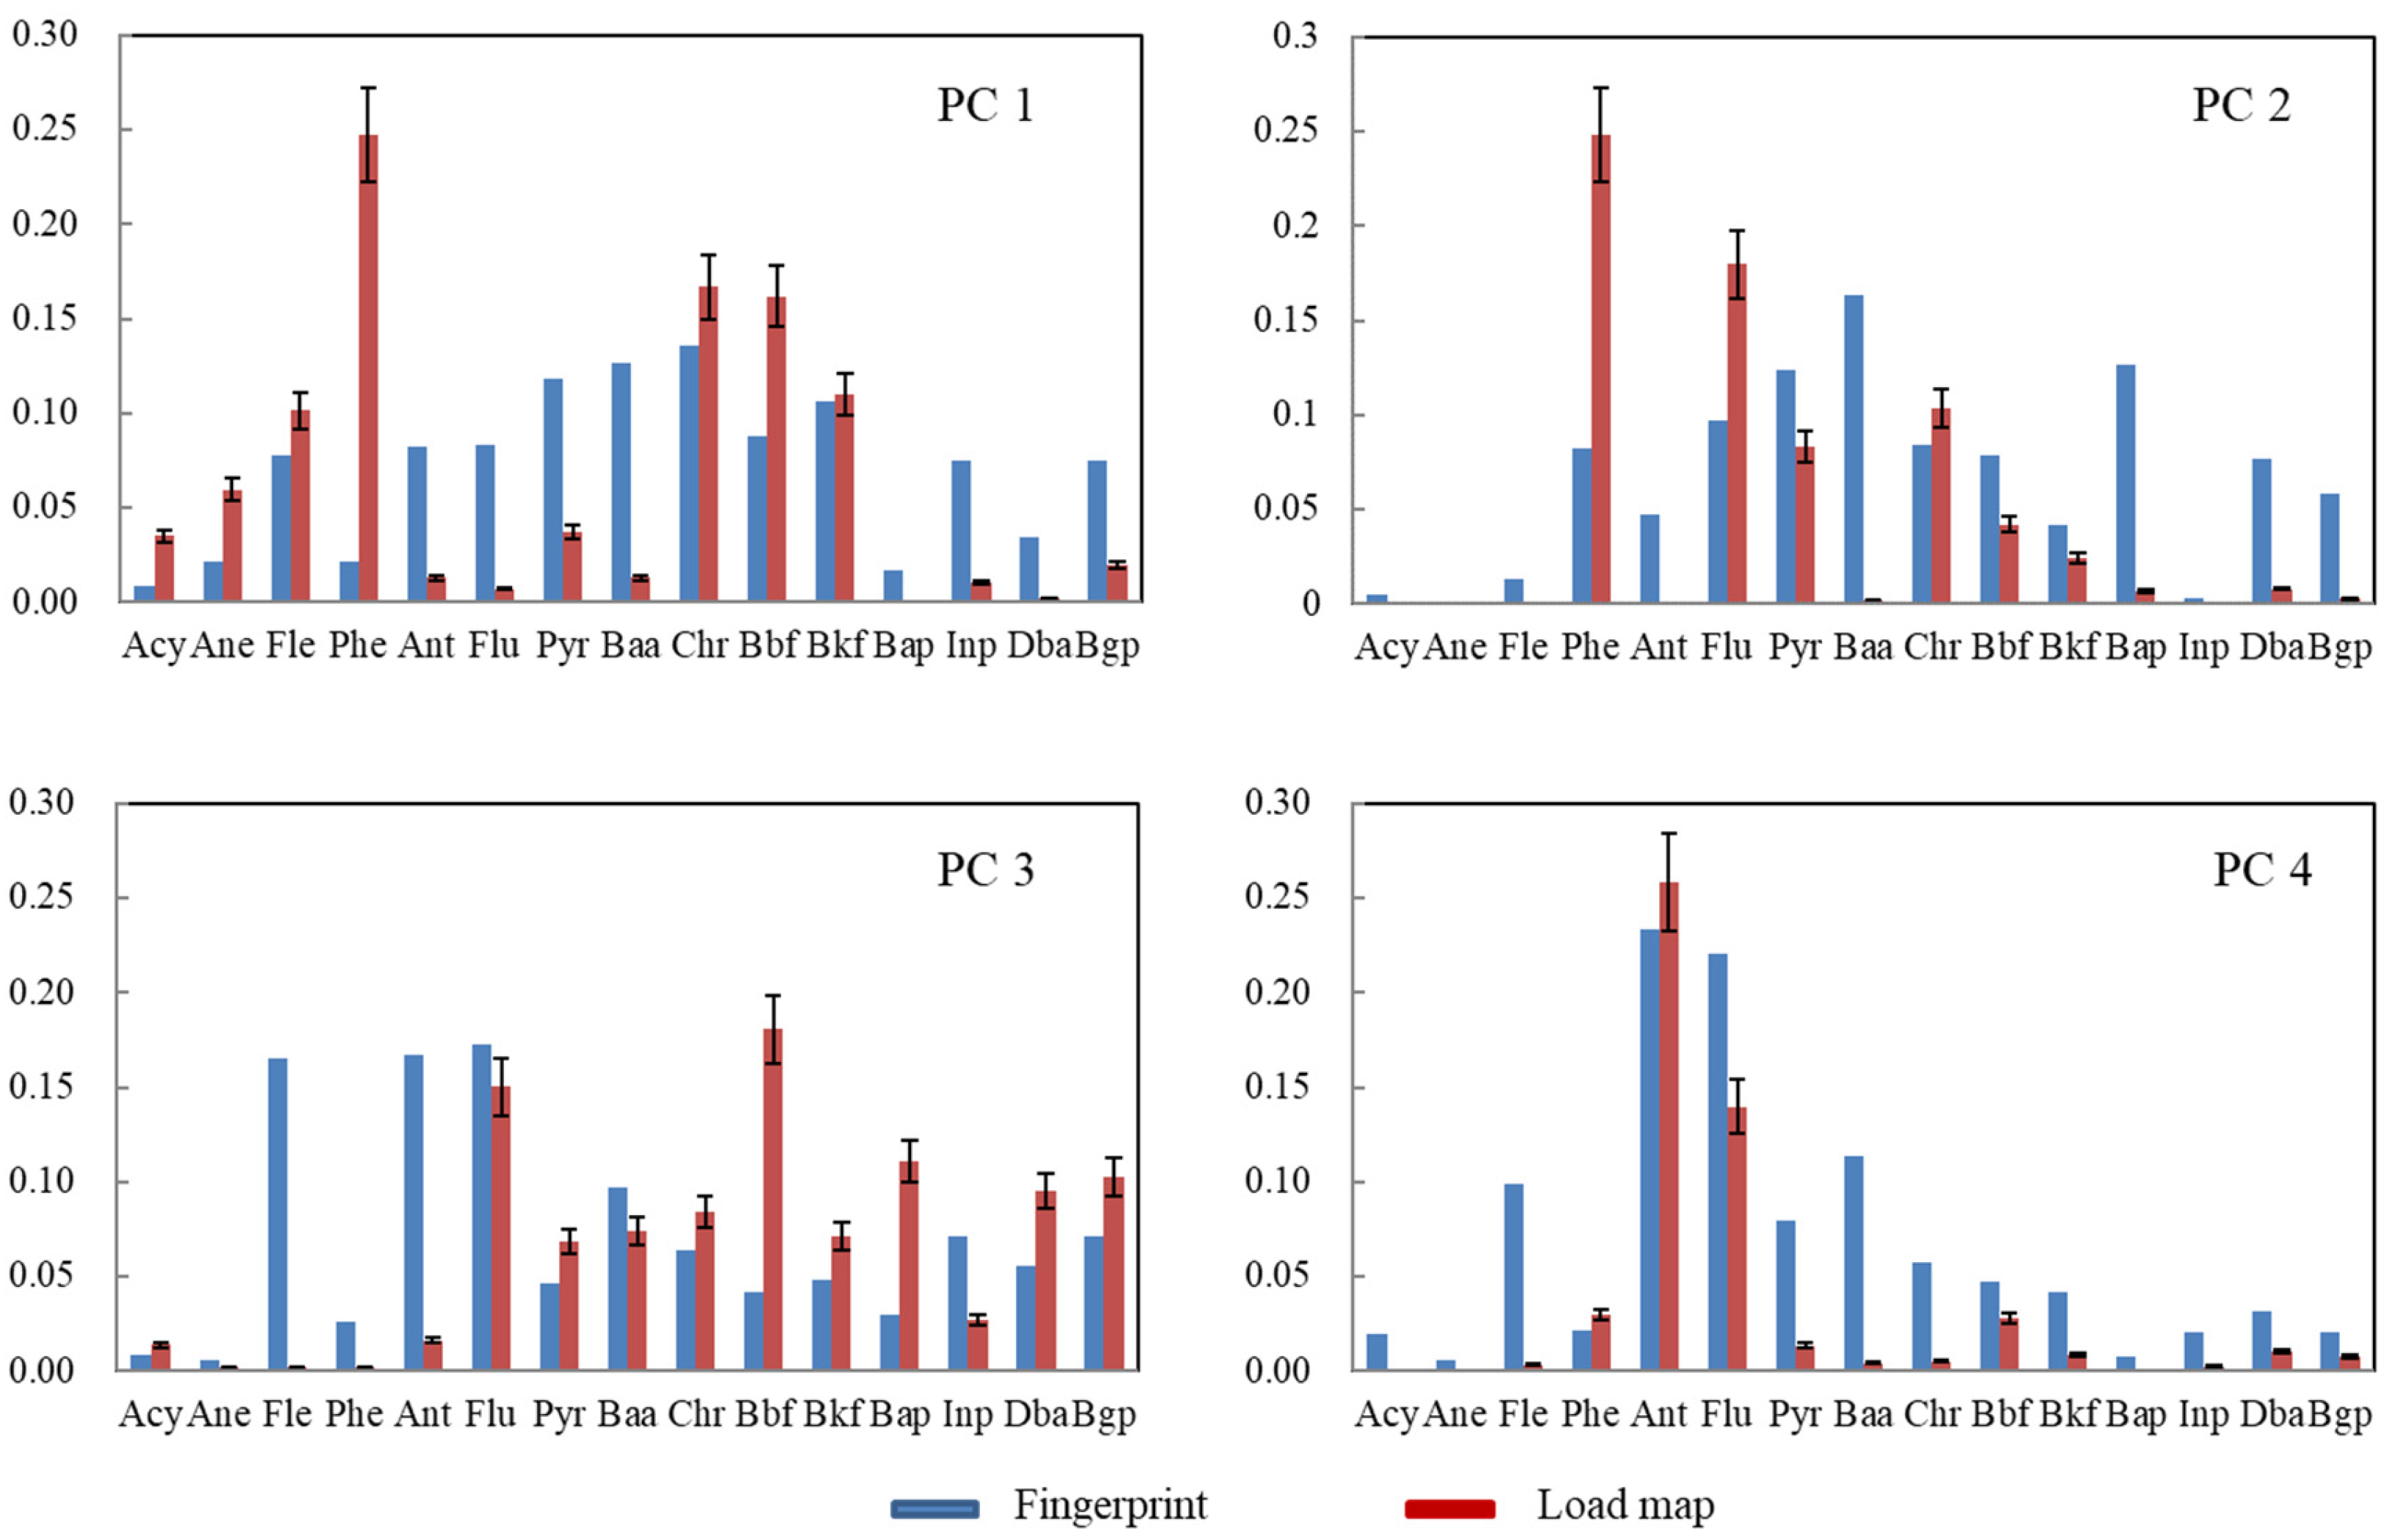
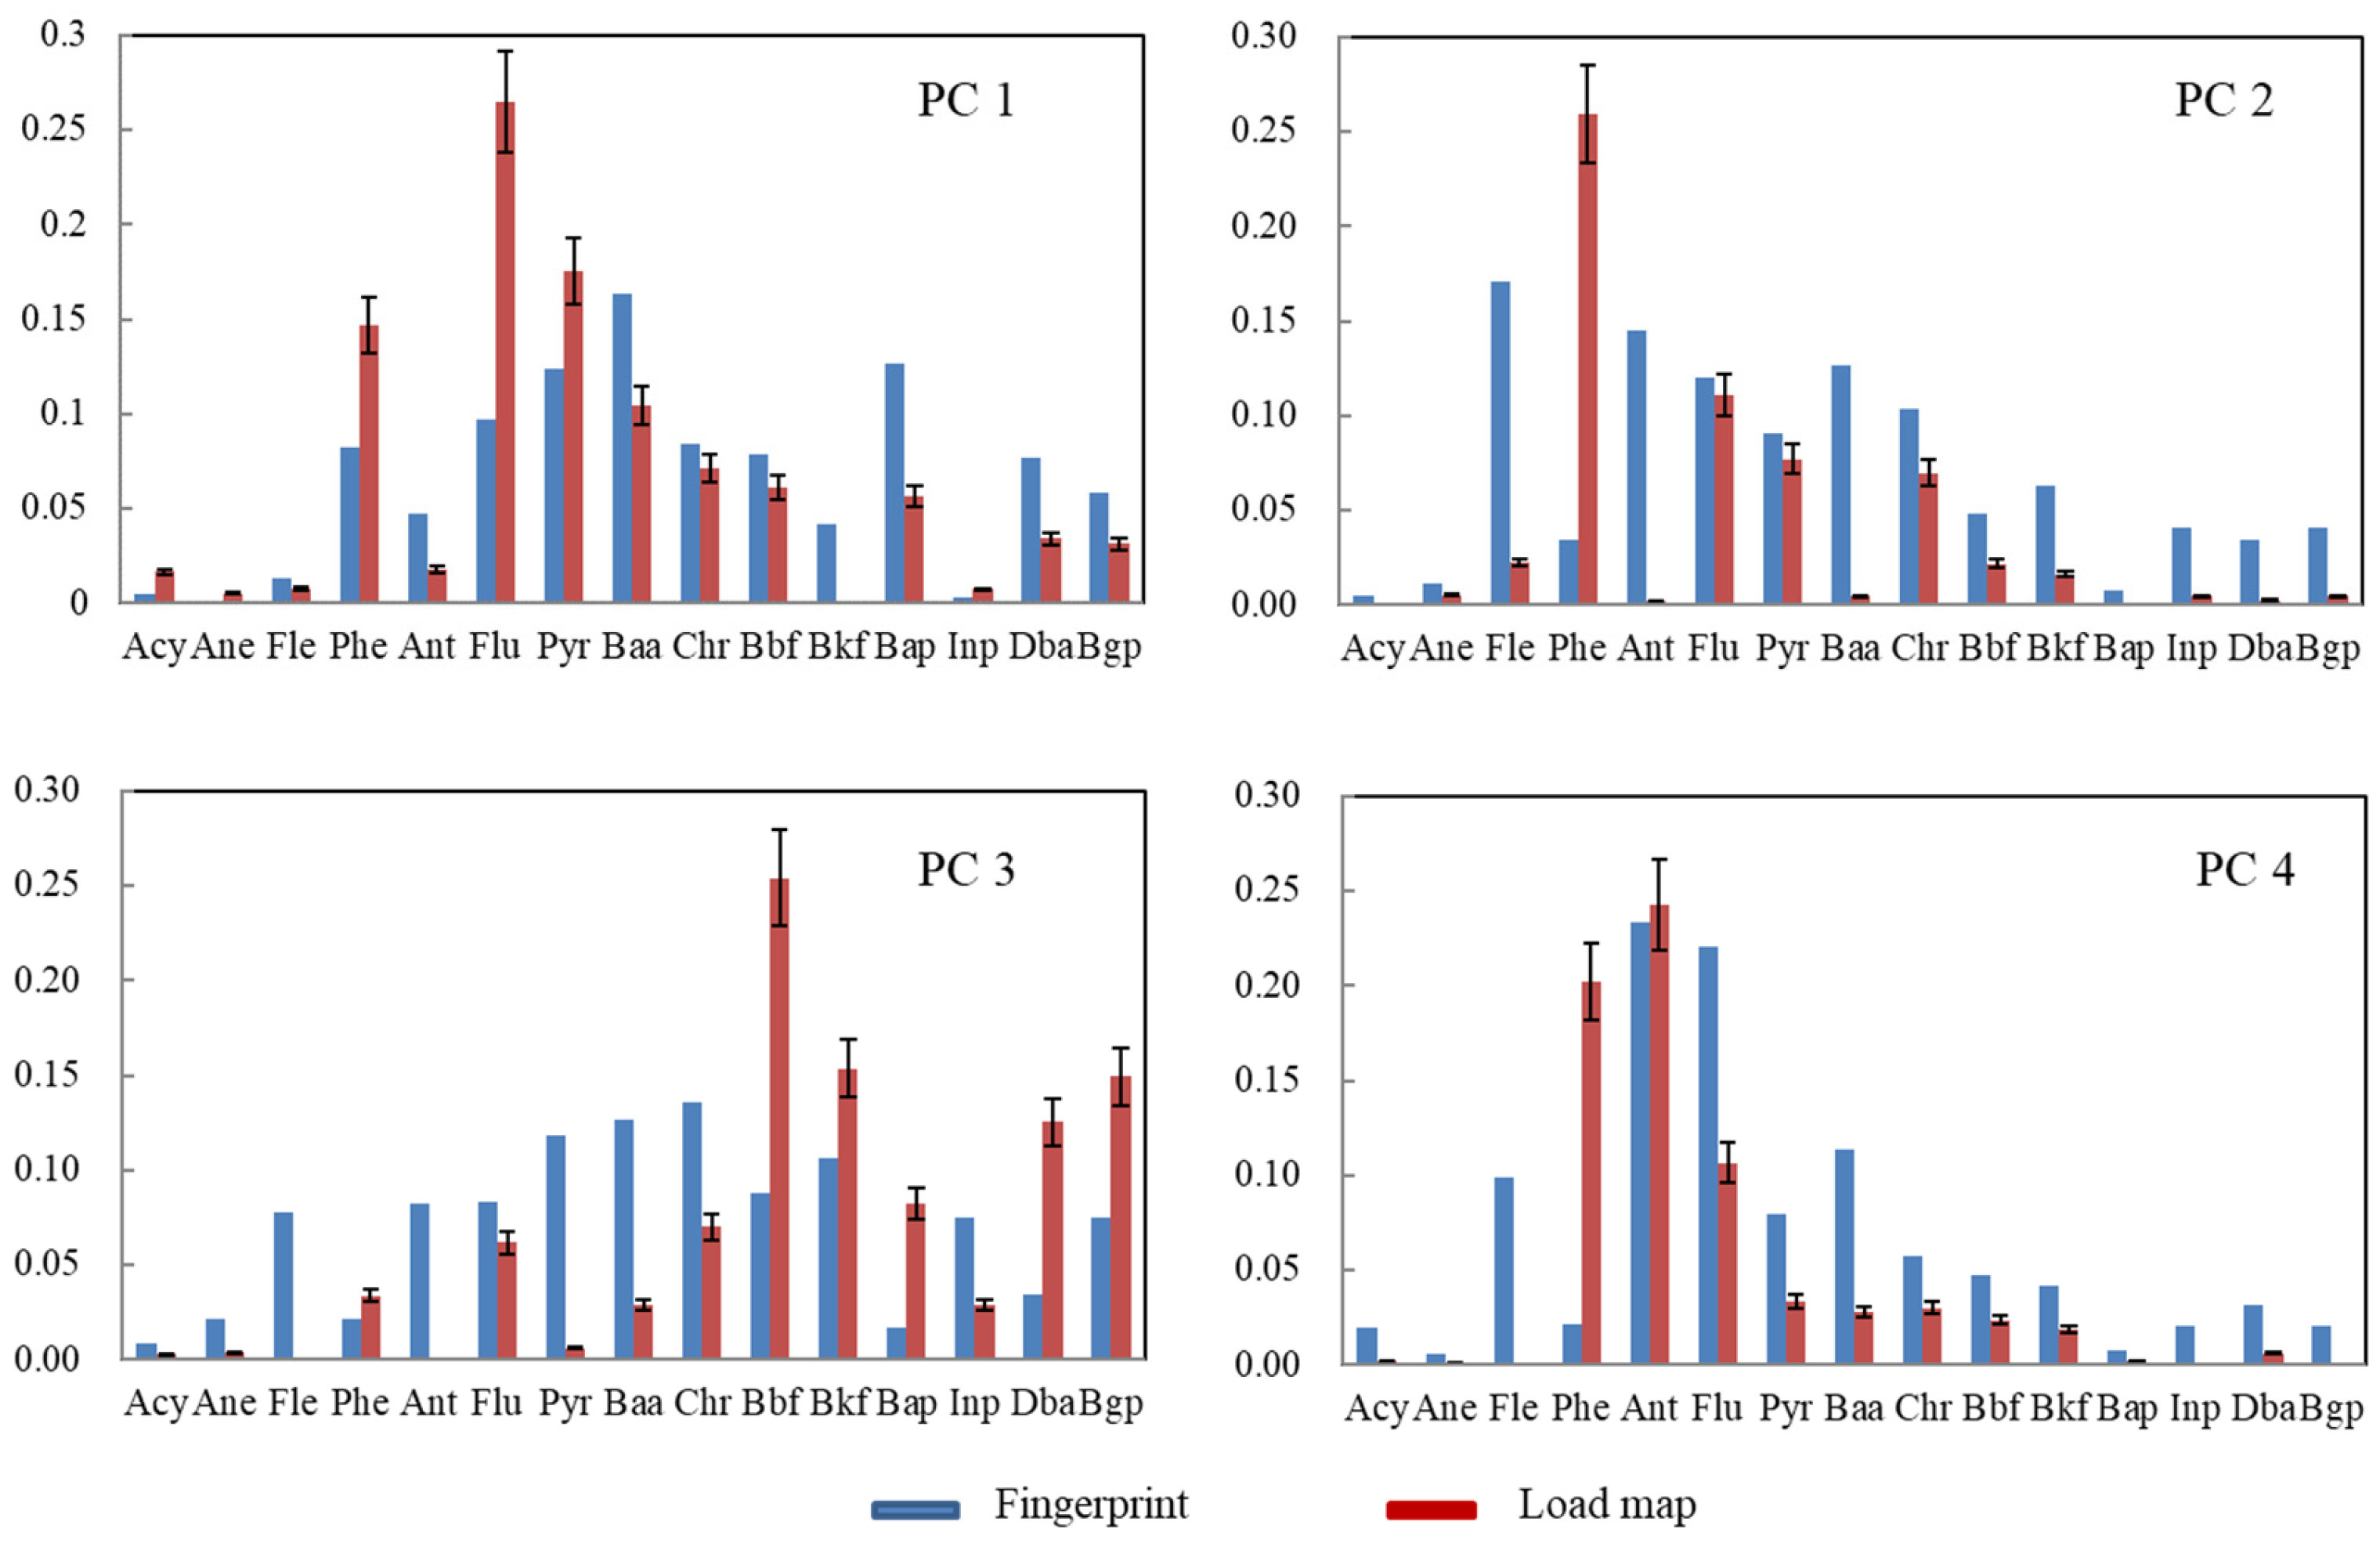
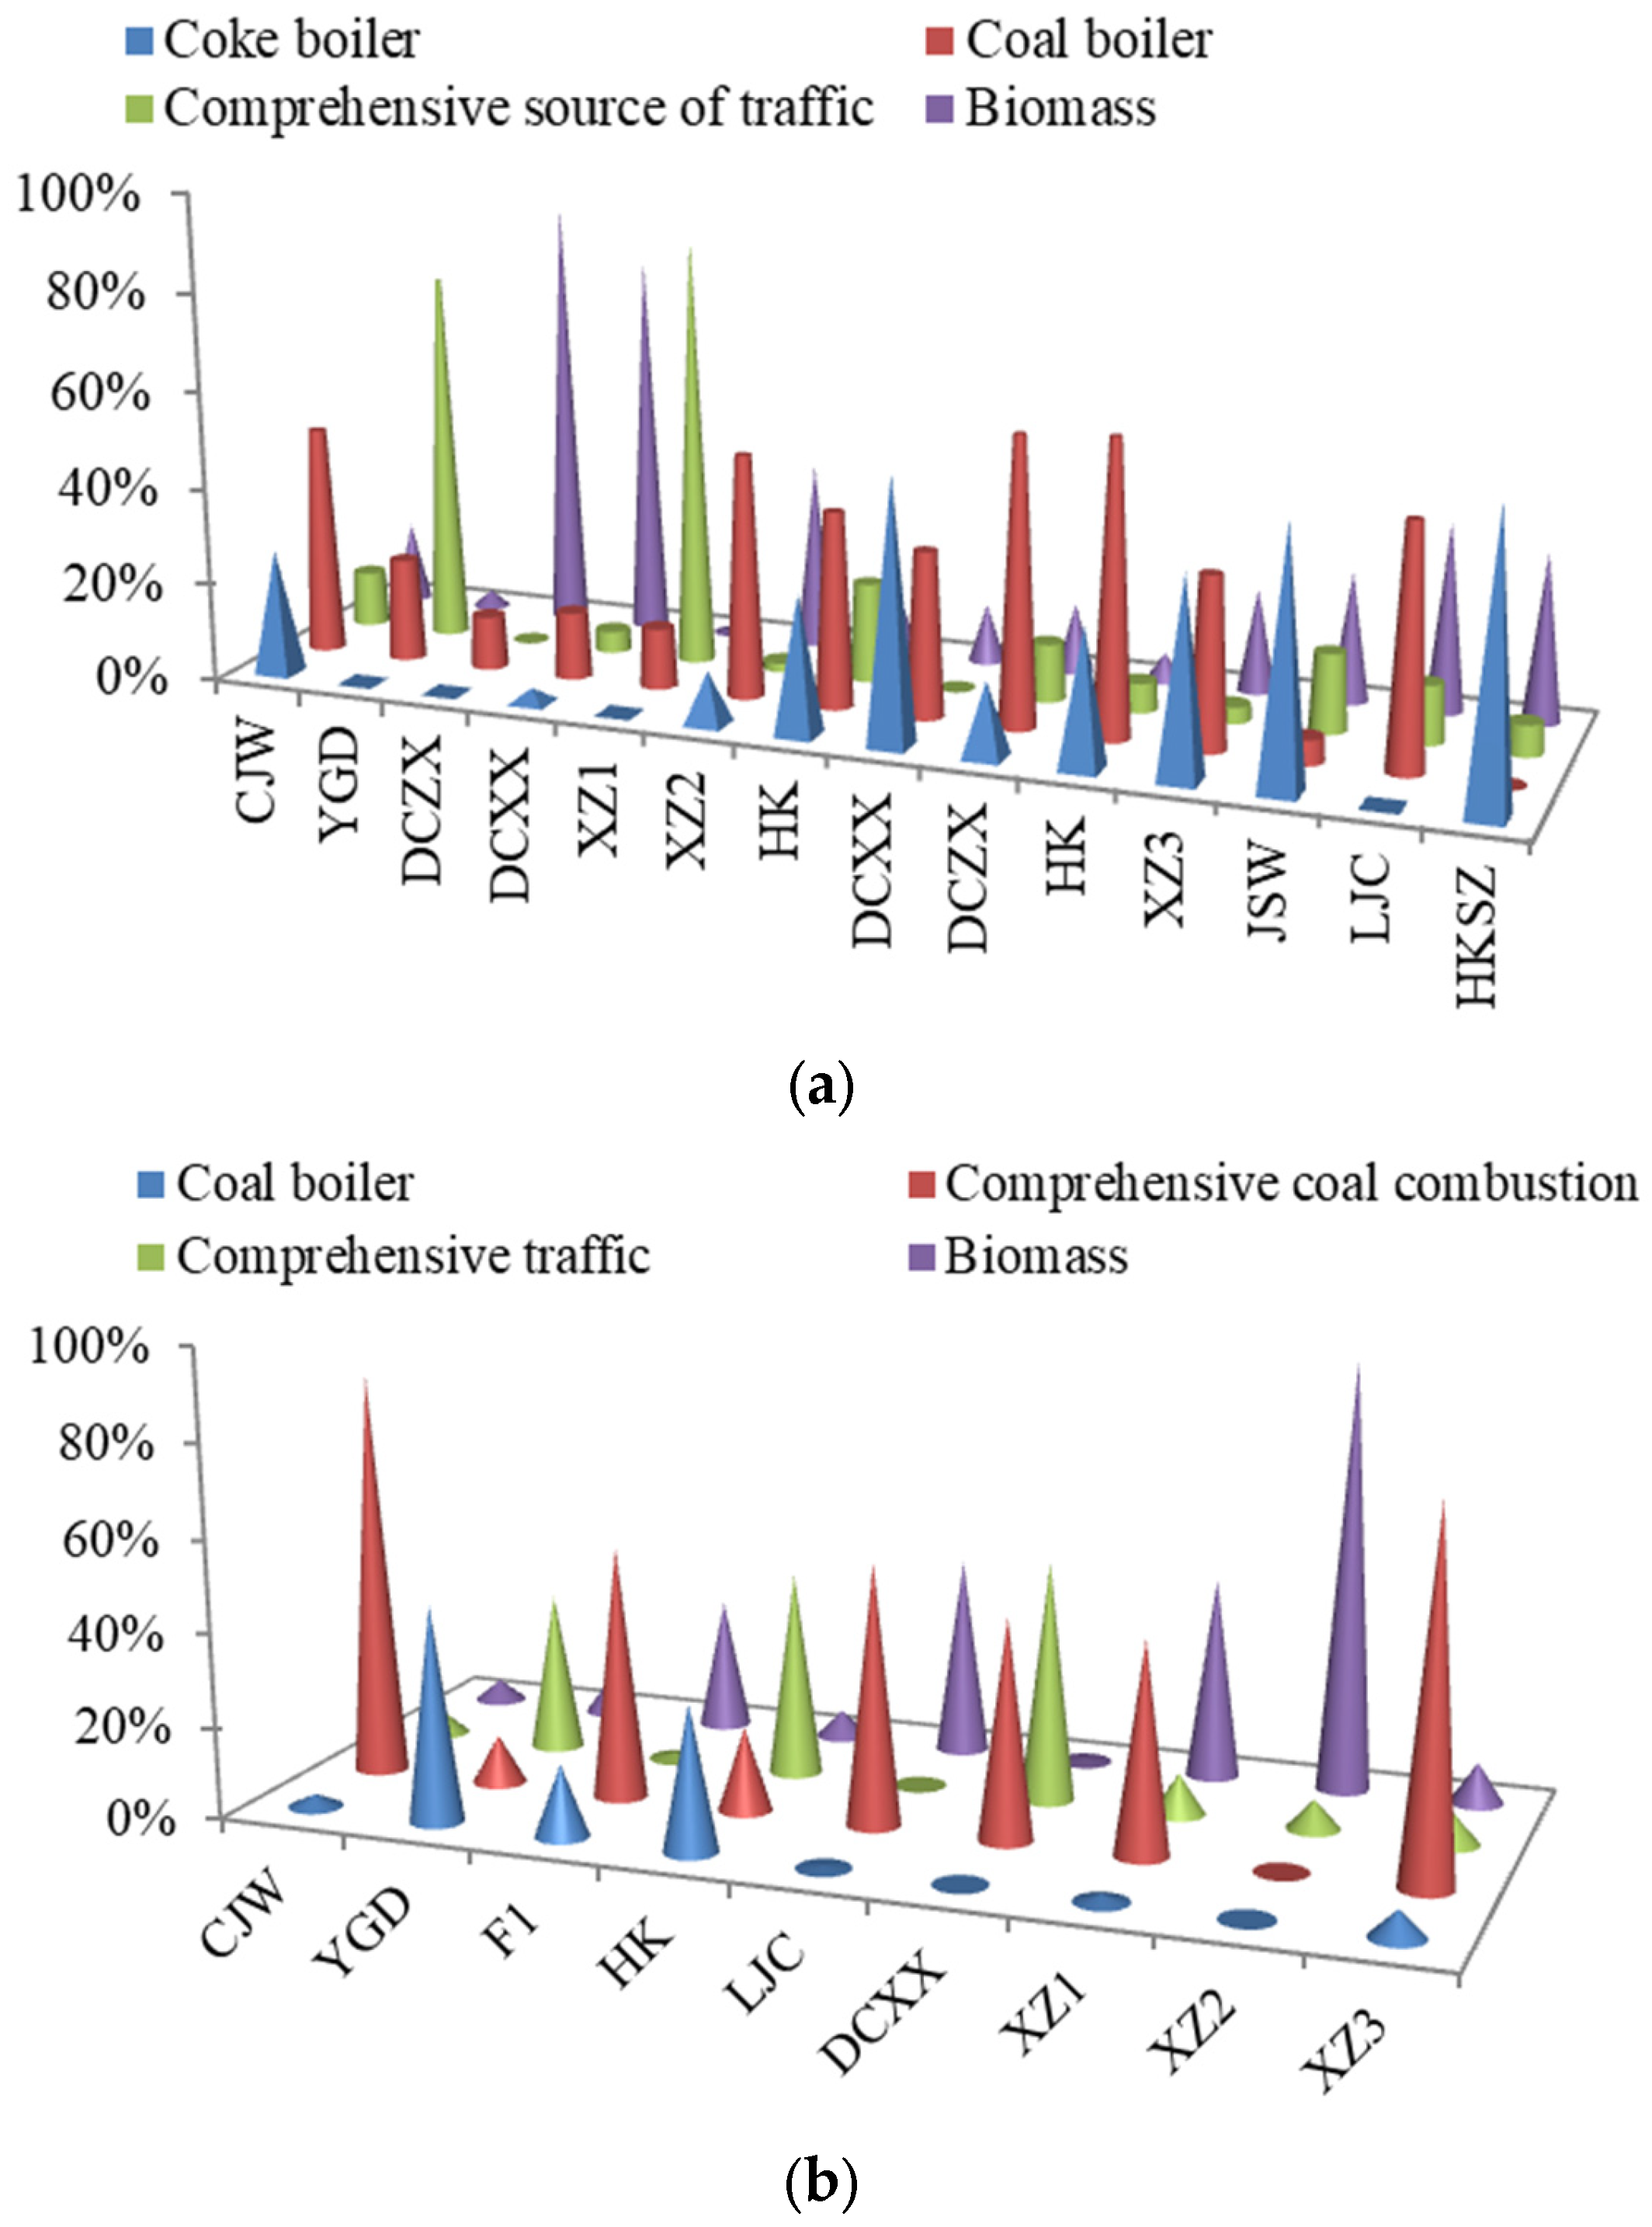
3.5. NMF Analysis for PAHs Sources in Poyang Lake

A total of eight typical PAHs source types were noted in this study, including: five coal-related sources (power plant, domestic coal burning, coke production and use, coal-fired integrated sources, and coal-fired boilers); four fuel-related sources (gasoline vehicle emission, diesel vehicle emission, traffic tunnel, and integrated traffic source); and biomass burning [45]. PAHs could be classified based on their degradation behavior and their possible determined sources. Eigenvalues were ranked to identify the principal components. Some 80% of variations were explained by the significant load being characterized by the factor load. PAHs in soil and sediment samples in the study area were extracted using four factor loads via NMF analysis (Figure 4 and Figure 5). Equally, the contributions of the four sources to PAHs in soils and sediments at each site were also quantitatively characterized (Figure 6).
Factor 1 included relatively high Ace and Flu levels in the soil samples in the Poyang Lake District, corresponding to the minimum SS value of the coke boiler in eight PAHs sources, thus suggesting that the coke boiler was the source. Factor 2 was dominated by Phe, which is associated with the coal boiler. Factor 3 had high loadings of Acy, Baa, BbF, BkF, BaP, D(ah)A, B(ghi)P, and InP, thus indicating that vehicular traffic was the source. Factor 4 had high loads of Ant, which is an indication of biomass as the source.
For the sediment samples in the Poyang Lake District, Factor 1 had high loadings of Acy, Ace, Fla, Pyr, and BaA, corresponding to the minimum SS value of the coal boiler in eight PAHs sources, thus indicating that the coal boiler was the source. Factor 2 included relatively high levels of Flu and Phe, which is associated with the comprehensive combustion of coal, thus indicating that coal combustion is the source. Factor 3 was dominated by BbF, BkF, BaP, D(ah)A, B(ghi)P, and InP, thus indicating that vehicular traffic was the source. Factor 4 had high loads of Ant, which marked biomass as the source.

4. Conclusions

Poyang Lake is the largest freshwater lake in China and the largest bird sanctuary in the world. Understanding the distribution and specific source contributions of PAHs to soils and sediments is key for assessing PAHs risks and controlling pollution in the Poyang Lake District. PAHs in the soils and sediments of Poyang Lake were mainly due to the incomplete combustion of coal and coke at high temperatures, and from traffic and biomass. Overall, the PAHs content in soil was less than that in sediment. The relative content of 2-ring Nap was lowest, and the HMW PAHs content above 4-rings was the most dominant, accounting for 69.0% and 67.5%, respectively. The spatial heterogeneity of PAHs distribution in the Poyang Lake District was large. LMW PAHs was the most dominant type in agricultural soil, and HMW PAHs was the most dominant type in industrial and grassland soils. The order of PAHs content in the soils for the different land use types was as follows: industrial soil > native soil > agricultural soil. Pyr, Phe, and Chr were the main monomer PAHs pollutants. The ecological risk posed by sediments in Poyang Lake to the surrounding aquatic life was relatively small, but Flu and Phe needs special attention in terms of monitoring.

Author Contributions

Writing—original draft preparation, C.C. and H.Z.; data analysis, X.G.; writing—review and editing, J.L. and L.W. All authors have read and agreed to the published version of the manuscript.

Funding

This research was funded by Strategic Priority Research Program of Chinese Academy of Sciences (XDA26050200 & XDA28130400).

Institutional Review Board Statement

Not applicable.

Data Availability Statement

The datasets generated and/or analyzed during the current study are not publicly available due to the confidentiality agreement of the patent data, but they are available from the corresponding author on reasonable request.

Conflicts of Interest

The authors declare no conflict of interest.

References

  1. Wang, Z.; Wang, Y.; Ma, X.D.; Na, G.S.; Lin, Z.S.; Yao, Z.W. Probabilistic Ecological Risk Assessment of Typical PAHs in Coastal Water of Bohai Sea. Polycycl. Aromat. Compd. 2013, 33, 367–379. [Google Scholar] [CrossRef]
  2. Li, J.F.; Dong, H.; Xu, X.; Han, B.; Li, X.G.; Zhu, C.J.; Han, C.; Liu, S.P.; Yang, D.D.; Xu, Q.; et al. Prediction of the bioaccumulation of PAHs in surface sediments of Bohai Sea, China and quantitative assessment of the related toxicity and health risk to humans. Mar. Pollut. Bull. 2016, 104, 92–100. [Google Scholar] [CrossRef] [PubMed]
  3. Ma, W.L.; Zhu, F.J.; Liu, L.Y.; Jia, H.L.; Yang, M.; Li, Y.F. PAHs in Chinese atmosphere Part II: Health risk assessment. Ecotoxicol. Environ. Saf. 2020, 200, 110774. [Google Scholar] [CrossRef] [PubMed]
  4. Ali, N. Polycyclic aromatic hydrocarbons (PAHs) in indoor air and dust samples of different Saudi microenvironments; health and carcinogenic risk assessment for the general population. Sci. Total Environ. 2019, 696, 133995. [Google Scholar] [CrossRef]
  5. Zeng, S.Y.; Ma, J.; Ren, Y.H.; Liu, G.J.; Zhang, Q.; Chen, F. Assessing the Spatial Distribution of Soil PAHs and their Relationship with Anthropogenic Activities at a National Scale. Int. J. Environ. Res. Public Health 2019, 16, 4928. [Google Scholar] [CrossRef] [Green Version]
  6. Bartolome, N.; Hilber, I.; Schulin, R.; Mayer, P.; Witt, G.; Reininghaus, M.; Bucheli, T.D. Comparison of freely dissolved concentrations of PAHs in contaminated pot soils under saturated and unsaturated water conditions. Sci. Total Environ. 2018, 644, 835–843. [Google Scholar] [CrossRef]
  7. Hadibarata, T.; Syafiuddin, A.; Ghfar, A.A. Abundance and distribution of polycyclic aromatic hydrocarbons (PAHs) in sediments of the Mahakam River. Mar. Pollut. Bull. 2019, 149, 110650. [Google Scholar] [CrossRef]
  8. He, Y.; Yang, C.; He, W.; Xu, F.L. Nationwide health risk assessment of juvenile exposure to polycyclic aromatic hydrocarbons (PAHs) in the water body of Chinese lakes. Sci. Total Environ. 2020, 723, 138099. [Google Scholar] [CrossRef]
  9. Merhaby, D.; Rabodonirina, S.; Net, S.; Ouddane, B.; Halwani, J. Overview of sediments pollution by PAHs and PCBs in mediterranean basin: Transport, fate, occurrence, and distribution. Mar. Pollut. Bull. 2019, 149, 110646. [Google Scholar] [CrossRef]
  10. Han, B.; Zheng, L.; Lin, F.X. Risk assessment and source apportionment of PAHs in surface sediments from Caofeidian Long Island, China. Mar. Pollut. Bull. 2019, 145, 42–46. [Google Scholar] [CrossRef]
  11. Qu, Y.J.; Gong, Y.W.; Ma, J.; Wei, H.Y.; Liu, Q.Y.; Liu, L.L.; Wu, H.W.; Yang, S.H.; Chen, Y.X. Potential sources, influencing factors, and health risks of polycyclic aromatic hydrocarbons (PAHs) in the surface soil of urban parks in Beijing, China. Environ. Pollut. 2020, 260, 114016. [Google Scholar] [CrossRef] [PubMed]
  12. Ahmad, M.; Yang, Q.S.; Zhang, Y.Y.; Ling, J.; Sajjad, W.; Qi, S.H.; Zhou, W.G.; Zhang, Y.; Lin, X.C.; Zhang, Y.H.; et al. The distinct response of phenanthrene enriched bacterial consortia to different PAHs and their degradation potential: A mangrove sediment microcosm study. J. Hazard. Mater. 2019, 380, 120863. [Google Scholar] [CrossRef] [PubMed]
  13. Zhan, C.L.; Wan, D.J.; Han, Y.M.; Zhang, J.Q. Historical variation of black carbon and PAHs over the last similar to 200 years in central North China: Evidence from lake sediment records. Sci. Total Environ. 2019, 690, 891–899. [Google Scholar] [CrossRef] [PubMed]
  14. Qian, Z.; Mao, Y.; Xiong, S.; Peng, B.; Liu, W.; Liu, H.F.; Zhang, Y.; Chen, W.; Zhou, H.; Qi, S.H. Historical residues of organochlorine pesticides (OCPs) and polycyclic aromatic hydrocarbons (PAHs) in a flood sediment profile from the Longwang Cave in Yichang, China. Ecotoxicol. Environ. Safe 2020, 196, 110542. [Google Scholar] [CrossRef]
  15. Zhao, X.G.; Jin, H.Y.; Ji, Z.Q.; Li, D.H.; Kaw, H.Y.; Chen, J.F.; Xie, Z.Y.; Zhang, T. PAES and PAHs in the surface sediments of the East China Sea: Occurrence, distribution and influence factors. Sci. Total Environ. 2020, 703, 134763. [Google Scholar] [CrossRef]
  16. Lei, P.; Pan, K.; Zhang, H.; Bi, J.L. Pollution and Risk of PAHs in Surface Sediments from the Tributaries and Their Relation to Anthropogenic Activities, in the Main Urban Districts of Chongqing City, Southwest China. Bull. Environ. Contam. Toxicol. 2019, 103, 28–33. [Google Scholar] [CrossRef]
  17. Liu, W.Y.; Wang, D.; Singh, V.P.; Wang, Y.K.; Zeng, X.K.; Ni, L.L.; Tao, Y.W.; Wu, J.C.; Liu, J.F.; Zou, Y.; et al. A hybrid statistical model for ecological risk integral assessment of PAHs in sediments. J. Hydrol. 2020, 583, 124612. [Google Scholar] [CrossRef]
  18. Liu, F.; Yang, Q.S.; Hu, Y.J.; Du, H.H.; Yuan, F. Distribution and transportation of polycyclic aromatic hydrocarbons (PAHs) at the Humen river mouth in the Pearl River delta and their influencing factors. Mar. Pollut. Bull. 2014, 84, 401–410. [Google Scholar] [CrossRef]
  19. Yu, Y.J.; Yu, Z.L.; Wang, Z.D.; Lin, B.G.; Li, L.Z.; Chen, X.C.; Zhu, X.H.; Xiang, M.D.; Ma, R.X. Polycyclic aromatic hydrocarbons (PAHs) in multi-phases from the drinking water source area of the Pearl River Delta (PRD) in South China: Distribution, source apportionment, and risk assessment. Environ. Sci. Pollut. Res. 2018, 25, 12557–12569. [Google Scholar] [CrossRef]
  20. Ding, Y.K.; Wang, S.R.; Zhang, W.Q.; Feng, M.L.; Yu, R.H. A rule of hydrological regulating on nutritional status of Poyang Lake, since the operation of the Three Gorges Dam. Ecol. Indic. 2019, 104, 535–542. [Google Scholar] [CrossRef]
  21. Li, B.; Yang, G.S.; Wan, R.R. Multidecadal water quality deterioration in the largest freshwater lake in China (Poyang Lake): Implications on eutrophication management. Environ. Pollut. 2020, 260, 114033. [Google Scholar] [CrossRef] [PubMed]
  22. Cai, H.; Mei, Y.D.; Chen, Y.Y. An Analysis of a Water Use Decoupling Index and Its Spatial Migration Characteristics Based on Extracting Trend Components: A Case Study of the Poyang Lake Basin. Water 2019, 11, 1027. [Google Scholar] [CrossRef] [Green Version]
  23. Tian, Q.; Holland, J.H.; Brown, D.G. Social and economic impacts of subsidy policies on rural development in the Poyang Lake Region, China: Insights from an agent-based model. Agric. Syst. 2016, 148, 12–27. [Google Scholar] [CrossRef]
  24. Sun, C.Z.; Zhen, L.; Miah, M.G. Comparison of the ecosystem services provided by China’s Poyang Lake wetland and Bangladesh’s Tanguar Haor wetland. Ecosyst. Serv. 2017, 26, 411–421. [Google Scholar] [CrossRef]
  25. Liao, M.N.; Yu, G.; Guo, Y. Eutrophication in Poyang Lake (Eastern China) over the Last 300 Years in Response to Changes in Climate and Lake Biomass. PLoS ONE 2017, 12, e0169319. [Google Scholar] [CrossRef] [PubMed]
  26. Li, Q.Y.; Wu, J.L.; Zhao, Z.H. Spatial and temporal distribution of Polycyclic Aromatic Hydrocarbons (PAHs) in sediments from Poyang Lake, China. PLoS ONE 2018, 13, e0205484. [Google Scholar] [CrossRef] [PubMed]
  27. Xie, H.L.; Wang, P.; Huang, H.S. Ecological Risk Assessment of Land Use Change in the Poyang Lake Eco-economic Zone, China. Int. J. Environ. Res. Public Health 2013, 10, 328–346. [Google Scholar] [CrossRef] [Green Version]
  28. De Almeida, M.; do Nascimento, D.V.; Mafalda, P.D.; Patire, V.F.; de Albergaria-Barbosa, A.C.R. Distribution and sources of polycyclic aromatic hydrocarbons (PAHs) in surface sediments of a Tropical Bay influenced by anthropogenic activities (Todos os Santos Bay, BA, Brazil). Mar. Pollut. Bull. 2018, 137, 399–407. [Google Scholar] [CrossRef]
  29. Wang, C.Y.; Zou, Y.M.; Yu, L.J.; Lv, Y.C. Potential source contributions and risk assessment of PAHs in sediments from the tail-reaches of the Yellow River Estuary, China: PCA model, PMF model, and mean ERM quotient analysis. Environ. Sci. Pollut. Res. 2020, 27, 9780–9789. [Google Scholar] [CrossRef]
  30. Jia, J.P.; Bi, C.J.; Zhang, J.F.; Jin, X.P.; Chen, Z.L. Characterization of polycyclic aromatic hydrocarbons (PAHs) in vegetables near industrial areas of Shanghai, China: Sources, exposure, and cancer risk. Environ. Pollut. 2018, 241, 750–758. [Google Scholar] [CrossRef]
  31. Keshavarzi, B.; Abbasi, S.; Moore, F.; Mehravar, S.; Sorooshian, A.; Soltani, N.; Najmeddin, A. Contamination Level, Source Identification and Risk Assessment of Potentially Toxic Elements (PTEs) and Polycyclic Aromatic Hydrocarbons (PAHs) in Street Dust of an Important Commercial Center in Iran. Environ. Manag. 2018, 62, 803–818. [Google Scholar] [CrossRef] [PubMed]
  32. Gaujoux, R. An Introduction to NMF Package. 2018. Available online: https://r-forge.r-project.org/R/?group_id=649 (accessed on 7 March 2022).
  33. Tian, F.; Chen, J.; Qiao, X.; Cai, X.; Yang, P.; Wang, Z.; Wang, D. Source identification of PCDD/Fs and PCBs in pine (Cedrus deodara) needles: A case study in Dalian, China. Atmos. Environ. 2008, 42, 4769–4777. [Google Scholar] [CrossRef]
  34. De Vries, W.; Bakker, D.J. Manual for Calculating Critical Loads of Heavy Metals for Terrestrial Ecosystem: Guidelines for Critical Limits, Calculation Methods and Input Data; TNO Institute of Environmental Sciences, Energy Research and Process Innovation: Den Helder, The Netherlands, 1998; p. 144. [Google Scholar]
  35. CCME (Canadian Council of Ministers of the Environment). A Protocol for the Derivation of Environmental and Human Health Soil Quality Guidelines; CCME-EPC-101E; CCME: Ottawa, Canada, 1996; p. 169. [Google Scholar]
  36. Ma, R.; Yang, G.; Duan, H. China’s lakes at present: Number, area and spatial distribution. Sci. China Earth Sci. 2011, 54, 283–289. [Google Scholar] [CrossRef]
  37. Li, C.C.; Huo, S.L.; Yu, Z.Q. National investigation of semi-volatile organic compounds (PAHs, OCPs, and PCBs) in lake sediments of China: Occurrence, spatial variation and risk assessment. Sci. Total Environ. 2017, 579, 325–336. [Google Scholar] [CrossRef] [PubMed]
  38. Meng, Y. A review on occurrence and risk of polycyclic aromatic hydrocarbons (PAHs) in lakes of China. Sci. Total Environ. 2019, 651, 2497–2506. [Google Scholar] [CrossRef]
  39. Zhao, Z.H.; Jiang, Y.; Li, Q.Y.; Cai, Y.J.; Yin, H.B.; Zhang, L.; Zhang, J. Spatial correlation analysis of polycyclic aromatic hydrocarbons (PAHs) and organochlorine pesticides (OCPs) in sediments between Taihu Lake and its tributary rivers. Ecotoxicol. Environ. Safe 2017, 142, 117–128. [Google Scholar] [CrossRef] [Green Version]
  40. He, J.; Yang, Y.J.; Zhang, L.G.; Luo, Y.S.; Liu, F.; Yang, P.H. Polycyclic Aromatic Hydrocarbons (PAHs) in Surface Sediments of two Lakes of the Dongting Lake District in Hunan, China. In Proceedings of the International Conference on Biotechnology and Bioengineering, Budapest, Hungary, 24–26 October 2018; Trincone, A., Azevedo, J.L., Gong, M., Eds.; AIP Publishing LLC: Melville, NY, USA, 2018. [Google Scholar]
  41. Lin, F.; Han, B.; Ding, Y.; Li, Q.; Gao, W.; Zheng, L. Distribution characteristics, sources, and ecological risk assessment of polycyclic aromatic hydrocarbons in sediments from the Qinhuangdao coastal wetland, China. Mar. Pollut. Bull. 2018, 127, 788–793. [Google Scholar] [CrossRef]
  42. Han, L.; Bai, J.; Gao, Z.; Wang, W.; Wang, D.; Cui, B.; Liu, X. Polycyclic aromatic hydrocarbons (PAHs) in surface soils from reclaimed and ditch wetlands along a 100-year chronosequence of reclamation in a Chinese estuary: Occurrence, sources, and risk assessment. Agric. Ecosyst. Environ. 2019, 286, 106648. [Google Scholar] [CrossRef]
  43. Motelay-Massei, A.; Ollivon, D.; Garban, B.; Teil, M.J.; Blanchard, M.; Chevreuil, M. Distribution and spatial trends of PAHs and PCBs in soils in the Seine River basin, France. Chemosphere 2004, 55, 555–565. [Google Scholar] [CrossRef]
  44. Friesen, M.C.; Demers, P.A.; Spinelli, J.J.; Le, N.D. Adequacy of Benzo(A)Pyrene and Benzene Soluble Materials as Indicators of Exposure to Polycyclic Aromatic Hydrocarbons in a Sderberg Aluminum Smelter. J. Occup. Environ. Hyg. 2008, 5, 6–14. [Google Scholar] [CrossRef]
  45. Li, A.; Jang, J.K.; Scheff, P.A. Application of EPA CMB8.2 model for source apportionment of sediment PAHs in Lake Calumet, Chicago. Environ. Sci. Technol. 2003, 37, 2958–2965. [Google Scholar] [CrossRef] [PubMed]
Figure 1. A map depicting the location of the study area in China (left plate) and an extended map of the area showing the Poyang Lake and the sampling sites in the lake region. Note: DCZX = Huaqiao village in Zhouxi Town in Duchang County; DCXX = Jingtou village in Tunxi Town in Duchang County; XZ1 = Xingzi Observatory; XZ2 = Yanhuachi village in Weinan Town in Xingzi County; XZ3 = Xixi Street in Xi village in Weinan Town in Xingzi County; HK = Hukou CJW in Caijiawan County; YGD = Yaogongdu; F1 = Shatan Bridge; JSW = Jinshawan Industrial Park; LJC = Liaojiachang; HKSZ = Shuangzhong Town, Hukou.
Land 11 00843 g001
Figure 2. Violin plot charts of PAHs concentrations in surface soils and sediments of Poyang Lake. Note: the violin plots reflect the probability density of distribution, with the bottom and top vertical lines in boxes representing the 25th and 75th centiles, respectively. Red frame reflect PAHs in sediment, blue frame reflect PAHs in soil.
Land 11 00843 g002
Figure 3. Proportion of different components of PAHs in the soils and sediments in the Poyang Lake District.
Land 11 00843 g003
Figure 4. Source contributions derived from NMF for soil samples.
Land 11 00843 g004
Figure 5. Source contributions derived by NMF analysis for sediment samples.
Land 11 00843 g005
Figure 6. Contribution of different sources of PAHs in soils (a) and sediments (b) at each location in the Poyang Lake District study area.
Land 11 00843 g006
Table 1. Target values of PAHs in the soils and sediments across the globe.
PAHSoil (mg·g−1)Sediment (μg·kg−1) [10]
The Netherlands [34]Canada [35]ERLERM
NANBNCCACBCC
Nap0.0155500.15501602100
Acy44640
Ace16500
Flu19540
Phe0.05101000.15502401500
Ant0.05101008531100
Fla0.015101006005100
Pyr0.1101006652600
BaA0.025500.11102611600
Chr0.025503842800
BbF
BkF0.025550
BaP0.0251100.11104301600
D(ah)a0.111063.4260
B(ghi)P0.0210100
Inp0.025550
PAHs400044,792
NA = target value for restoring soil to multiple purposes; NB = target value for restoring soil to higher governance requirements; NC = target value for restoring soil under lower governance requirements; CA = governance standard adopted by agricultural areas; CB = governance standard adopted by residential areas, parks, and parking lots; CC = governance standard adopted by commercial and industrial areas; ERL = effect range—low; and ERM = effect range—medium.
Table 2. Residues of PAHs in sediments of freshwater lakes/rivers in China (μg·kg−1).
LocationPAH ConcentrationReference
1Caofeidian52–806 (16)[10]
2Yangtze River, Chongqing221–3205 (16)[16]
3Bohai149.4–1212.0 (16)[2]
4Langwang Cave, Yichang5.05–82.6 (16)[14]
5Yellow River estuary10.8–252 (16)[29]
6Gonghai Lake, Shanxi17.43–459.6 (12)[13]
7East China Sea57.5–364.5 (16)[15]
8Taihu Lake Basin12.1–2281.1 (16)[39]
9Dongting Lake206.6–1059.0 (16)[40]
10Northeast Lakes District89.1–7935.21 (16)[38]
11Eastern Lakes District19.5–6993 (16)[38]
12Yunnan–Guizhou Lakes District21.8–6418 (16)[38]
13This study142.1–3205.4 (16)
The values in parentheses represent the number of individual PAHs detected.
Table 3. Residues of PAHs in soils in China (μg·kg−1).
LocationPAH ConcentrationReference
1Caofeidian52–806 (16)[10]
2Yangtze River, Chongqing221–3205 (16)[16]
3Bohai149.4–1212.0 (16)[2]
4Langwang Cave, Yichang5.05–82.6 (16)[14]
5Yellow River estuary10.8–252 (16)[29]
6Gonghai Lake, Shanxi17.43–459.6 (12)[13]
7East China Sea57.5–364.5 (16)[15]
8Taihu Lake Basin12.1–2281.1 (16)[39]
9Dongting Lake206.6–1059.0 (16)[40]
10Pearl River Estuary67–1172.8 (16)[42]
11Qinhuangdao341.61–4703.80 (16)[41]
12This study142.1–3205.4 (16)
Table 4. Ratios of traceable characteristic compounds in the sampled counties in the Poyang Lake District, China.
RatioLevelHu KouDu ChangXing ZiBo YangEstuary
Phe/AntMinimum1.022.020.374.84
Maximum5.99110.4518.4134.98
Mean3.3324.156.6913.614.78
Flu/PyrMinimum0.005000
Maximum0.651.370.760.23
Mean0.410.290.230.080.04
Pyr/BaPMinimum1.520.780.611.68
Maximum29.338.7919.6312.23
Mean9.544.196.695.4914.63
Publisher’s Note: MDPI stays neutral with regard to jurisdictional claims in published maps and institutional affiliations.

