Abstract
The trade-off and synergy relationship between ecosystem services (ESs) and human well-being (HWb) in the land-use process has become a research hotspot. The evolutionary process and regional contribution of the accurate quantification of ESs and HWb can provide a reference for government departments to formulate macroeconomic policies. Therefore, this study first constructed an analysis framework to identify the synergistic states/evolutionary stages of the gross ecosystem product (GEP) per capita (PGEP) and gross domestic product (GDP) per capita (PGDP) and the regional contribution of the GEP–GDP synergy of 362 municipal units in mainland China from 2000 to 2015. We did this by employing the Markov transition probability matrix, land use data, and economic data based on satellite remote sensing images. The findings of this study show that (1) the PGEP of the Chinese mainland has a remarkable spatial divergence featuring a higher value in the northwestern Chinese mainland and a lower value in the southeastern Chinese mainland on both sides of the Hu Line during the investigation period; despite the eastern Chinese mainland having a higher PGDP, the PGDP at the national level is distributed in dispersion on both sides of the Hu Line; (2) during the first half of the investigation period, the GEP–GDP synergy in the Chinese mainland was generally in the pseudo-synergy stage or the transition stage from pseudo-synergy to primary/intermediate synergy, while in the second half of the period, the GEP–GDP synergy in the Chinese mainland continued to improve; (3) the GEP–GDP synergy was relatively stable on the Chinese mainland during the investigation period, with 24.28% of the units shifting to a lower or higher level synergy, and the GEP–GDP synergy was more stable in the western and central Chinese mainland, while it was more likely to shift to a higher state in the northeastern and eastern Chinese mainland. This study suggests that the GEP–GDP relationship varies with spatial scales; a hierarchical, multiscale approach is necessary to study and improve both of these relationships, as simply extrapolating policies across single administrative levels may lead to unintended outcomes.
1. Introduction
Human activities have greatly influenced ecosystems at different spatial scales, from local to global scales. Ecosystems also influence human well-being (HWb) at the same time. Therefore, the correlation and evaluation of the two have long been a concern for the scientific community, with increasing attention in recent years. Ecosystem services (ESs) are the benefits that people derive from functioning ecosystems, either directly or indirectly [1], and they are essential for sustaining HWb. The diversity of ESs and the imbalance of spatial distribution (especially with human activities, such as land use change) have exacerbated the loss of regional ESs [2,3], and the degradation or reduction of ESs has a serious impact on HWb [4,5,6]. The HWb is a broad concept that includes material well-being, relationships with family and friends, and emotional and physical health. In addition, it encompasses work and recreation, how one feels about their community, and personal safety. Thus, in some developed countries, the issue of HWb equity, including ecosystem services (ESs), has received considerable attention, and the topics of environmental justice and ecological democracy related to regional social development have recently become a research hotspot [7,8].
In most developing countries, especially in rural areas, survival is a human priority. Thus, most studies have focused on the trade-off and synergy relationship between ESs, material well-being, ESs, and economic activity [9,10,11]. The results of previous research show that ecosystem protection may slow economic growth in the short term [12], and the impact of ecosystem services on human livelihood has also been demonstrated [9]. In contrast, economic growth may also affect ecosystem protection in the short term [12], especially agricultural production activities that can remarkably affect land-use cover change [11,13]. However, the correlation between the ecosystem and economic system becomes stronger with a higher degree of coupling. Ultimately, ecosystem protection can gradually improve the infrastructure of economic growth, and they will become more closely coordinated in promoting green economic growth. In other words, the coupling coordination between the ecosystem and the economic system can be sustained, with both being continuously bolstered.
As the world’s largest developing country, China is in a new era of accelerated development of socialist ecological civilization. Environmental justice, ecological democracy, and equity of well-being are important elements for achieving high quality and green development and are important ways for the government to govern and tackle environmental challenges. Thus, China has recently included “promoting social justice, enhancing people’s well-being, and realizing people’s aspirations for a better life” as a development goal in its future work plan. In China, academics have devoted their attention to studying ESs’ assessment in different regions [14,15], particularly in economically developed eastern China with high population densities, including the capital economic circle, the Yangtze River Delta, and the Pearl River Delta regions [16,17,18,19]. For example, Chen et al. explored the spatial autocorrelation/spillover effects of urbanization and ESs in the middle reaches of the Yangtze River in China by adopting the Integrated Valuation of Ecosystem Services and Trade-offs model and spatial autocorrelation analysis. The results showed that there were remarkable spatial correlations between the two at both global and local scales [20]. Wang et al. applied a similar approach and found a remarkable correlation between ESs and urbanization indicators in the Pearl River Delta region [21], and they pointed out that a robust spatial correlation exists between the two within three scales (grid, sub-basin, and basin-wide). The above findings reveal the complex influence of urbanization scenarios on the trade-off and synergy relationship between regional ESs and HWb, and they provide rational references for local governments to make macroeconomic decisions.
Ideally, human development policies should improve human well-being through the conservation of ecosystems that provide services [22]. It is important to state that HWb is an evaluation indicator with rich connotations, which contains at least four basic elements: basic needs, economic needs, environmental needs, and subjective happiness. The structure of human well-being is dependent upon a range of natural and social factors [23]. Thus, some researchers have pointed out that trade-offs and synergies between ecosystem services and disaggregated well-being are understudied in developing countries in Asia, Africa, and Latin America [24]. Since the implementation of the MEA project [1], Chinese scholars have focused on describing the trade-off and synergy between ESs and HWb in the past [14]. However, as previously mentioned, most researchers bring different types of ecosystem services from the perspective of human well-being [15,16,17] and then pay attention to the trade-off synergy between provisioning services and reconciliation services or between cultural tourism services and support services. From the perspective of the research object, prior research findings have typically focused on hot spot watershed areas [18,19,20,21]; therefore, the spatial scale of these research results is relatively single.
This study attempts to diverge from previous research in two aspects, the evaluation index and research scale, to provide a professional basis for the implementation of differentiated ecological governance measures in the Chinese mainland. Thus, this study uses the gross ecosystem product (GEP) per capita (PGEP) based on ESs assessment to measure regional ecological well-being and the gross domestic product (GDP) per capita (PGDP) based on statistical data to measure regional economic well-being. The outline of this study is as follows: first, remote sensing images and statistics were used to analyze the spatial distribution characteristics of PGEP and PGDP and their synergistic states of 362 municipal units in mainland China based on a static viewpoint; second, the evolution of GEP–GDP synergistic states and the regional contribution of GEP–GDP synergistic states from 2000 to 2015 in mainland China were analyzed using the Markov transition probability matrix based on a dynamic viewpoint; finally, the policy implications, limitations, and future research are discussed based on the results of this study.
2. Data and Methods
2.1. Data Sources
To achieve multi-scale analysis and comparison with previous research results, this study took the Chinese mainland (Hong Kong, Macao, Taiwan, and Sansha City in Hainan Province were not included because of the lack of population and GDP statistics in the relevant years) as the research object and emphasized the southeastern part of the Hu Line and the northwest part of the Hu Line. To facilitate the convergence of research results and government decision-making, this study took 362 prefecture-level cities as the basic evaluation unit (including four municipalities directly under the central government and 30 counties under the jurisdiction of provincial administrative regions, such as Xinjiang and Hainan) and emphasized the eastern, western, central, and northeast regions of the Chinese mainland.
The sample period investigated in this study was from 2000 to 2015, of which four years were selected to represent the four typical periods. The land use classification data, population, and GDP data used in this study were based on the 1-km raster map provided by the Resources and Environment Science and Data Center [25], and the boundary data of Chinese municipal units were overlaid using ArcGIS 10.3.1. Next, PGEP and PGDP were extracted and calculated for the 362 basic evaluation units.
2.2. Methods
2.2.1. GEP Accounting Methodology
Recently, the United Nations Statistical Commission incorporated GEP into the System of Environmental Economic Accounting-Ecosystem Accounting (SEEA-EA) and used it as a measurement indicator of the Sustainable Development Goals (SDGs) and ecosystem services [26]. Analogous to GDP, GEP uses market prices and surrogates for market prices to calculate the accounting value of ecosystem services and aggregates them into a measure of the contribution of ecosystems to the economy [27]. This study used PGDP to characterize regional economic well-being [28] and PGEP to characterize regional ecological well-being; the framework of GEP accounting is shown in Equation (1) and Table 1.
where EPS is the value of the ecosystem provisioning services (food supply, raw material supply, and water supply), ERS is the value of the ecosystem reconciliation services (water resources conservation, air quality improvement, microclimate regulation, and waste absorption), ESS is the value of the ecosystem support services (soil conservation, nutrient cycling, and biodiversity), and ETS is the value of the ecosystem tourism services (cultural and recreational services). More detailed evaluation indexes and data descriptions are provided [26,29].

Table 1.
Composition of GEP and its accounting method.
2.2.2. Criteria for Distinguishing GEP–GDP Synergistic States
In a complex eco-economic system, the connotation of synergy should include coordination and development [30]; coordination is defined as the cooperative and harmonious relationship between two subsystems based on a static viewpoint [31]; development is defined as a process whereby a composite system changes from small to large, simple to complex, low level to high level, and disorder to order based on a dynamic viewpoint [31]. Previous studies measured the synergistic relationship between the ecosystem and economic system using the coupling coordination degree model [18,30]. However, it must be noted that the coupling coordination degree model has three reliability issues: the subjectivity of index construction and the volatility and incomparability of coupling results [32]. Therefore, considering that this method may overestimate the evaluation units with a lower PGEP and PGDP as a high-level coupling coordination (pseudo-synergy), this study first classified the PGEP and PGDP of 362 basic evaluation units as excellent (above 99,900 yuan; USD 15,000), good (66,600–99,900 yuan; USD 10,000–15,000), fair (33,300–66,600 yuan; USD 5000–10,000), and poor (below 33,300 yuan; USD 5000) based on the uniform function distribution. In order to describe and understand the research results, this study made a secondary differentiation of the regional GEP–GDP synergy stages (types) via the four-quadrant analysis method, including four synergy stages: pseudo-synergy (poor GEP and GDP are coordinated with each other, but unsustainable), primary synergy (fair GEP and fair GDP are coordinated with each other, but the synergistic effect is not), intermediate synergy (good GEP and good GDP are coordinated with each other, and the synergistic effect is remarkable), advanced synergy (excellent GEP and excellent GDP are coordinated with each other and unsustainable), and three transition stages (transition I, transition II, and transition III). The specific differentiation criteria are shown in Table 2, based on the above definition of GEP–GDP synergy and the division standards of PGEP and PGDP. The above criteria take the objective situation of mainland China’s ecological welfare performance, economic development, and population growth during the survey period into account.
Table 2.
Criteria for distinguishing GEP–GDP synergistic states/stages.
2.2.3. Markov Model of GEP–GDP Synergistic States Transitions
To further explore the spatiotemporal evolution of regional GEP–GDP synergistic states and their regional contributions, this study analyzed the proportion of the types of GEP–GDP synergistic state transformation in the total sample of municipalities in different periods using a Markov transfer matrix [33,34]. Given the relative stability of GEP–GDP synergistic states in mainland China during the investigation period and the fact that the conditional probability of an evaluation unit being in a particular synergistic state is only related to its previous state, this study considered the Markov transition probability matrix to be applicable for analyzing the transition of the GEP–GDP synergistic state. The analytical steps in this study were as follows: first, the 362 municipal GEP–GDP synergy relationship types in each period were discretized into seven categories and 1448 specific state types are shown in Table 2; then, the probability distributions corresponding to the GEP–GDP synergy state transitions between two typical years were calculated; finally, the regional contribution of the transition of GEP–GDP synergistic states in mainland China were analyzed. The 7 × 7 order Markov transition probability matrix M of the GEP–GDP synergy in the municipal area was as follows:
where Mij represents the probability that the state type (the stage it is in) of the GEP–GDP synergy of a municipal unit shifts from the state i in a year t to state j in a year t + 1, Nij represents the number of municipal units in which the state type of the GEP–GDP synergy shifts from the state i in a year t to state j in a year t + 1, and Nj represents the total number of municipal units in a state i of the GEP–GDP synergy.
3. Results
3.1. Analysis of the Spatial Distribution Characteristics of GEP–GDP and Its Synergistic States
3.1.1. Analysis of the Spatial Distribution Characteristics of GEP and GDP
It can be seen from Figure 1a that the PGEP of municipal units in mainland China in 2015 generally shows a polarized spatial distribution; most units located on the northwest Chinese mainland of the Hu Line had a PGEP above 66,600 yuan, and most municipal units in the northwest of the Chinese mainland, including Xinjiang, Tibet, Qinghai, Gansu, and Inner Mongolia, had higher comparative advantages in ecological well-being per capita. In contrast, the PGEP in most of the regions on the southeastern Chinese mainland of the Hu Line was below 66,600 yuan, with the exception of the eastern and western wings of northeastern China and individual municipal units in Yunnan and Jiangxi, which were higher. Most municipal units in northern, eastern, and southern China had relatively low (PGEP: below 99,900 yuan) or low (PGEP: 33,300–66,600 yuan) comparative advantages in ecological well-being per capita.
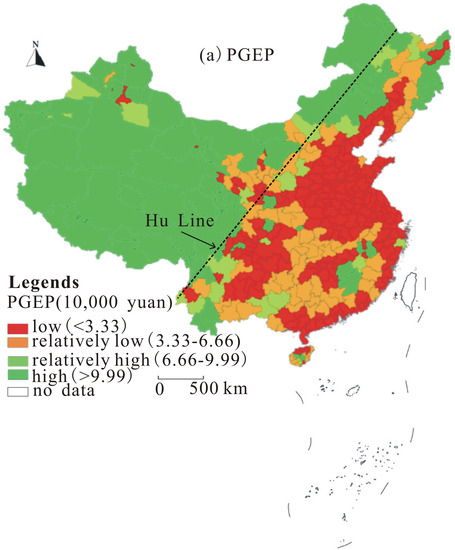
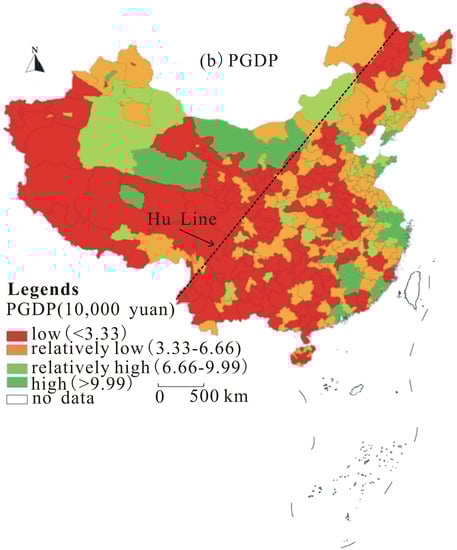
Figure 1.
Spatial distribution characteristics of the PGEP and PGDP in the Chinese mainland.
Unlike Figure 1a, Figure 1b shows that the spatial divergence of the PGDP of municipal units in the Chinese mainland in 2015 was not noticeable on the northwest Chinese mainland and southeast Chinese mainland of the Hu Line. Areas with a higher PGDP were mainly located in the relatively developed eastern coastal regions, including the central-southern Liaoning urban agglomeration, Beijing–Tianjin–Hebei urban agglomeration, urban agglomeration on the Shandong Peninsula, Yangtze River Delta urban agglomeration, Southeastern Fujian urban agglomeration, and Pearl River Delta urban agglomeration. The comparative advantages of economic well-being per capita in most of the above regions were high (PGDP: above 99,900 yuan) or relatively high (PGDP: 66,600–99,900 yuan), whereas in the central and western regions, the comparative advantages of economic well-being per capita in municipal units were low (PGDP: <33,300 yuan) or relatively low (PGDP: 33,300–66,600 yuan).
3.1.2. Analysis of the GEP–GDP Synergy Stages in Each Period
Based on the criteria for dividing the stages and types of GEP–GDP synergy shown in Table 2, the stages of GEP–GDP synergy for 362 municipal units in mainland China in each typical period were obtained (Figure 2). The GEP–GDP synergy in mainland China in 2000 and 2005 (the first half of the investigation period) was generally in the pseudo-synergy stage (both the PGEP and PGDP were below RMB 33,300 yuan or USD 5000) or in the stage of gradually shifting from the pseudo-synergy to the primary synergy stage (both the PGEP and PGDP were between 33,300 and 66,600 yuan or USD 5000–10,000) and the intermediate synergy stage (both the PGEP and PGDP were between 66,600 and 99,900 yuan or USD 10,000–15,000) (Figure 2a,b. Moreover, most of the municipal units on the northwest Chinese mainland of the Hu Line were in transition phase I, whereas the municipal units on the southeastern Chinese mainland of the Hu Line were generally in transition phase II.
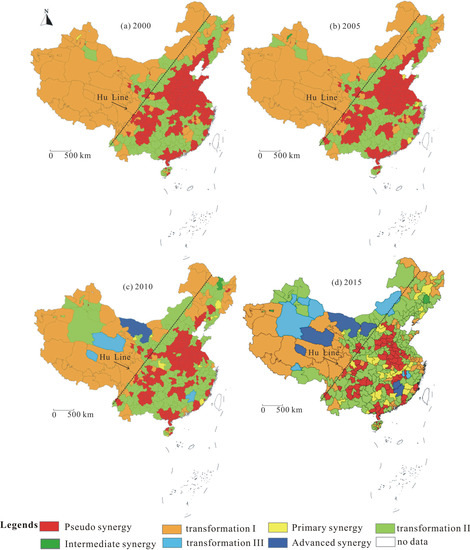
Figure 2.
Spatial distribution characteristics of the GEP–GDP synergy in the Chinese mainland during the investigation period.
Figure 2c,d) shows the situation in the second half of the investigation period; compared with the previous two typical periods, the state of the GEP–GDP synergy in the Chinese mainland gradually improved in 2010, and as municipal units in the pseudo-synergy stage and transition phase I gradually shrank, municipal units in the transition phase II stage showed an intensive expansion trend compared with the previous ones. It should also be noted that some municipal units in this period developed into transformation phase III or even the advanced GEP–GDP synergy stage. Finally, Figure 2d shows that the GEP–GDP synergy in mainland China continued to improve in 2015, and the municipal units on the southeastern Chinese mainland of the Hu Line that were originally in the pseudo-synergy stage gradually progressed to the primary synergy stage or transition phase II and even transformed to the advanced GEP–GDP synergy stage. Simultaneously, as more municipal units transitioned to transition phase II, transition phase III, or even the advanced GEP–GDP synergy status, the number of municipal units in the area to the northwest Chinese mainland of the Hu Line, which were originally in transition phase I, was remarkable reduced compared to the previous stage.
3.2. Analysis of the Transition Probability and Regional Contributions
3.2.1. Analysis of the Transition Probability to the Evolution of the GEP–GDP Synergy State
As can be seen from Table 3, the data on the diagonal line reveals that the probability of maintaining the GEP–GDP synergistic state in mainland China during the investigation period was 35.64%, 14.13%, and 25.95% for the three states of pseudo-synergy, transition phase I, and transition phase II, respectively, with a total value of 75.72%, indicating that the GEP–GDP synergy was relatively stable. The total value of the data shown in the bottom left of the diagonal line was 7.48%, indicating that less than 10% of the units had shifted downward (lower-level states) in terms of their GEP–GDP synergy in mainland China during the investigation period, and further observation showed that most of them shifted from transition phase II to pseudo-synergy, transition phase I, and primary synergy (with probabilities of 1.11%, 2.77%, and 3.42%, respectively). The total value of the data shown at the top right of the diagonal line was 16.34%, indicating that the proportion of units shifting upward (higher level) in terms of GEP–GDP synergy was more than double that of the units shifting downward during the investigation period, and the easiest upward shift mode was from transition phase I to phase II (probability of 2.68%).
Table 3.
Markov transition probability matrix of GEP–GDP synergy states in the Chinese mainland during the investigation period.
3.2.2. Analysis of the Regional Contributions to the Evolution of the GEP–GDP Synergy State
Table 4 shows the annual average change rates of the PGEP and PGDP in four regions of the northeastern, eastern, central, and western mainland China during the investigation period and each time period and the corresponding Markov probabilities of the GEP–GDP synergy state shifting upward (higher level), shifting downward (lower level), or remaining unchanged, according to which of the regional contributions of the evolution of the GEP–GDP synergy in each time period and during the entire investigation period could be revealed. In terms of the PGEP, all four regions showed a decreasing trend during the investigation period. The western region had the highest average annual decrease rate (14.44%), followed by the eastern and central regions (11.45% and 10.41%, respectively), and the northeastern region had the lowest decrease rate (2.73%). Only the northeastern region showed an increasing trend in the PGEP from 2010 to 2015. In terms of the PGDP, the overall growth rate in the four regions during the investigation period ranged from 474.49% to 620.75%, with the highest growth rate in western China (620.75% growth), followed by central and eastern China (growing by 584.00% and 535.59%, respectively) and the lowest rate of decrease in northeastern China (474.49%). This trend was similar to the change in the PGEP; a low rate of decrease in the PGEP resulted in a low growth rate of the PGDP, while a high rate of decrease in the PGEP resulted in a high growth rate of the PGDP. In addition, a comparison of the growth rates of the PGDP in the three periods from 2000 to 2005, 2005 to 2010, and 2010 to 2015 showed that they changed from low to high and then high to low, which was consistent with the overall trend of the slowdown in national economic growth during the investigation period.
Table 4.
Regional contribution of the evolution of the GEP–GDP synergistic states in the Chinese mainland by investigation period.
In terms of the probability of transfer of different evolutionary patterns, the contributions of regions where the GEP–GDP synergy status remained relatively stable in mainland China were, in descending order, western (83.70%), central (78.54%), northeastern (68.52%), and eastern (67.64%) regions. In addition, Table 4 shows that the proportion of GEP–GDP synergistic states that remained constant in each region during the three periods of 2000–2005, 2005–2010, and 2010–2015 all showed a remarkable decline, whereas the proportion of GEP–GDP synergistic states that shifted upward or downward in each region gradually increased during the three periods. The contributions of regions shifting upward in terms of GEP–GDP synergy in mainland China during the entire investigation period were, in decreasing order, the northeastern (22.22%), eastern (20.71%), central (14.56%), and western (12.35%) regions, while the contributions of regions shifting downward were, in decreasing order, the eastern (11.65%), northeastern (9.26%), central (6.90%), and western (3.95%) regions.
4. Discussion
4.1. Relative Stability of the GEP–GDP Synergistic State
Due to the diversity of ecosystem services, imbalance of spatial distribution, and selectivity of human use, the relationship between different spatial scales of ecosystem services is complex under the action of human activities and natural factors [35,36]. ESs–HWb relationships vary with the spatial scales and indicators. Thus, it is important to note that Liu and Wu suggested that a hierarchical, multiscale approach is necessary to study and improve the ESs–HWb relationship [37]. This study reemphasizes the importance of spatial scale in studying the synergistic relationship between ESs and HWb.
Prior studies have suggested that the trade-off/synergistic relationship between ESs and HWb is typically robust at watershed scales with roughly similar levels of internal urbanization, such as in the Beijing–Tianjin–Hebei metropolitan area or the middle Yangtze River metropolitan area [20,21]. The results of this study show that despite the different levels of urbanization in four regions (eastern, central, western, and northeastern China), the GEP–GDP synergistic state was relatively stable on a national scale. The GEP–GDP synergy of the municipalities in the Chinese mainland was mostly in three stages, pseudo-synergistic, transition phase I, and transition phase II, during the investigation period, which predicts that the GEP–GDP synergistic state may show a certain degree of convergence club patterns, i.e., municipal units with the same or similar GEP–GDP synergy states will evolve to the same steady-state in the future. It should also be stated that because of the larger scale of this study, the indicators chosen were different from those chosen by Chen et al. and Wang et al., which may also have an uncertain impact on the results [20,21].
4.2. Regional Contributions of the GEP–GDP Synergistic State
Since 2000, mainland China has vigorously promoted the construction of an ecological civilization [13,38]. The performance of ecosystem protection has gradually improved, along with economic structure and quality. During the study period, the growth rates of the central and western regions of the Chinese mainland increased rapidly, but the performance of ecosystem protection was not remarkable, and a large number of populations migrated to the economically developed eastern and northeastern areas [39,40]. On the contrary, the eastern and northeastern Chinese mainland has migrated populations in the central and western regions. Although the economic growth rate is decreasing, the performance of ecosystem protection is remarkable.
The findings of this study show that the PGEP in mainland China decreased by 11.53% from 2000 to 2015, with a 2.73% decrease in the PGEP in northeast China being the lowest value among all four major regions. This testifies to the effects of ecological environmental protection in northeast China. The situation in eastern China is similar to that in northeastern China, and both have made higher regional contributions to driving the GEP–GDP synergistic state in the Chinese mainland. It is important to note that the PGDP growth of 474.49% in the northeastern region was the lowest across the country (national average growth: 552.61%), resulting in an upward shift of 22.22% and a downward shift of 9.26% in the municipal units in the GEP–GDP synergy in northeastern China during this period. However, in contrast to the northeastern region, the results of previous studies have shown that the PGDP growth in the western region of mainland China stood at 620.75%, the highest among the four regions, and the PGEP reduction in the same period was 14.44%, which was also the highest in the country. This reflects the environmental cost of economic growth in western China. The situation in central China was similar to that in western China, both of which have made higher regional contributions to maintaining the GEP–GDP trade-off in mainland China.
4.3. Policy Implications
The trade-off and synergy relationship between ecosystem services (ESs) and human well-being (HWb) in the land-use process has become a research hotspot, and the evolutionary process and regional contribution of accurate quantification can provide a reference for government departments to formulate macroeconomic policies. To this end, we comprehensively assessed the regional contribution of the GEP–GDP synergism by the eastern, central, western, and northeast Chinese mainland, in addition to a contrastive analysis of the spatial distribution characteristics and their synergistic states of the GEP–GDP of 362 prefecture-level cities on both sides of the Hu Line. Thus, the 362 prefecture-level cities were divided into seven groups: pseudo-synergy (poor GEP and poor GDP), transition I, primary synergy (fair GEP and fair GDP), transition II, intermediate synergy (good GEP and good GDP), transition III, and advanced synergy (excellent GEP and excellent GDP).
The policy implications of this study show that cities in different groups should adopt different development paths and strategies for trade-offs and synergies between ecosystem protection and economic growth, as simply extrapolating policies across administrative levels may lead to unintended outcomes. Therefore, this study suggests that the cities in the pseudo or primary synergy stages should analyze their natural ecological endowments and economic structures to determine whether their economic growth is at the cost of damaging the natural ecosystems and implement green industrial upgrading and transformation for sustainable development; the cities in advanced or intermediate synergy stages should continue to maintain and promote the current natural ecosystem protection and economic growth in a steady manner; the cities in the three transition stages should continue to seek further economic growth on the basis of maintaining the current natural ecosystem protection, or they should strengthen the protection and enhance the ecosystem services value of natural ecosystems while exploring sustainable and eco-friendly development paths.
4.4. Limitations of the Study and Future Research
According to the theory of classical economics, different types of ecosystem service values are divided into three categories: (a) Perfect substitutes (goods that the public can trade-off perfectly and, hence, sacrifice the one and receive a respective amount of value from the other), (b) Partial substitutes (goods that you can trade-off with limitations; indifference curves depict such goods), and (c) Complementary goods (goods that can only work together in specific ratios). Therefore, within this context, the transition this study could in overall suggest that the GEP-GDP relation eventually tends to transform from (a) to (c), with (b) as an intermediate state. In this study, regional levels of ecological well-being and economic well-being were measured only in terms of the PGEP and PGDP, whereby the evolutionary trends of the spatial and temporal patterns of the GEP–GDP synergistic state of the municipalities in mainland China and their regional contributions were initially analyzed. The results of this study showed that the GEP can assess the contribution of natural ecosystems to human well-being, but the purpose of this indicator is not to replace the GDP. In contrast, this study suggests that using them can more effectively measure human ecological and economic well-being. It is important to state that in terms of research methods, the evaluation model constructed in this study has limitations; for example, the current research results could not identify that the GDP growth at year t would provide an economic surplus for environmental investment that would improve GEP performance in t + 1 or t + n in general. Therefore, we will consider incorporating other important indicators and circular causal relations with time lags into the model in future studies. In addition, the results of this study suggest that further research on the spatial and temporal convergence patterns of the GEP–GDP synergy and its driving mechanisms at different spatial and temporal scales is needed for research findings to serve as more rational guidance for sustainable government decision-making.
5. Conclusions
This study constructed GEP–GDP synergy states and their classification criteria at a macro-scale, and considering land use and population-economic data based on satellite remote sensing images, it analyzed the GEP–GDP synergistic states, their evolution process, and the regional contribution of municipalities in mainland China from 2000 to 2015 using the Markov transition probability matrix. The main findings were as follows: during the investigation period, the PGEP in the Chinese mainland showed a spatial divergence pattern featuring “higher in northwest China and lower in southeast China” on both sides of the Hu Line, compared to which the spatial divergence patterns of the PGDP at the national level on both sides of the Hu Line were not noticeable but divergent, despite the higher relative advantages of the PGDP in the eastern coastal region; in the first half of the investigation period, the GEP–GDP synergy in the Chinese mainland was generally in the pseudo-synergy stage or transitioning to the primary and intermediate synergy stages, while in the second half of the period, the GEP–GDP synergy in the Chinese mainland continued to improve; the GEP–GDP synergistic states in the Chinese mainland were relatively stable during the investigation period, and the proportion of municipal units shifting towards the lower or higher level synergistic state was less than 25% in total during that period. In particular, the GEP–GDP synergistic state was more stable in the western and central regions, while the GEP–GDP in the northeastern and eastern regions was more likely to shift towards lower- or higher-level synergistic states.
Author Contributions
Conceptualization, analytical framework, methodology, formal analysis and writing, and revising the manuscript, Z.Z.; visualization, Y.Z.; supervision and funding acquisition, X.X. All authors have read and agreed to the published version of the manuscript.
Funding
This study was financially supported by the Later Funded Projects of the Chinese National Funding of Social Sciences, No.: 20FJYB037.
Institutional Review Board Statement
Not applicable.
Informed Consent Statement
Not applicable.
Data Availability Statement
The data that support our research findings are available from the corresponding author on request.
Acknowledgments
The authors like to thank the Resources and Environment Science and Data Center, Chinese Academy of Sciences, for provided us with remote sensing interpretation data, and we also thank S. Hao and M. Adnan for their support and help with this study.
Conflicts of Interest
The authors declare no conflict of interest in this study.
References
- MEA. Ecosystems and Human Well-Being; Synthesis Island Press: Washington, DC, USA, 2005. [Google Scholar]
- Yeea, H.; Paulukonis, E.; Simmons, C.; Russell, M.; Fulford, R.; Harwell, L.; Smitha, L.M. Projecting effects of land use change on human well-being through changes in ecosystem services. Ecol. Model. 2021, 440, 109358. [Google Scholar] [CrossRef] [PubMed]
- Zhao, Y.B.; Zhang, W.W.; Li, C.S.; Ma, S.F.; Zhang, X.W.; Jiang, H.Y. Disturbances Brought about by Human Activities in Relation to the Eco-Environment of the Main Stream of the Tarim River, 2000–2020. Land 2022, 11, 424. [Google Scholar] [CrossRef]
- Bennett, E.M.; Cramer, W.; Begossi, A.; Cundill, G.; Diaz, S.; Egoh, B.N.; Geijzendorffer, I.R.; Krug, C.B.; Lavorel, S.; Lazos, E. Linking biodiversity, ecosystem services, and human well-being: Three challenges for designing research for sustainability. Curr. Opin. Environ. Sustain. 2015, 14, 76–85. [Google Scholar] [CrossRef]
- Nastran, M.; Pintar, M.; Železnikar, Š.; Cvejić, R. Stakeholders’ Perceptions on the Role of Urban Green Infrastructure in Providing Ecosystem Services for Human Well-Being. Land 2022, 11, 299. [Google Scholar] [CrossRef]
- Zhou, Z.X.; Liu, X.F.; Zheng, B.J.; Robinson, G.M.; Song, B.J. Agricultural Transformation and Its Impact on Ecosystem Services and Human Well-Being in Peri-Urban Areas: The Case of Xi’an, China. Land 2022, 11, 110. [Google Scholar] [CrossRef]
- Willis, C.; Papathanasopoulou, E.; Russel, D.; Artioli, Y. Harmful algal blooms: The impacts on cultural ecosystem services and human well-being in a case study setting, Cornwall, UK. Mar. Policy 2018, 97, 232–238. [Google Scholar] [CrossRef]
- Noack, E.M.; Schüler, S. Rural development and human well-being: Do pillar-II-programmes take into account ecosystem services? A study in Lower Saxony, Germany. Environ. Sci. Policy 2020, 106, 191–200. [Google Scholar] [CrossRef]
- Liebenow, D.K.; Cohen, M.J.; Gumbricht, T.; Shepherd, K.D.; Shepherd, G. Do ecosystem services influence household wealth in rural Mali? Ecol. Econ. 2012, 82, 33–44. [Google Scholar] [CrossRef]
- Delgado, L.E.; Marín, V.H. Well-being and the use of ecosystem services by rural households of the Río Cruces watershed, southern Chile. Ecosyst. Serv. 2016, 21, 81–91. [Google Scholar] [CrossRef]
- Chamia, D.E.; Daccache, A.; Moujabber, M.E. What are the impacts of sugarcane production on ecosystem services and human well-being? Ann. Agric. Sci. 2020, 65, 188–199. [Google Scholar] [CrossRef]
- Peng, B.H.; Sheng, X.; Wei, G. Does environmental protection promote economic development? From the perspective of coupling coordination between environmental protection and economic development. Environ. Sci. Pollut. Res. 2020, 27, 39135–39148. [Google Scholar] [CrossRef] [PubMed]
- Zheng, H.; Wang, L.J.; Peng, W.J.; Zhang, C.P.; Li, C.; Robinson, B.E.; Wu, X.C.; Ouyang, Z.Y.; Daily, G.C. Realizing the values of natural capital for inclusive, sustainable development: Informing China’s new ecological development strategy. Proc. Natl. Acad. Sci. USA 2019, 116, 8623–8628. [Google Scholar] [CrossRef] [PubMed] [Green Version]
- Jiang, W.; Wu, T.; Fu, B.J. The value of ecosystem services in China: A systematic review for twenty years. Ecosyst. Serv. 2021, 52, 101365. [Google Scholar] [CrossRef]
- Xu, Z.; Peng, J.; Dong, J. Spatial correlation between the changes of ecosystem service supply and demand: An ecological zoning approach. Landsc. Urban Plan. 2022, 217, 104258. [Google Scholar] [CrossRef]
- Shen, J.S.; Li, S.C.; Liu, L.B.; Liang, Z.; Wang, Y.Y.; Wang, H.; Wu, S.Y. Uncovering the relationships between ecosystem services and social-ecological drivers at different spatial scales in the Beijing-Tianjin-Hebei region. J. Clean. Prod. 2021, 290, 125193. [Google Scholar] [CrossRef]
- Sun, Y.X.; Liu, S.L.; Dong, Y.H.; An, Y.; Shi, F.N.; Dong, S.K.; Liu, G.H. Spatio-temporal evolution scenarios and the coupling analysis of ecosystem services with land use change in China. Sci. Total Environ. 2019, 681, 211–225. [Google Scholar] [CrossRef]
- Xiao, R.; Lin, M.; Fei, X.F.; Li, Y.S.; Zhang, Z.H.; Meng, Q.X. Exploring the interactive coercing relationship between urbanization and ecosystem service value in the Shanghai–Hangzhou Bay Metropolitan Region. J. Clean. Prod. 2020, 253, 119803. [Google Scholar] [CrossRef]
- Ouyang, X.; Tang, L.S.; Wei, X.; Li, Y.H. Spatial interaction between urbanization and ecosystem services in Chinese urban agglomerations. Land Use Policy 2021, 109, 105587. [Google Scholar] [CrossRef]
- Chen, W.; Chi, G. Urbanization and ecosystem services: The multi-scale spatial spillover effects and spatial variations. Land Use Policy 2022, 114, 105964. [Google Scholar] [CrossRef]
- Wang, S.; Hu, M.M.; Wang, Y.F.; Xia, B.C. Dynamics of ecosystem services in response to urbanization across temporal and spatial scales in a mega metropolitan area. Sustain. Cities Soc. 2022, 77, 103561. [Google Scholar] [CrossRef]
- Li, C.; Zheng, H.; Li, S.Z.; Chen, X.S.; Li, J.; Zeng, W.H.; Liang, Y.C.; Polasky, S.; Feldman, M.W.; Ruckelshaus, M.; et al. Impacts of conservation and human development policy across stakeholders and scales. Proc. Natl. Acad. Sci. USA 2015, 112, 7396–7401. [Google Scholar] [CrossRef] [PubMed] [Green Version]
- Hori, J.; Makino, M. The structure of human well-being related to ecosystem services in coastal areas: A comparison among the six North Pacific countries. Mar. Policy 2018, 95, 221–226. [Google Scholar] [CrossRef]
- Cruz-Garcia, G.S.; Sachet, E.; Blundo-Canto, G.; Vanegas, M.; Quintero, M. To what extent have the links between ecosystem services and human well-being been researched in Africa, Asia, and Latin America? Ecosyst. Serv. 2017, 25, 201–212. [Google Scholar] [CrossRef]
- Resources and Environment Science and Data Center, Chinese Academy of Sciences (REDC). Remote Sensing Monitoring Data of Land Use in China. Available online: http://www.resdc.cn/Default.aspx (accessed on 11 December 2021).
- Jiang, H.Q.; Wu, W.J.; Wang, J.N.; Yang, W.S.; Gao, Y.M.; Duan, Y.; Ma, G.X.; Wu, C.S.; Shao, J.C. Mapping global value of terrestrial ecosystem services by countries. Ecosyst. Serv. 2021, 52, 101361. [Google Scholar] [CrossRef]
- Ouyang, Z.Y.; Song, C.S.; Zheng, H.; Polasky, S.; Xiao, Y.; Bateman, I.J.; Liu, J.G.; Ruckelshaus, M.; Shi, F.Q.; Xiao, Y.; et al. Using gross ecosystem product (GEP) to value nature in decision making. Proc. Natl. Acad. Sci. USA 2020, 117, 14593–14601. [Google Scholar] [CrossRef]
- Van den Bergh, J.C. A procedure for globally institutionalizing a ‘beyond-GDP’ metric. Ecol. Econ. 2022, 192, 107257. [Google Scholar] [CrossRef]
- Zang, Z.; Zou, X.Q.; Zuo, Z.; Song, Q.C.; Wang, C.L.; Wang, J.J. Impact of landscape patterns on ecological vulnerability and ecosystem service values: An empirical analysis of Yancheng Nature Reserve in China. Ecol. Indic. 2017, 72, 142–152. [Google Scholar] [CrossRef]
- Wu, W.Q.; Wang, W.W.; Zhang, M. Using China’s provincial panel data exploring the interaction between Socio-economic and Eco-environment system. Ecol. Complex. 2020, 44, 100873. [Google Scholar] [CrossRef]
- Zheng, D.F.; Zhang, Y.; Zang, Z.; Sun, C.Z. The Driving Forces and Synergistic Effect between Regional Economic Growth, Resources and the Environment in the Yangtze River Economic Zone. J. Resour. Ecol. 2014, 5, 203–210. [Google Scholar]
- Wang, S.J.; Kong, W.; Ren, L.; Zhi, D.D.; Dai, B.T. Research on misuses and modification of coupling coordination degree model in China. J. Nat. Resour. 2021, 36, 793–810. [Google Scholar] [CrossRef]
- Yao, L.; Yu, Z.N.; Wu, M.Y.; Ning, J.C.; Lv, T.G. The Spatiotemporal Evolution and Trend Prediction of Ecological Wellbeing Performance in China. Land 2021, 10, 12. [Google Scholar] [CrossRef]
- Yang, C.; Wei, T.X.; Li, Y.R. Simulation and Spatio-Temporal Variation Characteristics of LULC in the Context of Urbanization Construction and Ecological Restoration in the Yellow River Basin. Sustainability 2022, 14, 789. [Google Scholar] [CrossRef]
- Villasante, S.; Lopescd, P.F.M.; Coll, M. The role of marine ecosystem services for human well-being: Disentangling synergies and trade-offs at multiple scales. Ecosyst. Serv. 2016, 17, 1–4. [Google Scholar] [CrossRef]
- Chen, H.; Yan, W.T.; Li, Z.H.; Wende, W.; Xiao, S.L.; Wan, S.L.; Li, S.J. Spatial patterns of associations among ecosystem services across different spatial scales in metropolitan areas: A case study of Shanghai, China. Ecol. Indic. 2022, 136, 108682. [Google Scholar] [CrossRef]
- Liu, L.M.; Wu, J.G. Ecosystem services-human wellbeing relationships vary with spatial scales and indicators: The case of China. Resour. Conserv. Recycl. 2021, 172, 105662. [Google Scholar] [CrossRef]
- Ouyang, Z.Y.; Zheng, H.; Xiao, Y.; Polasky, S.; Liu, J.G.; Xu, W.H.; Wang, Q.; Zhang, L.; Xiao, Y.; Rao, E.M.; et al. Improvements in ecosystem services from investments in natural capital. Science 2016, 352, 1455–1459. [Google Scholar] [CrossRef]
- Duan, P.Z. Influence of China’s Population Mobility on the Change of Regional Disparity since 1978. China Popul. Resour. Environ. 2008, 18, 27–33. [Google Scholar]
- He, J.; Wang, H. Economic structure, development policy and environmental quality: An empirical analysis of environmental Kuznets curves with Chinese municipal data. Ecol. Econ. 2012, 76, 49–59. [Google Scholar] [CrossRef] [Green Version]
Publisher’s Note: MDPI stays neutral with regard to jurisdictional claims in published maps and institutional affiliations. |
© 2022 by the authors. Licensee MDPI, Basel, Switzerland. This article is an open access article distributed under the terms and conditions of the Creative Commons Attribution (CC BY) license (https://creativecommons.org/licenses/by/4.0/).