Article

Comprehensive Resilience Assessment of Complex Urban Public Spaces: A Perspective of Promoting Sustainability

1
School of Economics and Management, Chongqing University of Posts and Telecommunications, Chongqing 400065, China
2
Chongqing Innovation Center of Industrial Big-Data Co., Ltd., National Engineering Laboratory for Industrial Big-Data Application Technology, Chongqing 400707, China
3
School of Engineering, RMIT University, Melbourne, VIC 3001, Australia
*
Author to whom correspondence should be addressed.
Land 2022, 11(6), 842; https://doi.org/10.3390/land11060842
Submission received: 24 April 2022 / Revised: 29 May 2022 / Accepted: 2 June 2022 / Published: 4 June 2022
(This article belongs to the Special Issue Urban Regeneration and Sustainable Construction Management)

Abstract

:
Complex urban systems, such as multi-floor rail transit stations and integrated railway transport hubs, are termed “complex urban public spaces” (CUPSs). These CUPSs facilitate people’s lives, but, at the same time, are threatened by various risks due to their multi-floor structure, dense crowds, high correlation in multi-function, complex facilities, and space openness. The risk events of CUPSs could have a negative influence on public safety and further influence sustainable development. Increasing the resilience of CUPSs is an effective way to respond to risks and guarantee public safety. Therefore, it is necessary to first assess the resilience of CUPSs. In this paper, a six-level comprehensive resilience indicator system was established based on aspects of the essence of resilience. Used in combination with the methods of resilience impact score and fuzzy analytical hierarchy process, the resilience value could be calculated. The Shenzhen North Railway Station (SZ) and the Guangzhou South Railway Station (GZ) were used to validate the proposed methodology. The established resilience indicator system was shown to be comprehensive and innovative, and, regarding practicality, the proposed assessment methodology is convenient to use. This research can help policymakers to assess the resilience of CUPSs and develop relevant policies to improve the resilience of buildings, which can further enhance urban sustainability.

1. Introduction

Urban public spaces are playing an increasingly important role in people’s lives. National Urban Policies Driving Public Space Led Urban Development, first published in Nairobi by United Nations Human Settlements Programme (UN-Habitat) in 2020, emphasizes the importance of mainstreaming safe, inclusive, and barrier-free public space into national urban policies [1]. With the development of urban renewal systems and policies in Western developed countries, promoting the intensive utilization of space, resources, and energy has gradually become an important factor of urban development [2]. At the same time, the rise of postmodernism in the West determines the internal diversity and complexity of urban spatial structure and function, which has attracted the extensive attention of Western scholars such as Jane Jacobs [3], Robert Venturi [4], and Charles Jenks [5]. Accordingly, over the past few years and considering the worldwide context, there is increasing engagement with urban public spaces based on views to intensively utilize land resources and facilitate people’s lives, and general examples of such spaces include integrated railway transport hubs, multi-floor rail transit stations, and commercial centers. Practical cases include the Beijing South Railway Station in China, Clementi Rail Transit Station in Singapore (combined with a commercial center), Seoul Station in Korea, and Hartsfield–Jackson Atlanta International Airport in the United States, among others. These types of buildings are associated with three obvious characteristics, which are multi-floor structure, multi-function integration, and high-density passenger flows. Such buildings can be analyzed by using the complex system theory, by which the system complexity is indicated through nonlinearity and emergence features. In the mentioned buildings, various kinds of components, including functional facilities and connections in the multi-floor structure, demonstrate the two features. Thus, the buildings could be recognized as complex systems, which are termed “complex urban public spaces” (CUPSs). CUPSs were the research object of this study and mainly include integrated railway transport hubs, multi-floor rail transit stations, and commercial centers in the worldwide cities.
CUPSs facilitate people’s daily lives. However, due to the system characteristics of multi-floor structure, dense and changeable crowds, high correlation in multi-function, complex facilities and equipment, and openness in terms of space, CUPSs are also threatened by various kinds of risks, such as fire, accidents, terrorist attacks, etc. Examples include the Daegu metro fire on 19 February 2003, the explosion events in the Beijing Capital International Airport on 20 July 2013, the Hong Kong metro fire on 10 February 2017, and the explosion that occurred at a railway station in Baltimore, Maryland, on 30 December 2021 [6,7,8]. Thus, CUPSs are buildings in urban areas that face risk in daily operation. Because CUPSs are subsystems of urban systems, the risks for CUPSs also threaten urban public safety and sustainable development. The concept “resilience” has been a point of focus in recent research and is defined as the ability to reduce the duration and/or magnitude of risk events, which includes the abilities to anticipate, absorb, adapt to, and recover from risk events [9]. To guarantee both the safe daily operation of CUPSs and urban sustainable development, ensuring the adequate resilience abilities of CUPS systems is vital. The higher resilience of CUPSs, the higher abilities of the system in preventing and responding to risk events.
Different CUPSs have different levels of resilience. Resilience assessment is a key factor in explaining the determinants of disaster resilience, which is conducive to disaster risk reduction and system resilience promotion. Accordingly, this research mainly focused on the resilience assessment of CUPSs based on the essence of resilience. A comprehensive six-level resilience assessment indicator system was established. Literature research, field investigation, expert interviews, resilience impact score (RIS), and fuzzy analytical hierarchy process (FAHP) were utilized. The aim of this research was to calculate system comprehensive resilience value. The paper is organized as follows. The second section is a literature review. The third section introduces and describes the research materials and methods, including for the establishment of the resilience indicator system and resilience assessment. The fourth section describes the case studies that were conducted. The proposed resilience assessment methodology was implemented and validated in two case studies. The fifth section is discussion, and the sixth section is the conclusion.

2. Literature Review

This section firstly reviews the existing studies of urban/community/infrastructure resilience assessment and then discusses the existing research. The aim of the literature review is firstly to show that some resilience assessment frameworks with various kinds of categorized indicators have been utilized, which served as useful references for this research. Then, the resilience assessment methods review demonstrates some models and algorithms that are used in the specific resilience assessment research scenarios. Combining characteristics of the established indicator system and CUPSs, the applicability of the existing methods was considered in this research. The existing research mainly covers two aspects, which are the resilience contents and assessment methods.

2.1. Resilience Contents

The resilience contents are generally the details of resilience from multiple subdimensions. Resilience has three key features: robustness, resourcefulness, and rapid recovery [10,11]. In the process of analyzing resilience, resilience can be divided into three stages: disaster prevention, damage propagation, and recovery, which correspond to resistance, absorption, and recovery [12]. In the existing research, five dimensions have been emphasized in many resilience studies, including society, economy, infrastructure, environment, and physics. Jonas Joerin et al. established a climate-related community disaster resilience framework considering three dimensions: physical, social, and economic [13]. Saud Ali Alshehri et al. established a framework for assessing community resilience, covering social, environmental, economic, health and wellbeing, governance, information, and communication [14]. Rajarshi DasGupta and Rajib Shaw proposed a resilience assessment framework for coastal communities, including five dimensions: physics, institution, socioeconomics, ecology, and environment [15]. Christopher G. Burton has established a set of externally validated flexibility assessment indicators, including six subparts, namely society, economy, institutions, infrastructure, community capital, and environment [16]. D.K. Yoon et al. constructed a set of indicators to evaluate community resilience index (CDRI) from human, social, environmental, institutional, and economic factors [17]. Zahra Assarkhaniki et al. conceptualized 21 different resilience dimensions into five categories: society, economy, system, infrastructure, and environment [18]. Masoud Javadpoor et al. proposed a Baseline Resilience Indicators Framework for communities, including society, economy, community capital, infrastructure and housing, and environment [19]. Seyed MHS Rezvani et al. proposed an Urban Resilience Evaluation System (URES), including five dimensions of environment, economy, organization, society, and technology [20]. Hisham Tariq et al. developed an adaptive community disaster resilience framework, which includes six key disaster resilience dimensions: physical, health, economy, environment, society, and governance [21].
In addition, some resilience assessments have been conducted according to the deconstruction of the “resilience” concept. Paul Arbon et al. proposed a community resilience model, including community connectedness, risk and vulnerability, planning and procedures, and available resources [22]. Yadong Dong et al. proposed a framework to quantify the resilience of individual residential buildings with simultaneous inclusion of hurricane damage assessment and recovery time analysis [23]. Daniela P. González et al. developed a framework for risk and resilience monitoring. The risk dimension includes exposure and vulnerability, while the resilience dimension includes municipal revenues and local development [24]. It has been verified that assessing resilience based on the subdimensions is a useful strategy.
In this research, the resilience assessment indicator system was established based on the essence of resilience. The absorptive, adaptive, and restorative capacity are the three main types of resilience capacity [25]. Some reports in which the meaning of resilience were considered include [12,14,15,16,17,22,23,24,26,27,28,29]. In particular, the two reports Critical Infrastructure Resilience Final Report and Recommendations (report #1) [11], by the National Infrastructure Advisory Council (NIAC), and Constructing a Resilience Index for the Enhanced Critical Infrastructure Protection Program (report #2) [10], by the Argonne National Laboratory (ANL), provide useful references. These two reports focus on the critical infrastructure resilience research and, appropriately, CUPSs are typical critical infrastructures in the urban system. Report #1 proposed the three operational terms of resilience, which are robustness, rapid recovery, and resourcefulness. Robustness is the ability to prevent or mitigate risks and maintain the key operational functions in the face of crisis, which corresponds to the absorptive capacity. Rapid recovery is the ability to reconstitute or return to normal operations as efficiently as possible after a risk event, which corresponds to the adaptive and restorative capacity. Resourcefulness is the ability to skillfully prepare for and respond to a risk event, which corresponds to all three capacities of resilience. In report #2, based on the three operational terms, the ANL constituted the major components and subcomponents of resilience, and a five-level resilience system was constructed [10]. In accordance with the two authoritative reports, the three terms of resilience, namely robustness, rapid recovery, and resourcefulness, demonstrate the essence of resilience. The above-cited examples in the literature provide references for this research.

2.2. Resilience Assessment Methods

The resilience assessment methods used in the existing research include different kinds of mathematical models and algorithms.
Firstly, various mathematical models have been established. Min Ouyang et al. used a practical grid model and several hypothetical resilience-improved models to compute the annual resilience of an infrastructure system under random hazards [12]. Min Ouyang and Leonardo Dueñas-Osorio introduced a comprehensive probabilistic modeling approach, including hurricane hazard, power system performance, component fragility, and system recovery model, to quantify the power system resilience [30]. Ouyang and Wang proposed a resilience assessment framework for interdependent infrastructure systems that comprises four steps: descriptions of interdependencies, modeling of component fragilities, cascading failures, and restoration [27]. In refs. [30] and [27], resilience assessment was conducted through model establishment, and the models consider the characteristics of hurricane hazard, power system, and the interdependencies of infrastructure systems. Thus, the models were proposed according to the research problems or the characteristics of research objects. Marta Bottero et al. proposed a comprehensive method based on system dynamics model (SDM) and network analysis (ANP) to evaluate the possible impact of two different urban scenarios on urban resilience performance over time [31]. Liudan Jiao et al. studied the mechanism of urban rail transit stations rainstorm disaster vulnerability by combining interpretive structure model (ISM) and social network analysis (SNA) [32]. Xinghua Feng et al. constructed the elasticity index system as the framework of ECP (“exposure”, “connectivity”, and “potential”), and the adaptive cycle model was introduced into the resilience assessment framework [33].
In addition, mathematical algorithms are also the main methods in resilience assessment research, including in logistic regression analysis [34,35], weighted sum calculation [10], multivariate analyses [16], analytic hierarchy process [14], weighted mean score [15], weighted regression, and ordinary least squares regression [17], among others. Su-Chin Chen et al. proposed a method to evaluate the disaster resistance of hillside communities, including logistic regression analysis and geographic information system technology [34,35]. Based on the five-level elastic system constructed by Fisher et al., the system resilience value was obtained by using weighted sum calculation level by level [10]. Christopher G. Burton used comprehensive indicators in community resilience assessment. The steps include identifying relevant variables, multivariate analysis, aggregation, and linking variables with external validation indicators [16]. Saud Ali Alshehri et al. proposed a weighting system for each dimension, and criteria were proposed using the analytic hierarchy process. The system provided a quantitative and qualitative assessment tool to measure community resilience to disasters [14]. After constructing a resilience assessment framework for coastal communities, Rajarshi DasGupta and Rajib Shaw used questionnaires and weighted average scores to calculate the comprehensive resilience score [15]. D.K. Yoon et al. used geographical weighted regression and ordinary least squares regression to measure the resilience of communities to natural disasters based on the constructed resilience index system [17]. Paul Arbon et al. proposed a scorecard to measure community resilience in Australia, which is a workable tool to assess community resilience and formulate plans to strengthen resilience [36]. Based on the vulnerability–capability framework, Zezhao Liu et al. used the RAHP method to determine the standard weight, and used the census data to evaluate the urban resilience [37].
In this research, a six-level resilience indicator system was established. The algorithm weighted sum calculation is useful here, since it considers the different weights of the indicators and produces a comprehensive system resilience value that corresponds with the characteristics of the indicators and the aim of this research.

3. Materials and Methods

In this section, a comprehensive 6-level resilience indicator system was established as detailed in the Section 3.1. Then, the resilience impact score (RIS) and fuzzy analytical hierarchy process (FAHP) are introduced in Section 3.2.1 and Section 3.2.2, which are the methods to determine the resilience impact scores and the indicator weights. Further, the system comprehensive resilience value calculation method is illustrated in the Section 3.2.3.

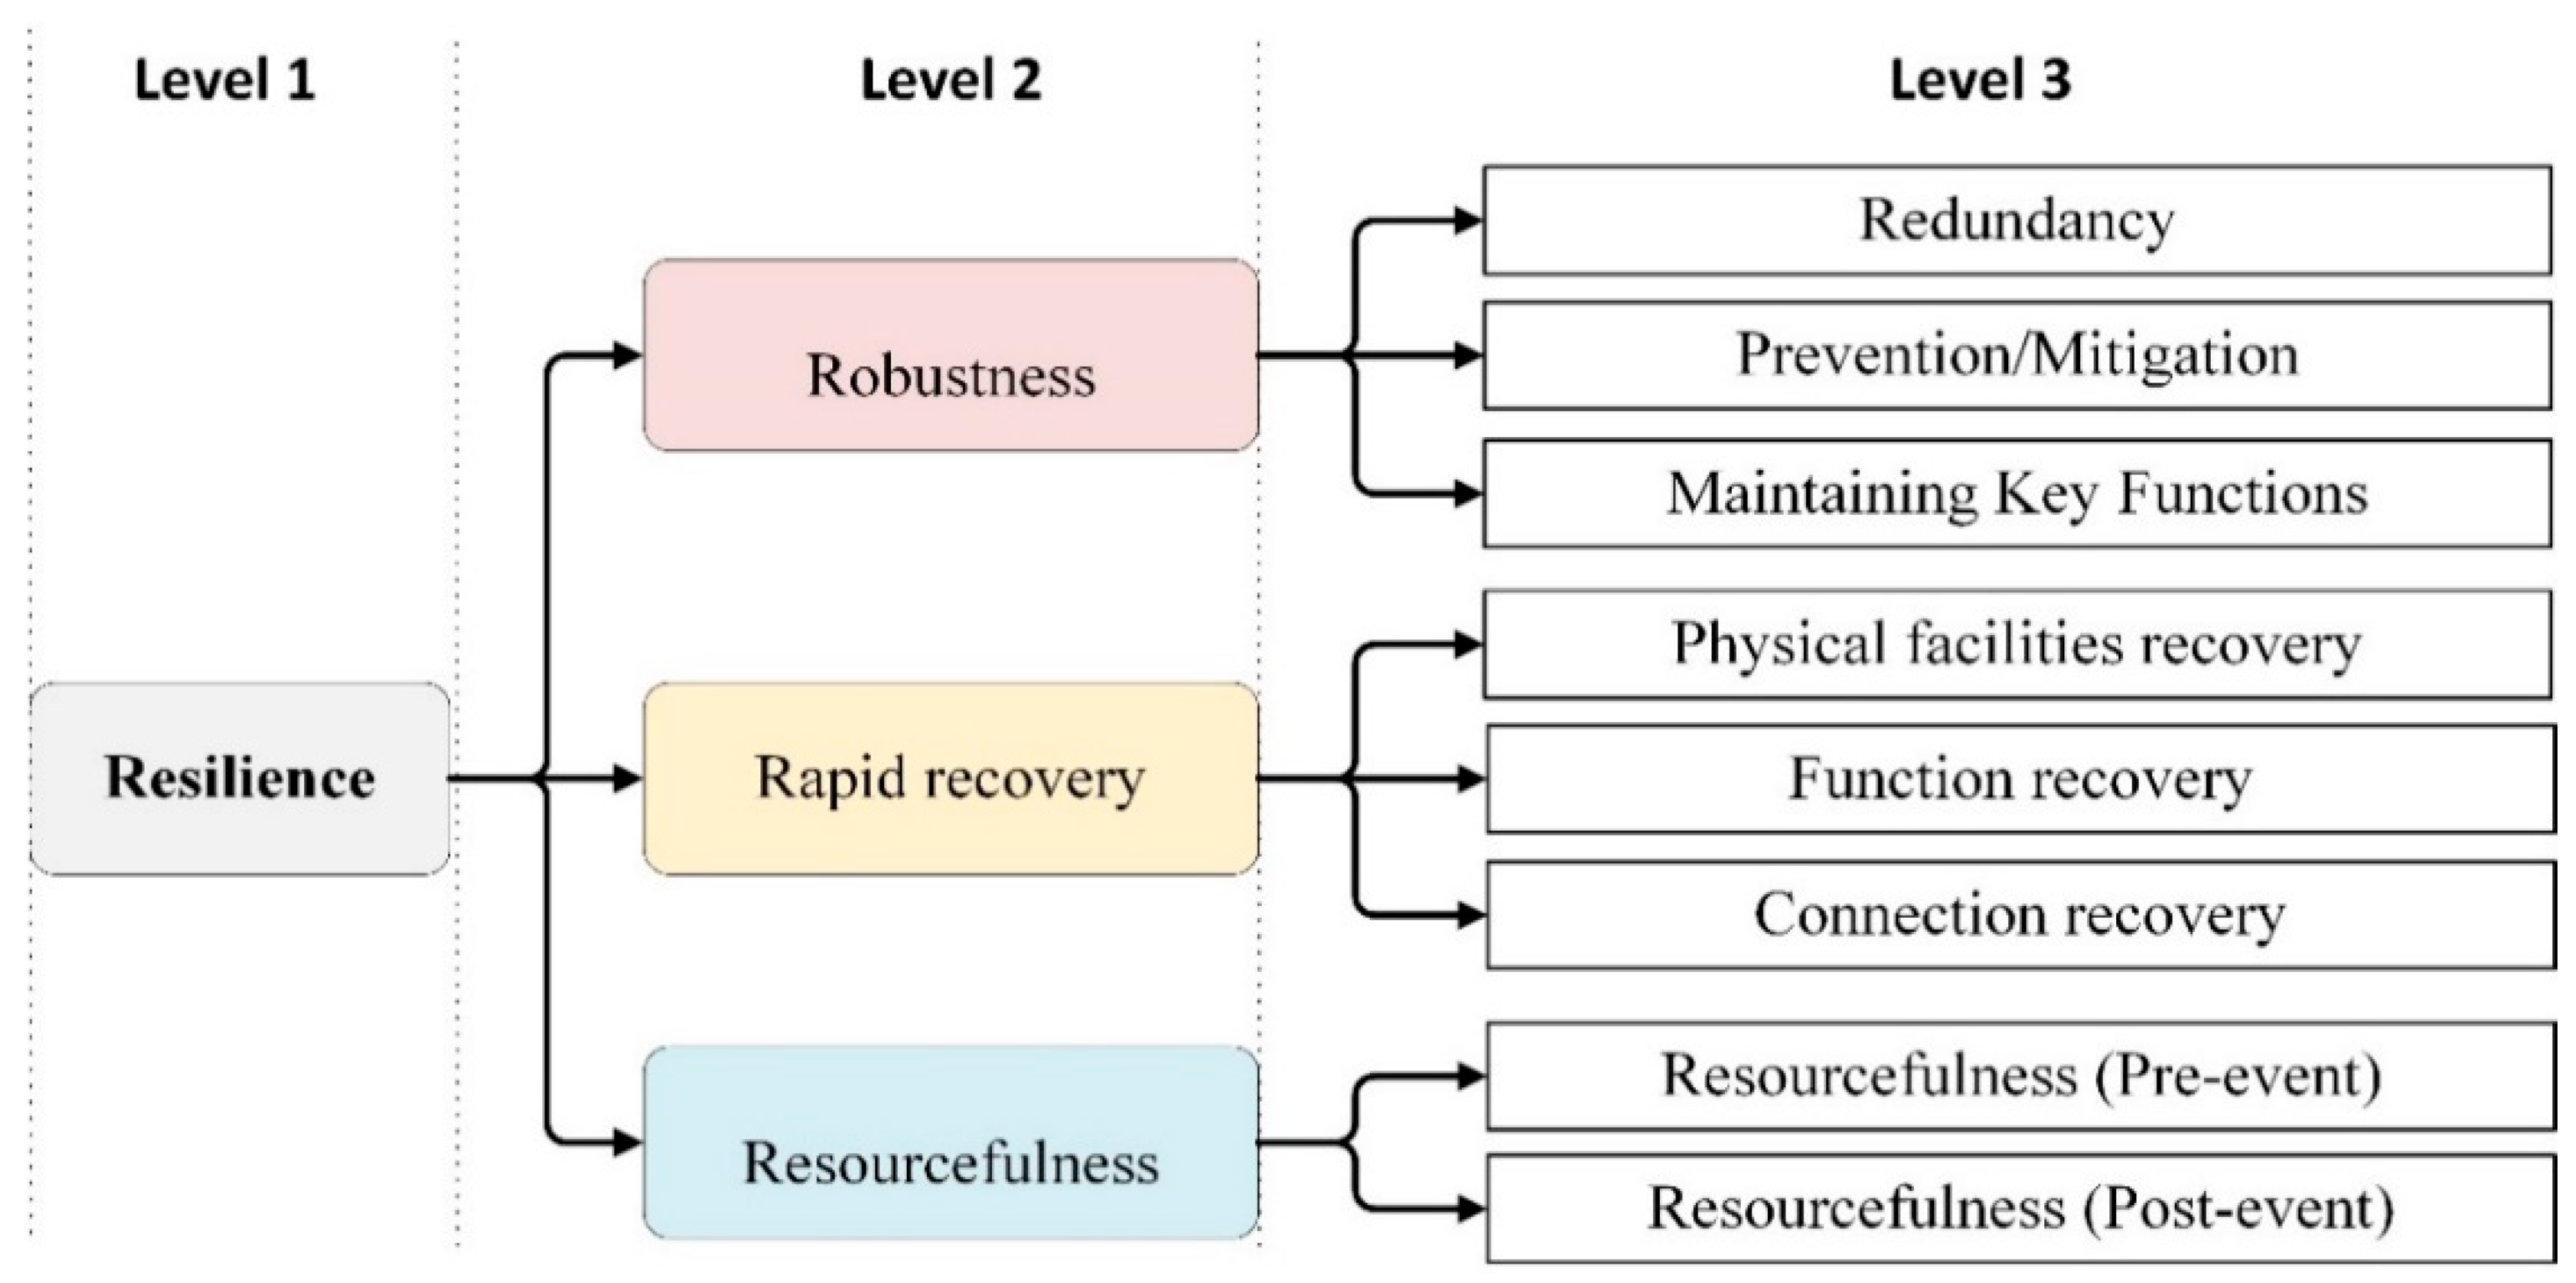
3.1. Resilience Indicator System

The existing studies that provide references were introduced in Section 2. Besides the literature research, field investigation was also used to determine the resilience indicators.

3.1.1. Field Investigation

In this research, the two typical integrated railway transport hubs, Shenzhen North Railway Station (SZ) and the Guangzhou South Railway Station (GZ) in China, were taken as case studies. The two stations are typical CUPSs and have the common features of CUPSs, making them representative CUPSs.
Firstly, both SZ and GZ present typical multi-floor structure characteristics, as illustrated in Table 1.
Secondly, dense and changeable crowds gather in every floor of the two stations. According to the statistics, the departure and arrival passenger flows of SZ reach 600,000 per day, and the rush hours are mainly during the morning (6:50 to 10:00) and from noon (12:00 to 15:00) (Shenzhen Transportation Bureau, 2019). In terms of GZ, 117 million passengers were transported in 2020, with daily departure and arrival passenger flows reaching 320,000 [38].
Thirdly, in both stations, various kinds of traffic modes are integrated in the multi-floor structure, including railway, high-speed railway, bus, rail transit, taxi, private car, intercity traffic, etc., and the functions are linked with each other. The integration of the traffic modes into different floors facilitates passenger transfer, which is a typical characteristic of CUPSs.
Fourthly, complex facilities and equipment exist in these two stations, including stairs, escalators, turnstiles, metal barriers, electric power equipment, fire extinguishing equipment, water supply and drainage equipment, etc. The combination of facilities and equipment is the basis of the station operations.
Fifthly, both stations connect to the external environment and are open to the public. The availability of the public access increases the system risks.
Based on the above five points, the research for SZ and GZ could demonstrate the common characteristics of CUPSs. Field investigations were conducted six times at each of these two stations. The investigations considered the station structure, transfer connections, clusters of crowded people on every floor, and security measures. A comparison of the characteristics of the two CUPSs is shown in Table 1.

3.1.2. Resilience Indicator System

Deeply considering the taxonomy guidelines from the previous studies and the CUPSs special features, the concept “resilience” was deconstructed level by level. The aim of concept deconstruction is to obtain specific indicators that demonstrate changes in resilience through changes in these indicators, such as in terms of different values, whether something is happening or not, or that there has been a change to other situations, etc. Moreover, the specific indicators should also be operational and could be implemented or optimized by managers. Accordingly, a 6-level resilience indicator system was established, as shown in Appendix A Table A1, Table A2 and Table A3.
The 6-level indicator system provides a comprehensive evaluation of CUPS resilience. The first level is the concept “resilience”, which is the main aim of this research. Robustness, rapid recovery, and resourcefulness are the three indicators in level 2, which are the three key features of urban infrastructure resilience. The eight indicators in level 3 are the different aspects/types of the three indicators in level 2. Further, the indicators in level 3 are deconstructed as 23 indicators in level 4, which are the detailed contents of aspects/types of the indicators in level 3. The 71 indicators in level 5 are the illustration for the various aspects of the indicators in level 4. Finally, the 182 indicators in level 6 are the specific characteristics or operational details contents of the indicators in level 5. Indicators in the first 3 levels are shown in Figure 1.
(1)
Robustness
According to the implication of robustness, three components, namely redundancy, prevention/mitigation, and maintaining key functions, are used to demonstrate the term. The 6-level resilience indicators of robustness are shown in Appendix A Table A1.
a.
Redundancy
Redundancy is an attribute of a robust system, which means the overlaps/backups can be used to guarantee the system reliability [7]. In this research, this concept is to demonstrate the components of the system and the overlaps among the components. The indicators in level 4 of redundancy include functional facilities, people, electric power equipment, fire extinguishing equipment, water supply and drainage equipment, and security equipment. The indicators of level 5 are the subcomponents of these indicators. The functional facilities include floors, stairs, escalators, elevators, passages, turnstiles, and metal barriers, and the people consist of passengers, staff, and policemen. The indicators floors, stairs, escalators, elevators, and passengers present the special characteristics of CUPSs. The overlap characteristics of these indicators are demonstrated in level 6. For the indicator floors, 4 subindicators were adopted to present the characteristic of complex multi-layer structure, including connection, area of every floor, total number of floors, and number of underground floors. The characteristics of lots of clusters of crowded people are shown through the 4 indicators of passengers in level 6, including average daily passenger flow, maximum daily passenger flow, number of passenger aggregation nodes, and location of passenger aggregation nodes. In addition, 4 indicators were considered for stairs, including connection, number, width, and length. The connection demonstrates the overlaps between stairs and other facilities, including the function connection and location connection. The number, width, and length determine the degree of overlaps in the connections between different stairs and other facilities.
b.
Prevention/mitigation
Prevention/mitigation is the robustness ability of system to manage risks in the pre-risk event phase and during the risk event. The fifth level indicators of pre-risk event consist of regular inspection and maintenance, component replacement, and disaster prevention/mitigation planning, which emphasize the prevention for risk events. Additionally, the fifth level indicators in the case of events (during event) include emergency rescue and temporary resettlement for victims, both of which are the actions of mitigation risk events. The indicators in level 6 are specific details of the indicators in level 5, including measurement, detailed contents, etc. For instance, frequency and regulations for a specific category of facility/equipment and scope are considered as three subindicators for regular inspection and maintenance, which illustrate the measurement and detailed contents. In addition, subindicators of emergency rescue demonstrate the components considered in emergency rescue preparation.
c.
Maintaining key functions
Maintaining key functions is the major aim of the system robustness ability. The three key functions of CUPSs are arrival/departure and transfer. Design and facilities are two aspects of the functions related to the system robustness ability. The design of CUPSs is the operation regulation rules, while facilities are the physical component of the system. The indicators in level 6 are the illustration of these two aspects. For example, for the function arrival/departure, the design could be demonstrated through four indicators, including management regulations, arrival/departure procedures, spatial function design, and backup plan, while for the function transfer, the facilities comprise interfloor connection and instructions.
(2)
Rapid recovery
The rapid recovery comprises three types of recovery, including physical facilities recovery, function recovery, and connection recovery. The 6-level resilience indicators of rapid recovery are shown in Appendix A Table A2.
a.
Physical facilities recovery
Physical facilities recovery is the main content and foundation of the CUPSs recovery. Depending on the damage condition of the original physical facilities, two strategies of recovery are included, namely repair and reconstruction. The two strategies could be implemented through the local government’s own endeavor or in coordination with support from the central government or other local governments. The indicators in level 6 illustrate four elements of physical facilities recovery, which are capital, technology, personnel, and recovery rapidity, among which the recovery rapidity is influenced by the other three elements.
b.
Function recovery
Based on the physical facilities recovery, function recovery is a necessary step for the operation recovery of CUPSs. The functions of CUPSs include the key functions and additional functions. Key functions of CUPSs are arrival/departure and transfer. Additional functions include business, cultural display, etc. Function recovery has one of three conditions, which are original function level, higher than the original functional level, and lower than the original functional level. One important level 6 indicator is recovery rapidity, which represents the recovery performance. In addition, function variations (adding and reducing functions) represent the recovery workload, which should also be considered in function recovery.
c.
Connection recovery
After completion of physical facilities’ recovery and function recovery, connection recovery is the third step of recovery. Connections in CUPSs include the internal connections and external connections. The internal connections consist of physics connection and function connection. Further, in level 6, the indicators are the rapidity and connection contents, including recovery rapidity, number of connections, and number of facilities/functions category. The external connections consist of transfer connection and social influence. Moreover, rapidity and connection contents are subindicators in level 6.
(3)
Resourcefulness
Resourcefulness includes pre-event measures and post-event measures. The 6-level resilience indicators of resourcefulness are shown in Appendix A Table A3.
a.
Resourcefulness (Pre-event)
The pre-event resourcefulness includes awareness, training exercises, protective measures, and stockpiles. Firstly, three subindicators are in the scope of awareness, including system existing resources, system vulnerability, and resource shortage. Awareness is the managers’ self-evaluation of the CUPS system, and the indicators in level 6 include system disaster response ability judgment, system risks identification, system vulnerability assessment, amount of resource shortage, categories of resource shortage, and access to resources. Secondly, training and exercises are strategies to enhance the system risk response ability in the pre-event stage. Three kinds of training are included, which are system security plan training, emergency action training, and recovery action training. In addition, system testing is also necessary for the evaluation of system resources and system skills. The sixth level is the further presentation of training and exercises, including access for personnel, contents of training, and type of training/exercise. Thirdly, protective measures are the prepared protection strategies in the pre-event stage, including real-time communications, facilities protection, and security protection. The last one is stockpiles and comprising four types of resources, including electric power, disaster relief materials, medical supplies, and food/water. The indicators in level 6 are mainly concerned with measurement of the amount of resources and the potential support.
b.
Resourcefulness (Post-event)
The post-event resourcefulness includes three aspects, which are response, alternative sites, and new resources. Response is the main action in the post-event stage. The resourcefulness of response could be presented through four subindicators, including minimum response time, on-site capability, response equipment, and emergency action procedure. The indicators in level 6 are the detailed contents of the four aspects. For example, the detailed contents of minimum response time include two indicators, distance and accessibility. Alternative sites represent the resource for victim resettlement and CUPS operation. Additionally, alternative equipment, support for the alternative sites, and people’s health at sites should also be considered. In level 6, the accessibility and capacity of the sites are presented, and transportation support, communication support, and logistics support are considered as subindicators of support. New resources are presented as three types, which are rescue resources, resettlement resources, and recovery resources. The subindicators in level 6 demonstrate resource types and availability.

3.2. Resilience Assessment Methods

Calculating the system comprehensive resilience value was the aim of this research. The indicator quantification method should consider the influence of indicators on the system resilience with scenarios that indicators vary in terms of value/happening/change. The risk ranking method risk matrix (RM) is able to quantify the risks with the consideration of risk impact and probability of occurrence, which provides a useful reference for this research. Referring to the method RM, the resilience impact score (RIS) is proposed, which is a suitable method for the resilience impact score determination.
Considering that the obtained resilience impact score cannot be directly summed due to the different weights of the indicators in the system resilience assessment, a method for determination the weight of indicators is also needed. Analytic hierarchy process (AHP) is a useful method that has been adopted in many studies to demonstrate the experts/decision makers’ opinions, and the weights of qualitative hierarchical indicators can be determined without the requirement for historical data [14,39,40]. However, it is still unable to accurately reflect human thinking styles [41]. In addition, AHP has also been criticized due to the utilization of unbalanced scale of judgment and the inability to handle the inherent uncertainty in the pair-wise comparison [42]. The developed fuzzy analytical hierarchy process (FAHP) could overcome these shortcomings and be used to solve hierarchical problems [41]. This method is based on the hierarchical model of system indicators and uses fuzzy mathematics [43]. FAHP was adopted in this research to determine the weights of the indicators.
The resilience impact scores are the absolute values that show the degree of influence on the system resilience, while the weights determined through FAHP are the values of every indicator relative to others. The overlap of the two methods promotes their applicability in this research. The scope of the system comprehensive resilience value is [0, 100].

3.2.1. Resilience Impact Score (RIS)

RIS originates from the risk ranking method risk matrix (RM). RM considers risk in the aspects of impact and probability of occurrence. In the aspect of risk impact, the five categories critical, serious, moderate, minor, and negligible are used. As for probability of occurrence, five categories are also listed, including 0–10%, 11–40%, 41–60%, 61–90%, and 91–100% [44]. Referring to the two aspects and combining the characteristics of the CUPS resilience indicators, the RIS determination criteria were proposed, as shown in Table 2.
The utilization of Table 2 follows two steps. The first step is determining the resilience impact category. The second step is deciding a score corresponding to the resilience impact category. The scores are divided according to whether their impact is positive or negative. If the indicator has a positive impact on system resilience and could increase system resilience, then the score has a positive value; otherwise, it is negative. For example, for the indicator “area of every floor”, the resilience impact category is firstly determined as “moderate”, and the indicator has positive impact on system resilience; thus, the score is in the range of 41~60. Then, according to the field investigation and comparison to other CUPSs, the score could be determined as a precise number, such as 50.

3.2.2. Fuzzy Analytical Hierarchy Process (FAHP)

The FAHP method is adopted in this research to determine the weights of indicators from level 2 to level 5. The three steps of this method are as follows.
Step 1:
Construction of fuzzy complementary matrixes.
The values in the cells of fuzzy complementary matrix reflect subjective judgments for the importance of each indicator toward other indicators in the hierarchical structure. A 0.1–0.9 scale was used, as shown in Table 3. This scale was chosen considering practicality, being intuitive and in line with how people tend to think, which makes it easy to be used by experts or decision makers. The fuzzy complementary matrix is
R = ( R i j ) n × n     0 R i j 1 ,   i , j I , I = { 1 , 2 , , n }
where in the matrix, the scale that x i to x j is R i j , then the scale of x j to x i is R j i = 1 R i j . n is the number of the indicators.
The values in the cells of the fuzzy complementary matrix reflect subjective judgments for the importance of each indicator toward other indicators in the hierarchical structure. The 0.1–0.9 scale was used, as shown in Table 3. Similarly to earlier, this scale was selected considering practicality.
Step 2:
Transforming to fuzzy consistent matrix.
Sum fuzzy complementary matrix R by rows and record as r i = k = 1 n R i k , i I , then transform fuzzy complementary matrix into fuzzy consistent matrix, as follows:
r i j = r i r j 2 n + 0.5
where R i k is the k j -th scale in the i -th row in the fuzzy complementary matrix, r i j is the transferred index in the fuzzy consistent matrix.
Step 3:
Weight calculation.
The weight of the indicator is determined through the ranking method and calculated by using Equation (3),
w i = 1 n 1 2 a + 1 n a j = 1 n r i j
where a = ( n 1 ) / 2 , w i is the weight of the indicator.

3.2.3. System Comprehensive Resilience Value Calculation

To calculate the system comprehensive resilience value, the first step is to obtain the average resilience impact scores of the indicators in level 6. Then, the weights of indicators from level 5 to 2 could be determined by using FAHP, level by level. Correspondingly, the system resilience value is calculated through the weighted sum method, from level 5 to 1. The resilience value of every indicator is calculated using Equation (4),
R l j i = j = 1 n w j ( i 1 ) × R l i 1
where R l j i is the resilience value of the j -th indicator in level i , w j ( i 1 ) is the weight of the j -th indicator in level i 1 , and n is the number of subindicators in level i 1 for the j -th indicator of level i .

4. Case Study

The system resilience values of the two case studies, Shenzhen North Railway Station (SZ) and Guangzhou South Railway Station (GZ), were calculated using the proposed methods.

4.1. Resilience Assessment Steps

The assessment implementation contains four steps. The sample calculation table is presented in Table 4. To clearly display the results of every level, the results are highlighted in different colors as follows: level 1 (yellow), level 2 (purple), level 3 (green), level 4 (orange), level 5 (blue), and level 6 (white).
Firstly, the resilience impact scores of the indicators in level 6 were determined according to the criteria and procedures demonstrated in Section 3.2.1. As shown in Table 4, the scores of the nine indicators in level 6 were determined with consideration of the CUPSs characteristics. For example, due to the daily management pressure and emergency rescue pressure, the passenger number presented a negative relationship with the system resilience. The crowded people clusters of SZ showed more obvious features than GZ in number and location. One reason is that the structure of SZ is more complex than GZ, and another is that SZ connects with a commercial plaza. In addition, the staff and policemen in SZ are superior to GZ in number, location, and equipment.
Secondly, weights of the indicators in level 5 could be obtained using FAHP. Four associate professors, who conducted the field investigation, were invited to determine the fuzzy complementary matrixes of the indicators in level 5 for the two stations. Then, the judgment matrix was input into the FAHP program in Matlab and the weights calculated.
Thirdly, the resilience values of the indicators in level 5 were calculated according to Equation (4).
Fourthly, the second and third steps were each repeated for indicators of levels 4, 3, and 2 in succession. The comprehensive resilience value of the system is the sum of the resilience values of indicators in level 2.
The system comprehensive resilience values of SZ and GZ were 65.38 and 60.38, respectively. Therefore, SZ showed higher system resilience than GZ. In detail, the resilience values of the indicators in levels 2–5 are shown in Figure 2.

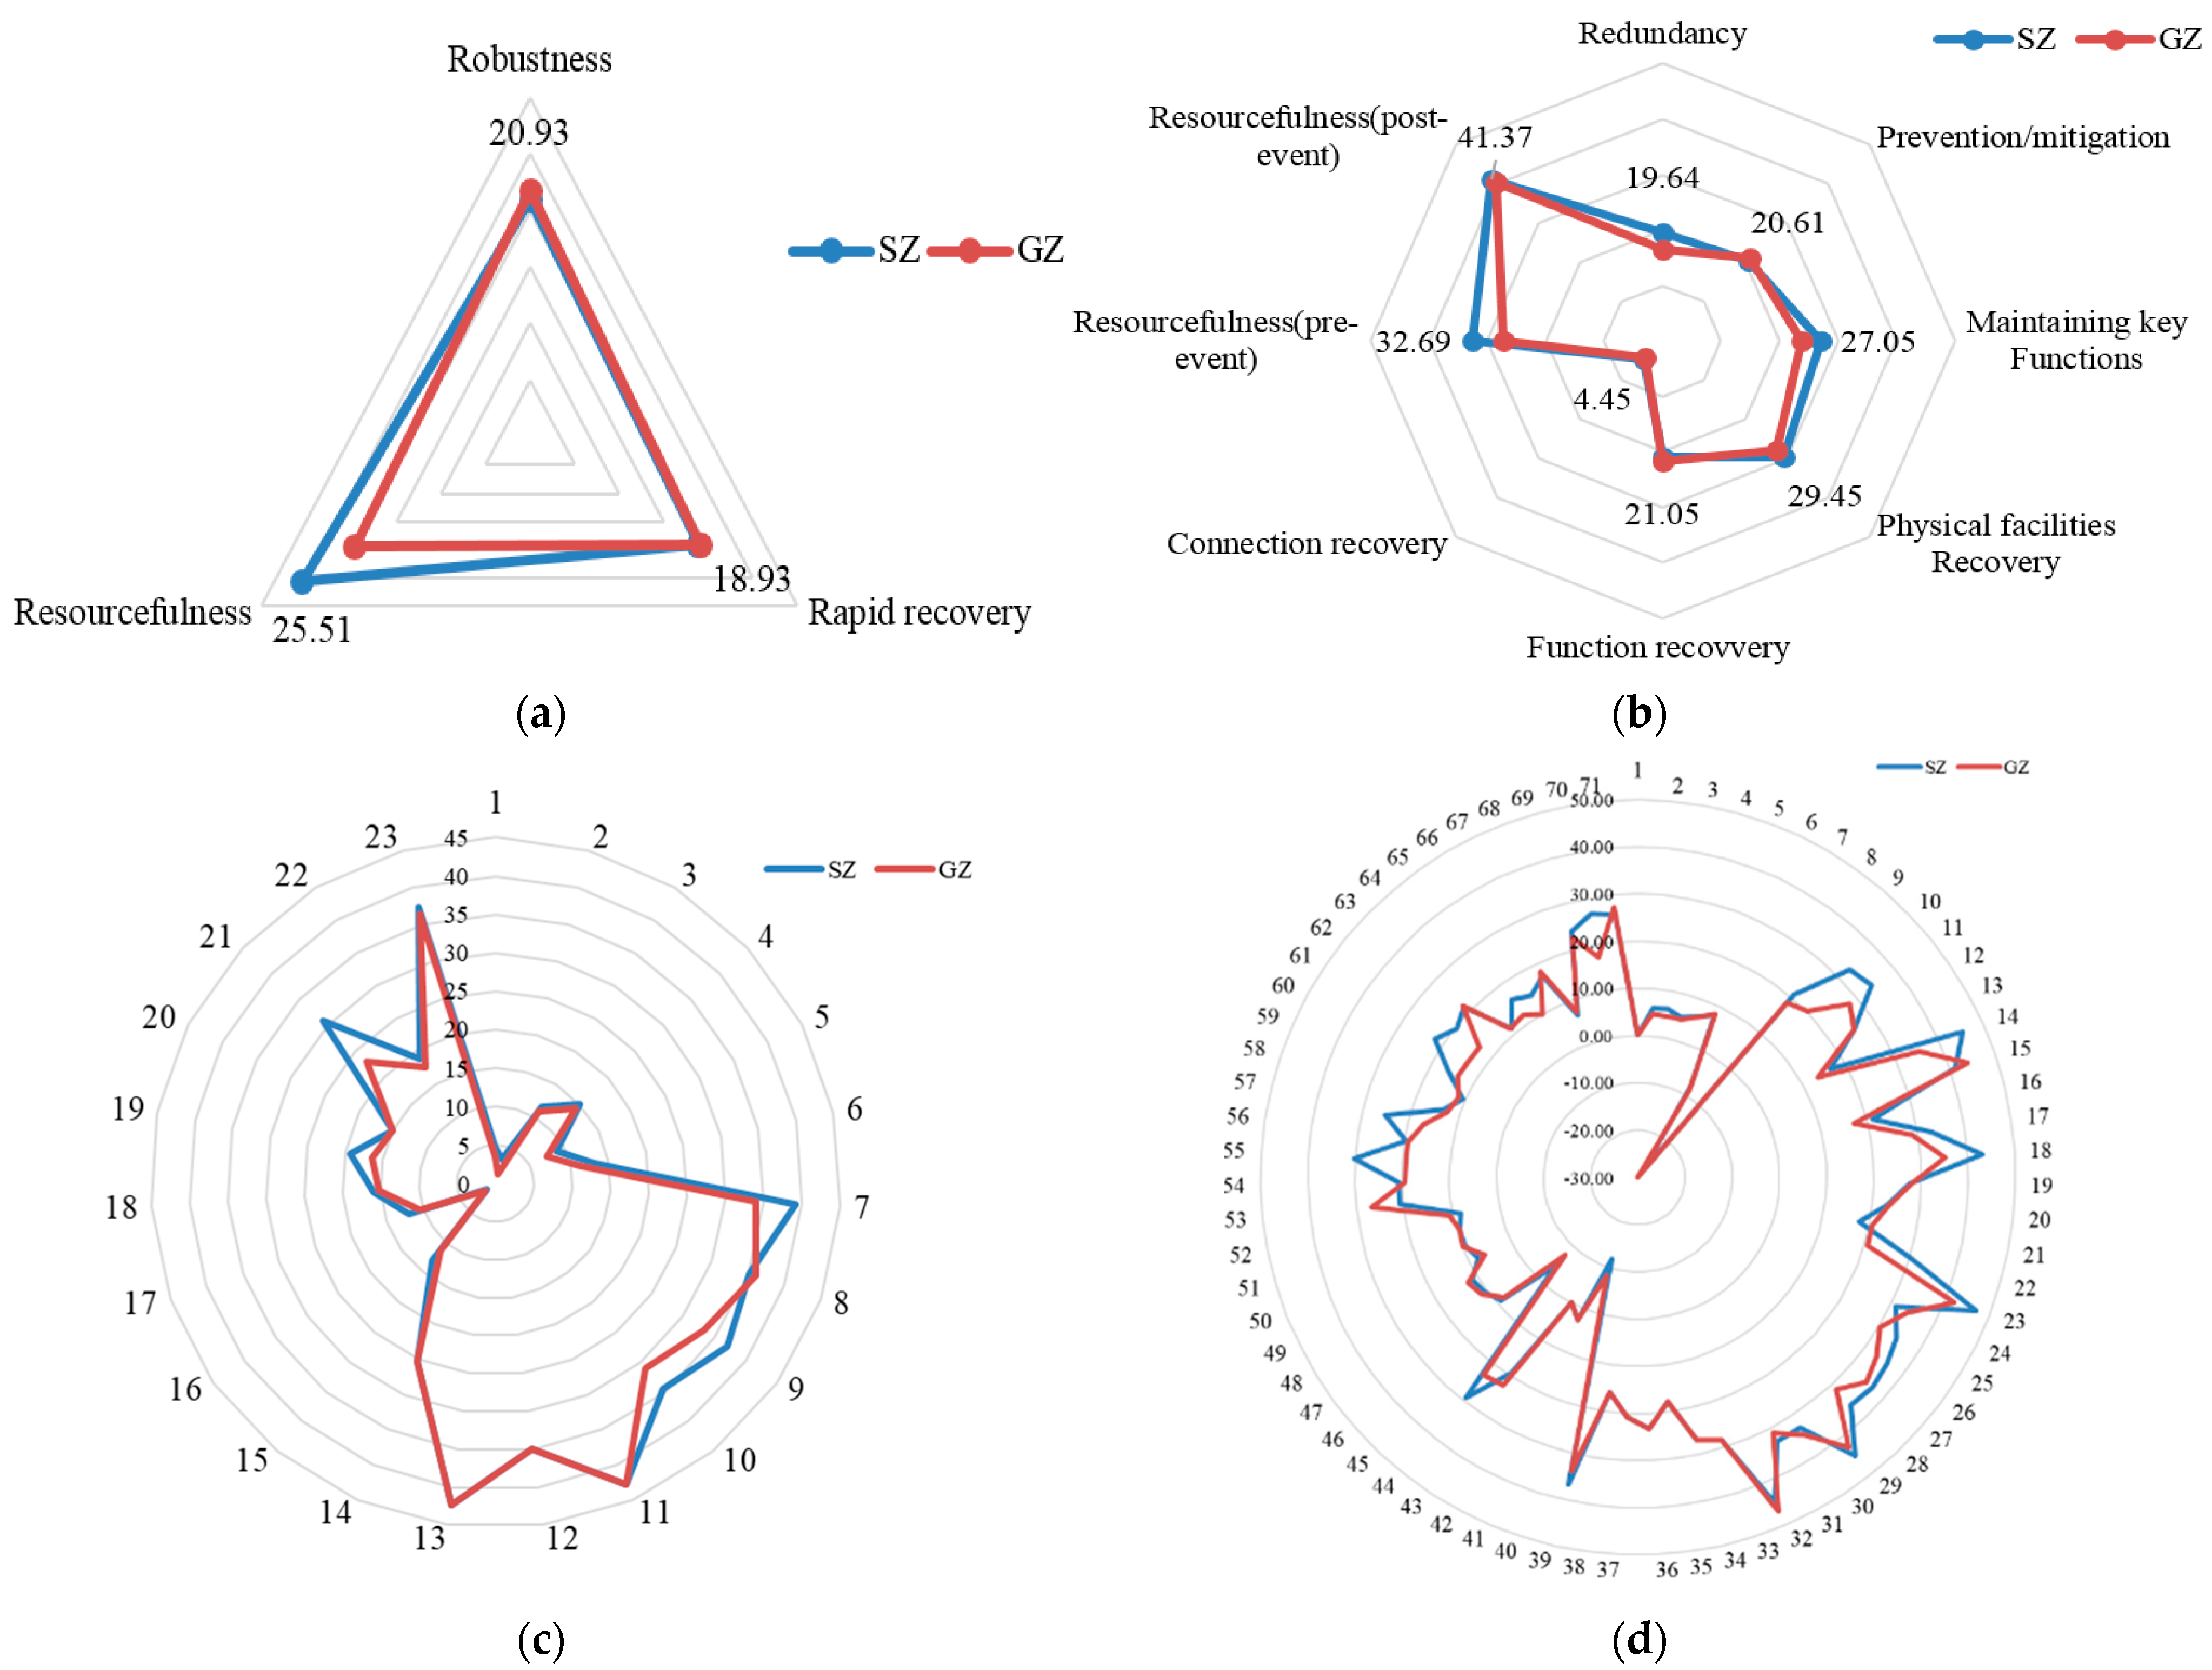
4.2. Comparison between the Two CUPS Cases

According to Figure 2, the four level indicators of SZ and GZ showed similar trends. However, some indicators were significantly different between the two CUPSs. The absolute resilience value differences of indicators of SZ and GZ in the four levels ranged from 0 to 12.69. The indicators with a difference of more than three are shown in Table 5, which demonstrates a distinctive distance.
According to Table 5, the indicators of resourcefulness in level 2, redundancy, maintaining key functions, and resourcefulness (pre-event) in level 3 showed obvious differences. Accordingly, obvious differences were present between some of the related subindicators in levels 4 and 5.
(1)
Resourcefulness
As for resourcefulness, especially resourcefulness (pre-event), the results correspond to the practical contents obtained from the field investigation. SZ presented two advantages compared with GZ. One is in terms of security measures. Policemen are distributed in different key points of the station, including the entrances of stairs/escalators/elevators, the passenger aggregation nodes, etc. Another is that there are plenty emergency rescue stockpiles/equipment in an independent space in SZ, which guarantees emergency rescue. This is reflected in detail by the indicators in level 5, including system existing resources, system vulnerability, resource shortage, real-time communications, security protection, and disaster relief materials. The adequacy of prepared resources for disaster prevention/mitigation is reflected through the indicators of resource shortage and disaster relief materials, which results in reduced system vulnerability and a higher supply of security protection for CUPSs. The resourcefulness (post-event) of SZ was superior to that of GZ, which is reflected through the indicator response in level 4 and the indicators on-site capability, response equipment, alternative operation sites, alternative equipment, and resettlement resources in level 5. The post-disaster response ability mainly includes on-site capability and response equipment. The field investigation in the two CUPSs revealed that SZ has more on-site disaster response resources than GZ, including in terms of policemen and response equipment. In addition, there is an independent joint police service office in SZ to guarantee the station safety and an abundance of resources prepared for the post-disaster use, including alternative equipment and resettlement resources. However, the larger number and more complex system existing resources of SZ also showed high redundancy, which may lead to more difficulties in responding quickly to risk event compared with GZ. In terms of the aspect of alternative operation sites, the function distribution of SZ is divided into different floors, allowing supply from more alternative operation sites in case of disaster emergency in comparison with the concentrated distribution in GZ.
(2)
Redundancy
The indicator redundancy demonstrates the components of CUPSs and the overlaps among them. Both stations have large numbers of components, including functional facilities, different kinds of equipment, and various connections among the components. According to the detailed indicators in level 5, SZ showed advantages compared with GZ, especially in the aspects of people and several types of equipment. In the aspects of people, the number of policemen is obviously higher in SZ than in GZ. As for equipment, the electric power equipment includes the indicators of connection facilities operation support and air conditioner support. The connection facilities among different transportation mode include the interfloor connections and passages in every floor. The connection facilities in SZ present the characteristics of having more interfloor connections and short passages than GZ, which are more convenient for daily operation and in emergencies. Moreover, the SZ connects to a commercial center, and the air conditioner support is systematically managed. Accordingly, the resilience values of these two indicators were higher for SZ than for GZ. The fire extinguishing equipment includes the fixed fire extinguishing equipment, and the water supply and drainage equipment includes daily water supply and drainage equipment as well as emergency water supply and drainage equipment. These facilities were judged according to the field investigation and the facilities in the east side and west side of SZ, which are more accessible than in GZ and could increase resilience in cases of fires and floods. In addition, the security equipment of SZ is superior to GZ for violent terrorist attack prevention in the aspects of number and category. All policemen in SZ are equipped with explosion-proof clothing compared with very few in GZ. Besides, explosion-proof tanks, anti-collision ball, and metal barriers are used in the two stations. The number of explosion-proof tanks is higher in SZ than in GZ due to the higher number of floors, with explosion-proof tanks distributed on every floor.
(3)
Maintaining key functions
The indicator maintaining key function includes the two main functions of the stations, which are arrival/departure and transfer (indicators in level 4). In SZ, both the arrival and transfer functions are found in two floors on the east side, 1F and 2F, and the departure function in two underground floors on the west side of the station, B1 and B2. In the GZ, the functions of departure, arrival, and transfer are all on two floors, 2F and 3F. The division of the functions in different floors could promote risk diversification for the entire station. Therefore, considering risk resistance, SZ showed advantages over GZ in the aspect of spatial function design (level 5 indicator). In addition, the transfer functions of SZ are more convenient than GZ in the aspects of interfloor connections and instructions, such as that the instructions for the different transportation modes, the exits, etc., in SZ have very striking features that are easily understood by people, which are the details of facilities (level 5 indicator).
Besides the above three categories, in level 4, the indicator prevention/mitigation includes two subindicators, pre-risk event and during event, which demonstrate the risk prevention measures that are taken before a risk event and response measured during a risk event. In the aspects of disaster prevention/mitigation planning (pre-risk event) and emergency rescue (during event), SZ showed advantages with more professional rescue equipment. In addition, the indicator connection recovery in level 3 showed the lowest resilience values. This demonstrates that the connection recovery faces more potential difficulties. Connection recovery includes the internal connections and external connections, in which the function connection and transfer connection presented a negative relationship with the system resilience. For example, the number of function connections and function category are negative indicators of system resilience. The more connections, the more vulnerable the system. Connection recovery is a very important aspect of system operation, and thus some measures should be taken to guarantee the continuous operation of the system.

5. Discussion

5.1. Resilience Enhancement Measures

Based on the analysis and comparison of SZ and GZ, some resilience enhancement measures could be made accordingly and supply references for other CUPSs regarding security management.
(1)
Every key point of the CUPSs should be guarded by policemen.
The key points of the CUPSs include the entrances of stairs/escalators/elevators, the passenger aggregation nodes, etc. The security staff at every key point and should be able to master the dynamics of the security work at any time. It should also be possible to implement the emergency measures in time according to the emergency plan. The responsibility for each security staff in the key points should be clearly defined such that they can take responsibility for their jurisdiction. All sites are independent of each other yet also linked to each other to preserve the CUPS security.
(2)
Emergency rescue stockpiles should be placed in an independent space in the CUPSs.
Strengthening material reserves and ensuring emergency materials are important for emergency management. It is suggested that an independent space be established according to the characteristics of the CUPSs, which is then used for storing emergency rescue stockpiles, including loudspeakers, waterproof gear, fire extinguishers, metal barriers, rain shoes, etc. Moreover, a transportation guarantee mechanism should also be set up to ensure all kinds of material reserves can be placed in time.
(3)
Security equipment should be prepared adequately, especially violent terrorist attack prevention equipment.
Security equipment represents high importance in an emergency response, which can be evaluated according to number and category. The higher the progressiveness of the equipment, the more accurate the results of the security inspection, and the potential hazards can be minimized. Violent terrorist attack prevention equipment is particularly important considering the density of internal personnel and the complex, highly mobile, and restricted environment of the CUPSs.
(4)
Instructions for passengers, including directions to the safety areas, voice broadcasts, evacuation commands from professional staff or policemen, etc., should be legible, striking, and comprehensive.
The purpose of the passenger signage system is to guide passengers through the whole journey safely, smoothly, and quickly, so as to avoid the congestion caused by passengers stuck in the CUPSs. The direction of the safety area, voice broadcast, professional or police evacuation instructions and other guidance signs must be clear, eye-catching, and comprehensive, to guide passengers to leave the dangerous area smoothly.
(5)
The function connections and transfer connections are major recovery tasks, and there should be backup strategies for the connections to enhance system resilience.
The number and category of functional connection and transfer connection are negatively correlated with system resilience. The higher the number of connections, the more vulnerable the system. Connection recovery is important in ensuring system operation, and the recovery rapidity should be guaranteed to enhance the CUPS system resilience.

5.2. The Features of the Proposed Resilience Assessment Method

The proposed resilience assessment method has two favorable features, which are comprehensive consideration and convenience.
Firstly, we outline the feature of comprehensive consideration. In the established resilience assessment indicator system, the concept resilience is deconstructed from level 1 to 6. In total, 182 indicators are in level 6, which are operational and can be implemented or optimized by managers. The 6 levels of indicators allow comprehensive consideration of the CUPS characteristics and include the structure complexity, passenger characteristics, main facilities, disaster prevention/mitigation measures, main functions, post-disaster recovery categories, system resources for pre-event and post-event use, etc. In the existing research, such as in [10,11,12,22,23,45,46,47,48], the concept “resilience” is also classified into subdimensions from the angle of concept decomposition, which are the absorptive capacity, adaptive capacity, and restorative capacity. Nevertheless, there is no such comprehensive resilience indicator system established based on the three capacities.
The second feature of the proposed resilience assessment method is its convenience. Experts should be invited to determine the resilience impact scores of the indicators in level 6 and fuzzy complementary matrixes from level 5 to 2. Then, with the help of Matlab, the weights of indicators in every level could be obtained using FHAP. The system resilience value calculation only needs to input the resilience impact scores and weights from the experts’ judgments. The proposed resilience assessment method converts the qualitative indicators into quantitative system resilience values. The algorithm can be edited in Excel and implemented in an intuitive interface. Some comparable resilience assessment models have been used in the literature, such as in [12,30,49], and statistical methods such as factor analysis, principal component analysis, and multivariate regression analysis [50], as well as algorithms such as multivariate analyses [16], weighted regression and ordinary least squares regression [17,51], etc., that have complex formulas or algorithms. Therefore, the resilience assessment method proposed in this research has an intuitive interface and is relatively convenient to use.

6. Conclusions

Considering the complex system characteristics, this research proposed the concept CUPSs. CUPSs have been constructed in many urban areas in recent years. Due to their complex structure and crowds of people, ensuring the safe operation of CUPSs should be an area of focus. This paper investigated the safety of CUPSs from the perspective of resilience. The common features of CUPSs that are related to the building resilience were summarized in this research, which are required for resilience assessment and have not previously been documented. Then, this paper proposed a methodology for the resilience assessment of CUPSs. A comprehensive resilience indicator system for the quantitative resilience assessment of CUPSs was established, which supplies a firm foundation for resilience assessment. Based on the resilience indicator system, the methods RIS and FAHP were used to quantify the resilience indicators and obtain the system resilience value. The proposed CUPS resilience assessment methodology could be used by managers of CUPSs to assess the resilience and establish appropriate management measures. Some urban management policies could also be devised by policy makers according to the assessment results toward further guaranteeing public safety and increasing system resilience. Moreover, the results of research on the resilience assessment of CUPSs also provide insights and suggestions for practical ways to increase the sustainability of CUPS systems.
In the future, corresponding resilience assessment systems can be developed for specific types of CUPSs, such as railway stations and airports, with more targeted and accurate application of resilience assessment.

Author Contributions

Conceptualization, H.X.; methodology, H.X. and Y.T.; software, H.X.; validation, H.X.; formal analysis, H.X.; investigation, H.X.; resources, H.X.; data curation, H.X. and S.L.; writing—original draft preparation, H.X. and S.L.; writing—review and editing, H.X., Y.T. and B.X.; visualization, H.X. and S.L.; supervision, H.X.; funding acquisition, H.X. All authors have read and agreed to the published version of the manuscript.

Funding

This research was funded by The General Project of Chongqing Natural Science Foundation (Grant No. cstc2021jcyj-msxmX0951); The Key Humanities and Social Science Research Program of Chongqing Municipal Education Commission in 2021 (Grant No. 21SKGH061); The China Postdoctoral Science Foundation (Grant No. 2021M700617); The Science and Technology Research Program of Chongqing Municipal Education Commission (Grant No. KJQN202000631); The Innovative Project of Chongqing Oversea Study Innovation Program (Grant No. cx2020035).

Institutional Review Board Statement

Not applicable.

Informed Consent Statement

Not applicable.

Data Availability Statement

The data of this study is collected through the investigation for the Shenzhen North Railway Station (SZ) and the Guangzhou South Railway Station (GZ) in China.

Conflicts of Interest

The authors declare no conflict of interest.

Appendix A

Table A1. Resilience indicators of robustness.
Level 1Level 2Level 3Level 4Level 5Level 6
ResilienceRobustnessRedundancyFunctional facilitiesFloors1. Connection
2. Area of every floor
3. Total number of floors
4. Number of underground floors
Stairs5. Connection
6. Number
7. Width
8. Length
Escalators9. Connection
10. Number
11. Width
12. Length
13. Running speed
Elevators14. Connection
15. Number
16. Area
Passages17. Connection
18. Number
19. Width
20. Length
Turnstiles21. Connection
22. Number
23. Width
Metal barriers24. Connection
25. Number
26. Length
27. Location
PeoplePassengers28. Average daily passenger flow
29. Maximum daily passenger flow
30. Number of passenger aggregation nodes
31. Location of passenger aggregation nodes
Staff32. Number
33. Location
Policeman34. Number
35. Location
36. Police equipment
Electric power equipmentConnection facilities operation support37. On-site backup generation
38. Internal generation
39. Connection
Lighting support40. On-site backup generation
41. Uninterrupted power
42. Internal generation
43. Connection
Air conditioner support44. On-site backup generation
45. Uninterrupted power
46. Internal generation
47. Connection
Fire extinguishing equipmentFixed fire extinguishing equipment48. Connection
49. Number
50. Category
51. Location
Mobile fire extinguishing equipment52. Number
53. Category
54. Distribution location
Water supply and drainage equipmentDaily water supply and drainage equipment55. Connection
56. Daily inspection
Emergency water supply and drainage equipment57. Connection
58. Daily inspection
59. Amount of water supply and drainage equipment
Security equipmentViolent terrorist attack prevention equipment60. Connection
61. Number
62. Category
63. Daily inspection
Security screening equipment64. Connection
65. Number
Prevention/MitigationPre-risk eventRegular inspection and maintenance66. Frequency
67. Regulations for specific category of facility/equipment
68. Scope
Component replacement69. Replacement cycle
70. Regulations for specific category of facility/equipment
71. Scope
Disaster prevention/mitigation planning72. Disaster monitoring planning
73. Disaster mitigation strategies
74. Contingency plan
During eventEmergency rescue75. Rescue resources supply
76. Professional rescue teams
77. Rescue time
Temporary resettlement for victims78. Temporary resettlement shelters
79. Life necessaries distribution
80. Protection measures for resettlement areas
Maintaining Key FunctionsArrival/departureDesign81. Management regulations
82. Arrival/departure procedures
83. Spatial function design
84. Backup plan
Facilities85. Inter floor connection
86. Entrance and exit
87. Instructions
TransferDesign88. Mode of transportation
89. Transfer convenience
90. Backup plan
Facilities91. Inter floor connection
92. Instructions
Table A2. Resilience indicators of rapid recovery.
Level 1Level 2Level 3Level 4Level 5Level 6
ResilienceRapid RecoveryPhysical facilities recoveryRepairIndependent93. Capital
94. Technology
95. Personnel
96. Recovery rapidity
Coordinate97. Capital
98. Technology
99. Personnel
100. Recovery rapidity
ReconstructionIndependent101. Capital
102. Technology
103. Personnel
104. Recovery rapidity
Coordinate105. Capital
106. Technology
107. Personnel
108. Recovery rapidity
Function recoveryKey functionsOriginal function level109. Recovery rapidity
Higher than the original functional level110. Recovery rapidity
111. Added function
Lower than the original functional level112. Recovery rapidity
113. Reduced function
Additional functionsOriginal function level114. Recovery rapidity
Higher than the original functional level115. Recovery rapidity
116. Added function
Lower than the original functional level117. Recovery rapidity
118. Reduced function
Connection recoveryInternal connectionsPhysics connection119. Recovery rapidity
120. Number of physics connections
121. Number of connected facilities’ category
Function connection122. Recovery rapidity
123. Number of function connections
124. Number of connected functions’ category
External connectionsTransfer connection125. Recovery rapidity
126. Number of connections with other urban functions
Social influence127. Recovery rapidity
128. Decisive role for other urban functions
Table A3. Resilience indicators of resourcefulness.
Level 1Level 2Level 3Level 4Level 5Level 6
ResilienceResourcefulnessResourcefulness(Pre-event) AwarenessSystem existing resources129. System disaster response ability judgment
System vulnerability130. System risks identification
131. System vulnerability assessment
Resource shortage132. Amount of resource shortage
133. Categories of resource shortage
134. Access to resources
Training and exercisesSystem security plan training 135. Access for personnel
136. Contents of training
137. Type of training
Emergency action training 138. Access for personnel
139. Type of training
Recovery action training140. Access for personnel
141. Type of training
System security plan exercises142. Type of exercises
Emergency action exercises143. Type of exercises
Recovery action exercises144. Type of exercises
System Testing145. Amount of resources
146. System skills
Protective MeasuresReal time communications147. Communication equipment
148. Applicable distance
Facilities protection149. Protection rules for specific facility
150. Personnel assignment
Security protection151. Personnel assignment
152. Security equipment
StockpilesElectric power153. On-site backup generation
154. Duration of backup
Disaster relief materials155. Amount of materials
156. Categories of materials
Medical supplies157. Existing medical supplies
158. Potential medical resources
Food/water159. Amount of food/water
Resourcefulness(Post-event)ResponseMinimum response time160. Distance
161. Accessibility
On-site capability162. Response ability assessment
163. Response ability enhancement strategies
Response equipment164. On-site equipment
165. Equipment supply
Emergency action procedure166. Emergency action procedure exercise
Alternative sitesAlternative resettlement sites167. Accessibility of the sites
168. Capacity of the sites
Alternative operation sites169. Accessibility of the sites
170. Capacity of the sites
Alternative equipment171. Capability to perform essential functions
Support172. Transportation support
173. Communication support
174. Logistics support
Consideration of health175. Sites disinfection
176. Sites sanitation
New resourcesRescue resources177. Resources types
178. Resource availability
Resettlement resources179. Resources types
180. Resource availability
Recovery resources181. Resources types
182. Resource availability

References

  1. United Nations Human Settlements Programme (UN-Habitat). National Urban Policies Driving Public Space Led Urban Development. 2020. Available online: https://unhabitat.org/sites/default/files/2020/07/national-urban-policies-driving-public-space-led-urban-development.pdf (accessed on 15 December 2021).
  2. Jiangsu Urban and Rural Development Research Center. A Series of Studies on Urban Renewal: Review of Urban Renewal Systems and Policies in Western Developed Countries. 2018. Available online: http://www.upnews.cn/archives/57965 (accessed on 16 December 2021).
  3. Jacobs, J. The Death and Life of Great American Cities; Jin, H., Translator; Yilin Press: Beijing, China, 2016; ISBN 9787806578575. [Google Scholar]
  4. Venturi, R. Complexity and Contradiction in Architecture; Water & Power Press: Beijing, China, 2006; ISBN 9787508433462. [Google Scholar]
  5. Jenks, C. The Language of Post-Modern Architecture; Li, D., Translator; Architecture & Building Press: Beijing, China, 1986; ISBN 9787112003563. [Google Scholar]
  6. China Daily. Otis Bullish on China Despite Accident. 2011. Available online: https://www.chinadaily.com.cn/bizchina/2011-07/08/content_12862833.htm (accessed on 15 December 2021).
  7. Wikipedia. Hong Kong Mass Transit Railway Fire. 2017. Available online: https://www.sohu.com/a/126716329_119038 (accessed on 20 December 2021).
  8. EqualOcean. An Explosion Occurred at a Railway Station in Baltimore, Maryland. 2021. Available online: https://equalocean.com/briefing/20211231230108239 (accessed on 22 January 2022).
  9. Rochas, C.; Kuzņecova, T.; Romagnoli, F. The Concept of the System Resilience within the Infrastructure Dimension: Application to a Latvian Case. J. Clean. Prod. 2015, 88, 358–368. [Google Scholar] [CrossRef]
  10. Argonne National Laboratory. Constructing a Resilience Index for the Enhanced Critical Infrastructure Protection Program. 2010. Available online: https://digital.library.unt.edu/ark:/67531/metadc1015453/m2/1/high_res_d/991101.pdf (accessed on 12 December 2021).
  11. National Infrastructure Advisory Council (NIAC). Critical Infrastructure Resilience, Final Report and Recommendations. 2009. Available online: https://www.dhs.gov/xlibrary/assets/niac/niac_critical_infrastructure_resilience.pdf (accessed on 12 December 2021).
  12. Ouyang, M.; Dueñas-Osorio, L.; Min, X. A Three-Stage Resilience Analysis Framework for Urban Infrastructure Systems. Struct. Saf. 2012, 36–37, 23–31. [Google Scholar] [CrossRef]
  13. Joerin, J.; Shaw, R.; Takeuchi, Y.; Krishnamurthy, R. Assessing Community Resilience to Climate-Related Disasters in Chennai, India. Int. J. Disaster Risk Reduct. 2012, 1, 44–54. [Google Scholar] [CrossRef]
  14. Alshehri, S.A.; Rezgui, Y.; Li, H. Disaster Community Resilience Assessment Method: A Consensus-Based Delphi and AHP Approach. Nat. Hazards 2015, 78, 395–416. [Google Scholar] [CrossRef]
  15. Dasgupta, R.; Shaw, R. An Indicator Based Approach to Assess Coastal Communities’ Resilience against Climate Related Disasters in Indian Sundarbans. J. Coast. Conserv. 2015, 19, 85–101. [Google Scholar] [CrossRef]
  16. Burton, C.G. A Validation of Metrics for Community Resilience to Natural Hazards and Disasters Using the Recovery from Hurricane Katrina as a Case Study. Ann. Assoc. Am. Geogr. 2015, 105, 67–86. [Google Scholar] [CrossRef]
  17. Yoon, D.K.; Kang, J.E.; Brody, S.D.; Kang, J.E.; Brody, S.D. A Measurement of Community Disaster Resilience in Korea. J. Environ. Plan. Manag. 2016, 59, 436–460. [Google Scholar] [CrossRef]
  18. Assarkhaniki, Z.; Rajabifard, A.; Sabri, S. The Conceptualisation of Resilience Dimensions and Comprehensive Quantification of the Associated Indicators: A Systematic Approach. Int. J. Disaster Risk Reduct. 2020, 51, 101840. [Google Scholar] [CrossRef]
  19. Javadpoor, M.; Sharifi, A.; Roosta, M. An Adaptation of the Baseline Resilience Indicators for Communities (BRIC) for Assessing Resilience of Iranian Provinces. Int. J. Disaster Risk Reduct. 2021, 66, 102609. [Google Scholar] [CrossRef]
  20. Rezvani, S.M.; de Almeida, N.M.; Falcão, M.J.; Duarte, M. Enhancing Urban Resilience Evaluation Systems through Automated Rational and Consistent Decision-Making Simulations. Sustain. Cities Soc. 2022, 78, 103612. [Google Scholar] [CrossRef]
  21. Tariq, H.; Pathirage, C.; Fernando, T. Measuring Community Disaster Resilience at Local Levels: An Adaptable Resilience Framework. Int. J. Disaster Risk Reduct. 2021, 62, 102358. [Google Scholar] [CrossRef]
  22. Arbon, P.; Gebbie, K.; Cusack, L.; Perera, S.; Verdonk, S. Developing a Model and Tool to Measure Community Disaster Resilience. Aust. J. Emerg. Manag. 2014, 29, 12–16. [Google Scholar]
  23. Dong, Y.; Asce, M.; Li, Y.; Asce, M. Risk Assessment in Quantification of Hurricane Resilience of Residential Communities. ASCE-ASME J. Risk Uncertain. Eng. Syst. Part A Civ. Eng. 2017, 3, 04017027. [Google Scholar] [CrossRef]
  24. González, D.P.; Monsalve, M.; Moris, R.; Herrera, C. Risk and Resilience Monitor: Development of Multiscale and Multilevel Indicators for Disaster Risk Management for the Communes and Urban Areas of Chile. Appl. Geogr. 2018, 94, 262–271. [Google Scholar] [CrossRef]
  25. Hosseini, S.; Barker, K. Modeling Infrastructure Resilience Using Bayesian Networks: A Case Study of Inland Waterway Ports. Comput. Ind. Eng. 2016, 93, 252–266. [Google Scholar] [CrossRef]
  26. Meerow, S.; Newell, J.P.; Stults, M. Defining Urban Resilience: A Review. Landsc. Urban Plan. 2016, 147, 38–49. [Google Scholar] [CrossRef]
  27. Ouyang, M.; Wang, Z. Resilience Assessment of Interdependent Infrastructure Systems: With a Focus on Joint Restoration Modeling and Analysis. Reliab. Eng. Syst. Saf. 2015, 141, 74–82. [Google Scholar] [CrossRef]
  28. Chou, J.S.; Wu, J.H. Success Factors of Enhanced Disaster Resilience in Urban Community. Nat. Hazards 2014, 74, 661–686. [Google Scholar] [CrossRef]
  29. Francis, R.; Bekera, B. A Metric and Frameworks for Resilience Analysis of Engineered and Infrastructure Systems. Reliab. Eng. Syst. Saf. 2014, 121, 90–103. [Google Scholar] [CrossRef]
  30. Ouyang, M.; Dueñas-Osorio, L. Multi-Dimensional Hurricane Resilience Assessment of Electric Power Systems. Struct. Saf. 2014, 48, 15–24. [Google Scholar] [CrossRef]
  31. Bottero, M.; Datola, G.; de Angelis, E. A System Dynamics Model and Analytic Network Process: An Integrated Approach to Investigate Urban Resilience. Land 2020, 9, 242. [Google Scholar] [CrossRef]
  32. Jiao, L.; Li, D.; Zhang, Y.; Zhu, Y.; Huo, X.; Wu, Y. Identification of the Key Influencing Factors of Urban Rail Transit Station Resilience against Disasters Caused by Rainstorms. Land 2021, 10, 1298. [Google Scholar] [CrossRef]
  33. Feng, X.; Xiu, C.; Li, J.; Zhong, Y. Measuring the Evolution of Urban Resilience Based on the Exposure–Connectedness–Potential (ECP) Approach: A Case Study of Shenyang City, China. Land 2021, 10, 1305. [Google Scholar] [CrossRef]
  34. Chen, S.C.; Ferng, J.W.; Wang, Y.T.; Wu, T.Y.; Wang, J.J. Assessment of Disaster Resilience Capacity of Hillslope Communities with High Risk for Geological Hazards. Eng. Geol. 2008, 98, 86–101. [Google Scholar] [CrossRef]
  35. Chen, S.C.; Wu, C.Y.; Wu, T.Y. Resilient Capacity Assessment for Geological Failure Areas: Examples from Communities Affected by Debris Flow Disaster. Environ. Geol. 2009, 56, 1523–1532. [Google Scholar] [CrossRef]
  36. Arbon, P.; Steenkamp, M.; Cornell, V.; Cusack, L.; Gebbie, K. Measuring Disaster Resilience in Communities and Households: Pragmatic Tools Developed in Australia. Int. J. Disaster Resil. Built Environ. 2016, 7, 201–215. [Google Scholar] [CrossRef]
  37. Liu, Z.; Ma, R.; Wang, H. Assessing Urban Resilience to Public Health Disaster Using the Rough Analytic Hierarchy Process Method: A Regional Study in China. J. Saf. Sci. Resil. 2021, 3, 93–104. [Google Scholar] [CrossRef]
  38. Guangzhou Daily. The Traffic Volume of Guangzhou South Railway Station Will Exceed 117 Million Person Times in 2020! 2021. Available online: https://m.gmw.cn/2021-01/07/content_1302008883.htm (accessed on 20 December 2021).
  39. Pramanik, D.; Haldar, A.; Mondal, S.C.; Naskar, S.K.; Ray, A. Resilient Supplier Selection Using AHP-TOPSIS-QFD under a Fuzzy Environment. Int. J. Manag. Sci. Eng. Manag. 2017, 12, 45–54. [Google Scholar] [CrossRef]
  40. Xu, H.; Xue, B. Key Indicators for the Resilience of Complex Urban Public Spaces. J. Build. Eng. 2017, 12, 306–313. [Google Scholar] [CrossRef]
  41. Kahraman, C.; Ruan, D.; Doǧan, I. Fuzzy Group Decision-Making for Facility Location Selection. Inf. Sci. 2003, 157, 135–153. [Google Scholar] [CrossRef]
  42. Deng, H. Multicriteria Analysis with Fuzzy Pairwise Comparison. Int. J. Approx. Reason. 1999, 21, 215–231. [Google Scholar] [CrossRef] [Green Version]
  43. Yang, J.; Su, J.; Song, L. Selection of Manufacturing Enterprise Innovation Design Project Based on Consumer’s Green Preferences. Sustainbility 2019, 11, 1375. [Google Scholar] [CrossRef] [Green Version]
  44. Garvey, P.R.; Zachary, F. Lansdowne Risk Matrix: An Approach for Identifying, Assessing, and Ranking Program Risk. Air Force J. Logist. 1998, 22, 18–21. [Google Scholar]
  45. Zhang, C.; Kazanci, O.B.; Levinson, R.; Heiselberg, P.; Olesen, B.W.; Chiesa, G.; Sodagar, B.; Ai, Z.; Selkowitz, S.; Zinzi, M.; et al. Resilient Cooling Strategies—A Critical Review and Qualitative Assessment. Energy Build. 2021, 251, 111312. [Google Scholar] [CrossRef]
  46. Patriarca, R.; De Paolis, A.; Costantino, F.; Di Gravio, G. Simulation Model for Simple yet Robust Resilience Assessment Metrics for Engineered Systems. Reliab. Eng. Syst. Saf. 2021, 209, 107467. [Google Scholar] [CrossRef]
  47. Geng, S.; Liu, S.; Fang, Z. A Demand-Based Framework for Resilience Assessment of Multistate Networks under Disruptions. Reliab. Eng. Syst. Saf. 2022, 222, 108423. [Google Scholar] [CrossRef]
  48. Ramadhani, A.; Khan, F.; Colbourne, B.; Ahmed, S.; Taleb-Berrouane, M. Resilience Assessment of Offshore Structures Subjected to Ice Load Considering Complex Dependencies. Reliab. Eng. Syst. Saf. 2022, 222, 108421. [Google Scholar] [CrossRef]
  49. Huang, C.N.; Liou, J.J.H.; Lo, H.W.; Chang, F.J. Building an Assessment Model for Measuring Airport Resilience. J. Air Transp. Manag. 2021, 95, 102101. [Google Scholar] [CrossRef]
  50. Kim, J.T.; Kim, J.; Seong, P.H.; Park, J. Quantitative Resilience Evaluation on Recovery from Emergency Situations in Nuclear Power Plants. Ann. Nucl. Energy 2021, 156, 108220. [Google Scholar] [CrossRef]
  51. Chu, Z.; Cheng, M.; Song, M. What Determines Urban Resilience against COVID-19: City Size or Governance Capacity? Sustain. Cities Soc. 2021, 75, 103304. [Google Scholar] [CrossRef]
Figure 1. Indicators in the first three levels of the resilience indicator system.
Land 11 00842 g001
Figure 2. Resilience values of the indicators in (a) level 2, (b) level 3, (c) level 4, and (d) level 5. Note: The representations of the numbers in (c,d) are shown in Appendix A Table A1, Table A2 and Table A3.
Land 11 00842 g002
Table 1. Characteristics of SZ and GZ.
Shenzhen North Railway Station (SZ)Guangzhou South Railway Station (GZ)
Spatial structure1. East: In total, 6 floors are in the east side of the station. The first and second floors are transfer floors. The third floor is the waiting room and connects to the station square for the entry/exit of the station. The fourth floor is the concourse of the metro. The fifth floor is the metro platform. The B1 floor is the railway.
2. West: In total, 4 floors are in the west side of the station. The first floor is the waiting room of high-speed railway. The second floor is the operation office of high-speed railway. The B1 and B2 floors are used for parking, taxi, and railway.
In total, 4 floors are in the station. The first floor is for entrance, exit, and transfer. The second floor is railway platform and waiting room for train. The third floor is the waiting room for train dedicated line. The B1 floor is for metro and parking.
Passenger flow characteristicsMany clusters of crowded people are distributed on every floor of the station, especially the first floor.Clusters of crowded people are distributed in several points on every floor.
Safety measures1. Human resources: Policemen are stationed in every important point, including entrances/exits of stairs/escalators, passenger aggregation clusters, etc.
2. Equipment: All policemen are equipped with explosion-proof fork. Explosion-proof tanks are distributed in different floors. In addition, anti-collision balls and metal barriers are used.
1. Human resources: A few policemen are distributed on every floor without fixed positions.
2. Equipment: Explosion-proof tanks are distributed in different floors. In addition, anti-collision ball and metal barriers are used.
Rescue materials A special space (about 300 m2) is used for storing emergency rescue stockpiles, including loudspeakers, waterproof gear, fire extinguishers, metal barriers, rain shoes, etc.No special space presented outside for storing rescue materials.
Traffic connection mode
Railway
High-speed railway
Bus
Rail transit
Taxi
Private car
BRT (bus rapid transit)
Intercity traffic
Note: The “√” indicates that the railway station includes this type of traffic connection mode.
Table 2. Resilience impact score.
Resilience Impact CategoryDefinitionScore Range
CriticalThe value/happening/change of the indicator determines system resilience81~100−(81~100)
SeriousThe value/happening/change of the indicator seriously influences system resilience61~80−(61~80)
ModerateThe value/happening/change of the indicator causes moderate influence for system resilience41~60−(41~60)
MinorThe value/happening/change of the indicator causes minor influence for system resilience21~40−(21~40)
NegligibleThe influence caused by the value/happening/change of the indicator could be negligible0~20−(0~20)
Table 3. Fuzzy complementary scale (0.1–0.9).
ScaleDefinitionRemarks
0.1 x i   is   absolutely   less   important   than   x j 0.2/0.4/0.6/0.8 are medians of adjacent judgments.
0.3 x i   is   obviously   less   important   than   x j
0.5 x i   and   x j are equally important
0.7 x i   is   obviously   more   important   than   x j
0.9 x i   is   absolutely   more   important   than   x j
Table 4. A sample of the system resilience value calculation table.
Level 1Level 2Level 3Level 4Level 5Level 6Resilience Impact Score
SZGZ
ResilienceRobustnessRedundancyFunctional facilities
PeoplePassengersAverage daily passenger flow−80.00−80.00
Maximum daily passenger flow−80.00−80.00
Number of passenger aggregation nodes−85.00−75.00
Location of passenger aggregation nodes−85.00−75.00
Average of resilience impact scores of indicators in level 6−82.50−77.50
Weights of the indicators in level 50.350.39
Resilience value of the indicators in level 5−28.4 −29.91
StaffNumber80.0060.00
Location85.0065.00
Average of resilience impact scores of indicators in level 682.5062.50
Weights of the indicators in level 50.250.30
Resilience value of the indicators in level 520.86 18.49
PolicemanNumber80.0065.00
Location85.0065.00
Police equipment80.0060.00
Average of resilience impact scores of indicators in level 681.6763.33
Weights of the indicators in level 50.400.32
Resilience value of the indicators in level 532.8520.16
Sum of the resilience values of the indicators in level 525.24 8.74
Weights of the indicators in level 40.130.15
Resilience value of the indicators in level 43.351.29
Electric power equipment
Fire extinguishing equipment
Water supply and drainage equipment
Security equipment
Sum of the resilience values of the indicators in level 456.9749.15
Weights of the indicators in level 30.340.33
Resilience value of the indicators in level 319.6416.38
Prevention/mitigation
Maintaining key functions
Sum of the resilience values of the indicators in level 367.2961.19
Weights of the indicators in level 20.310.36
Resilience values of the indicators in level 220.9321.77
Rapid recovery
Resourcefulness
Sum of the resilience values of the indicators in level 2 (The system resilience value)65.3860.38
Table 5. Indicators of SZ and GZ (difference ≥3).
LevelIndicatorSZGZDifference
Level 2Resourcefulness25.5119.516.00
Level 3Redundancy19.6416.383.25
Maintaining key functions27.0523.783.27
Resourcefulness (pre-event)32.6927.185.51
Level 4Pre-risk event39.334.075.23
Arrival/departure36.9533.313.64
Transfer34.5131.053.46
Response30.8923.027.87
Level 5Policeman32.8520.1612.69
Connection facilities operation support34.1028.135.97
Air conditioner support16.7813.573.21
Fixed fire extinguishing equipment45.2935.409.89
Daily water supply and drainage equipment21.1617.293.87
Emergency water supply and drainage equipment32.6928.843.85
Violent terrorist attack prevention equipment43.0635.337.73
Disaster prevention/mitigation planning30.5320.6 9.86
Emergency rescue47.1142.214.90
Design34.4130.194.21
Facilities35.9631.474.50
Function connection−11.93−8.26−3.67
System existing resources19.3722.55−3.19
System vulnerability29.2423.116.13
Resource shortage−4.45−7.523.07
Real-time communications20.7726.67−5.90
Security protection30.2819.3310.95
Disaster relief materials25.1516.898.26
On-site capability21.9313.488.45
Response equipment19.6713.486.18
Alternative operation sites16.0612.064.00
Alternative equipment14.6310.034.60
Resettlement resources26.6617.299.38
Publisher’s Note: MDPI stays neutral with regard to jurisdictional claims in published maps and institutional affiliations.

