Article

Impact of Soil Sealing on Soil Carbon Sequestration, Water Storage Potentials and Biomass Productivity in Functional Urban Areas of the European Union and the United Kingdom

1
Institute of Advanced Studies, 9730 Kőszeg, Hungary
2
Institute for Soil Sciences, Agricultural Research Centre, 1022 Budapest, Hungary
3
European Environment Agency, 1050 Copenhagen, Denmark
4
Environment Agency Austria, 1090 Vienna, Austria
5
space4environment, 6947 Niederanven, Luxemburg
6
Departament de Geografia, Autonomous University of Barcelona, 08193 Barcelona, Spain
7
The European Topic Centre on Spatial Analysis and Synthesis (ETC-UMA), University of Malaga, 29016 Malaga, Spain
*
Author to whom correspondence should be addressed.
Land 2022, 11(6), 840; https://doi.org/10.3390/land11060840
Submission received: 3 April 2022 / Revised: 31 May 2022 / Accepted: 31 May 2022 / Published: 3 June 2022
(This article belongs to the Special Issue Land Degradation and Sustainable Land Management)

Abstract

:
The negative impacts of soil sealing are numerous, from withdrawing fertile soil from biomass production to modifying the microclimate and decreasing biodiversity. Many of the processes are interrelated and propagate further undesirable consequences from local to global levels. Three issues are especially important from the viewpoint of multiscale ecological cycles and consequent environmental impacts. One is soil organic carbon (SOC), the other is soil water management and the third is biomass productivity. In this study, we assessed the lost carbon sequestration potential due to soil sealing in functional Urban Areas (FUAs) of Europe, the potential effect of soil sealing on the topsoil to hold water to its full capacity and the loss of biomass productivity potential. Findings revealed that one-fifth of the area of soil that became sealed between 2012 and 2018 was of high productivity potential, and almost two-thirds was of medium productivity potential. New soil sealing caused a loss of carbon sequestration potential estimated at 4 million tons of carbon of the FUAs and also caused an estimated potential loss of water-holding capacity of 668 million m3.

1. Introduction

Land is a resource with many functions: it supports biodiversity, mitigates and enables adaptation to climate change, contributes to carbon sequestration, produces food and is a key resource for the circular economy. Land take is the process in which “semi-natural and natural land is taken by construction and urban infrastructure, as well as urban green areas and sport and leisure facilities” [1]. Land take is very often accompanied by soil sealing, which is “the destruction or covering of the ground by an impermeable material” [2]. Land take and soil sealing result in quantitative losses of land functions. Land that is affected by land take and sealing is deprived of most of its ecosystem functions, many of which cannot be restored. Hence, land take is one of the major drivers of land degradation, including biodiversity decline [3,4], desertification [5], accumulation of pollutants [6] and loss of productive land [7].
Land take is the conversion of semi-natural, non-urban land into urban areas. Land take mainly happens in and around city centers and commuting zones, as these areas usually change in a dynamic way where land is mostly needed for housing, commuting infrastructure or economic development. As urbanization is an ongoing trend on all continents [8], the expansion of sealed surfaces threatens soils globally [9], impacting 17 ha of soil on the Earth each minute [3]. Sealed land is degraded, mostly irreversibly, jeopardizing carbon sequestration, flood protection, destroying habitats and increasing health impacts during heatwaves.
Urbanization includes related processes in peri-urban commuting zones, which, in combination with their core city, are called Functional Urban Areas (FUAs) [10]. FUAs represent 22.9% of the EU territory but host 75% of its population [5]. Between 2012 and 2018, there was a 3% increase in the EU population, which was slightly faster than the 2.2% growth rate of artificial areas. Most urban areas experience growth in population and jobs, and this results in land take at the fringes of core cities at the expense of croplands and grasslands. An increasing population increases the pressure on land due to the subsequent need for infrastructure, transport and housing. This increases landscape fragmentation, threatens biodiversity and destroys carbon-rich habitats by reducing grasslands and wetlands, but also agricultural areas.
While several studies point out the impact of land take and soil sealing on biodiversity [3,4,8,11], food security [7,12] and local climate [13,14], there is limited quantitative knowledge on the impact on soil carbon sequestration potential and on the water regime of soils. While soils store more carbon than the atmosphere and terrestrial vegetation combined [15], the SOC pool is rather dynamic; soils lose or gain carbon depending on environmental conditions and soil management. The meta-analysis of Poeplau and Don [16] provided a good example of this complexity by showing that about 10% of the land introducing cover crop actually lost soil carbon. Nutrient management differences contribute to the complexity of soil organic carbon dynamics [16,17,18]. Nevertheless, with soil sealing, the cycle of humus formation (the process of turning living biomass into soil organic carbon compounds) is broken, and the soil will not be able to further accumulate carbon. On sealed soil, the potential to sequester carbon is lost due to the surface imperviousness, which prevents new organic material from entering the soil to enhance its organic carbon stock. The lost potential of soils to sequester carbon is one of the negative consequences of soil sealing. Likewise, the potential of soil to receive and store water is also limited by soil sealing. The water holding capacity of soils has multiple benefits, from supporting plant growth to controlling the local climate. The first one-meter soil layer starting from the surface is crucial for controlling water runoff as it receives and keeps most of the water entering the surface and is thus also key to preventing floods and securing the healthy water cycle between the spheres (geosphere, hydrosphere, biosphere, atmosphere).
The aim of our study was to provide quantitative estimates of the effect of soil sealing on the loss of three main soil functions, including the soil’s role in carbon sequestration, water retention and biomass productivity. Here, we present our findings related to the effect of soil sealing, an extreme form of land take, on land productivity, carbon sequestration potential and water holding capacity in Functional Urban Areas in Europe.

2. Method

To measure soil sealing, two high-resolution time series can be used that are harmonized across Europe. The longest and most complete time series is available for the imperviousness products of the Copernicus Land Monitoring Service, with layers being available for the reference years 2006, 2009, 2012, 2015 and 2018. Change information is available for all change periods (both density change and change classified). The 20 m resolution (and aggregated 100 m resolution) products were harmonized for the period 2006–2015, such that imperviousness status and change layers build a consistent time series, with imperviousness density changes being equal to the difference of subsequent imperviousness status layers.
For the reference year 2018, the spatial detail was increased to 10 m resolution, with the advantage of capturing more details in sealing. On the flipside, this made the new 10 m resolution imperviousness product and its data model inconsistent with the data products for previous years, especially in a statistical accounting sense. Therefore, any assessment and product that is dependent on the time series must be split into two periods, one before 2018 and one starting with 2018.
Due to the above-mentioned reasons, soil sealing between 2012 and 2018 was studied based on estimated sealed surfaces derived from the Urban Atlas [19] datasets of the Copernicus Land Monitoring Service (CLMS). The Urban Atlas allows an assessment of cities in the context of their surrounding areas (i.e., commuting zones, together referred to as FUAs) and enables a comparison of urban areas across Europe. For the assessment, soil sealing was estimated by assuming a certain level of sealing of the Urban Atlas classes (see Appendix A) based on earlier evaluations, including an analysis of time series CLMS products [20]. For actual sealed area per Urban Atlas class, please refer to Appendix B. With the availability of new data from the Urban Atlas, it is now possible to assess the land-use changes and socio-economic trends of 662 FUAs of the EU-27 and the UK. The Urban Atlas has a 10-fold higher resolution than the Corine Land Cover (CLC) dataset, which has been used for land take analyses in the past. In addition, the Urban Atlas nomenclature contains more urban classes; in particular, the residential classes are subdivided more deeply, discriminating between continuous and discontinuous residential areas. Moreover, industrial and commercial areas are also assumed to have high levels of sealing. Our study considered FUAs of the European Union and the United Kingdom, which was part of the Union during the study period [21].
In order to address various ecosystems within Functional Urban Areas, we have used the solution offered by Maes et al. [22]. The Corine Land Cover categories were reclassified into MAES Level 1 and Level 2 categories using the cross-walk developed by Maes et al. [22]. After the Corine Land Cover was spatially overlaid with the Urban Atlas dataset, the MAES categories were assigned to the Corine Land Cover classes, thereby accounting for the presence of ecosystems within Functional Urban Areas. In order to ensure correct accounting of land surface cover, the Integrated Data Platform system developed by the Ivits et al. [23] was used. The system enables the conversion of various geospatial data into harmonized land accounting data cubes, which facilitates the derivation of area statistics.
The biomass productivity level of the land sealed by major land-use types was also addressed. Biomass productivity is an indicator showing the fertility level of the land. Fertility level is largely dependent on climatic conditions and soil properties. Productivity plays a crucial role in food security and in the provision of renewable raw materials such as timber and fibers. Furthermore, soil fertility is linked to a series of other soil-related ecosystem services, from air purification and nutrient cycling to habitat provision, the filtering and absorption of chemicals, climate regulation, etc. With the loss of fertile soils, all the above-mentioned services are damaged at the same time. Soil fertility may vary from place to place, depending on local soil properties, such as texture, pH and the content of organic material in the topsoil. Land properties, such as climatic conditions, topography and soil management, modify the level of productivity to various degrees. Biomass is also a good approximation of the potential of lands to supply ecosystem services [24].
Biomass productivity was determined by the Medium-Resolution Vegetation Phenology and Productivity data suite from the Copernicus Land Monitoring Service [25]. This dataset is available for the years 2000–2019 with a resolution of 500 m and provides biophysical parameters on the phenology and productivity of vegetation (such as Leaf Area Index or Plant Phenology Index). The long-term average productivity levels for each 500 m grid cell were computed and subsequently classified into three percentile classes: low productivity (<25 percentile), medium productivity (>25 percentile and <75 percentile) and high/prime productivity (>75 percentile). These values were used as the approximated potential productivity of lands.
The calculation of carbon sequestration loss was performed using the estimated soil sealing change from 2012 to 2018, as explained above. In order to estimate the lost potential to sequester carbon, the potential SOC saturation map based on Lugato et al. [26] and the European coverage of the Global Soil Organic Carbon Map [27] were used. Based on the assumption that on sealed soil, no more carbon accumulation can take place, the lost potentials were calculated from the real actual concentrations [27] and the relative potentials till saturation capacity [26]. Worth noting is that carbon sequestration values reported here are estimates to assess the impacts of soil sealing. Two data sources were merged to a single geodatabase with identical spatial projection and 1 km resolution. As both datasets contain information for the top 30 cm, our study also provides results for this layer. When assessing the lost sequestration potential, we took the current concentrations into account and did not deal with the possible further mineralization below sealed surfaces.
The calculation of the potential loss of soil water holding capacity is based on the assumption that the sealed layer makes infiltration impossible, therefore preventing soil pores from being filled with water. Gravitational forces remove water from the topsoil; therefore, the actual water storage of soil becomes very limited. Likewise, the larger the area extent of the impervious surface layer, the higher the possibility for a decrease of the partial recharge by subsurface horizontal flow. This study addresses the potential loss of water holding capacity in contrast to its full capacity, i.e., when sealing results in the total loss of soil water recharge. The data on Saturated Water Content was used as a proxy to estimate the potential loss of the maximum amount of water that could be held in the soil in normal, i.e., unsealed conditions. While field capacity could be a proxy for water retention under normal field conditions, the saturated water content is more meaningful in the context of water runoff and flood control, therefore, this indicator was used. Data on saturated water content was derived from the 3D soil hydraulic database of Europe at 250 m resolution [28]. This dataset indicates the water holding capacity of soils expressed in % of the top one meter, which also can be expressed in m3.

3. Results

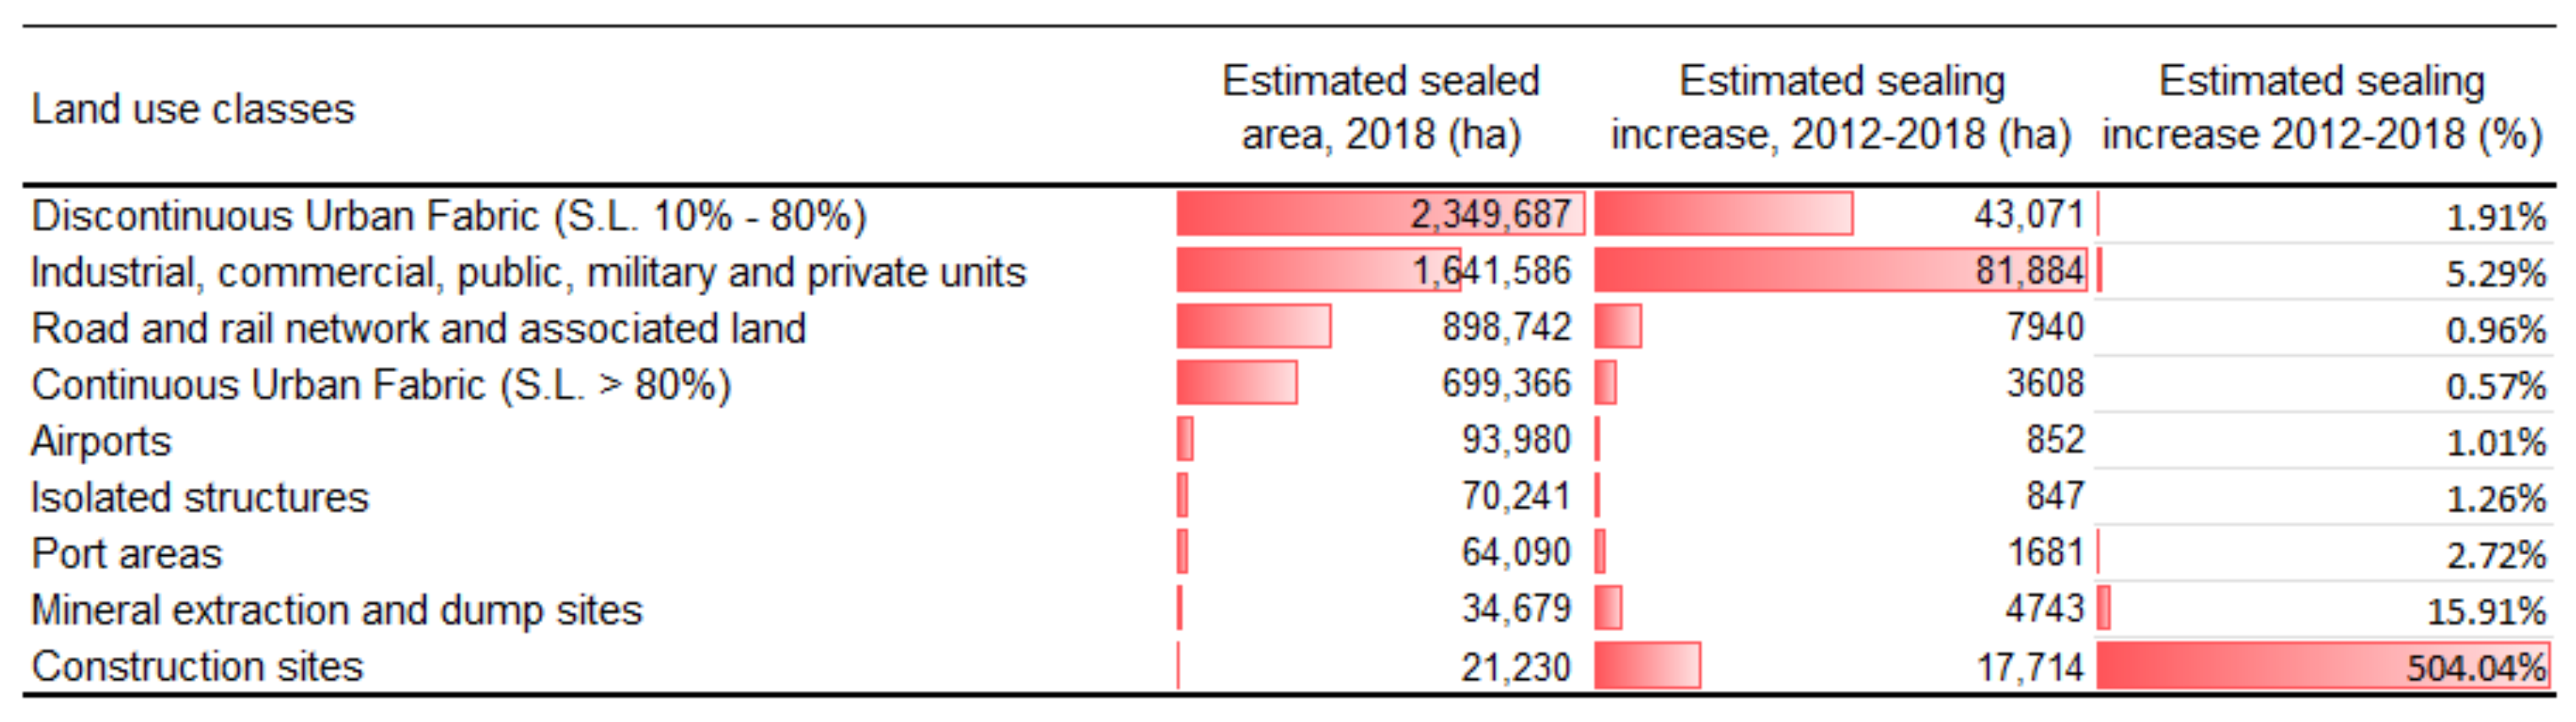
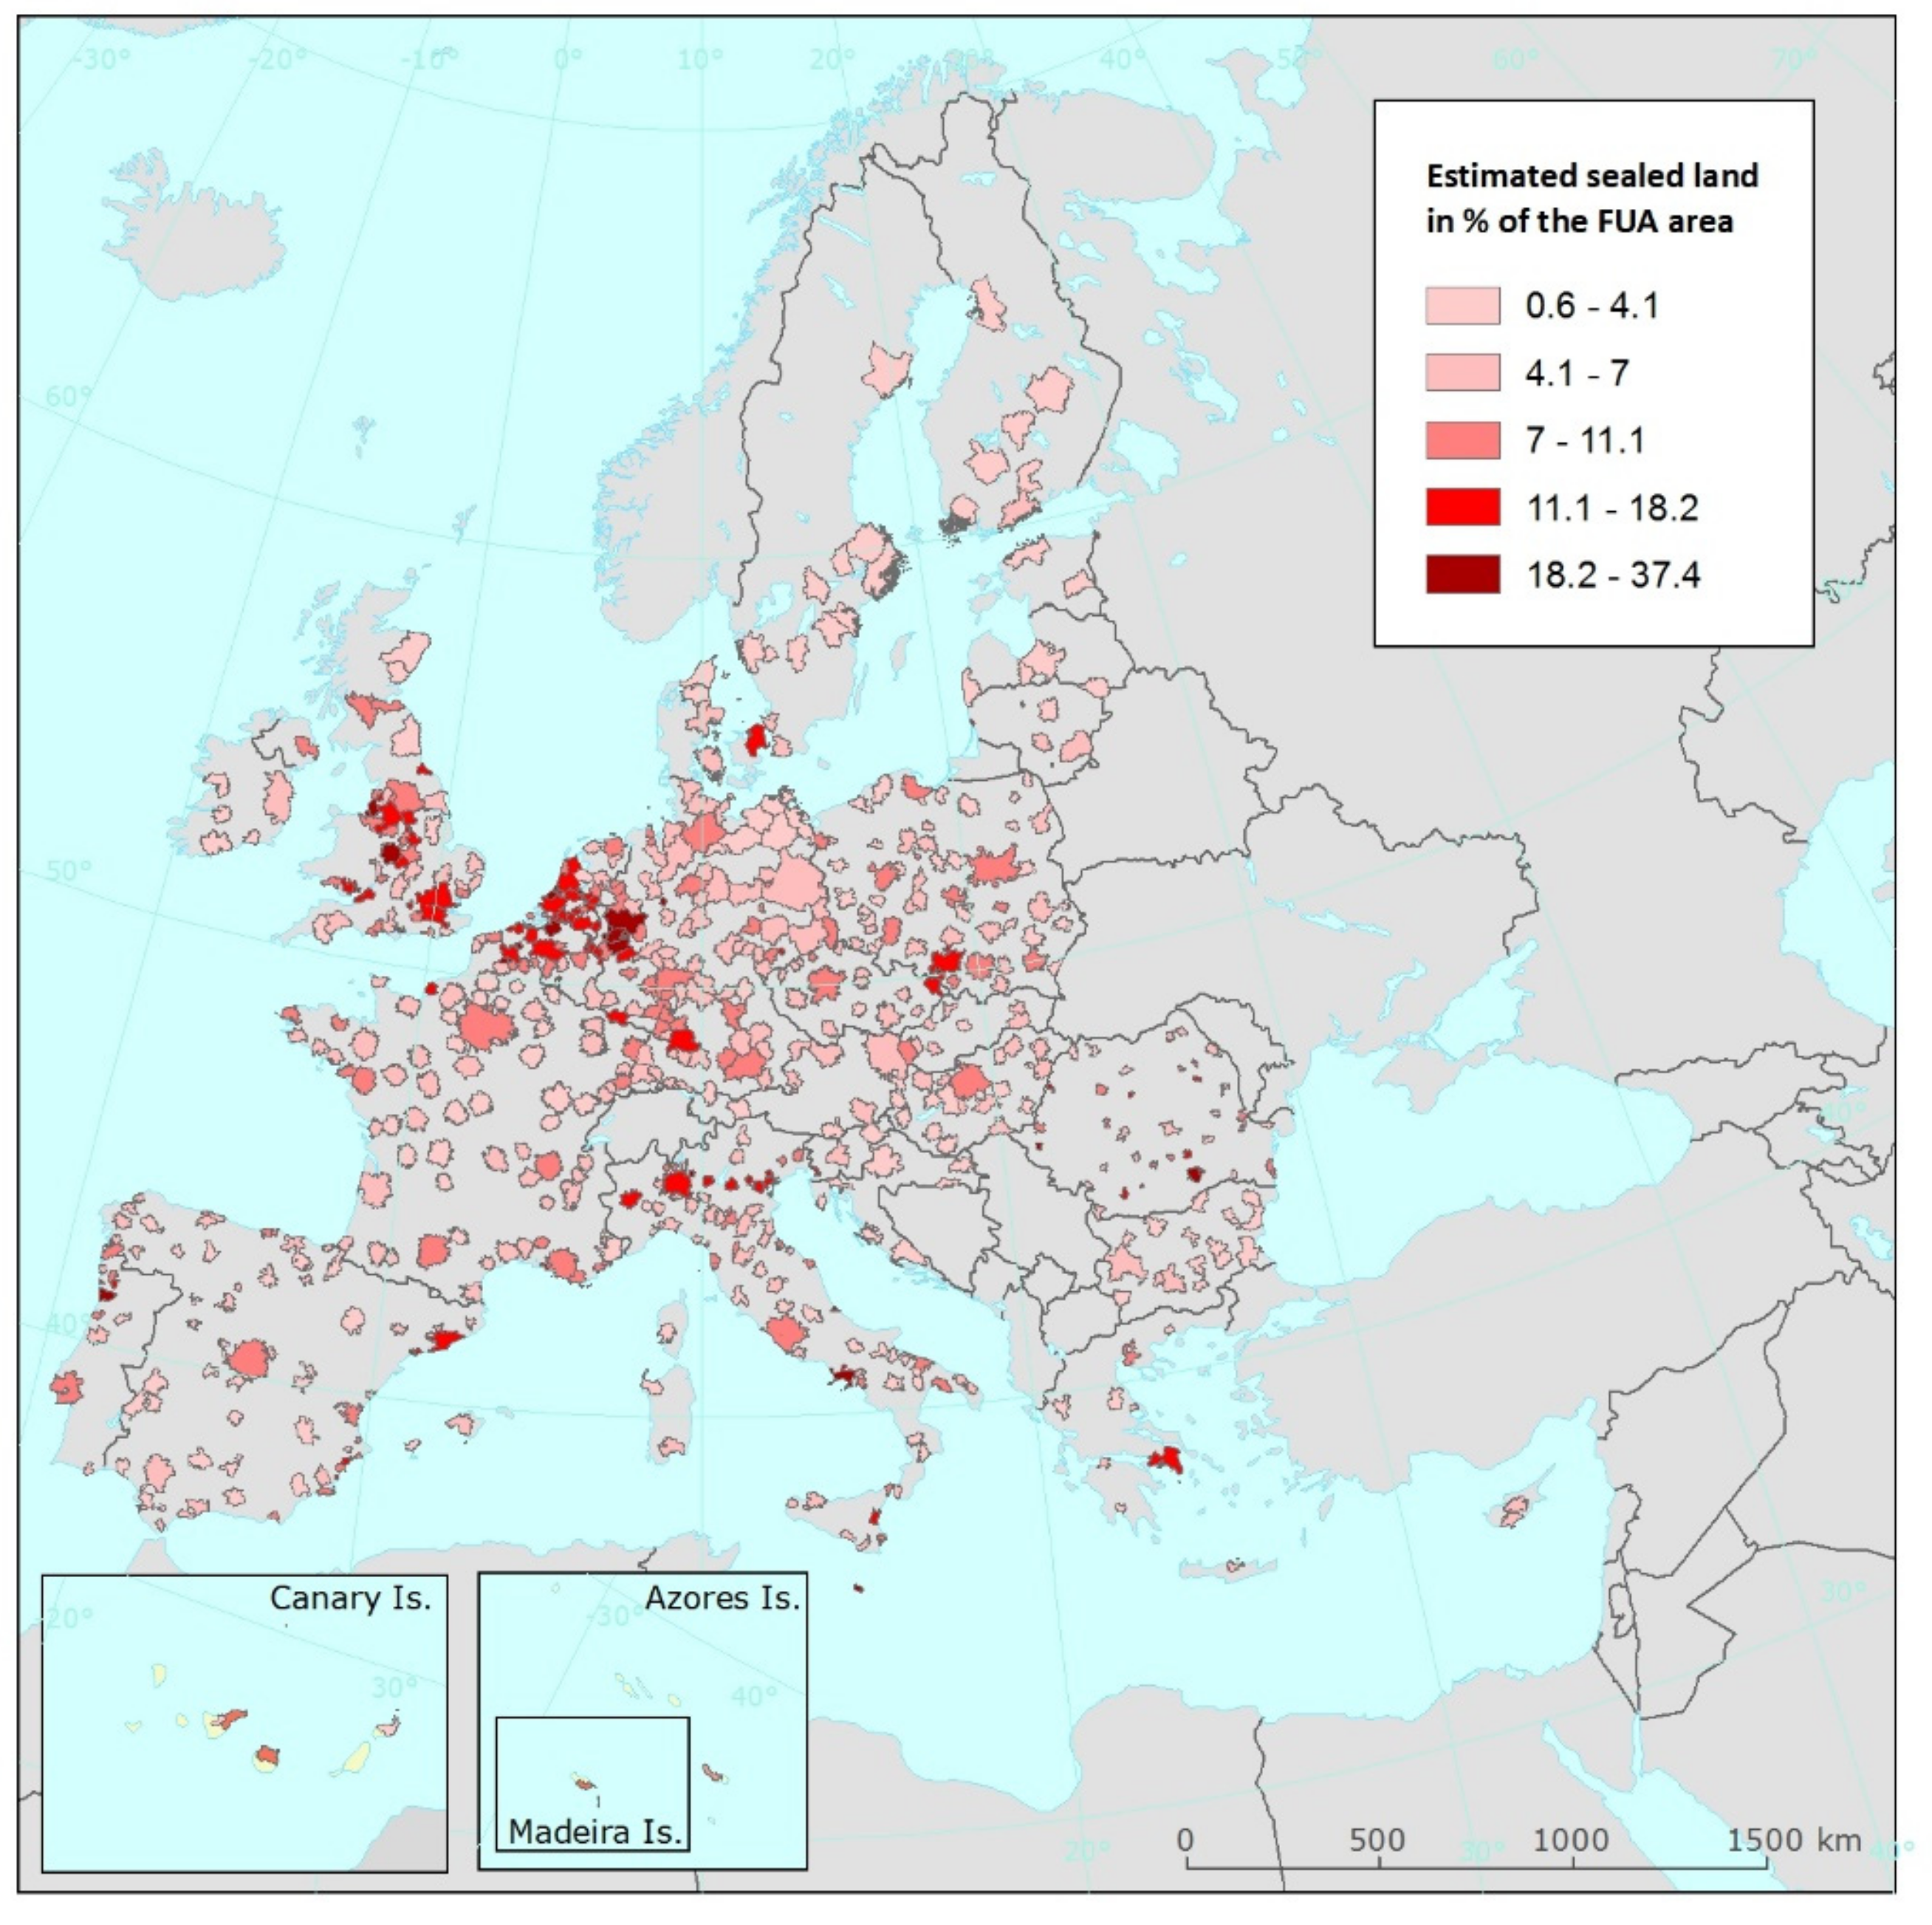
3.1. Sealing and Land Use Change

Analyzing sealed land cover types and the change in sealing per land cover type facilitates the understanding of the underlying land-use drivers that cause sealing.
The sealing of FUAs in the EU affected approximately 6 million hectares or 60,000 km2 of land (excluding rivers, lakes and marine inlets) by 2018 (Figure 1). The estimated increase in sealing between 2012 and 2018 in Functional Urban Areas of the EU and the UK was 146,720 ha, which is an increase of around 2.6% in relation to sealed surfaces in 2012.
The largest absolute increase in artificial areas was due to the creation of industrial, commercial, public/military and private units, with an increase of 81,884 ha (Figure 1). In 2018, these areas occupied 1.6 million hectares, which is an increase of 5% in artificial areas. The development of discontinuous urban fabric accounted for the second-largest absolute increase of artificial land between 2012 and 2018 (43 thousand ha, around 2% increase). The compatibly small increase in the sealing of scattered urban class is probably due to the relative unavailability of land for housing, as in 2018, urban fabric accounted for the largest proportion of sealed land, around 2.3 million hectares.
The largest relative increase (in % of the 2012 sealed area) in artificial surfaces was due to construction sites (Figure 1)—the 17 thousand hectares increase amounted to as much as a 500% increase in the EU-27 + UK region. The second-largest increase compared to 2012 was seen in areas where mineral extraction and dumping took place, amounting to a 16% increase. While in terms of both relative and absolute values, the increase of road and rail networks was little in the period 2012–2018, by 2018, this land-use form accounted for the third-largest sealed surface in FUAs of the EU and the UK.
In 2018, the largest sealed surfaces were seen in the FUAs of Paris, London and Berlin (between 128 thousand and 110 thousand hectares sealed surface) (Figure 2). Large sealing was also observed in the Ruhrgebiet, Warszawa, Hamburg and Budapest, ranging from 84 thousand to 64 thousand hectares of sealed surface in 2018. Sealing was the lowest in the FUAs of the Scandinavian and Nordic countries as well as in several Eastern European regions.

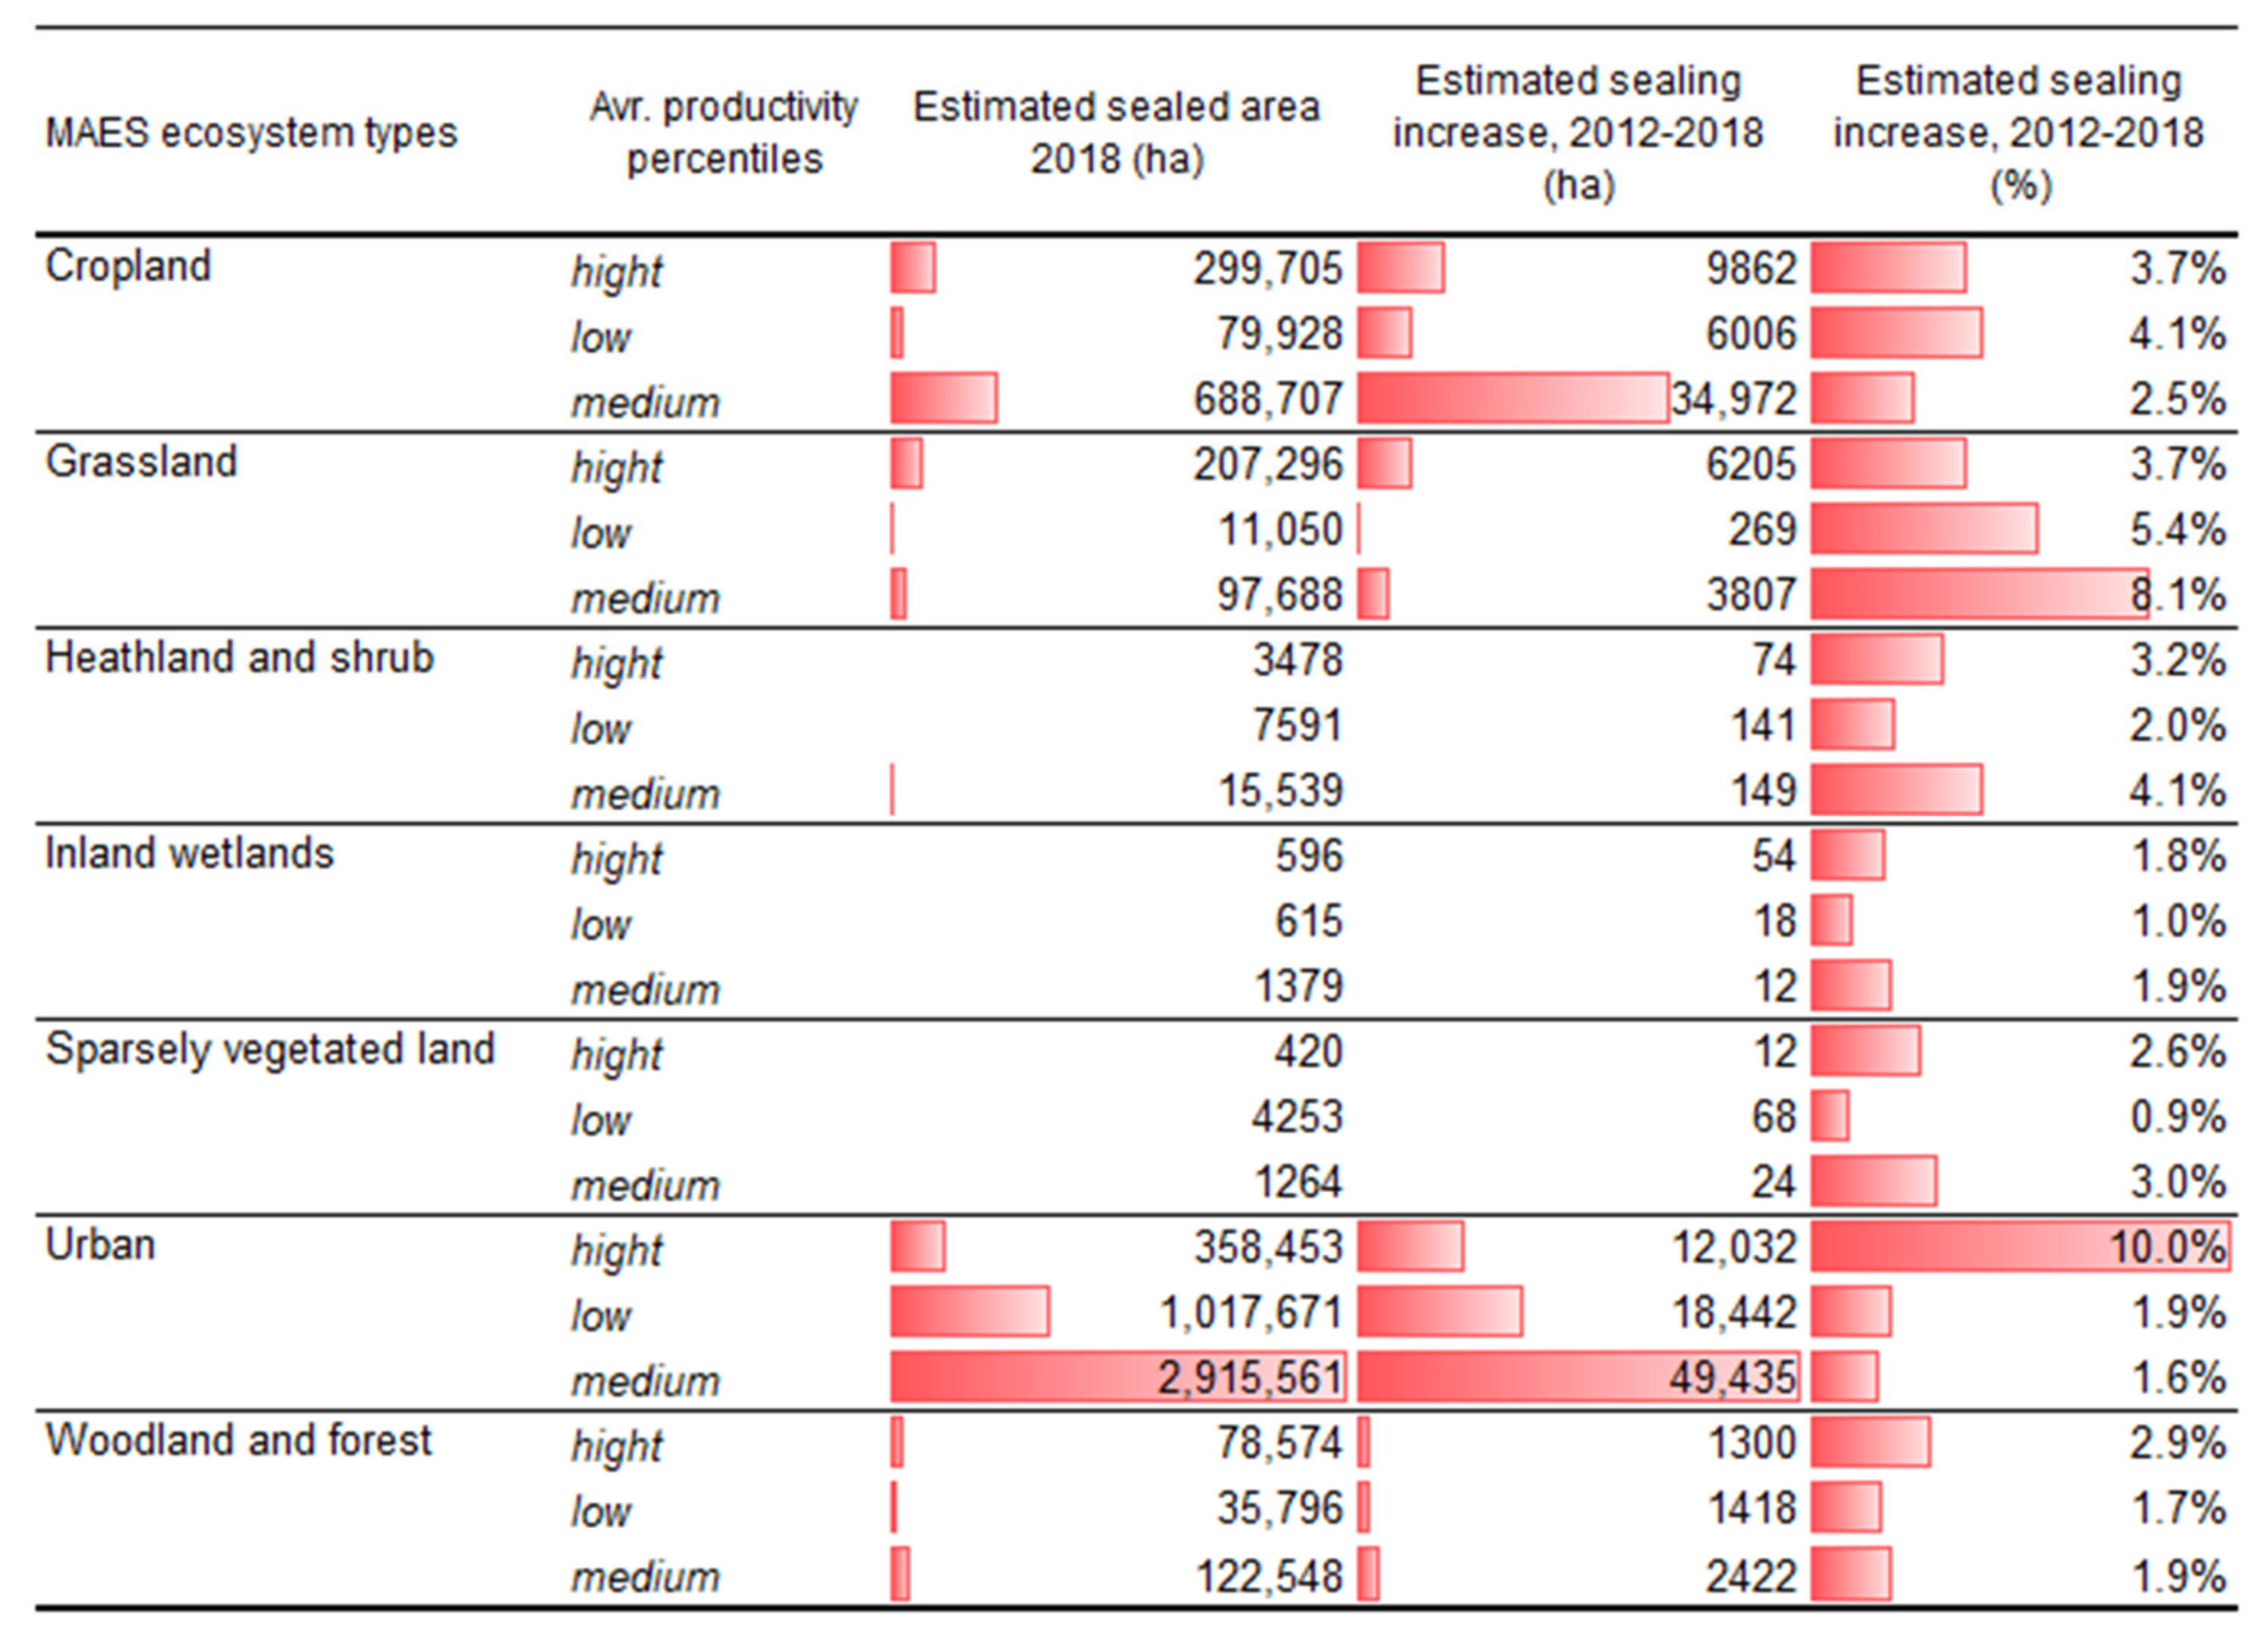
3.2. Sealing of Productive Lands in FUAs

Approximately 66% (around 38,000 km2) of the lands in FUAs are of medium productivity, and about 18% and 16% of the lands are of low and high productivity, respectively (Figure 3). Croplands are the non-urban ecosystems that were most impacted by soil sealing in 2018 (appr. 1000 ha of croplands were sealed), and most sealed croplands were of high and medium productivity (Figure 3). Grasslands, one of Europe’s biodiversity hotspots, at the same time, and having a large carbon sequestration potential [29], accounted for 300 thousand hectares of land sealed by 2018 (5% of all sealing), mostly on high-productivity lands. When assessing the different MAES classes, it can be observed that, in absolute terms, land consumption on croplands, grasslands, woodlands and forests occurred on high and medium-productivity lands more than on low-productivity lands between 2012 and 2018 (Figure 3).
Although in absolute terms, the increase in sealing between 2012 and 2018 was largest in urban ecosystems (around 80 thousand hectares, accounting for around half of all sealing increase), the sealing increase in FUAs occurred at an alarming rate on croplands, with 35% of all sealing happening here. The increase in sealing on grasslands amounted to only 7% of the total sealing increase; however, compared with 2012, around 3.4% more grasslands were sealed by 2018. The increase in sealing of wetlands was very low in absolute values; however, with a 10% sealing increase relative to 2012, the sealing rate was the highest in the EU-27 and the UK region. As wetlands store large amounts of carbon and provide important biodiversity-hot spots, this pattern is non-sustainable, and EU restoration goals should attempt to reverse it.

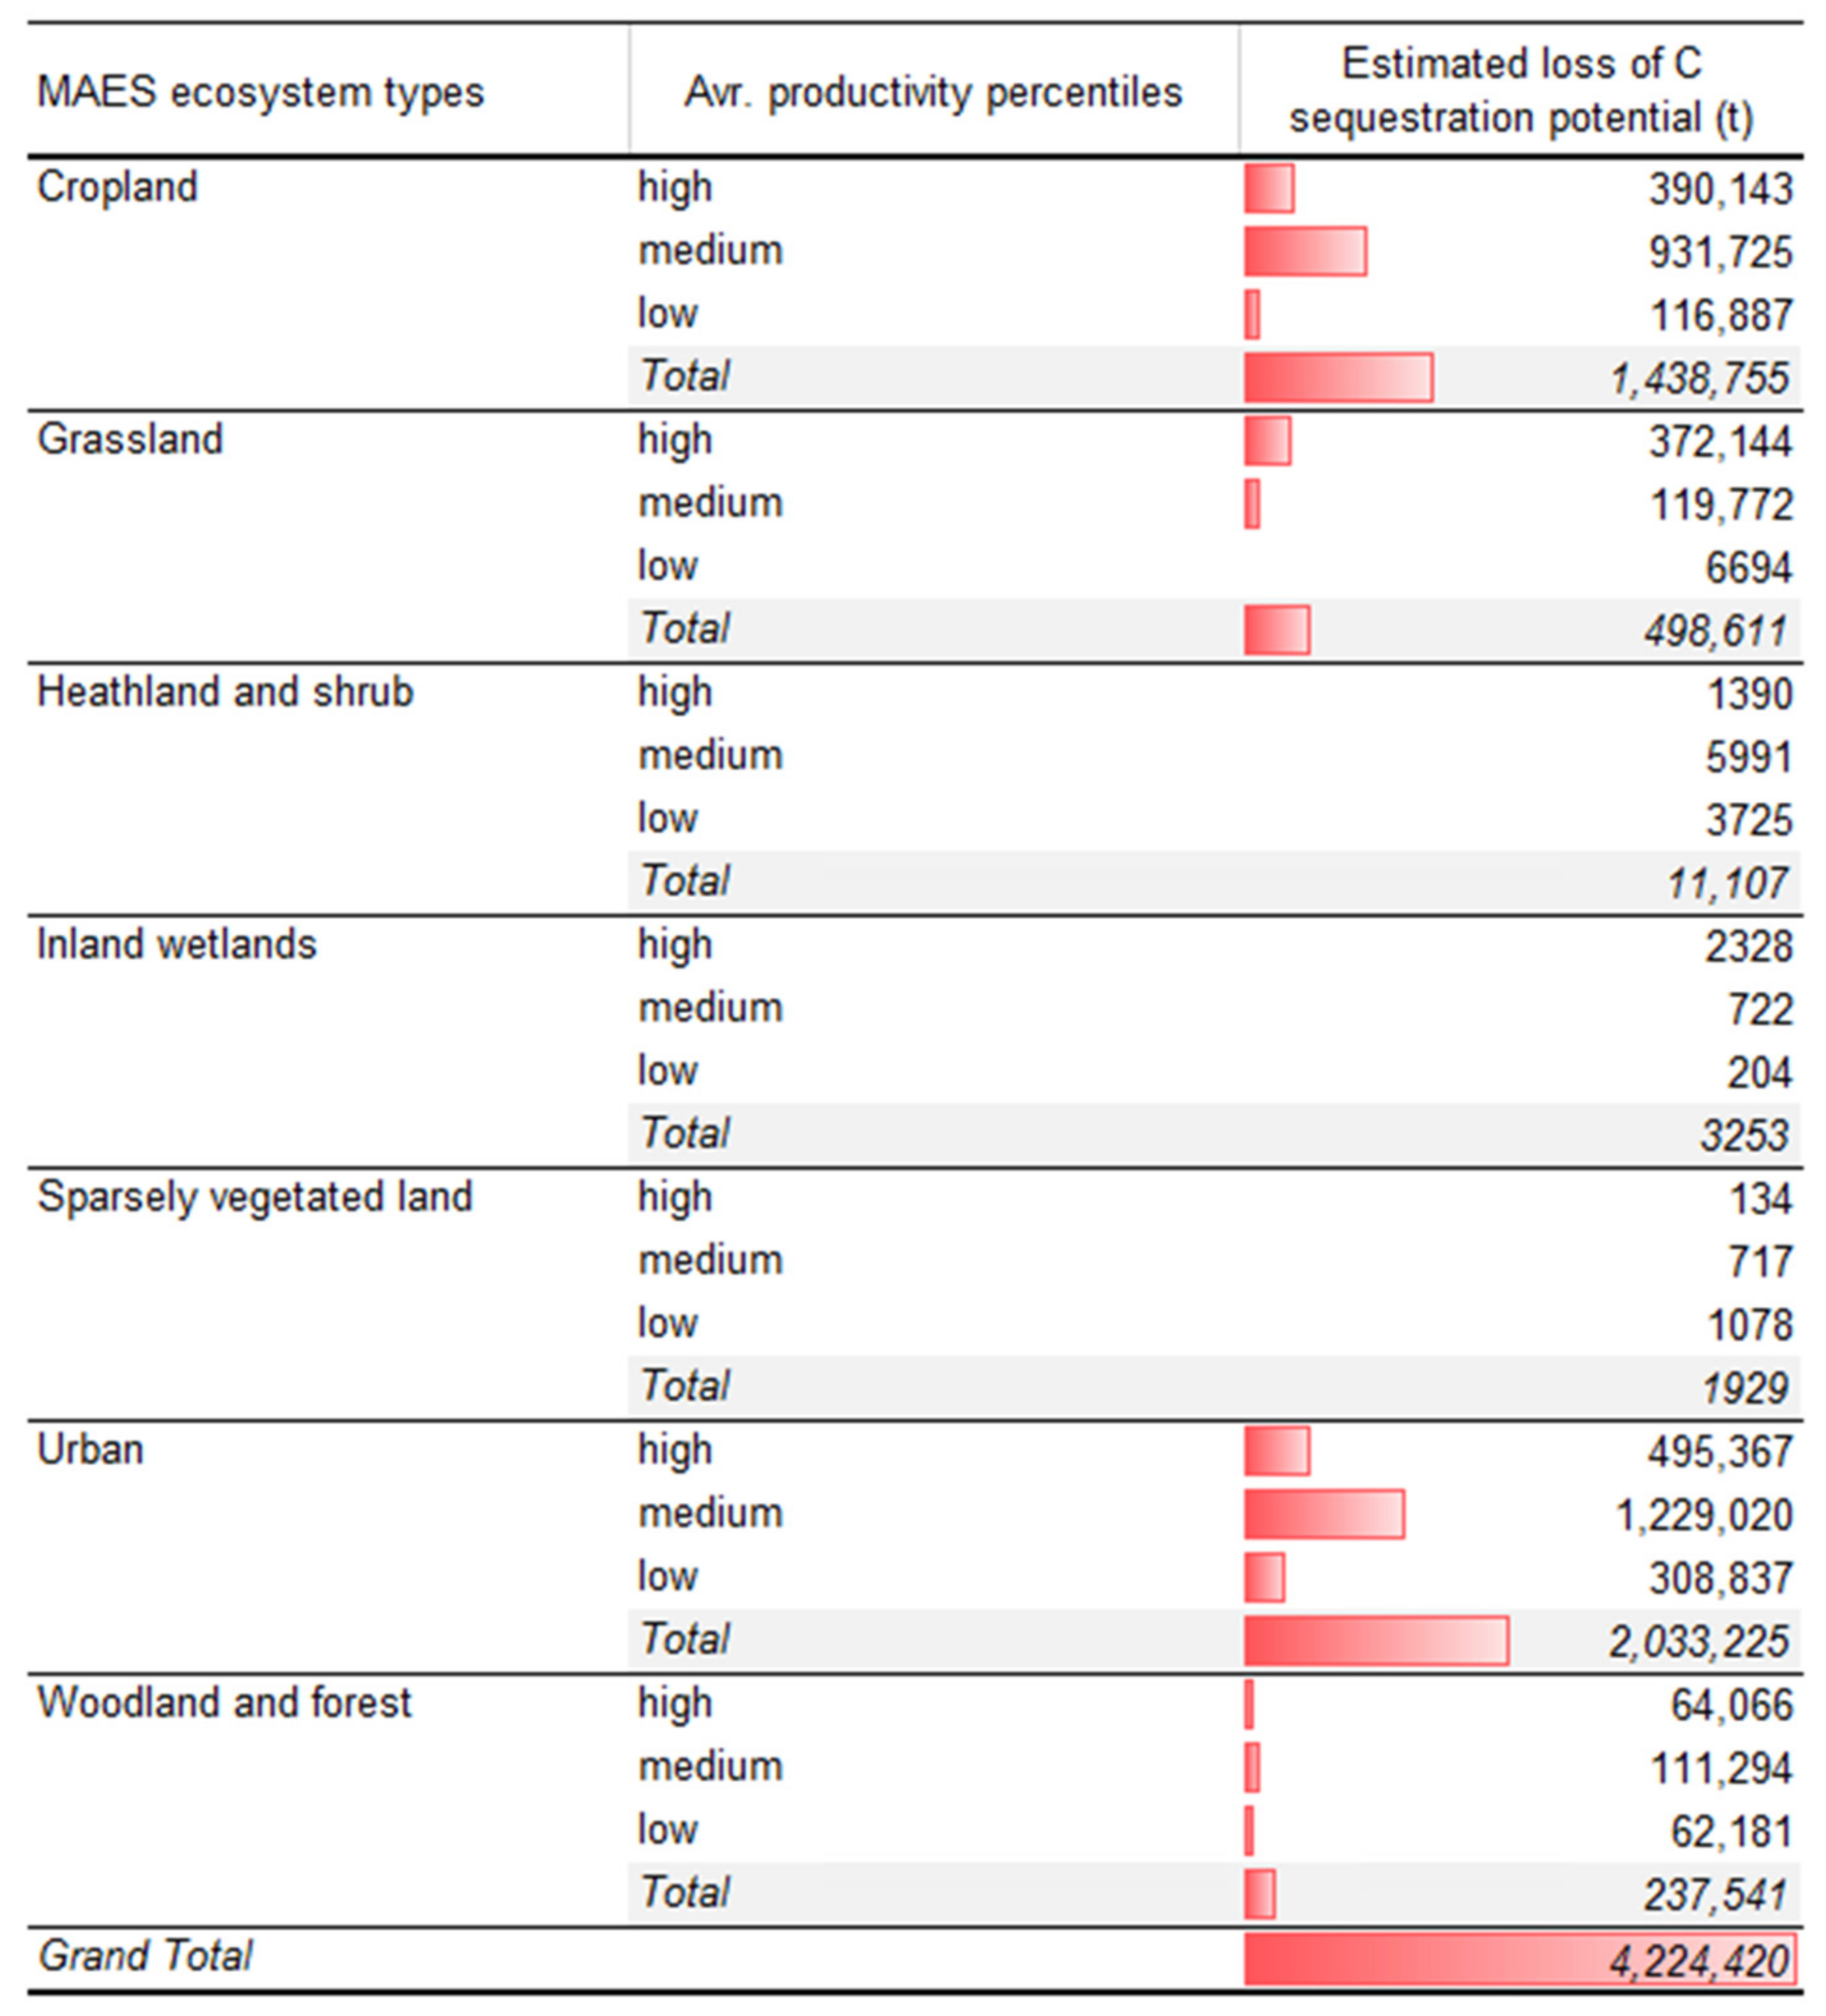
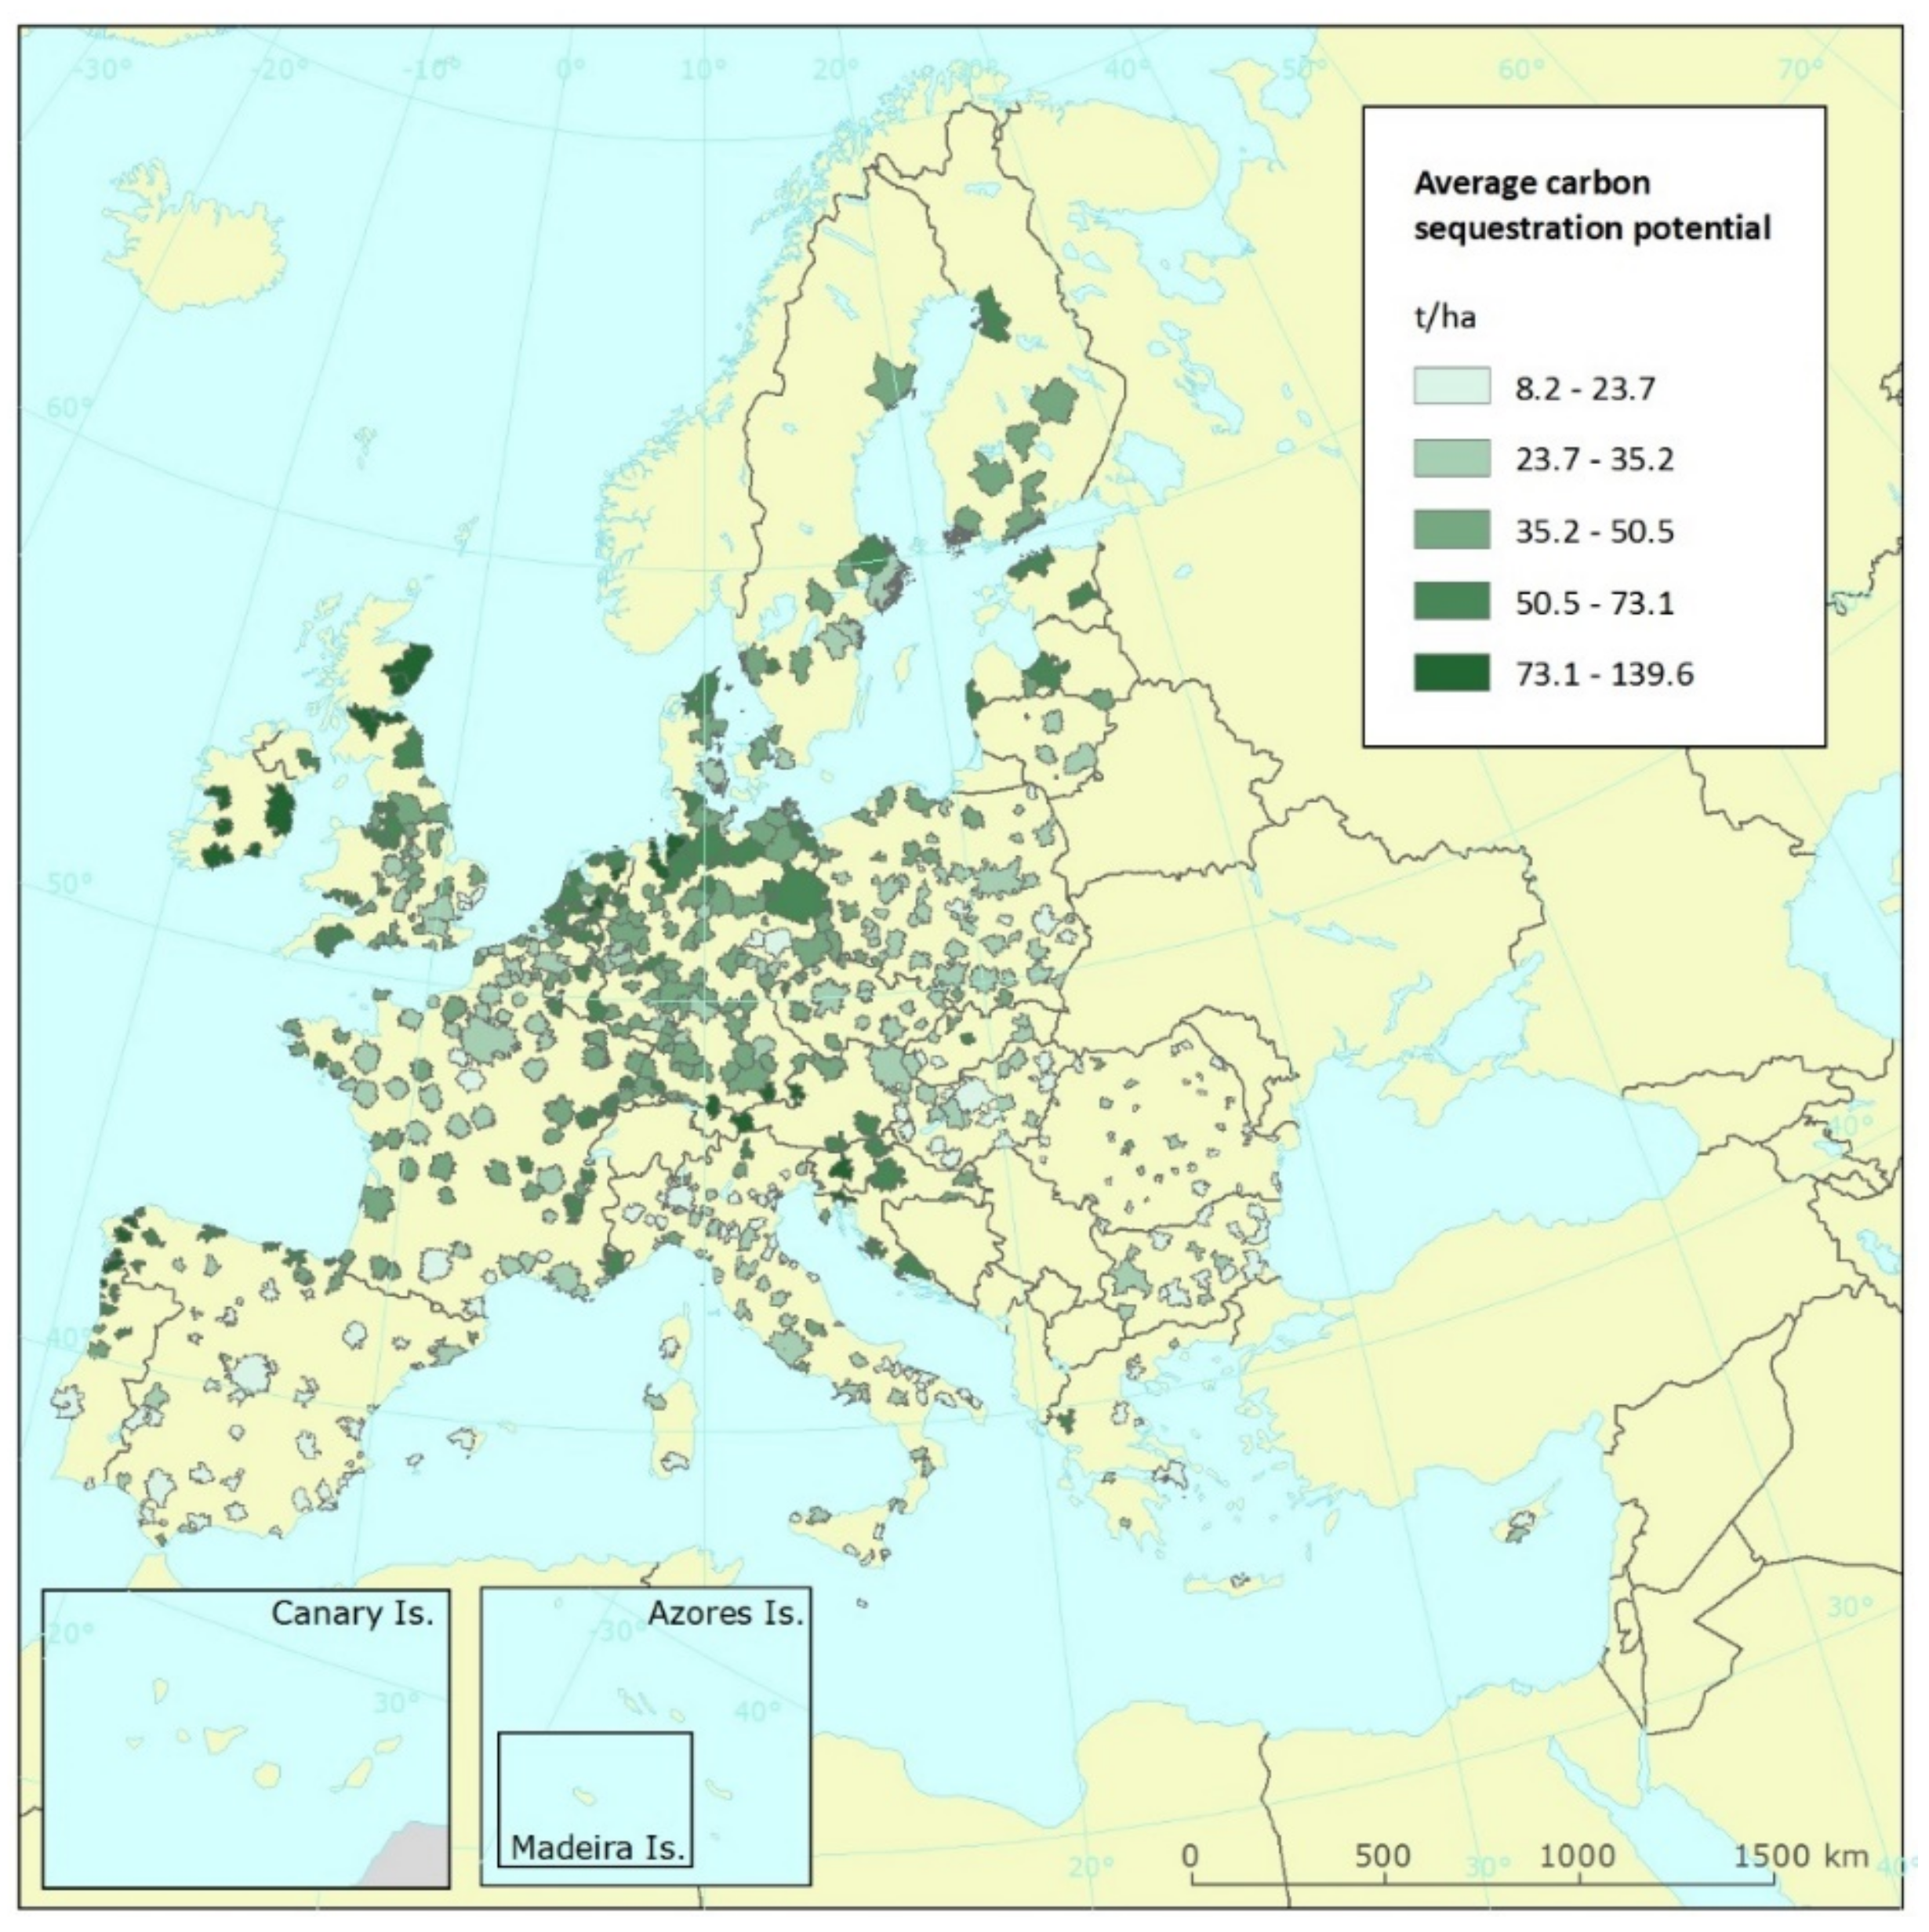
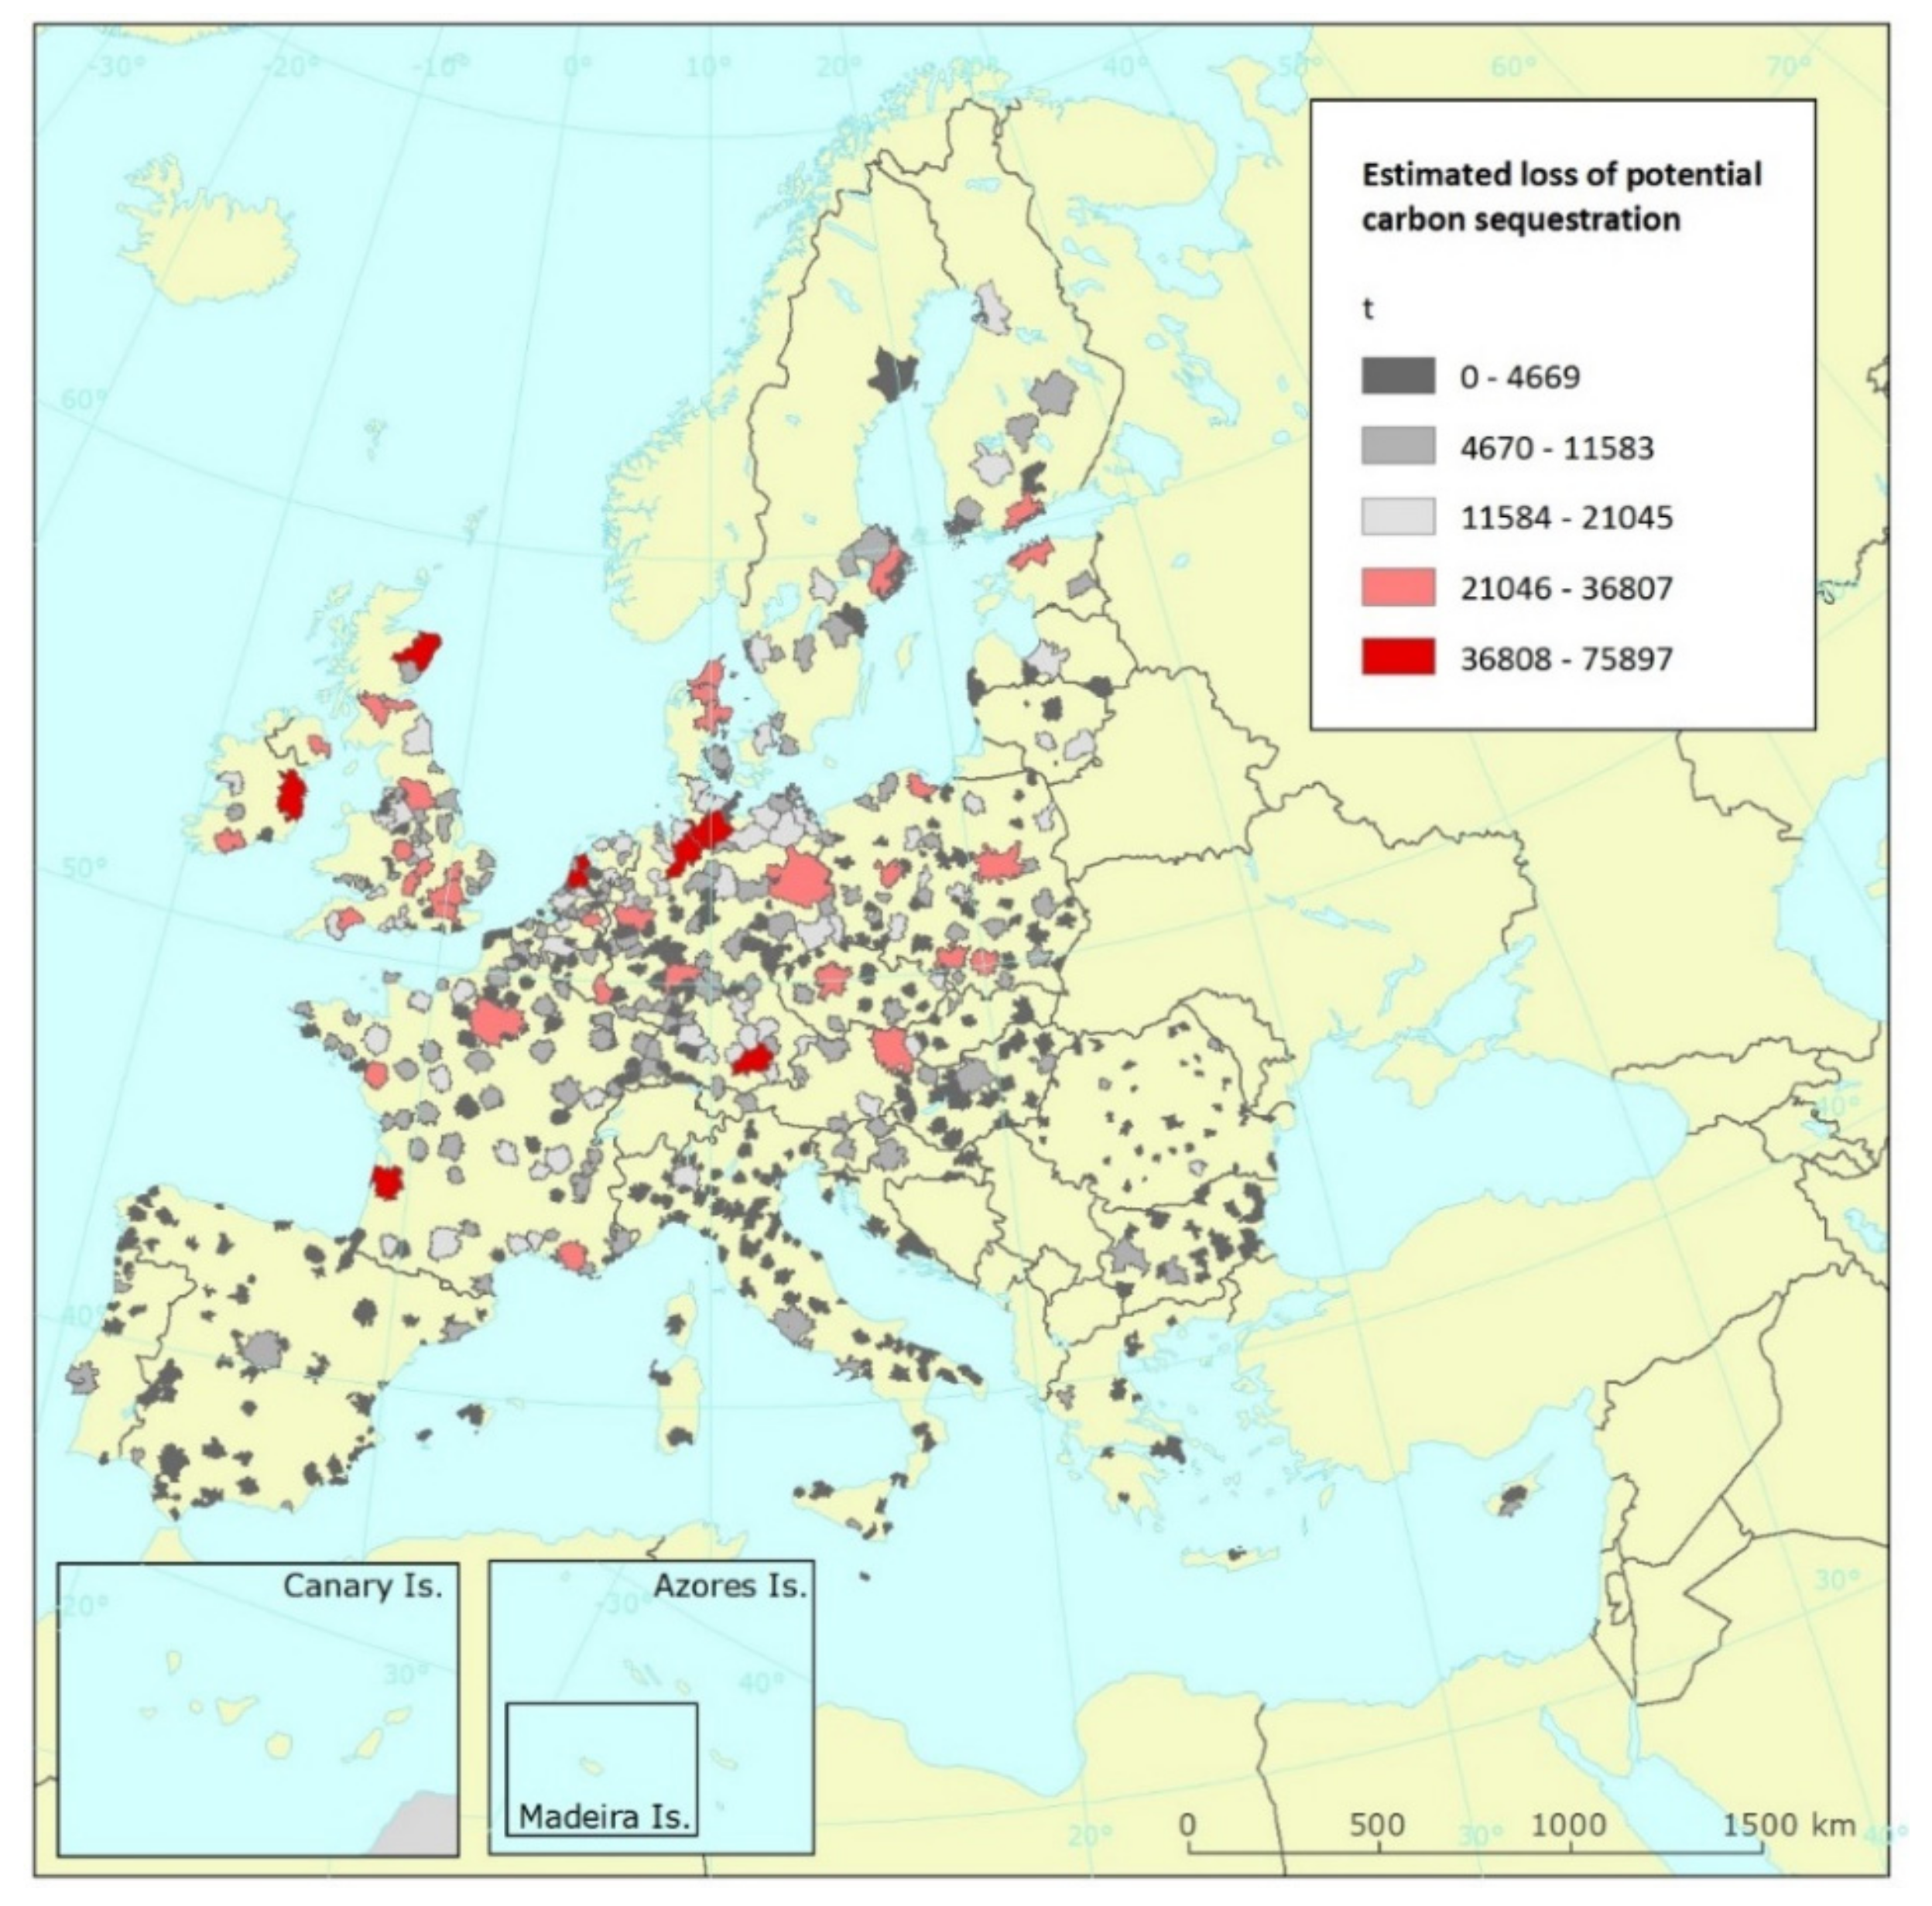
3.3. Sealing and Carbon Sequestration Potential of Functional Urban Areas

According to model calculations, woodlands have the overall highest potential for carbon sequestration, which is approximately equal to 14 t/ha carbon in FUAs of the EU-27 + UK region. Cropland soils (approx. 12 t/ha) and grassland soils (around 6 t/ha carbon) also account for large carbon removal potentials. Scottish (Glasgow, Aberdeen, Edinburgh) and Irish FUAs (Galway, Limerick and Cork) are among the FUAs in Europe where the carbon sequestration potential is the largest, amounting to between 100–115 t/ha). The southern Mediterranean soils have the lowest carbon sequestration potential.
The estimated increase of sealed surface between 2012 and 2018 (approx. 1467 km2, Figure 1) created an estimated carbon sequestration potential loss of approximately 4.2 million tons (Figure 4). Around half of the lost carbon sequestration potential was seen in urban ecosystems, as indeed, within functional urban areas, the increase of artificial surfaces was the largest. Approximately 34% (around 1.6 mio t) of the estimated potential carbon sequestration loss was over croplands, showing the high rate of expansion of sealing in these lands. Sealing of grasslands accounted for around 12% (approx. 539 thousand t) of the lost carbon sequestration potential, and around half of that may be attributed to the sealing increase in woodlands and forests since comparably less forest areas were sealed during the period 2012–2018.
Estimated carbon sequestration potential is highest in FUAs in North-Western Europe (Figure 5). Four Functional Urban Areas stand out in Europe for their estimated loss in carbon sequestration potential (Figure 6); Bordeaux (France) and Dublin (Ireland) were both estimated to lose the potential to sequester above 70 thousand tons of carbon due to sealing increase. Aberdeen (Scotland) and Hamburg (Germany) also lead to loss of carbon sequestration potential, in both cases amounting to slightly above 60 thousand tons of carbon. In some FUAs in Spain and Italy, however, the loss of carbon sequestration potential was close to zero.

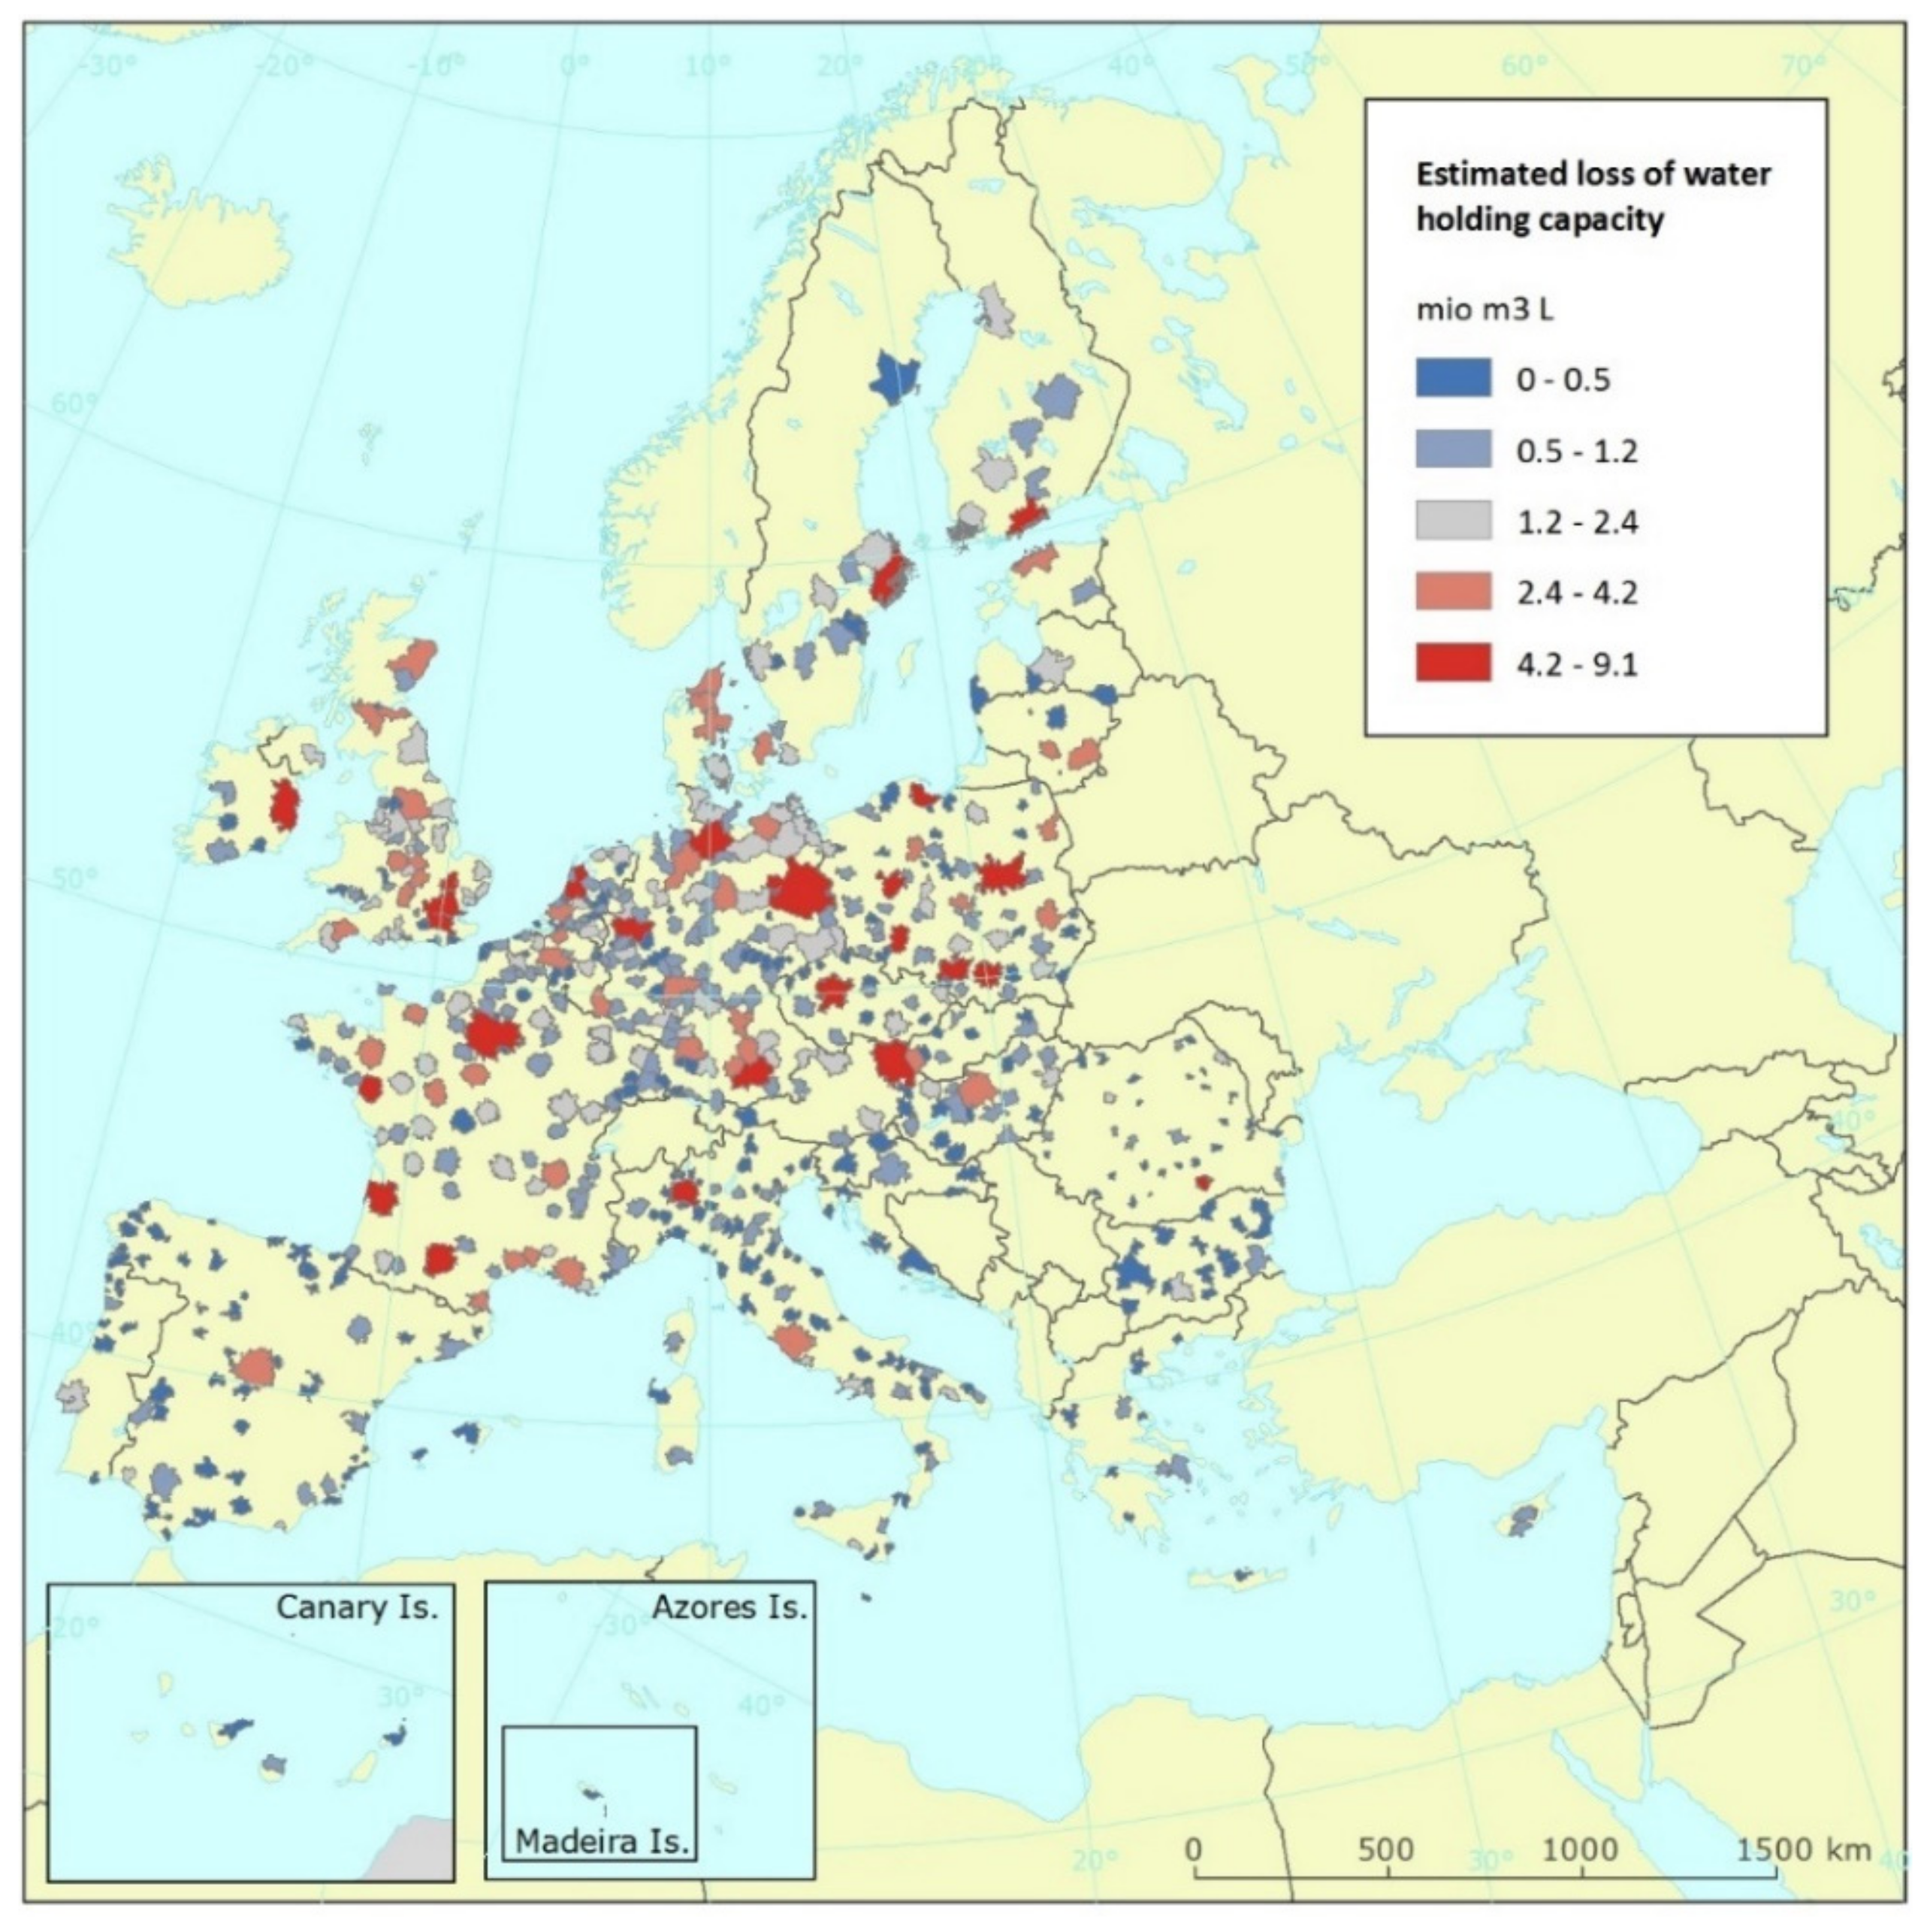
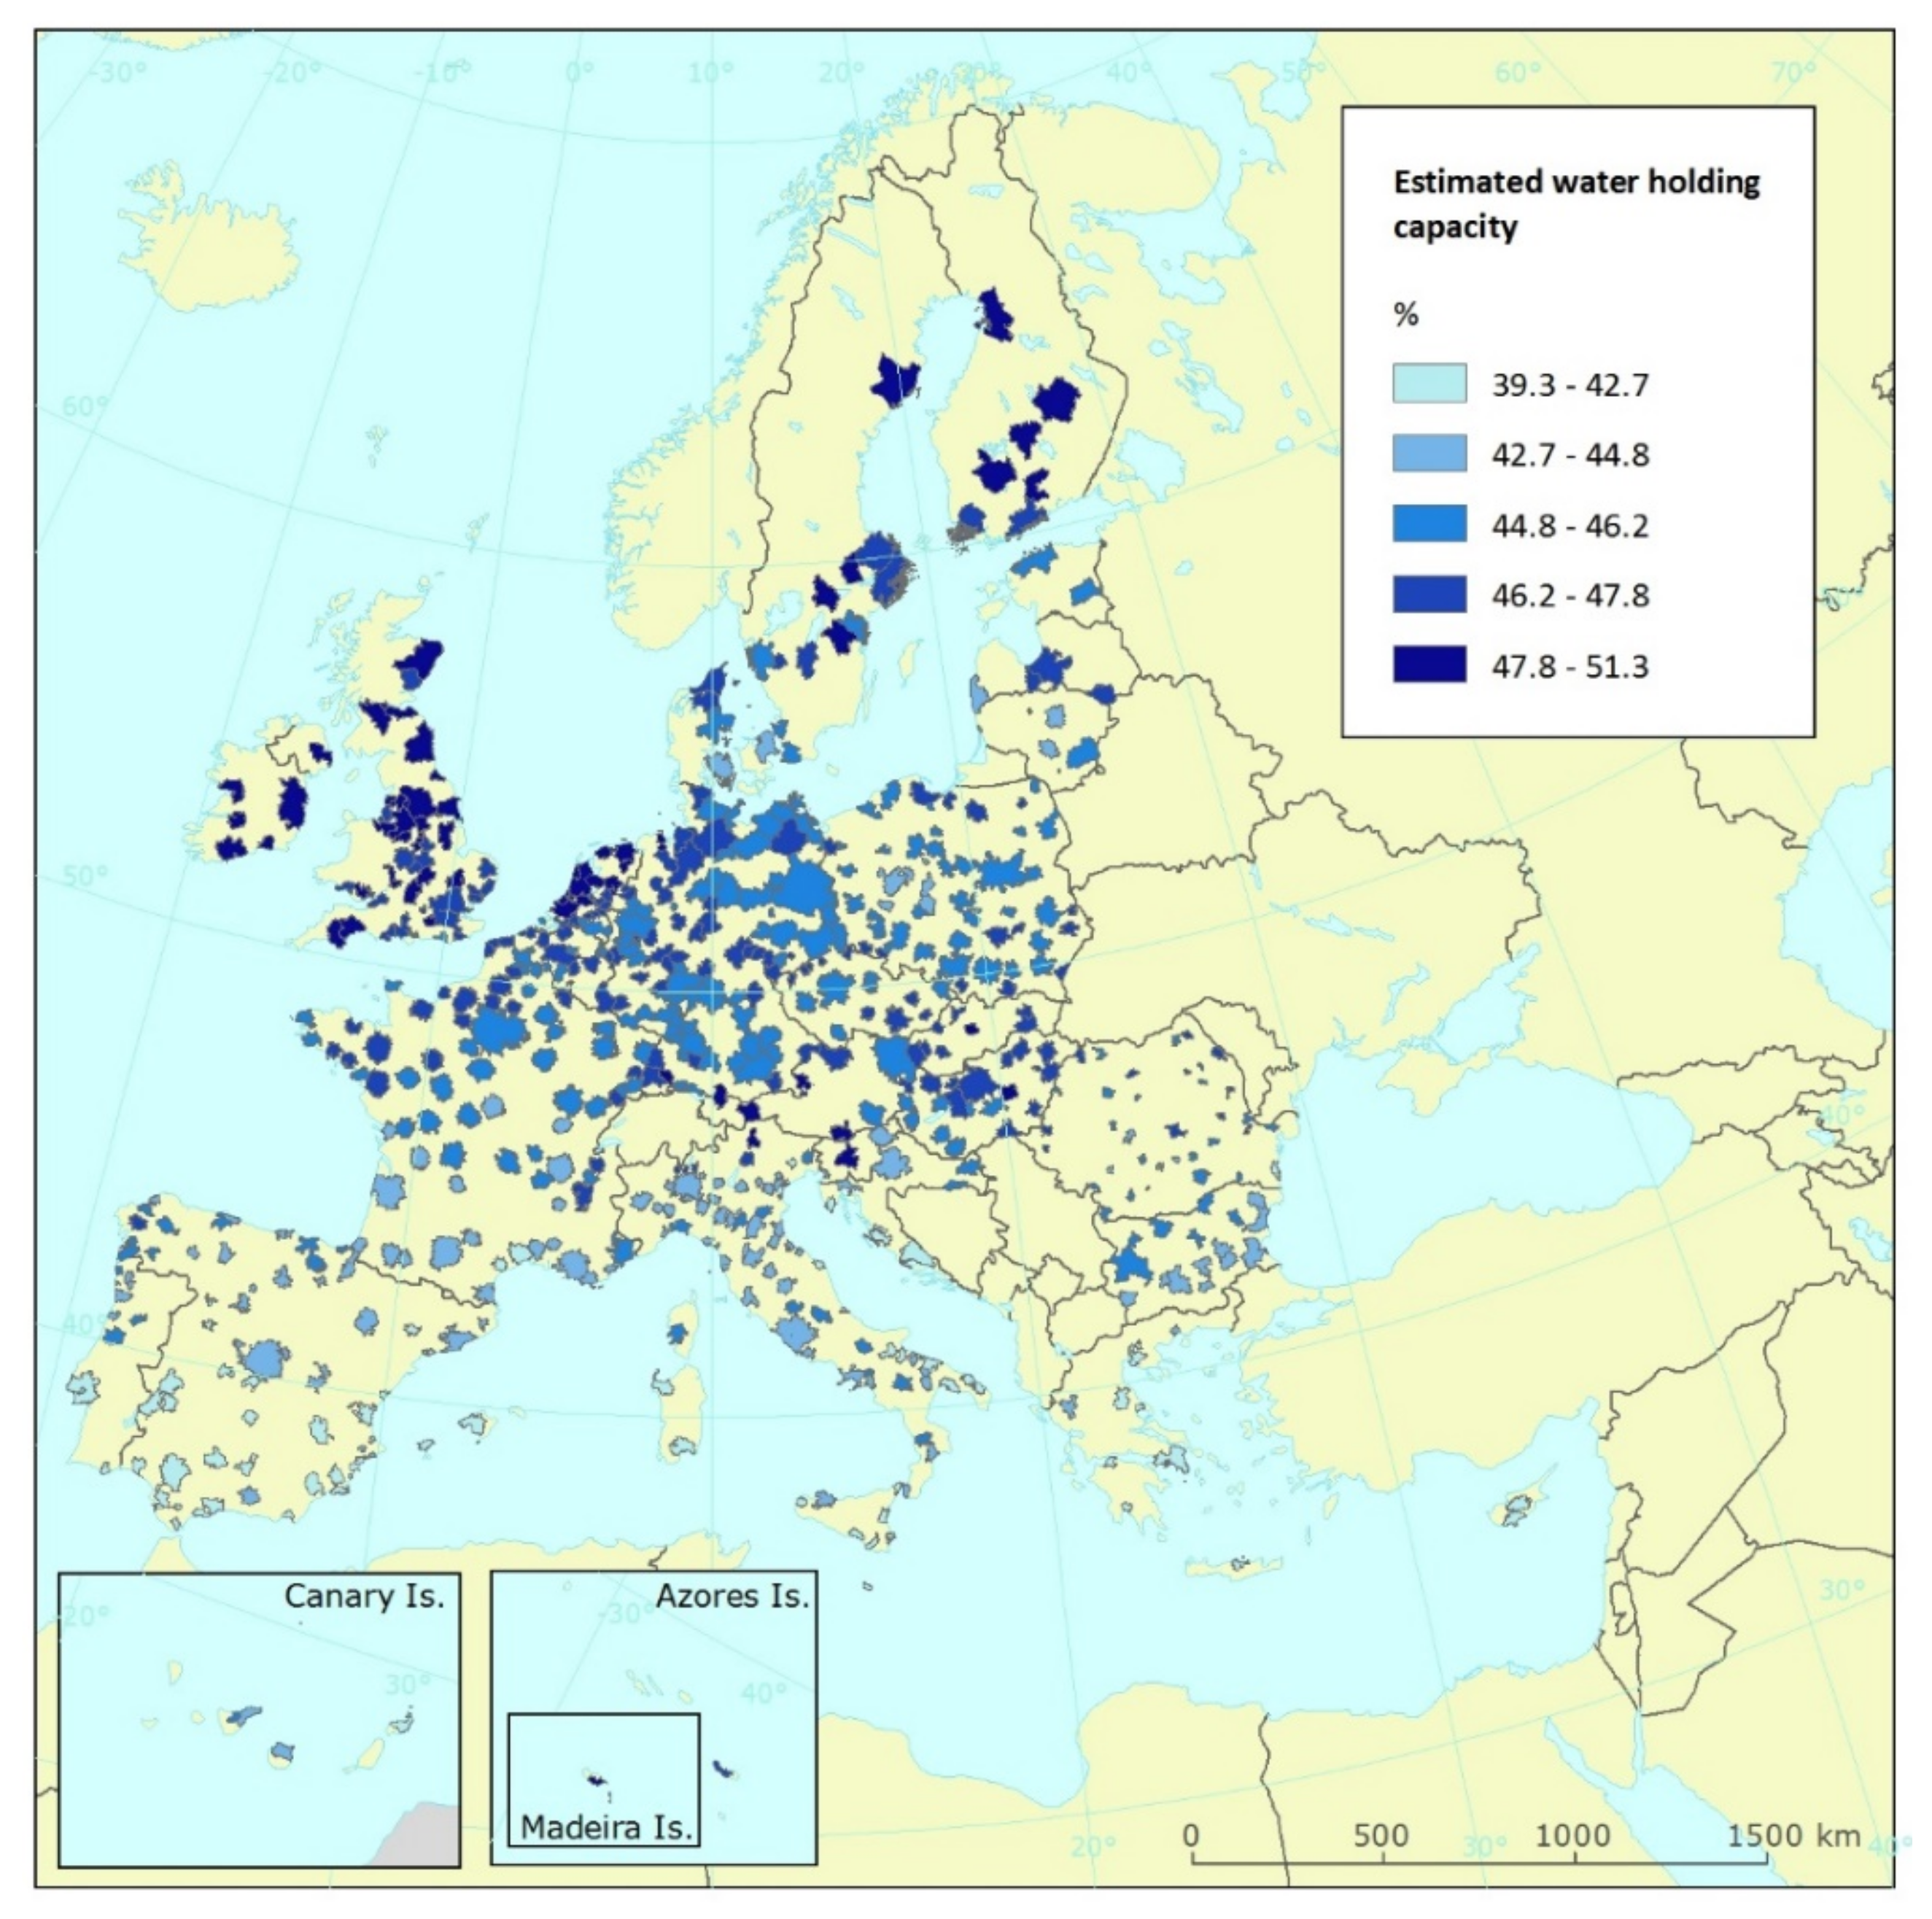
3.4. Sealing and Water Holding Capacity of Functional Urban Areas

In the era of increasing probability and magnitude of flood events due to changing climatic conditions in Europe, it is especially important to assess mitigation and adaptation options and the human-induced pressures which hinder these options. Soil sealing is one of the main human actions that lead to increased flood risk and the loss of ecosystems’ mitigation potential in the case of flood events.
In many FUAs in the EU-27 + UK region, the saturated water content of soils is approximately 50%, meaning that about half of the soil’s space may be filled with water. These soils are mostly located in the northern and Atlantic regions (Figure 7). Several of these are in the Netherlands (Alphen aan den Rijn, Leeuwarden, Gouda, Groningen, etc.), in Finland (Tampere, Lahti, Jyvaskyla, Kuopio) as well as Limerick (Ireland) and Innsbruck (Austria). In Southern Europe, the saturated water content is lower, below 40%, especially in Cartagena (Spain), Lemesos (Cyprus), Siracusa and Gela (Italy) or Pula Pola (Croatia).
The estimated loss of potential water storage between 2012 and 2018, due to soil sealing, in FUAs of the European Union and the UK amounted to around 670 million m3 (Figure 8). The estimated loss of potential water holding capacity due to sealing was highest in those areas of the FUAs where the impact is also the highest due to resulting floods causing economic impacts and loss of human life. Thus, approximately 56% of the potential loss of water storage was observed in complex areas of industrial, commercial, public and military units, which can be assumed to be those areas with a very high amount of sealed, impermeable surfaces. Another large contributor to the potential loss of water holding capacity in FUAs (29% of the lost potential) was discontinuous urban fabric, yet another land cover type with a high proportion of impermeable surfaces.
There is a distinct spatial pattern across FUAs with regard to the loss of water holding capacity. On average, around ten thousand cubic meters of water storage capacity were potentially lost per FUAs in the EU-27 + UK region. The highest potential losses were estimated for the Functional Urban Area of Paris, with almost 10 million m3. Other FUAs with a high impact of sealing on potential water holding capacity were those of Warszawa and Bordeaux with around 8 million m3 and Krakow, Hamburg and Amsterdam with around and slightly above 6 million m3 potential loss (Figure 9). This amount equals more than eight days non-stop flow of the river Loire (which has a watershed of 117,356 km2).

4. Discussion

Land take entails the conversion of non-urban areas into urban areas that usually happens at the expense of semi-natural areas. The most intense form of land take is soil sealing, which is an essentially irreversible process that leads to the destruction or covering of soils by buildings and other constructions with completely or partly impermeable artificial material (asphalt, concrete, etc.). Soil sealing accompanies land take, but areas subject to land take are usually not entirely sealed.
The principle of sustainability implies that mostly low-productivity lands should be subject to land consumption, considering zero net land take targets, meaning compensation by remediated land. Low productivity lands, in general, are seen as less relevant for biodiversity, as a continental-scale study by Aksoy et al. proposed [30]. However, recent studies on the relationship between productivity and biodiversity in terrestrial and aquatic systems show that the correlation between the two may vary [31,32] with a strong scale dependency [33]. The complexity of the issue underlines the need for further research, especially to collect site-specific evidence to determine targeted policy solutions. Nevertheless, it is worth keeping in mind that soil sealing happens mainly on prime lands and on lands with medium productivity, and therefore, the principle of sustaining ecosystem capacities is disregarded in many areas in Europe. In 2018, 50% of FUAs occupied medium-productivity lands, and 25% extended over high-productivity surfaces. Sealing in FUAs occurred at an alarming rate on croplands, with 35% of all sealing happening on this land-use type. Cropland conversions are worrying for both losing the land resource base for crop production [7] and because cropland soils have a large potential to sequester carbon, which is lost by sealing [34]. In fact, carbon sequestration potential largely depends on soil types, as studies in this field from different regions of the world revealed [35,36,37], but also on soil management [16,17] and other environmental factors such as climate [38].
As far as the effect of soil sealing on the water cycle is concerned, the strong correlation is confirmed by the literature [39,40]. While groundwater potential is threatened by sealing, in some cases, groundwater quality is also deteriorated [41]. Although our study did not cover water quality criteria, nor quantification of lost groundwater recharge, our assumptions on the lost potential of water capacity and its potential consequences in flood propagation are in line with the literature [40,42,43].
Our current findings show this relationship in a spatially explicit manner, also reflecting the policy challenges under different biophysical conditions, but also some of the effects of remediation efforts. For instance, lower levels of a loss of capacity to sequester carbon in Southern Europe are probably due to the combined effect of a generally lower carbon sequestration potential in the soils, meaning that even without sealing, only a small increase in carbon concentration would be possible and the greening measures in FUAs. The latter was put in place to counteract the impacts of heatwaves and droughts in order to facilitate climate change adaptation and resulted in the conversion of sealed land to open surfaces that are again capable of sequestering carbon. Greening has proven to be effective based on small-scale studies of stakeholder involvement [40], although it may not mean an immediate solution for optimizing all land functions [44]. Nevertheless, interdisciplinary approaches, including socio-economic aspects, can help design alternative solutions to soil sealing during land development [45].
Our study underlines that land-use efficiency needs to improve substantially. This should include the application of zoning during land-use planning for the optimization of agricultural resources [46] and the range of greening measures for improving urban ecosystems and the water cycle [47,48,49]. However, while we need to act now, there is no legally binding policy target in relation to land take and soil sealing at the EU level. The new EU soil strategy for 2030 calls on Member States to only set land take targets for 2030, with the aim of reaching land take neutrality by 2050.

5. Conclusions

This study shows that soil sealing in Functional Urban Areas in Europe has multiple negative effects, from hindering food security through the removal of productive land to accelerating climate change by increasing heat islands and reducing a key mitigation option provided by soil carbon sequestration and damaging the water storage potential of surface soil layers. The spatial pattern of quantitative estimates of these effects also reveals the dynamics in the geographical context of the EU and the UK.
Europe cannot continue its recent land take trends, as the continuous loss of ecosystem functions renders it increasingly vulnerable to natural disasters, while it continues to lose biodiversity and impacts climate, water cycle and biomass production.
The figures provided in this study may help policymakers and regional and local land-use planners to interact for sustainable urban development in Europe.

Author Contributions

Conceptualization, G.T., E.I. and J.F.-E.; methodology, G.T.; software, R.M.A.; validation, M.G. and G.P.; formal analysis, R.M.A. and E.M.; data curation, R.M.A. and E.M.; writing—original draft preparation, G.T.; writing—review and editing, E.I. and G.P.; visualization, R.M.A. All authors have read and agreed to the published version of the manuscript.

Funding

This research received no external funding.

Institutional Review Board Statement

Not applicable.

Informed Consent Statement

Not applicable.

Data Availability Statement

Publicly available datasets were analyzed in this study. This data can be found here: https://land.copernicus.eu/ (accessed on 2 May 2022).

Conflicts of Interest

The authors declare no conflict of interest.

Appendix A. Estimating Soil Sealing from the Urban Atlas Classes

This report has implemented an estimation of soil sealing and its change in FUAs using the Urban Atlas as an ancillary data set. A sealing share (average percentage of sealing within the class) has been assigned to each Urban Atlas class based on the product specification and on expert knowledge. These sealing shares, detailed in the table below, have been utilized to calculate an estimated change in sealed or impervious areas between 2012 and 2018.
Table A1. Sealing share per Urban Atlas class.
Urban Atlas Class CodeUrban Atlas Class NameEstimated Sealing Share (%)
11,100Continuous urban fabric (S.L. > 80%)90
11,210Discontinuous dense urban fabric (S.L. 50–80%)65
11,220Discontinuous medium density urban fabric (S.L. 30–50%)40
11,230Discontinuous low-density urban fabric (S.L. 10–30%)20
11,240Discontinuous very-low-density urban fabric (S.L. < 10%)5
11,300Isolated structures10
12,100Industrial, commercial, public, military and private units60
12,210Fast transit roads and associated land40
12,220Other roads and associated land40
12,230Railways and associated land40
12,300Port areas80
12,400Airports60
13,100Mineral extraction and dump sites10
13,300Construction sites30
13,400Land without current use5
14,100Green urban areas5
14,200Sports and leisure facilities5
21,000Arable land (annual crops)0
22,000Permanent crops0
23,000Pastures0
24,000Complex and mixed cultivation0
25,000Orchards0
31,000Forests0
32,000Herbaceous vegetation associations0
33,000Open spaces with little or no vegetation0
40,000Wetlands0
50,000Water0
Note: S.L., sealing layer. Source: Own elaboration from Urban Atlas specifications.

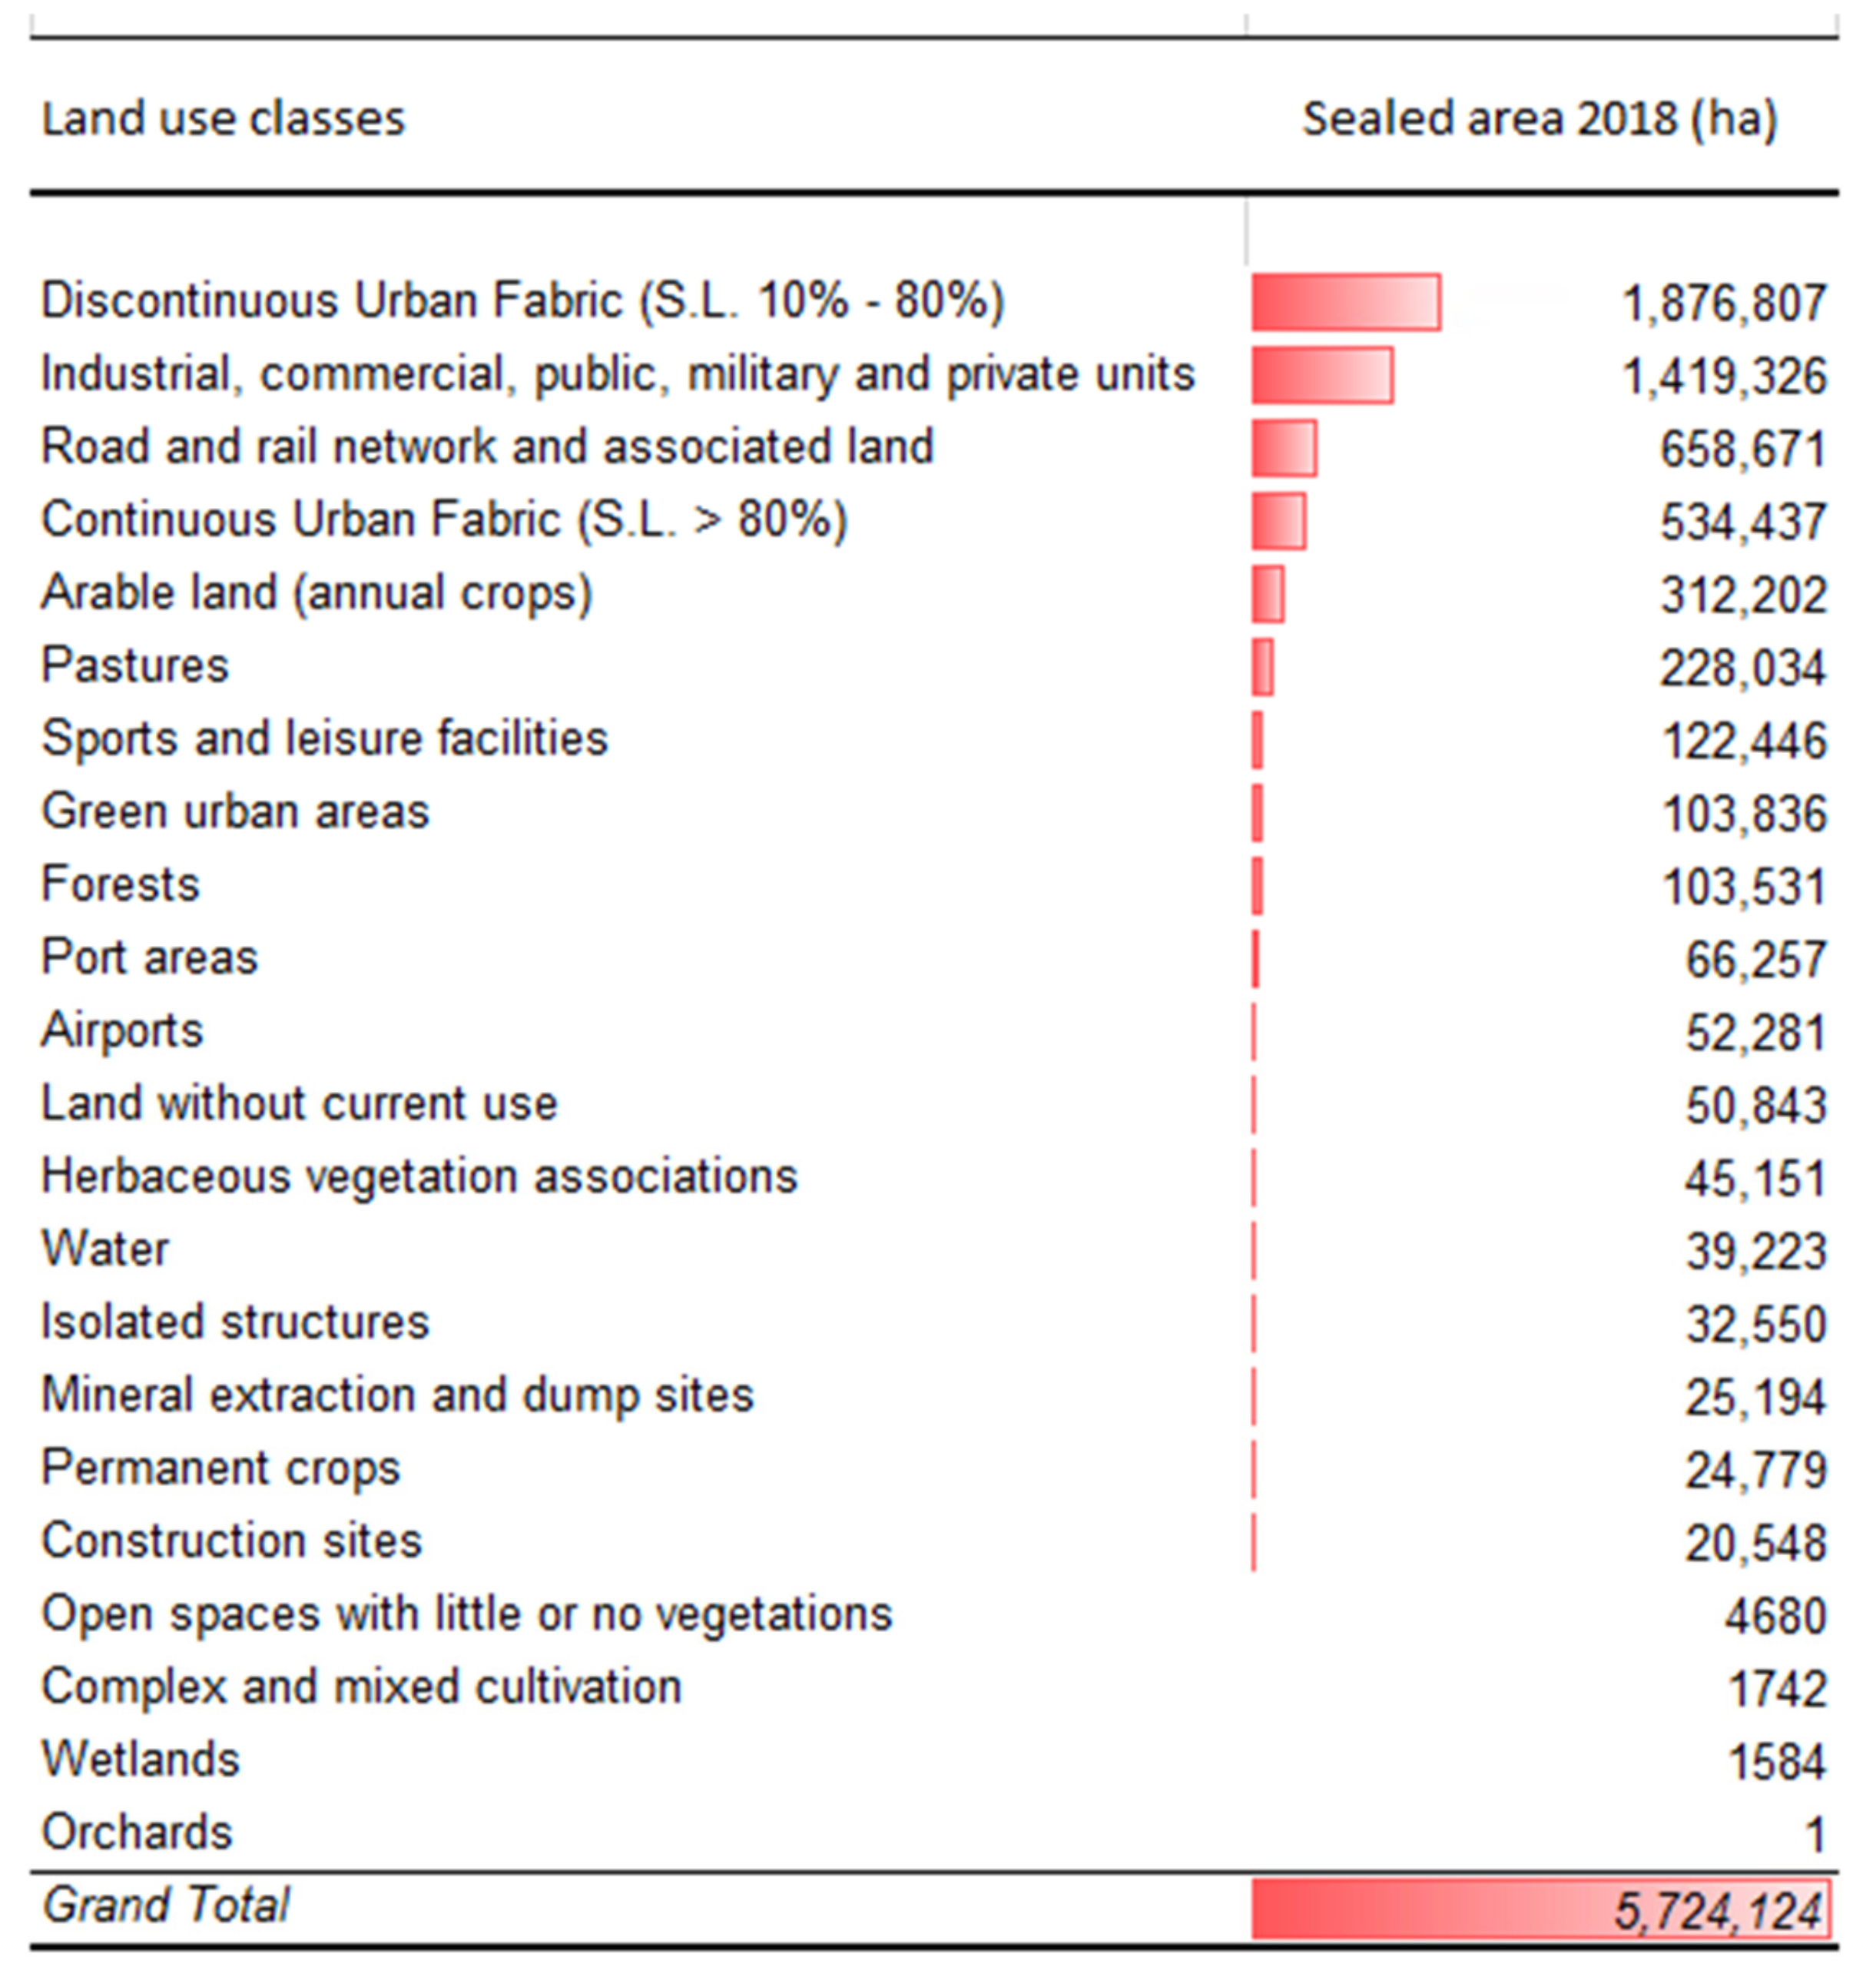
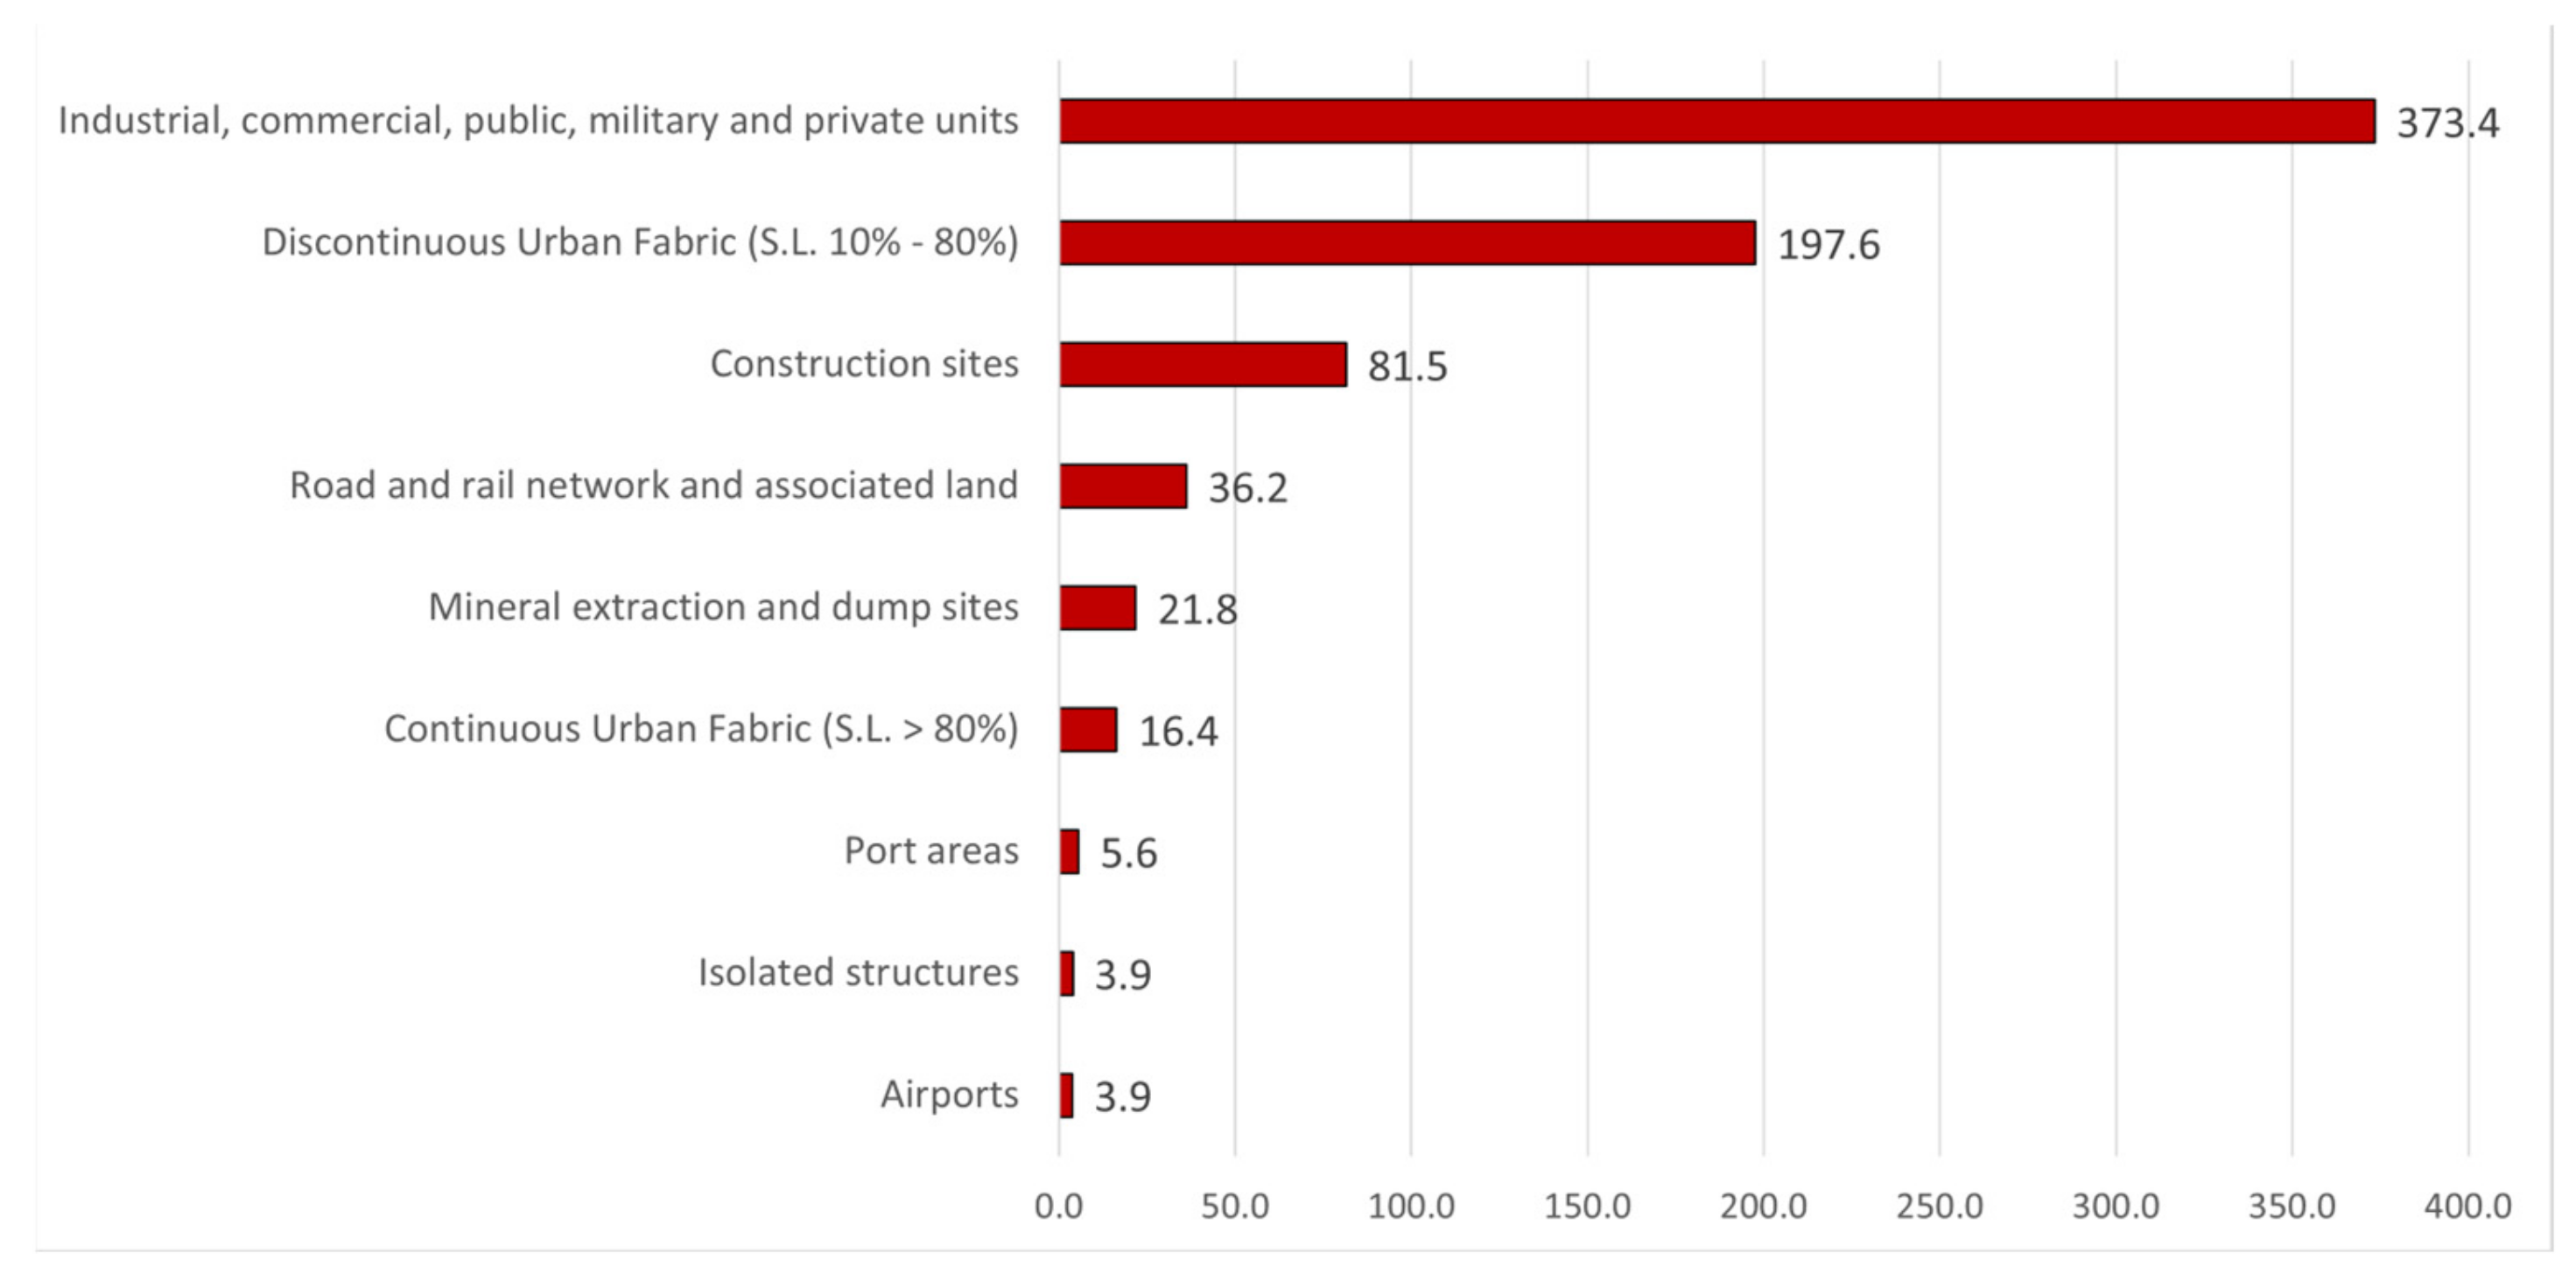
Appendix B. Sealed Area per Urban Atlas Classes, 2018

Figure A1. Sealed area per Urban Atlas classes (2018). Derived from the Imperviousness Degree dataset of the Copernicus Land Monitoring Service [50]. The cut-off value of 30% was applied to calculated sealed vs. non-sealed surfaces.
Land 11 00840 g0a1

References

  1. European Environment Agency (EEA). Land Take in Europe. Indicator Specification. Available online: https://www.eea.europa.eu/data-and-maps/indicators/land-take-3 (accessed on 3 May 2022).
  2. European Environment Agency (EEA). Urban Atlas. European Environment Agency, Copenhagen, 2012. Available online: https://land.copernicus.eu/local/urban-atlas/urban-atlas-2012 (accessed on 2 May 2022).
  3. McKinney, M.L. Urbanization, biodiversity, and conservation. Bioscience 2002, 52, 883–890. [Google Scholar] [CrossRef]
  4. Pereira, H.M.; Leadley, P.W.; Proença, V.; Alkemade, J.R.M.; Scharlemann, J.P.W.; Fernandez-Manjarres, J.F.; Araujo, M.B.; Balvanera, P.; Biggs, R.; Cheung, W.W.L.; et al. Scenarios for global biodiversity in the 21st century. Science 2010, 330, 1496–1501. [Google Scholar] [CrossRef] [PubMed] [Green Version]
  5. Barbero-Sierra, C.; Marques, M.J.; Ruiz-Pérez, M. The case of urban sprawl in Spain as an active and irreversible driving force for desertification. J. Arid Environ. 2013, 90, 95–102. [Google Scholar] [CrossRef]
  6. Charzyński, P.; Plak, A.; Hanaka, A. Influence of the soil sealing on the geoaccumulation index of heavy metals and various pollution factors. Environ. Sci. Pollut. Res. 2016, 24, 4801–4811. [Google Scholar] [CrossRef] [PubMed] [Green Version]
  7. Tóth, G. Impact of land-take on the land resource base for crop production in the European Union. Sci. Total Environ. 2012, 435–436, 202–214. [Google Scholar] [CrossRef]
  8. Naumann, S.; Frelih-Larsen, A.; Prokop, G.; Ittner, S.; Reed, M.; Mills, J.; Morari, F.; Verzandvoort, S.; Albrecht, S.; Bjuréus, A.; et al. Land Take and Soil Sealing—Drivers, Trends and Policy (Legal) Instruments: Insights from European Cities. In International Yearbook of Soil Law and Policy; Ginzky, H., Dooley, E., Heuser, I., Kasimbazi, E., Markus, T., Qin, T., Eds.; Springer: Berlin/Heidelberg, Germany, 2018; Volume 2018. [Google Scholar]
  9. Montanarella, L. Soil Sealing and Land Take as Global Soil Threat. The Policy Perspective. In Urban Expansion, Land Cover and Soil Ecosystem Services; Gardi, C., Ed.; Routledge: London, UK, 2017; Chapter 19; 332p. [Google Scholar]
  10. Dijkstra, L.; Poelman, H.; Veneri, P.; OECD. The EU-OECD Definition of a Functional Urban Area; OECD Regional Development Working Papers; OECD: Paris, France, 2019; 19p. [Google Scholar] [CrossRef]
  11. Concepción, E.; Obrist, M.K.; Moretti, M.; Altermatt, F.; Baur, B.; Nobis, M.P. Impacts of urban sprawl on species richness of plants, butterflies, gastropods and birds: Not only built-up area matters. Urban Ecosyst. 2016, 19, 225–242. [Google Scholar] [CrossRef]
  12. Gardi, C.; Panagos, P.; Van Liedekerke, M.; Bosco, C.; De Brogniez, D. Land-take and food security: Assessment of land-take on the agricultural production in Europe. J. Environ. Plan. Manag. 2014, 58, 898–912. [Google Scholar] [CrossRef]
  13. Fokaides, P.A.; Kylili, A.; Nicolaou, L.; Ioannou, B. The effect of soil sealing on the urban heat island phenomenon. Indoor Built Environ. 2016, 25, 1136–1147. [Google Scholar] [CrossRef]
  14. Murata, T.; Kawai, N. Degradation of the urban ecosystem function due to soil sealing: Involvement in the heat island phenomenon and hydrologic cycle in the Tokyo metropolitan area. Soil Sci. Plant Nutr. 2018, 64, 145–155. [Google Scholar] [CrossRef]
  15. Food and Agriculture Organization of the United Nations (FAO); Intergovernmental Technical Panel on Soils (ITPS). Status of the World’s Soil Resources (SWSR)—Main Report; FAO/ITPS: Rome, Italy, 2015. [Google Scholar]
  16. Poeplau, C.; Don, A. Carbon sequestration in agricultural soils via cultivation of cover crops—A meta-analysis. Agric. Ecosyst. Environ. 2015, 200, 33–41. [Google Scholar] [CrossRef]
  17. Baveye, P.C.; Otten, W.; Kravchenko, A.; Balseiro-Romero, M.; Beckers, É.; Chalhoub, M.; Darnault, C.; Eickhorst, T.; Garnier, P.; Hapca, S.; et al. Emergent Properties of Microbial Activity in Heterogeneous Soil Microenvironments: Different Research Approaches Are Slowly Converging, Yet Major Challenges Remain. Front. Microbiol. 2018, 9, 1929. [Google Scholar] [CrossRef] [PubMed]
  18. Van Groenigen, J.W.; van Kessel, C.; Hungate, B.A.; Oenema, O.; Powlson, D.S.; van Groenigen, K.J. Sequestering Soil Organic Carbon: A Nitrogen Dilemma. Environ. Sci. Technol. 2017, 51, 4738–4739. [Google Scholar] [CrossRef] [PubMed] [Green Version]
  19. Copernicus Land Monitoring Service. Urban Atlas. Available online: https://land.copernicus.eu/local/urban-atlas (accessed on 3 April 2022).
  20. Gregor, M.; Löhnertz, M.; Milego, R.; Fons, J.; Maucha, G.; Mancosu, E.; Littkopf, A.; Ivits, E. Time Series Inconsistency in the Copernicus HRL Imperviousness Analysis of the 2015–2018 Changes, Implications and Conclusions; ETC/ULS Technical Report 1/2021; European Topic Centre on Urban, Land and Soil Systems (ETC/ULS): Vienna, Austria; Environment Agency Austria: Vienna, Austria, 2021; 14p. [Google Scholar]
  21. Eurostat 2021. Database. Functional Urban Areas. Available online: https://ec.europa.eu/eurostat/web/cities/data/database (accessed on 3 April 2022).
  22. Maes, J.; Teller, A.; Erhard, M.; Liquete, C.; Braat, L.; Berry, P.; Egoh, B.; Puydarrieux, P.; Fiorina, C.; Santos, F.; et al. Mapping and Assessment of Ecosystems and Their Services. An Analytical Framework for Ecosystem Assessments under Action 5 of the EU Biodiversity Strategy to 2020; Publications Office of the European Union: Luxembourg, 2013. [Google Scholar]
  23. Ivits, E.; Milego, R.; Mancosu, E.; Gregor, M.; Petersen, J.E.; Büttner, G.; Löhnertz, M.; Maucha, G.; Petrik, O.; Bastrup-Birk, A.; et al. Environment Agency Austria, Vienna, Austria: 2020. In Land and Ecosystem Accounts for Europe. Towards Geospatial Environmental Accounting 2020; ETC/ULS Technical Report 2/2020; European Topic Centre on Urban, Land and Soil Systems (ETC/ULS): Vienna, Austria; Environment Agency Austria: Vienna, Austria, 2020; 69p. [Google Scholar]
  24. European Environment Agency. Data and Maps. Indicators. Vegetation Productivity. Available online: https://www.eea.europa.eu/data-and-maps/indicators/land-productivity-dynamics/assessment (accessed on 3 April 2022).
  25. Ivits, E.; Cherlet, M. Land-Productivity Dynamics Towards integrated assessment of land degradation at global scales. EUR 2013, 26052. [Google Scholar] [CrossRef]
  26. Lugato, E.; Bampa, F.; Panagos, P.; Montanarella, L.; Jones, A. Potential carbon sequestration of European arable soils estimated by modelling a comprehensive set of management practices. Glob. Chang. Biol. 2014, 20, 3557–3567. [Google Scholar] [CrossRef] [PubMed] [Green Version]
  27. FAO; ITPS. Global Soil Organic Carbon Map (GSOCmap) Technical Report; FAO/ITPS: Rome, Italy, 2018; 162p. [Google Scholar]
  28. Tóth, B.; Weynants, M.; Pásztor, L.; Hengl, T. 3D soil hydraulic database of Europe at 250 m resolution. Hydrol. Process. 2017, 31, 2662–2666. [Google Scholar] [CrossRef] [Green Version]
  29. EEA. Land and Soil. In The European Environment—State and Outlook 2020: Knowledge for Transition to a Sustainable Europe, European Environment Agency. 2020. Available online: https://www.eea.europa.eu/soer/publications/soer-2020 (accessed on 3 April 2022).
  30. Aksoy, E.; Louwagie, G.; Gardi, C.; Gregor, M.; Schröder, C.; Löhnertz, M. Assessing soil biodiversity potentials in Europe. Sci. Total Environ. 2017, 589, 236–249. [Google Scholar] [CrossRef] [PubMed]
  31. Wardle, D.A. Do experiments exploring plant diversity—Ecosystem functioning relationships inform how biodiversity loss impacts natural ecosystems? J. Veg. Sci. 2016, 27, 646–653. [Google Scholar] [CrossRef]
  32. Wu, A.P.; Ye, S.Y.; Yuan, J.R.; Qi, L.Y.; Cai, Z.W.; Ye, B.B.; Wang, Y.H. The relationship between diversity and productivity from a three-dimensional space view in a natural mesotrophic lake. Ecol. Indic. 2021, 121, 107069. [Google Scholar] [CrossRef]
  33. Luo, W.; Liang, J.; Cazzolla, G.R.; Zhao, X.; Zhang, C. Parameterization of biodiversity-productivity relationship and its scale dependency using georeferenced tree-level data. J. Ecol. 2019, 107, 1106–1119. [Google Scholar] [CrossRef]
  34. Yao, J.; Kong, X. Modeling the effects of land-use optimization on the soil organic carbon sequestration potential. J. Geogr. Sci. 2018, 28, 1641–1658. [Google Scholar] [CrossRef] [Green Version]
  35. Hagedorn, F.; Maurer, S.; Egli, P.; Blaser, P.; Bucher, J.B.; Siegwolf, R. Carbon sequestration in forest soils: Effects of soil type, atmospheric CO2 enrichment, and N deposition. Eur. J. Soil Sci. 2001, 52, 619–628. [Google Scholar] [CrossRef]
  36. Vågen, T.-G.; Lal, R.; Singh, B.R. Soil carbon sequestration in sub-Saharan Africa: A review. Land Degrad. Dev. 2005, 16, 53–71. [Google Scholar] [CrossRef]
  37. Lal, R. Digging deeper: A holistic perspective of factors affecting soil organic carbon sequestration in agroecosystems. Glob. Chang. Biol. 2018, 24, 3285–3301. [Google Scholar] [CrossRef] [PubMed]
  38. Davidson, E.; Janssens, I. Temperature sensitivity of soil carbon decomposition and feedbacks to climate change. Nature 2006, 440, 165–173. [Google Scholar] [CrossRef] [PubMed]
  39. Pistocchi, A. Hydrological Impacts of Soil Sealing and Urban Land Take. In Urban Expansion, Land Cover and Soil Ecosystem Services; Routledge: London, UK; Taylor & Francis Group: New York, NY, USA, 2017. [Google Scholar]
  40. Rahman, A.; Khan, A.; Haq, N.; Samiullah, S.R. Soil Sealing and Depletion of Groundwater in Rapidly Growing Peshawar City District Pakistan. In Urban Drought. Disaster Risk Reduction; Ray, B., Shaw, R., Eds.; Springer: Singapore, 2019; pp. 289–309. [Google Scholar]
  41. Pistocchi, A.; Calzolari, C.; Malucelli, F.; Ungaro, F. Soil sealing and flood risks in the plains of Emilia-Romagna, Italy. J. Hydrol. Reg. Stud. 2015, 4(Part B), 398–409. [Google Scholar] [CrossRef]
  42. Recanatesi, F.; Petroselli, A. Land Cover Change and Flood Risk in a Peri-Urban Environment of the Metropolitan Area of Rome (Italy). Water Resour. Manag. 2020, 34, 4399–4413. [Google Scholar] [CrossRef]
  43. Artmann, M. Managing urban soil sealing in Munich and Leipzig (Germany)—From a wicked problem to clumsy solutions. Land Use Policy 2015, 46, 21–37. [Google Scholar] [CrossRef]
  44. Tardieu, L.; Hamel, P.; Viguié, V.; Coste, L.; Levrel, H. Are soil sealing indicators sufficient to guide urban planning? Insights from an ecosystem services assessment in the Paris metropolitan area. Environ. Res. Lett. 2021, 16, 1–14. [Google Scholar] [CrossRef]
  45. Artmann, M. Urban gray vs. urban green vs. soil protection—Development of a systemic solution to soil sealing management on the example of Germany. Environ. Impact Assess. Rev. 2016, 59, 27–42. [Google Scholar] [CrossRef]
  46. Gosnell, H.; Kline, J.D.; Chrostek, G.; Duncan, J. Is Oregon’s land use planning program conserving forest and farm land? A review of the evidence. Land Use Policy 2011, 28, 185–192. [Google Scholar] [CrossRef]
  47. Tobias, S.; Conen, F.; Duss, A.; Wenzel, L.M.; Buser, C.; Alewell, C. Soil sealing and unsealing: State of the art and examples. Land Degrad. Dev. 2018, 29, 2015–2024. [Google Scholar] [CrossRef]
  48. Burian, S.J.; Pomeroy, C.A. Urban Impacts on the Water Cycle and Potential Green Infrastructure Implications. In Urban Ecosystem Ecology. Agronomy Monograph; Aitkenhead Peterson, J., Volder, A., Eds.; American Society of Agronomy, Crop Science Society of America, Soil Science Society of America: Madison, WI, USA, 2010; Volume 55. [Google Scholar]
  49. Minixhofer, P.; Stangl, R. Green Infrastructures and the Consideration of Their Soil-Related Ecosystem Services in Urban Areas—A Systematic Literature Review. Sustainability 2021, 13, 3322. [Google Scholar] [CrossRef]
  50. EEA. Imperviousness Density 2018. Available online: https://land.copernicus.eu/pan-european/high-resolution-layers/imperviousness/status-maps/imperviousness-density-2018 (accessed on 2 May 2022).
Figure 1. Soil sealing and sealing increased during 2012–2018 in Functional Urban Areas by land use (EU-27 and the UK region).
Land 11 00840 g001
Figure 2. Estimated sealed land in % of the total area in Functional Urban Areas in 2018.
Land 11 00840 g002
Figure 3. Soil sealing and sealing increased during 2012–2018 in FUAs by ecosystem types and land productivity classes (h = high, m = medium, l = low) in the EU-27 and the UK.
Land 11 00840 g003
Figure 4. Estimated loss of potential carbon sequestration in Functional Urban Areas because of sealing during 2012–2008, by ecosystems and land productivity.
Land 11 00840 g004
Figure 5. Estimated carbon sequestration potential (t/ha) in soils of the Functional Urban Areas.
Land 11 00840 g005
Figure 6. Estimated loss of soil carbon sequestration potential in Functional Urban Areas as a result of sealing during 2012–2008.
Land 11 00840 g006
Figure 7. Estimated water holding capacity of soils in Functional Urban Areas.
Land 11 00840 g007
Figure 8. Estimated loss of water holding capacity in Functional Urban Areas by land use because of sealing during 2012–2008 (mio m3).
Land 11 00840 g008
Figure 9. Estimated potential loss of water holding capacity in Functional Urban Areas because of sealing during 2012–2008.
Land 11 00840 g009
Publisher’s Note: MDPI stays neutral with regard to jurisdictional claims in published maps and institutional affiliations.

