Article

Land Degradation Neutrality: State and Trend of Degradation at the Subnational Level in Mexico

by
Itzel Arroyo
1,
Virginia Cervantes
2,
Víctor Tamaríz-Flores
3 and
Rosalía Castelán
3,*
1
Posgrado en Ciencias Ambientales, Instituto de Ciencias, Benemérita Universidad Autónoma de Puebla, Puebla 72580, Mexico
2
Departamento de El Hombre y su Ambiente, Universidad Autónoma Metropolitana-Xochimilco, Mexico City 04960, Mexico
3
Departamento de Investigación en Ciencias Agrícolas, Instituto de Ciencias, Benemérita Universidad Autónoma de Puebla, Puebla 72592, Mexico
*
Author to whom correspondence should be addressed.
Land 2022, 11(4), 562; https://doi.org/10.3390/land11040562
Submission received: 16 February 2022 / Revised: 14 March 2022 / Accepted: 8 April 2022 / Published: 11 April 2022
(This article belongs to the Special Issue Land Degradation and Sustainable Land Management)

Abstract

:
Identifying degraded lands and degradation trends is essential to determine measures that contribute to avoiding, reducing, and reversing the rate of deterioration of natural resources. In this study, we assessed the state and trend of degradation in Ixtacamaxtitlan, Puebla, Mexico, by determining the spatial and temporal changes of three indicators, Land Cover (LC), Land Productivity Dynamics (LPD), and Soil Organic Carbon (SOC), during the period 2000–2015, using global data proposed by the Convention to Combat Desertification for the implementation of Land Degradation Neutrality (LDN). The results showed increases in croplands (6.89%) and a reduction in grasslands (9.09%), with this being the transition that presents the most significant extension in the territory. The LPD is the indicator where the most deterioration was observed, and due to negative changes in LC, SOC losses were estimated at more than 7000 tons in the study period. The proportion of degraded land was 19% of approximately 567.68 km2 of Ixtacamaxtitlan’s surface. Although the municipality presents incipient degradation and only a tiny part showed improvement, identifying areas with degradation processes in this work will favor degradation monitoring and the adequate planning and application of restoration measures in the local context to promote the path towards LDN.

1. Introduction

Land degradation (LD) is a globally relevant environmental problem [1,2] that negatively affects biodiversity, ecosystem services, and the lives of millions of people by promoting poverty and migration [3,4]. However, the dynamics and complexity of this phenomenon make it challenging to diagnose due to the heterogeneity and interaction of biophysical and socioeconomic factors that impact the land [5,6]. Some of its main drivers are climatic variations, extreme weather events, land-use changes, deforestation, overgrazing, inadequate agricultural practices, and population growth [6,7].
Several studies have evaluated the phenomenon of LD at international [8,9,10] and national scales [11,12]. These studies have meant progress in integrating knowledge about ecosystems and the factors that cause degradation [13]. However, the studies conducted in the last 30 years present inconsistencies due to the complexity, variety, and quantity of indicators used; therefore, the information is not comparable between regions [14,15,16]. Furthermore, data is scarce at more minor scales (local and regional). In many cases, the implementation and reproducibility of methodologies are costly and hardly applicable [15,17].
Recently, the United Nations General Assembly introduced the concept of “Land Degradation Neutrality” (LDN), which is part of one of the Sustainable Development Goals (specifically SDG 15.3) and whose purpose is to avoid, reduce, and reverse land degradation (decision 3/COP.12) [1]. Thus, it seeks to maintain a balance between the quantity and quality of non-degraded and degraded land or land in the process of degradation [18].
The LDN is estimated by applying a conceptual and methodological scientific framework conducted by the Convention to Combat Desertification (UNCCD) [19,20]. In this framework, the assessment of LD employs three biophysical indicators: (a) Land Cover (LC), (b) Land Productivity Dynamics (LPD), and (c) Soil Organic Carbon (SOC). The determination of the indicators serves as a basis for establishing the current state of the land, knowing the changes and trends over time, monitoring the progress or reverse of degradation, and determining the proportion of degraded land (SDG 15.3.1) [19,20,21,22]. In addition, the convention provides a global dataset to diagnose land changes and proposes a diagnosis over a 15-year period, which allows for the determining of degradation trends [18,20].
Most of the studies of LDN have been conducted since 2015. They examine the concept [3,23,24,25,26,27] and apply LDN methodology at national levels [18,28,29,30] or in large watersheds (>1000 km2) [5,13,31,32]. However, in some of these studies, only one of the three indicators was used [33,34], and in others, the information for these was obtained from methods different from those recommended by the UNCCD [4], which limits making a comparison between them.
According to our review, there are no published studies for Mexico about LDN assessment, possibly because there is no information on LPD and SOC indicators. In addition, the necessary data posted by the National Institute of Statistics and Geography (INEGI, Mexico) to determine the country’s LC present variations in terms of the categories of classification, the temporal scale, and the methodology used [35]. Therefore, it is difficult to perform a detailed quantification of the indicators’ state and trend and the changes that occurred over time, both at national and local scales. This situation does not allow proposal strategies to be planned, managed, and implemented to minimize the negative effects of degradation on environmental, social, and economic dimensions [36].
This paper presents the application of the LDN methodology at the local level, taking as the study system the municipality of Ixtacamaxtitlan located in the Sierra Norte of Puebla (Mexico). Ixtacamaxtitlan presents diverse contrasts between the vegetation, relief, and climate that make it vulnerable to degradation [37]. In addition, a series of hydrometeorological phenomena, anthropic processes affecting the state of natural resources, socio-environmental conflicts, and poverty have been documented for the study area [38,39,40,41,42]. However, there is no detailed quantification of its environmental state nor its potential risk of degradation.
The objective of the present study was to determine the state and trend of land degradation in Ixtacamaxtitlan, Puebla, Mexico, in the period from 2000 to 2015 through the LDN framework indicators. For this purpose, the global dataset recommended by the UNCCD [19] and the proposed methodology for LD assessment [22] were used. This methodology has been accepted worldwide and used at global, national, and regional levels, providing important information on land degradation.
The relevance of this research consists of applying the methodology at the local level over a period of 15 years, obtaining information on positive and negative trends and changes in the three indicators evaluated. Due to its spatial and temporal coherence, the use of global data allows the comparison between regions, easy interpretation of the results, the identification of degradation processes over time, and monitoring to 2030. In this sense, some socioeconomic and biophysical factors related to environmental deterioration in Ixtacamaxtitlán were highlighted. Furthermore, this investigation represents a baseline at the local level in the context of LDN, being the starting point for the development of public policies and strategies focused on the conservation, recovery, and restoration of natural resources.

2. Materials and Methods

2.1. Study Site

Ixtacamaxtitlan municipality is located in the north of Puebla, Mexico, between 19°27′–19°45′ N and 97°41′–98°03′ W, with a total area of 567.68 km2 (Figure 1). Its altitude varies between 2000 and 3400 masl with a temperate and semi-cold sub-humid summer rains climate. The average annual precipitation is typically 800 mm, and the temperature ranges between 12–18 °C [37]. The predominant soils are lithosols, regosols, and phaeozems [43]. The main economic activities practiced are agriculture, livestock, and forestry [37,44]. About 40% of the landscape consists of forested areas with primary and secondary vegetation of pine, fir, juniper, and pine-oak forests and regions of desert scrub [44].

2.2. Data Sources

The LC was determined from the data set of the European Space Agency’s Climate Change Initiative (ESA-CCI-LC) program, available at a spatial resolution of 300 m [19,45].
The Land Productivity Dynamics (LPD) was determined from the Normalized Difference Vegetation Index (NDVI), obtained from the Terra Moderate Resolution Imaging Spectroradiometer (MODIS, MOD13Q1) dataset. This set provides a time series of NDVI images generated at 16-day intervals and integrated annually at a spatial resolution of 250 m [46].
For the estimation of Soil Organic Carbon stock (SOC) (tC ha−1), the SoilGrids250 dataset developed by the International Soil Reference Information Center (ISRIC) was used. SoildGrids is a global raster layer at 250 m spatial resolution that predicts carbon stocks in the first 30 cm of soil depth, accounting for bulk density and gravel fraction [47,48].
The cartography processing (projection, delimitation, pixel adjustment and matching, classification, and map algebra) and the determination of the indicator’s state and trend were carried out in the QGis 3.12 and ArcGis 10.4 programs. The coordinate reference system used in the cartography was WGS84/UTM zone 14 N projection.

2.3. Detection and Analysis of Land Cover Changes

The LC classification from the ESA-CCI-LC dataset [49] was reclassified to the seven land-use categories proposed by the Intergovernmental Panel on Climate Change (IPCC) [50] and the LDN methodological framework [19] (Table 1). To determine the LC trend for each category, the total annual surface was quantified for every year of the study (2000 to 2015).
LC changes were analyzed with the start (2000) and end (2015) maps using a cross-tabulation matrix [19,51]. A change was considered positive or negative according to the transition from one LC category to another in the study period [52].

2.4. Determination of Land Productivity Dynamics

The NDVI trend was determined by calculating the arithmetic mean of the territory in each year (2000 to 2015). The index is dimensionless, and its values range from −1 to +1, where a higher value indicates more vegetation abundance, density, or health [5].
Subsequently, NDVI values in 2000 and 2015 were categorized into 5 classes: no data (<0.18); very weak (0.18–0.40); weak (0.40–0.63); moderate (0.63–0.80); and intensive (>0.80) [5,47,53]. The surface area for those years (2000 and 2015) was determined for each NDVI class, and then, the percentage of change was calculated by dividing the percentage of area in 2015 between the percentage of the area in 2000 minus 1 and multiplied by 100.
LPD describes the variability of land productivity based on the natural or productive characteristics of the Land Cover relative to its maximum potential NDVI range [5,47]. Thus, LPD is categorized into five qualitative classes of land productivity trends: 1 (declining productivity); 2 (early signs of decline); 3 (stable but stressed); 4 (stable, not stressed); 5 (increasing productivity) [19,22,54].
The LPD distribution map was made from a double-entry matrix with the determined 2015 NDVI classes and 2015 LC categories. First, each LC category (with or without changes) was assigned an LPD classification [5,47]. Then, the area of each given LPD class was determined by the same process used to calculate LC changes.

2.5. Soil Organic Carbon (SOC) Stocks Assessment

The SOC stock trend was determined using the annual arithmetic mean for every year of the study (2000 to 2015).
An overlay of the layers from the beginning and end of the period was performed with the SOC coverage information to determine the changes and surface (km2) encompassed by these changes. Regions that experienced a decrease in SOC ≥10% were considered potentially degraded, while those that experienced an increase ≥10% were considered potentially improved [55]. Finally, the SOC loss (tC ha−1) associated with negative changes in LC was determined.

2.6. Land Degradation State

As a result of the evaluation of the change processes produced in each of the indicators, negative changes were classified as “degradation”, positive changes as “improvement”, and areas that did not present transformation as “stable” [19,20]. In the case of LPD, areas classified as degradation were those whose LPD class was the lowest ranked, depending on their LC category.
A final map of degraded land was obtained by an intersection with the change maps of the three indicators. Areas were classified as degraded if at least one of the three indicators, LC, LPD, or SOC, presented a negative change; this was taking the principle of one-out-all-out (1OAO) as a basis [20,52,56].

2.7. Statistical Analysis

Mean NDVI values and mean SOC stock for 2000 and 2015 were compared with an analysis of variance (ANOVA) with a 95% confidence interval. Statistical analyses were performed with the Minitab® software version 19.1.

3. Results

3.1. Land Cover

The spatial and temporal distribution of the Land Cover (LC) categories in Ixtacamaxtitlan during the study period is shown in Figure 2. As can be seen, there are extensive forested areas distributed mainly in the center-south of the municipality, with some zones to the north and northwest. Croplands and grasslands were located in the center, with additional zones throughout the territory (Figure 2a).
The annual trend of the LC categories shows that croplands increased their surface, whereas grasslands had a decrease. During this period, forest lands showed minimal fluctuations between gains and extension losses (Figure 2b).
In 2000, the forest lands category predominated, followed by the croplands, each one with more than 36% occupancy (Table 2). However, by 2015, forest lands had a slight negative change, and croplands became the category with the largest surface area in the territory (38.65%).

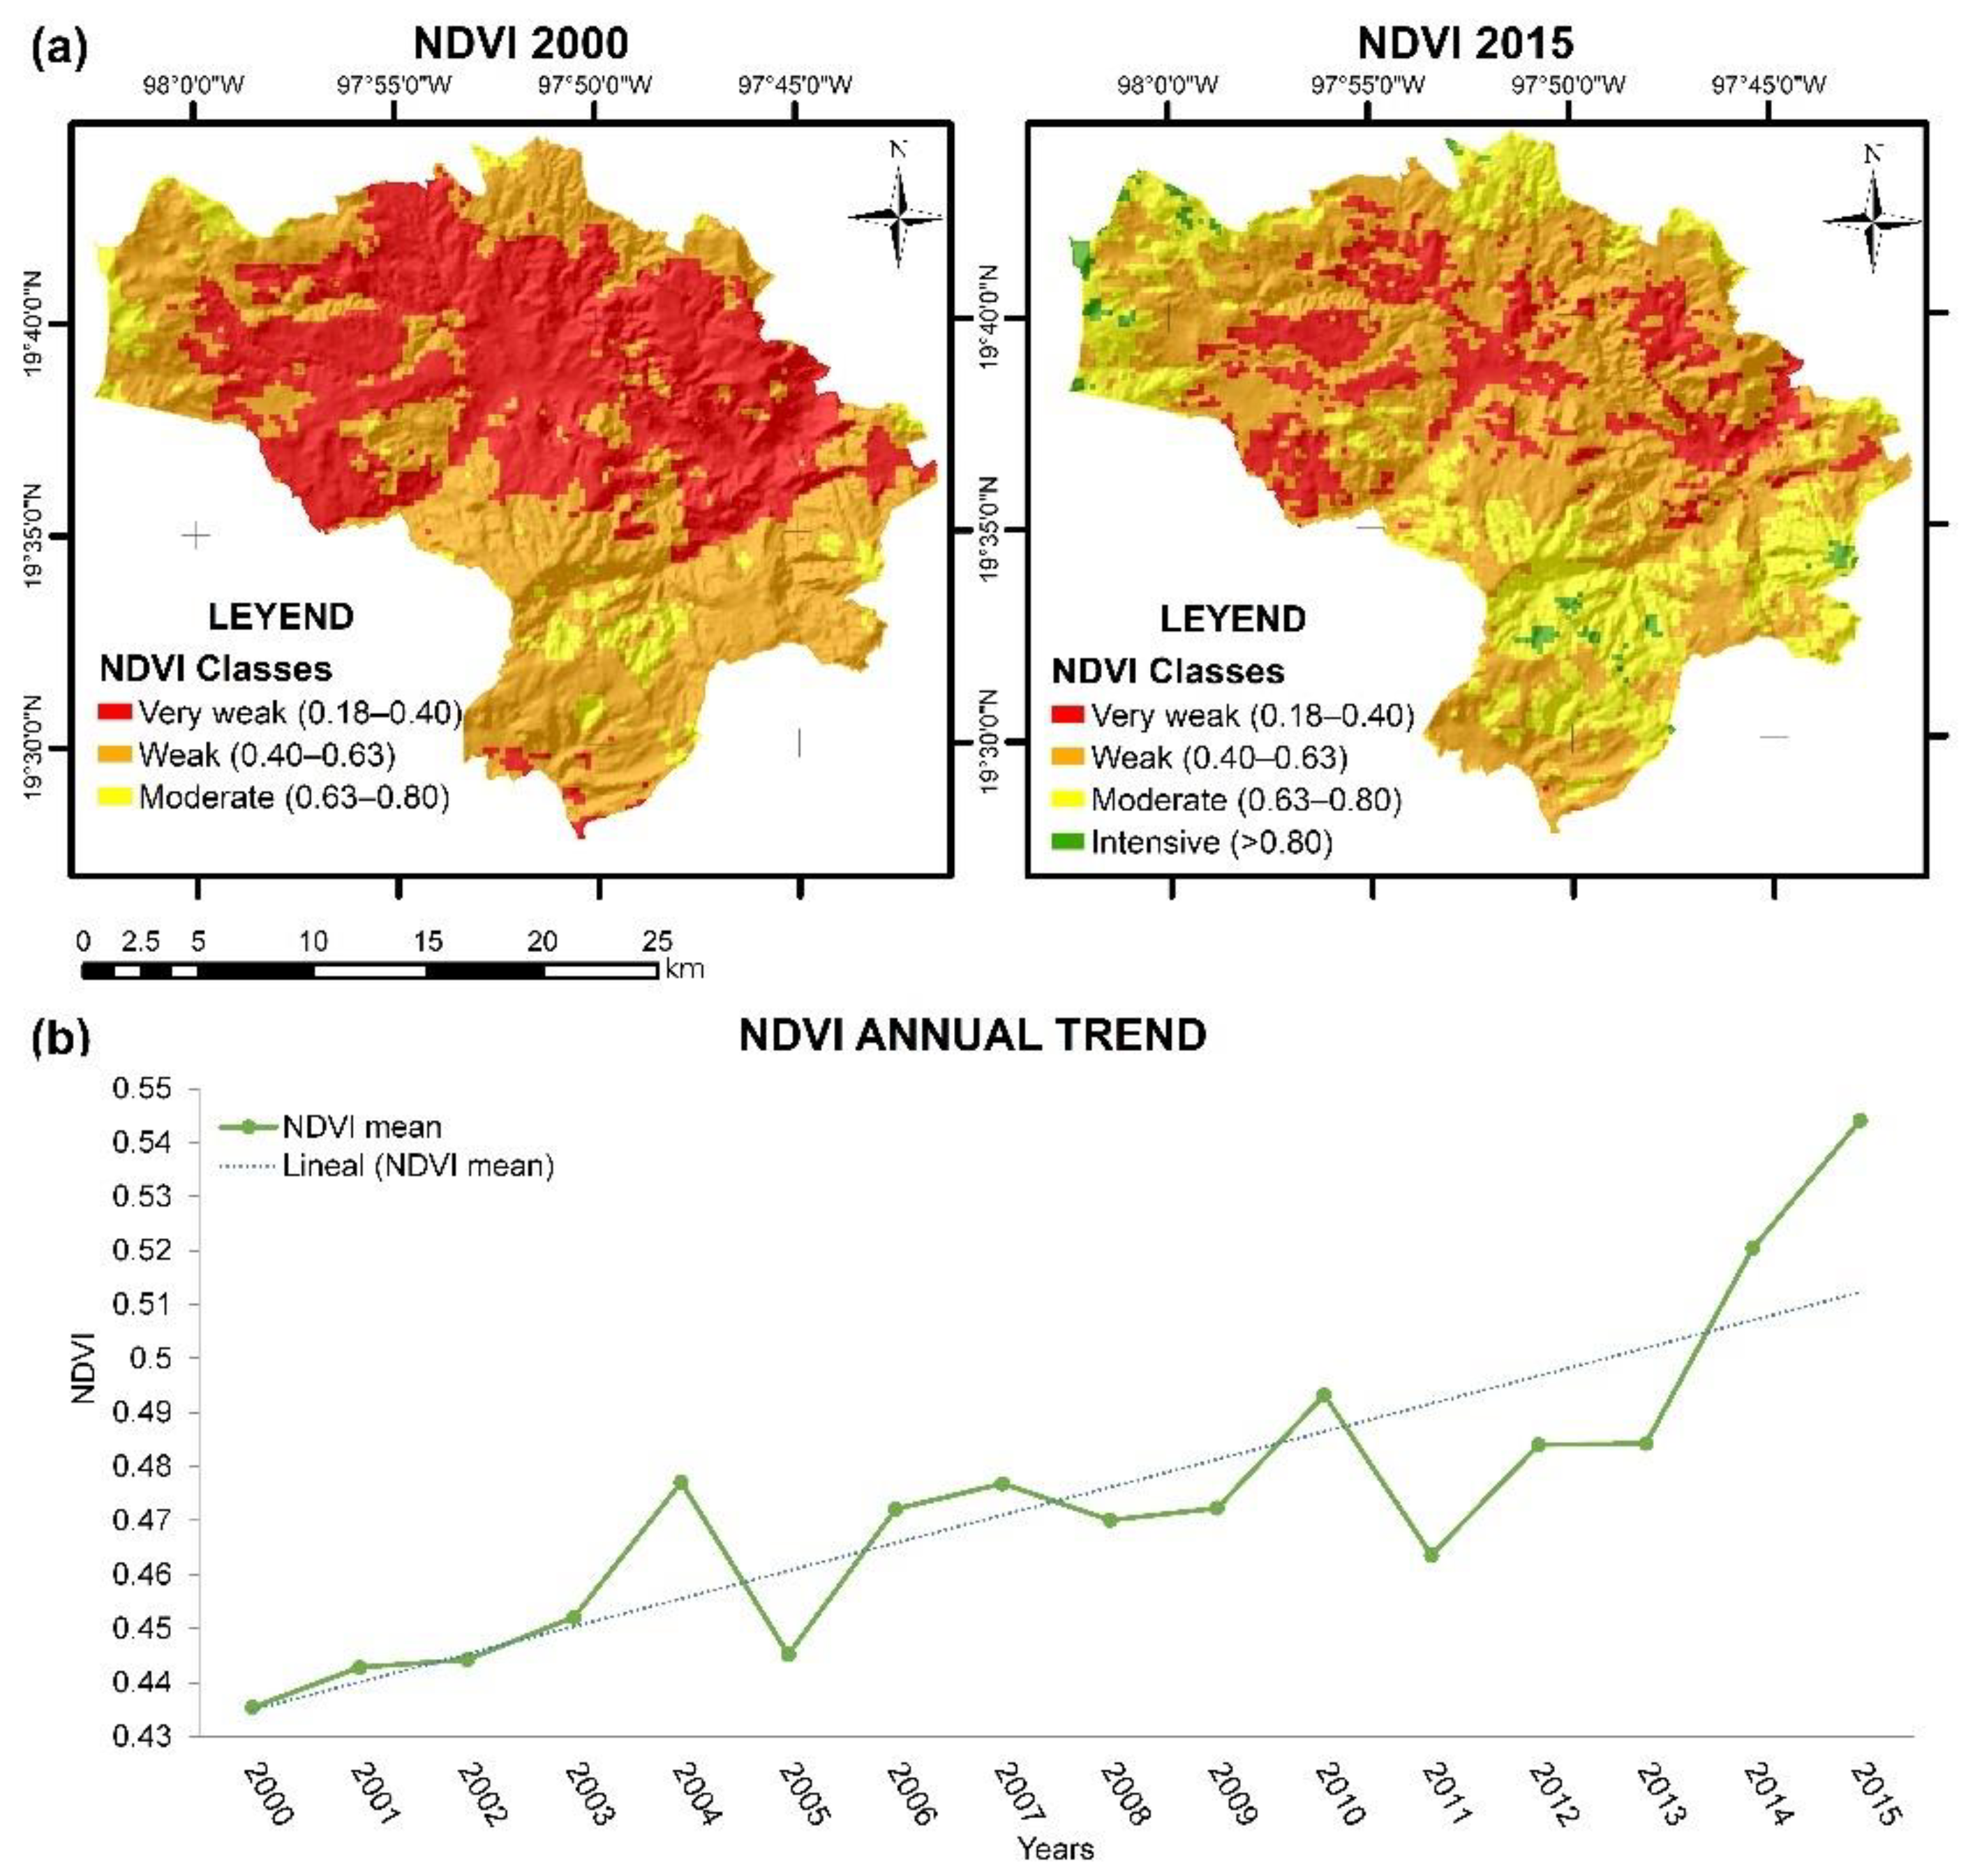
3.2. Land Productivity Dynamics

The spatial distribution of NDVI classes for the years 2000 and 2015 in Ixtacamaxtitlan is shown in Figure 3a. The “very weak” and “weak” classes occurred in the central zone, where more croplands and grasslands were observed. On the other hand, NDVI values higher than 0.63 (moderate and intensive classes) were found in the south and northwest of the municipality, in areas associated with forest lands.
The NDVI annual mean (2000 to 2015) showed a positive trend during the study period (Figure 3b), with a statistically significant difference between 2000 and 2015 (p = 0.000); in 2000, the NDVI value was 0.43 (min. 0.18 and max. 0.76), and in 2015, it was 0.54 (min. 0.21 and max. 0.83). However, throughout the analyzed period, decreases in NDVI were observed in 2013, 2011, and 2005, being more pronounced in the last year.
In 2000, the density and abundance of vegetation considered “very weak” and “weak” was present in 94.32% of the territory. Furthermore, in that year, the vegetation did not exceed the NDVI value of 0.80, so the “intensive” class was inexistent (Table 3).
In 2015, the “very weak” class had a decrease in its extension, while the “weak”, “moderate”, and “intensive” classes increased; the increase of more than 366% in the “moderate” class stood out (Table 3). However, even though there was a positive trend, the annual mean in 2015 was classified as “weak”, and the extension occupied by the “very weak” and “weak” classes was larger than the “moderate” and “intensive”.
The analysis of the Land Productivity Dynamics (LPD), calculated from the LC and NDVI classes, is shown in Table 4. In areas with no change in the LC during the period, most of the forest lands showed a “stable, not stressed” productivity (34.48%), while the persistent grasslands presented a “stable but stressed” productivity (22.31%), and croplands exhibited “early signs of decline” (22.23%). The most extensive distribution of LPD classes in areas with negative LC changes were “declining productivity” (0.22%) due to forest loss; “early signs of decline” due to a loss of grasslands (1.27%), and “declining productivity” due to a croplands decrease (0.01%).
The spatial and proportional distribution of the LPD classes along Ixtacamaxtitlan is shown in Figure 4. The areas with “increasing productivity” presented few fragments over the municipal surface arranged in the center-south and northwest zone, in high areas considered forest lands (Figure 4a). On the contrary, areas classified as “declining productivity” were distributed to a greater extent in the central strip of the municipality, associated with cropland and grassland categories.
These findings were confirmed by the LPD area distribution data (Figure 4b), which showed that a quarter (25.77%) of the territory’s vegetation showed “early signs of decline”, while more than 15% was classified as “declining productivity”. With this information, it was defined that despite the NDVI trend showing an improvement, the dynamics between the NDVI classes, the LC categories, and their changes in the study period showed degradation processes in the intensity and persistence of the vegetation.

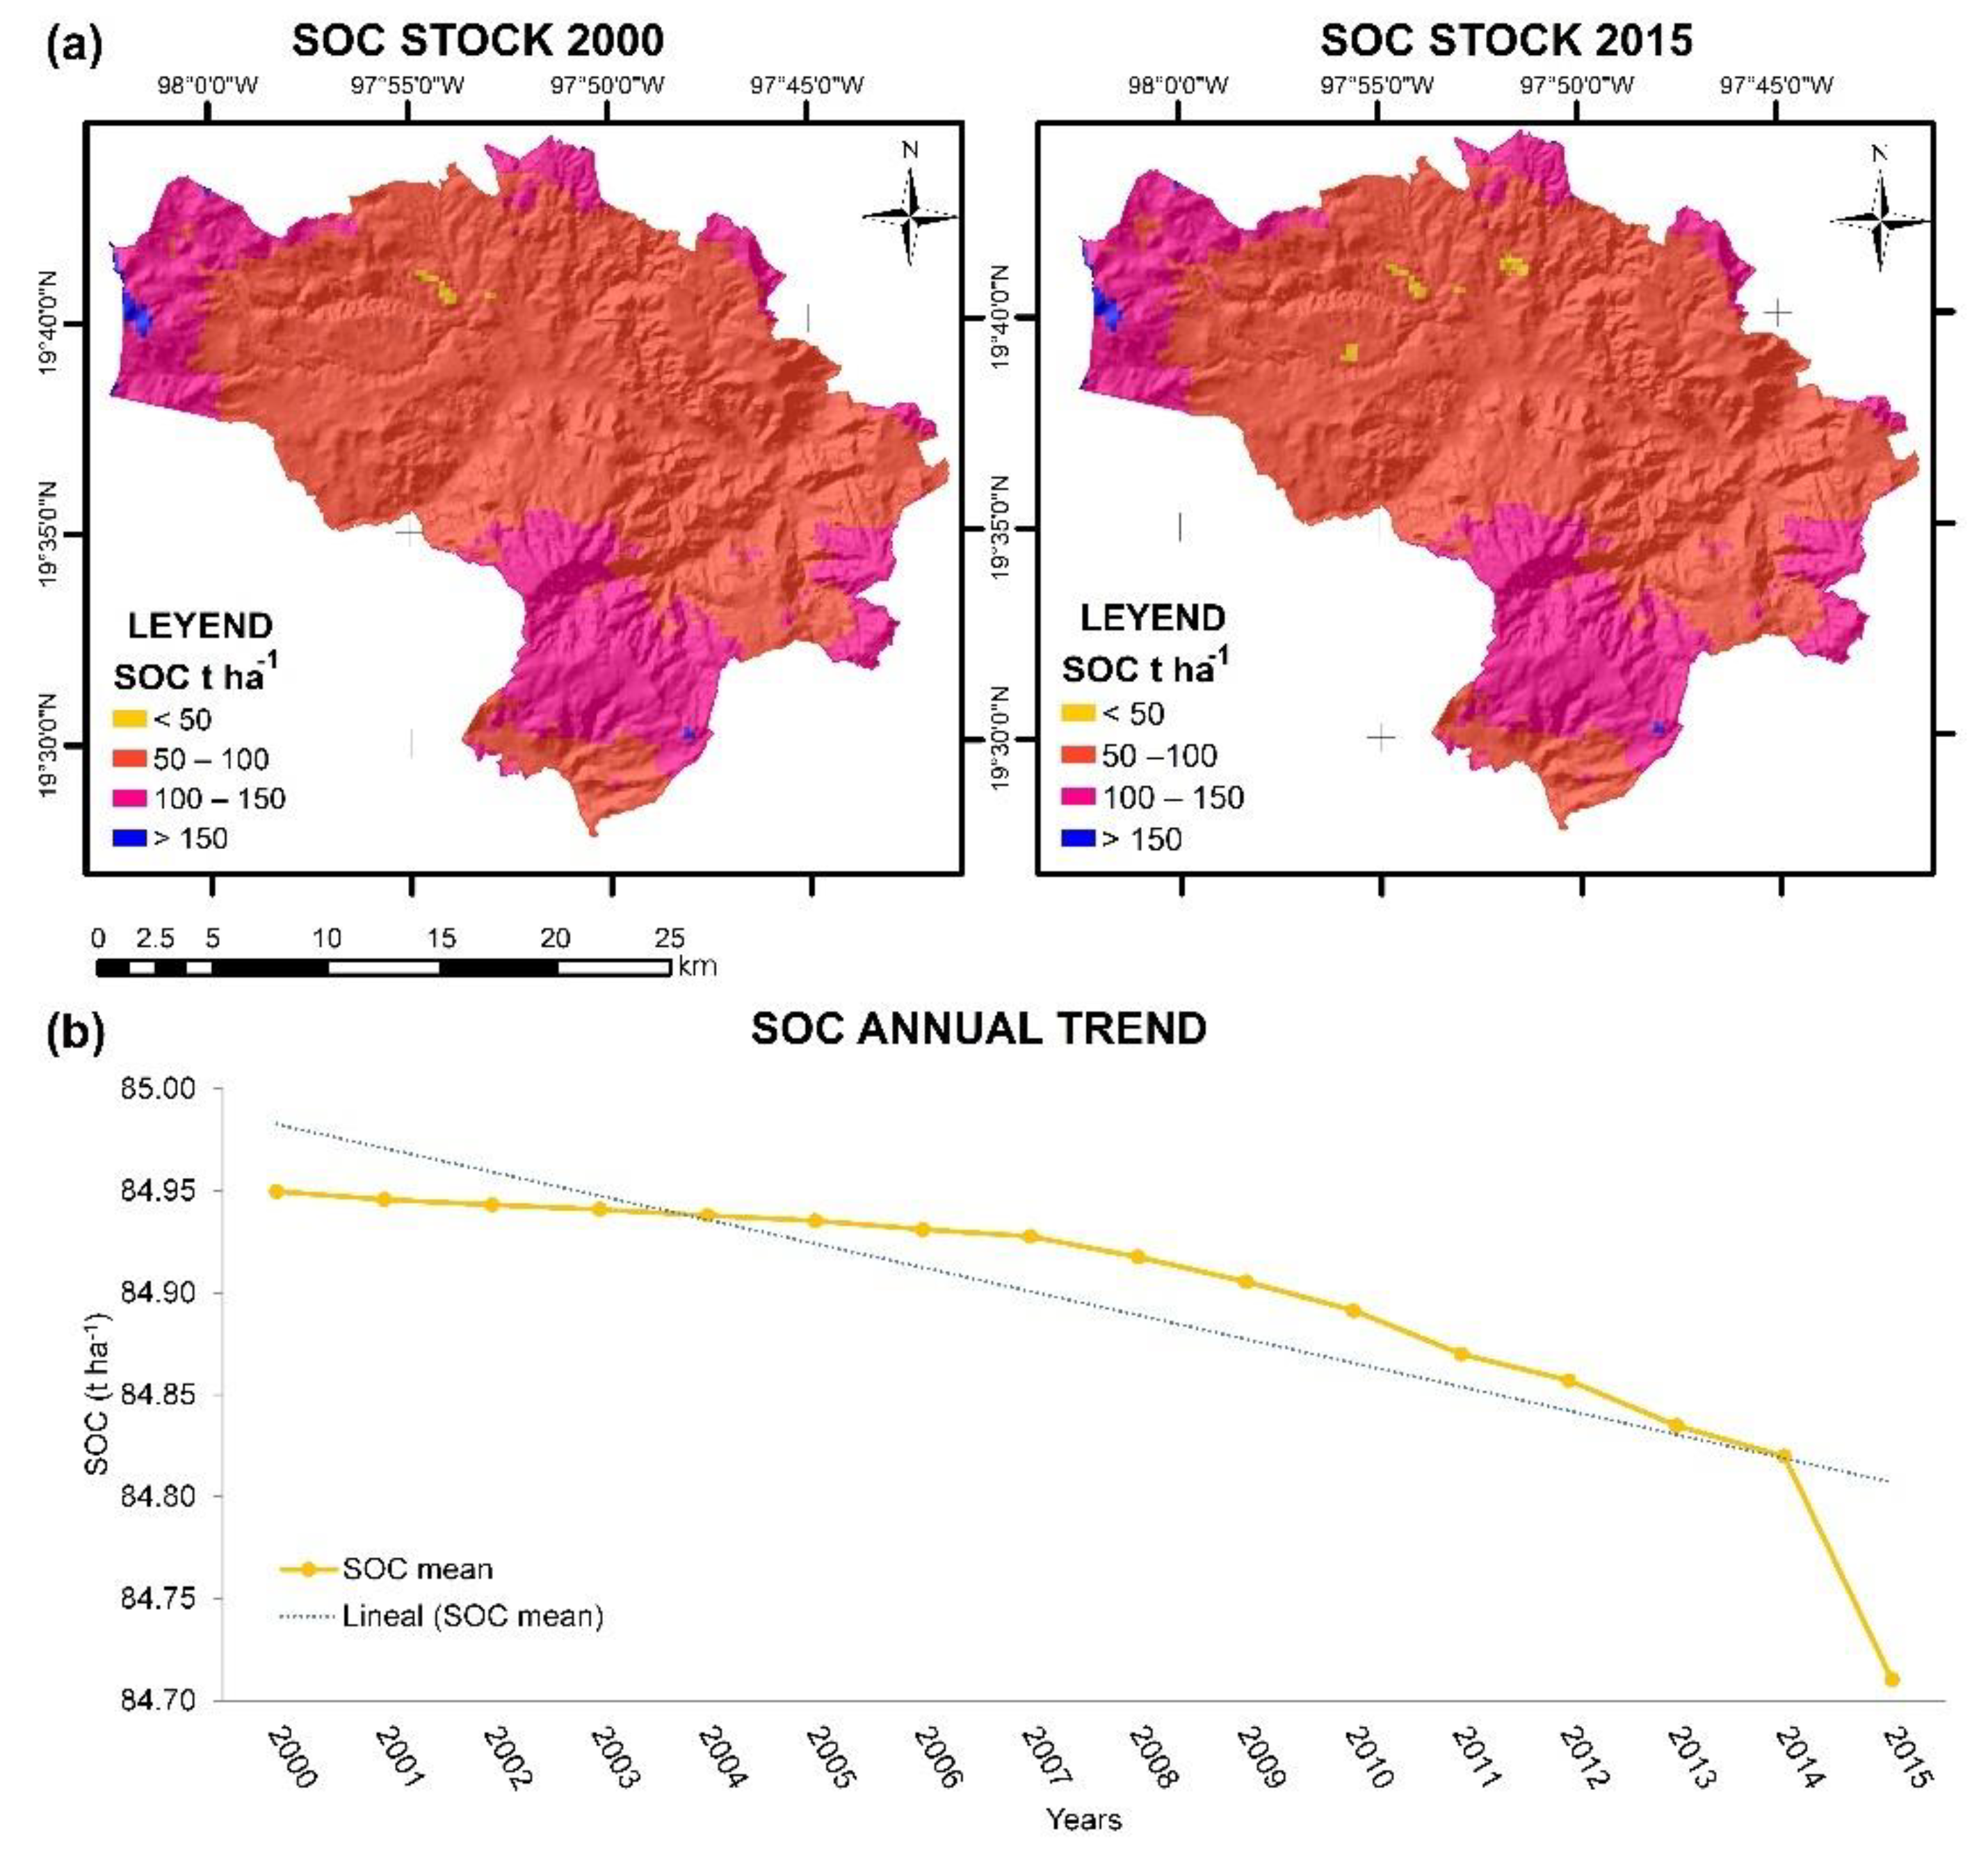
3.3. Soil Organic Carbon

The spatial distribution of SOC stock shows that the lowest content (less than 50 tC ha−1) coincided with cropland and grassland areas, which were the most extensive in the central strip of Ixtacamaxtitlan (Figure 5a). In contrast, the highest SOC concentrations, between 100 and 150 tC ha−1, were found in areas associated with forest lands in the south and northwest of the territory; in the same zone, some fragments with an SOC higher than 150 tC ha−1 were observed. Although a decrease in SOC stock was noticed (Figure 5b), there were no significant differences in the annual mean for 2000 and 2015 (84.95 and 84.71 tC ha−1, p = 0.486).
SOC losses in LC with negative changes amounted to more than 7068 tons of C (Table 5). The most significant decrease was observed in the conversion of grassland to cropland, with a reduction in the carbon stock of more than 83% of the total loss, followed by the conversion of forest land to cropland, whose transition experienced 15.42% loss.

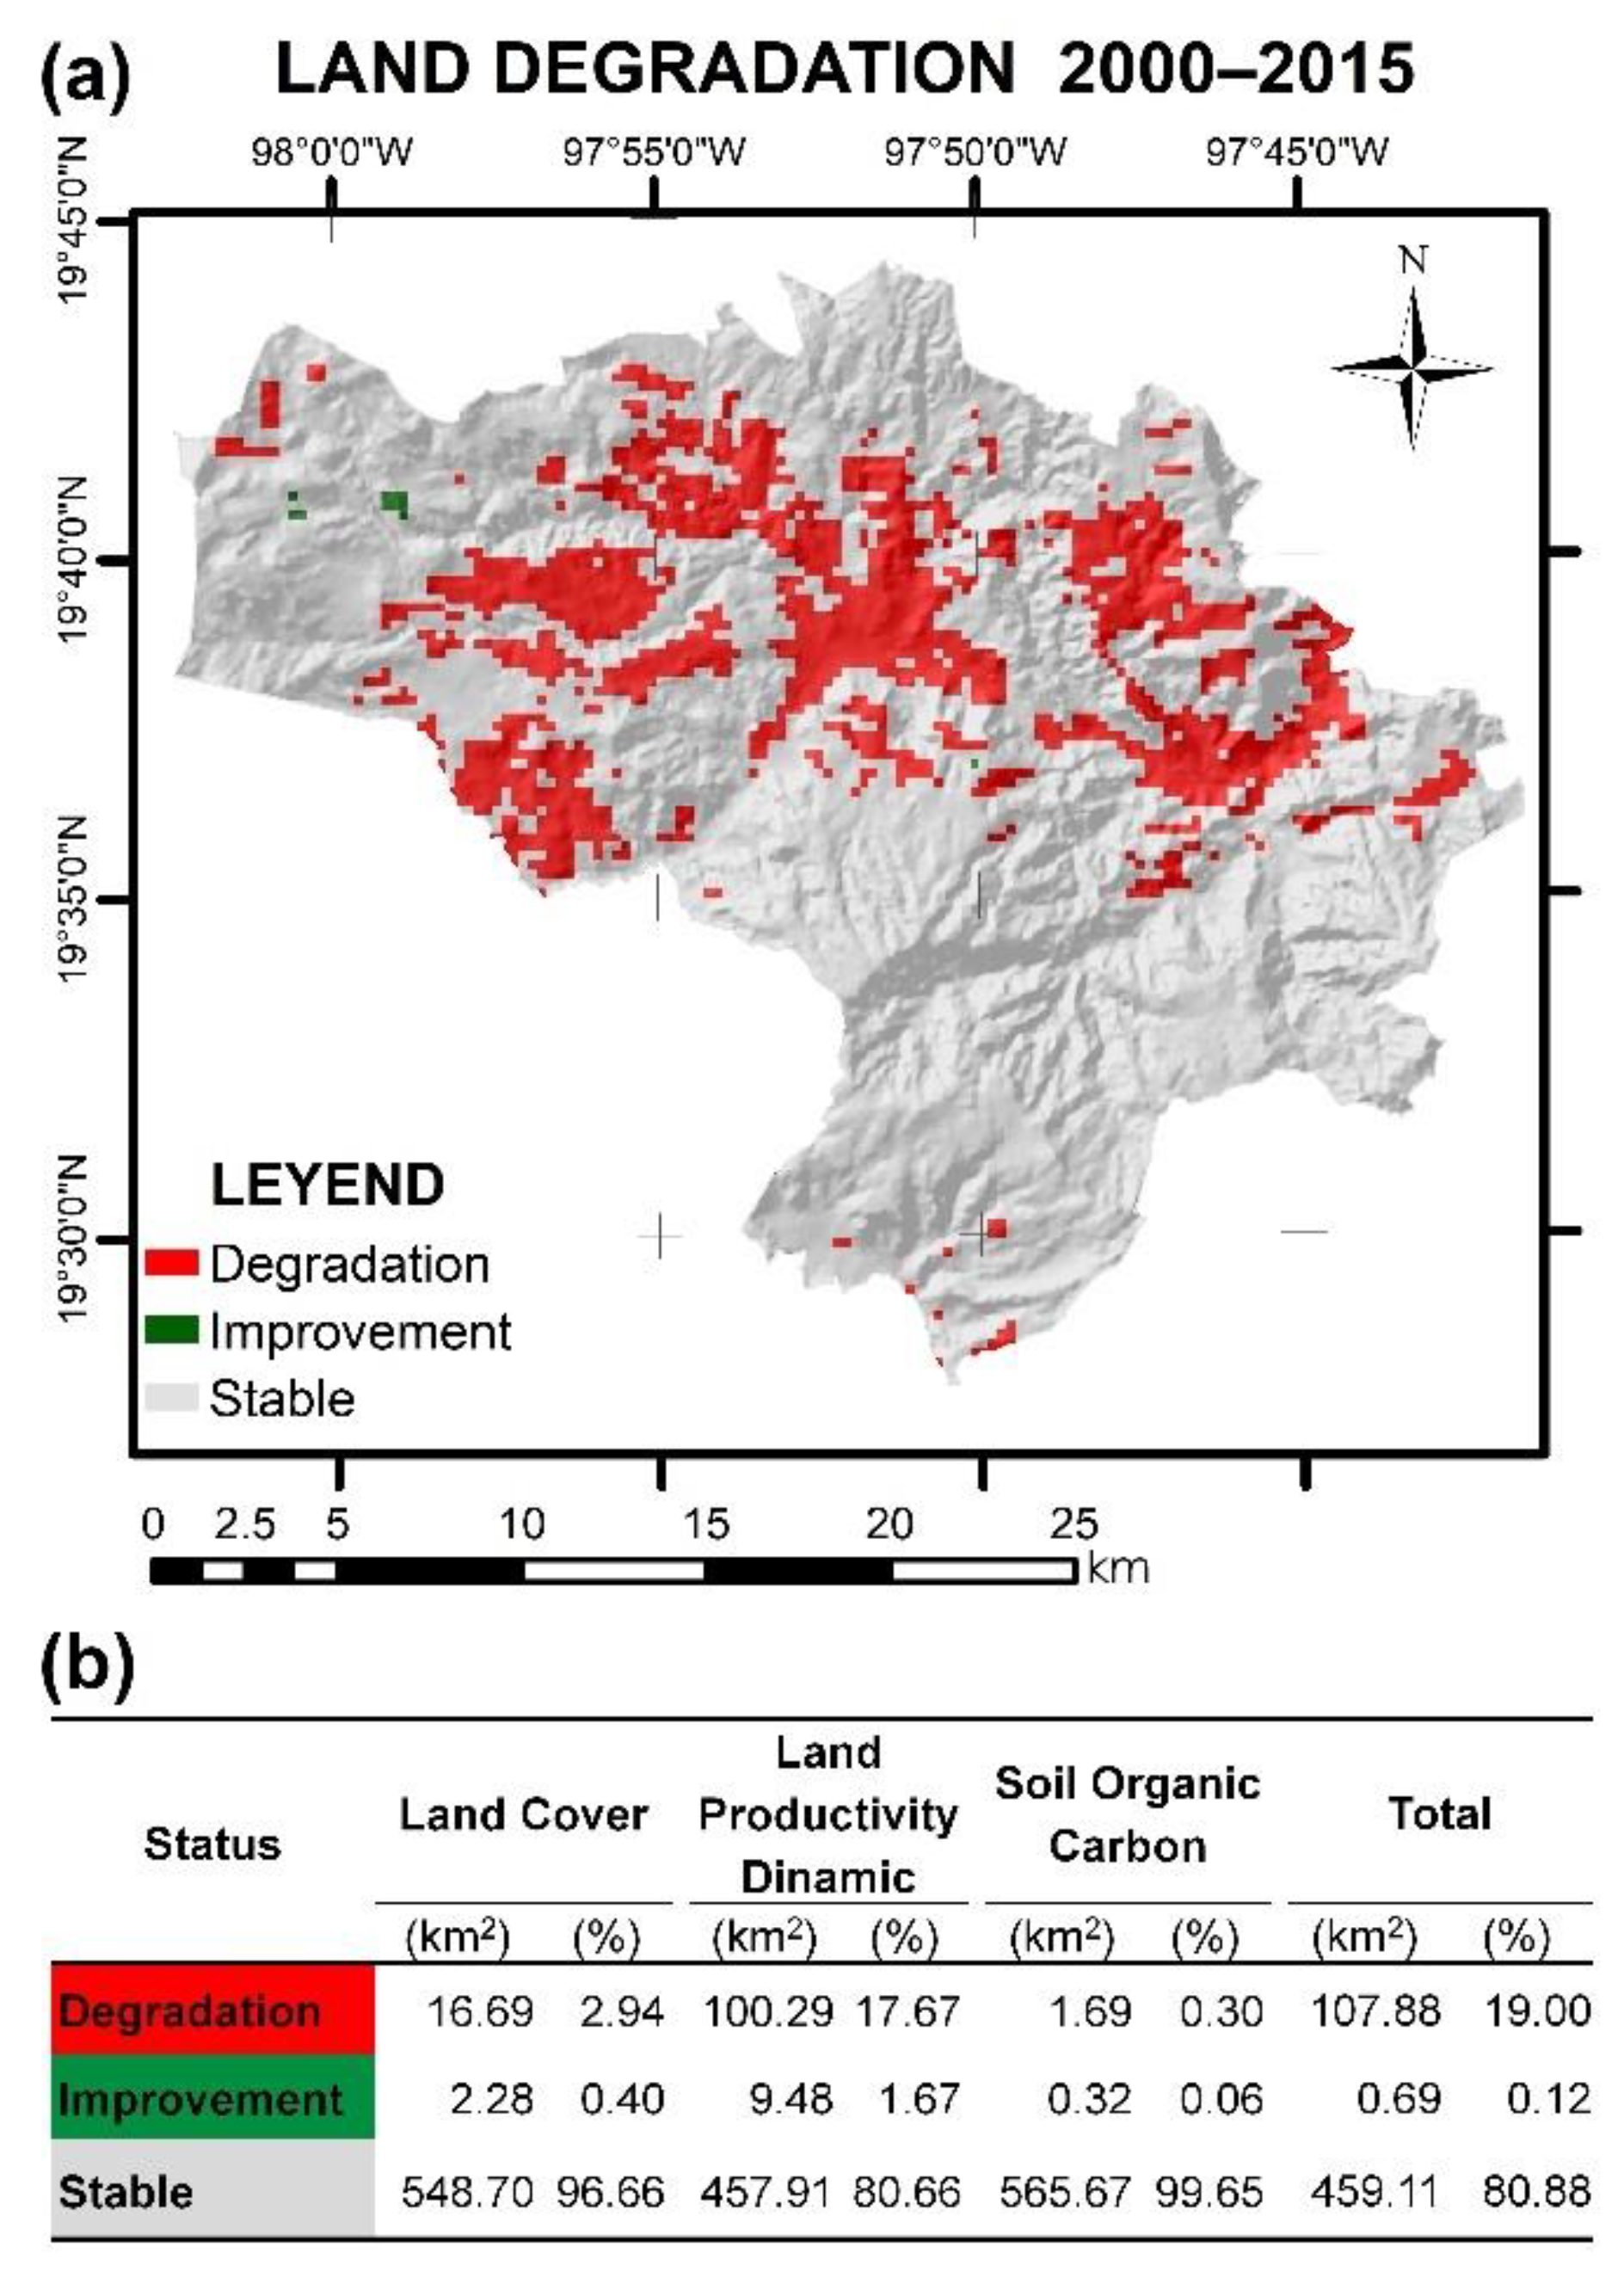
3.4. Land Degradation State

The spatial distribution of degradation in Ixtamaxtitlán occurred mainly in the central strip of the municipality. At the same time, the areas with “improvement” were arranged with small fragments to the northwest of the territory (Figure 6a).
The indicator that presented the highest proportion area with negative changes was LPD, with 17.67% of the surface area, followed by LC with 2.94% and, finally, SOC, whose proportion of negative changes was less than 1%. According to the results of the three indicators and taking into account the 1OAO approach, the potentially degraded surface area was 19.00% (107.88 km2); therefore, most of the territory has remained stable (80.88%) (Figure 6b).
Of the 107.88 km2 with potential degradation, most occurred in croplands with 93.23 km2 potentially degraded, followed by grasslands with 12.72 km2; improvement occurred only in forest lands (<1%) (Table 6).

4. Discussion

The results of this work were obtained from the standardized methodology based on the evaluation of three key indicators, Land Cover, Land Productivity Dynamics, and Soil Organic Carbon, which allowed the comparison of results at different scales, were easily applicable and interpretable, and facilitated monitoring over time. The methodology was applied at the local level to obtain information on the state and trend of land degradation in the municipality of Ixtacamaxtitlan, Puebla, Mexico, over a 15-year period (2000–2015).

4.1. Land Cover Degradation

LC is a parameter that can change rapidly, so it is an important indicator to identify the reduction or increase of vegetation, ecosystem fragmentation, and land conversion generally produced by urban and agricultural expansion [1,57].
Although, in this study, we found that 96.7% of the municipality remained stable in terms of LC change dynamics, there was a negative trend in land cover categories due to reductions in areas with natural vegetation (forest lands and grasslands) and increases in productive or anthropogenic areas.
The loss of forest lands, interpreted as degradation in this study, was minimal, which may have been due to the efforts made by the State and Federal Government, as well as the willingness of the inhabitants to participate in counteracting the natural and anthropogenic phenomena that have occurred in the region: droughts and forest fires. These efforts include the declaration of Ecological Restoration Zones (with a surface area of 1.5 km2) and reforestation and soil restoration programs implemented from 1998 to 2015 [58,59]. Just from 2013 to 2015, almost 3 km2 were reforested using 2,485,530 tree seedlings [60,61,62].
Regarding the increase in croplands, according to data from INEGI [63], the economically active population dedicated to the primary sector increased by 3.4% between 2000 and 2015, suggesting that the population was employed in agricultural activities. Likewise, the main economic activity in the municipality is agriculture, of which 95% of the total production is for self-consumption [37]. However, actions that have promoted crop diversification and intra-regional commercialization have been encouraged, showing a varied productive activity [64,65,66]. On the other hand, migration, a common phenomenon in the municipality [67], could be another factor explaining the increase in croplands, as migration represents a potential flow of capital as a means of subsistence for migrant families [68,69]. Furthermore, in Ixtacamaxtitlan, there are public policies for rural territorial development in the context of migration (e.g., 3 × 1 migrant program), where remittances are supported and channeled to implement productive projects [42]. Together, these factors could promote the extensification or intensification of cultivation [68].
Some studies point to urbanization as a promoter of changes in LC [70,71,72,73]. However, in Ixtacamaxtitlan, this was not the case; the low urban development was reflected in the minimal expansion of human settlements during the study period, as it represented less than 1% of the territory. This information coincides with official reports from INEGI [63], where the municipality is recorded as a rural area with a low population density of 43.7 inhabitants per km2.
Kust et al. [27] mentioned that negative changes or alterations in the balance and composition of the LC externalize a potential land degradation; this possibility is integrated with the methodology when negative changes in the LC are related to the conditions of the LPD and SOC indicators as discussed below.

4.2. Land Productivity Dynamics Degradation

The NDVI in the municipality of Ixtacamaxtitlan showed a positive trend due to the increase in the area of higher rank classes, which highlights an improvement in the abundance and density of vegetation (Table 3). However, there were annual decreases in NDVI throughout the period that could have been due to atypical hydrometeorological phenomena, such as unprecedented droughts, cyclones, and cold fronts during 2004 and 2005 [38]. Likewise, in 2011, some frosts mainly impacted the agricultural sector [38], and in 2013, almost 4.5 km2 of grassland areas caught fire [60].
In this sense, a limitation of using the NDVI series is that there is no differentiation of degradation driven by climatic factors over human-induced degradation [18,74]. Nevertheless, it has been established that the determination of LDP, as a result of identifying changes in LC and its relationship with NDVI, is a robust approach for land degradation assessment and monitoring. LDP considers the variability of vegetation growth over time and its adaptation and resilience to various human-induced conditions [5,75]. In this sense, the positive trend of NDVI in Ixtacamaxtitlan was presented from low productivity before the study period; this promoted negative trends in LPD that manifested in processes of potential degradation in the intensity and persistence of vegetation in 17.7% of the territory.
It is also important to note that the NDVI classification determined the LPD classes in persistent areas. Thus, when comparing two LPD classes in forest lands that remained unchanged, we could observe that 195.71 km2 had a “stable, not stressed” productivity due to the “weak” and “moderate” NDVI class. In contrast, 8.91 km2 had an “increasing productivity” due to the “intensive” NDVI class, so this area was considered as having the best vegetation conditions, both for the LC, to which it belongs, and its NDVI class.
Regarding the negative changes in the LC, there were also differences in LPD classification; however, this classification depended on both its NDVI class and the LC transition that had occurred. For example, despite having a “moderate” NDVI, the transition from forest land to grassland had a “stable but stressed” LPD class. On the other hand, the transition from forest land to cropland had productivity categorized as “early signs of decline” due to biomass loss in the change.
The productivity in decline, considered as potential degradation in cropland areas, affected 39% of its surface. This phenomenon suggests a persistent decrease in productivity generally caused by the reduction or loss of organic matter through intensive cropland use [5].
In grasslands, “early signs of the decline” occurred in 9% of this category, which could be attributed to the reduction of biomass due to overgrazing [76], forest fires that happened in these areas, and the incidence of droughts throughout the study period [38]. Finally, declining productivity in artificial surfaces is considered as degradation due to the loss of vegetation by soil sealing [28].
Most of the territory of Ixtacamaxtitlan did not present negative changes in LC; however, the dynamics of land productivity presented negative trends that suggested degradative processes in an extensive area of grasslands and croplands.

4.3. Soil Organic Carbon Degradation

Soil is considered one of the leading C sinks; however, the loss of SOC due to land degradation promotes soil to become a source of C emission [77]. In addition, disturbance or vegetation removal due to transitions from natural to productive areas promotes an abrupt decrease in SOC stock due to soil exposure to natural factors [78].
The SOC content in the territory had a minimal but constant decrease throughout the study period. Even in the central area with the most significant extent of croplands and grasslands, there were zones with values below 50 t ha−1 in 2015.
Croplands are known to present low SOC concentrations due to the relationship with land productivity [18,28]; as already known, agriculture accelerates the loss of topsoil by natural and anthropogenic factors [54,78]. In this sense, Ixtacamaxtitlan is considered a municipality with a high vulnerability to the phenomenon of strong winds, as winds of between 100 and 130 km/h have been recorded at 10 m above the ground [38]. Therefore, the absence of vegetation in agricultural areas could promote soil loss; in addition, the steep relief and steep slopes generate conditions that favor runoff and soil loss when vegetation cover is diminished.
Although negative changes in LC directly influence decreases in SOC [79], in this methodology, losses were mainly associated with the type of transition in LC and, to a lesser extent, with the transition surface. For example, in the municipality, the loss in SOC stock was observed mainly in the transition from forest land and grassland to cropland and, to a lesser extent, from forest land to grassland (Table 5). The aforementioned is explained because although it has been shown that productivity is not the same in forest land and grassland surfaces, the SOC stock in these two categories presents a similar C content [79]. In the case of grasslands, this is due to the high root content in the subsurface soil zone, while in forest lands, the production and accumulation of leaf litter in the superficial part of the soil is the leading cause. Therefore, the decrease in this transition (forest lands to grasslands) was not so pronounced, especially in the long term when the grassland was established [80,81].

4.4. Land Degradation Neutrality

The definition of degradation trends in this study allowed for identifying the processes that occurred in the interim of the analyzed period. With this knowledge, it is possible to monitor these processes to lead to a better assessment of the condition of the territory.
Identifying degraded areas is of utmost importance to prioritize possible recovery and restoration actions and improve land in the context of its use. Even though there were some positive changes, the final analyses resulted in a potentially degraded territory, because the improvement or stability in any of the three indicators could not compensate for the degradation in another one. In this sense, the total degradation considering the evaluation of the three indicators represented one-fifth of the municipality’s surface (19%). Degradation occurred where there were low values in SOC and NDVI, in the transitions from cropland to grassland, and with negative trends in LPD, mainly in the central zone of the municipality, while areas with improvement were observed with small fragments in the northwest of the territory. Croplands presented a greater extent of degraded areas, followed by grasslands.
Determining the state of the land at the local level provides valuable preliminary information as a baseline, which helps monitor environmental degradation if an extractive project occurs. For example, implementing an open-pit gold mining project is a latent threat in Ixtacamaxtitlan; this could affect soil fertility and water availability [40,82,83]. Therefore, knowing the environmental baseline would help determine the magnitude of the impact, and then proper mitigation or restoring measures may be applied.
The global datasets have maintained a continuous mapping and standard methodology since 2000, which reduces possible inconsistencies over time. In addition, annual mapping makes it possible to recognize drivers of degradation in a given period without neglecting the transformations between study periods. Nevertheless, the 250 m spatial resolution for local scales may have caused the underestimation or overestimation of indicator values [28,33] that could not reflect some important positive and negative changes in the territory.
Validating the results obtained in this study is complicated by the absence of national data information on the indicators and the continuous spatial and temporal scale used. However, the use of ESA-CCI-LC maps to determine LC at the local scale in the study area presented an accuracy greater than 85% [84].
The methodology proposed by the UNCCD for assessing LD has been successfully applied at global, national, and regional scales [5,13,18,28,32]; however, there is still a lack of consensus on the methods for determining indicators. The main reason is the absence of data at minor scales that reflect the reality of a territory [29]. In that sense, the efforts to quantify degradation more accurately are evident in the diversity of methodologies proposed and used.
Even though the Neutrality objective has been a significant step forward in avoiding LD and is promoted from any scale, the main support is focused at the country-level, leaving aside the local aspect. Therefore, more information is needed on degraded land, and recovery and prevention measures must come from minor scales [31,85].
In this way, the methodology we reported may be an option to generate data at the local level for general planning purposes. In addition, this information can be complemented by using high-resolution satellite images [28] and field verifications to define degradation hotspots. However, identifying the drivers of degradation; the forms of land appropriation; and the actions needed to avoid, reduce, and reverse land degradation are fundamental requirements for advancing LDN.

5. Conclusions

The present study was carried out by applying an LDN approach, evaluating three indicators and global data to determine degradation in Ixtacamaxtitlan, Puebla, Mexico that can serve as a precedent for obtaining information on degraded areas in other municipalities or micro-basins.
It was concluded that there were negative trends in the three indicators assessed, mainly in the cropland and grassland areas. Changes in the LC were represented by the loss of grasslands and forest lands and increased croplands and settlements. Transformations were primarily due to the transition from grassland to cropland.
The cropland’s category was the one that presented the most significant negative changes in LPD and SOC indicators; this land use was distributed in areas of easy access and with slopes of less than 23% and was located in the center of the municipality.
Ixtacamaxtitlan is considered a region with intense agricultural activity that highlights the need to create sustainable soil management programs to maintain and improve soil quality; furthermore, the municipality has preserved areas of forest vegetation, so the identification of these areas contributes to preventing their degradation and promoting their conservation. The emergence of the NDT approach has been an essential step in the consensus on a methodology for assessing LD and seeking strategies to avoid, reduce, and reverse degradation. However, the lack of data at national levels makes it difficult to evaluate degradation at local scales, resulting in a diversity of methodologies to determine the LDN framework indicators that cannot always be compared and replicated in other areas. Therefore, the use of global data should be seen as a first diagnostic tool.
Land degradation results from a combination of multiple factors. It is a highly complex process of change, so further studies are needed to deepen the contextualized dynamics of the study area on the socioeconomic and biophysical factors of degradation. However, a land degradation baseline will promote the search for a better understanding of the complex relationships of land change processes and is the first step on the road to achieving Land Degradation Neutrality.

Author Contributions

Conceptualization, I.A., V.T.-F., and R.C.; methodology, I.A. and R.C.; formal analysis, I.A., V.T.-F., V.C., and R.C.; investigation, I.A., V.T.-F., V.C., and R.C.; data curation, I.A.; writing—original draft preparation, I.A. and R.C.; writing—review and editing, V.C.; supervision, R.C. All authors have read and agreed to the published version of the manuscript.

Funding

This research project was funded by Consejo Nacional de Ciencia y Tecnología (CONACYT) (Grant Number 712144). The APC was funded by Benemérita Universidad Autónoma de Puebla (100408000).

Institutional Review Board Statement

Not applicable.

Informed Consent Statement

Not applicable.

Data Availability Statement

Not applicable.

Acknowledgments

We thank Instituto de Ciencias (ICUAP) for the administrative and technical support.

Conflicts of Interest

The authors declare no conflict of interest.

References

  1. UNCCD. Land Degradation Neutrality Target Setting—A Technical Guide; The Global Mechanism: Bonn, Germany, 2016. [Google Scholar]
  2. MEA. Ecosystems and Human Well-Being; Island Press/Center for Resource Economics: Washington, DC, USA, 2005.
  3. Grainger, A. Is Land Degradation Neutrality feasible in dry areas? J. Arid Environ. 2015, 112, 14–24. [Google Scholar] [CrossRef]
  4. Al Sayah, M.J.; Abdallah, C.; Khouri, M.; Nedjai, R.; Darwich, T. Application of the LDN concept for quantification of the impact of land use and land cover changes on Mediterranean watersheds—Al Awali basin—Lebanon as a case study. Catena 2019, 176, 264–278. [Google Scholar] [CrossRef]
  5. Baskan, O.; Dengiz, O.; Demirag, İ.T. The land productivity dynamics trend as a tool for land degradation assessment in a dryland ecosystem. Environ. Monit. Assess. 2017, 189, 212. [Google Scholar] [CrossRef] [PubMed]
  6. Sommer, S.; Zucca, C.; Grainger, A.; Cherlet, M.; Zougmore, R.; Sokona, Y.; Hill, J.; Della Peruta, R.; Roehrig, J.; Wang, G. Application of indicator systems for monitoring and assessment of desertification from national to global scales. Land Degrad. Dev. 2011, 22, 184–197. [Google Scholar] [CrossRef]
  7. Pacheco, F.A.L.; Sanches Fernandes, L.F.; Valle Junior, R.F.; Valera, C.A.; Pissarra, T.C.T. Land degradation: Multiple environmental consequences and routes to neutrality. Curr. Opin. Environ. Sci. Health 2018, 5, 79–86. [Google Scholar] [CrossRef]
  8. Oldeman, L.R.; Hakkeling, R.T.; Sombroek, W.G. World Map of the Status of Human-Induced Soil Degradation, Global Assessment of Soil Degradation (GLASOD), 2nd ed.; ISRIC: Wageningen, The Netherlands, 1991. [Google Scholar]
  9. FAO. Land Degradation Assessment in Drylands (LADA); Food and Agriculture Organization of the United Nations: Rome, Italy, 2002. [Google Scholar]
  10. Bai, Z.G.; Dent, D.L.; Olsson, L.; Schaepman, M.E. Global Assessment of Land Degradation and Improvement: 1. Identification by Remote Sensing; ISRIC—World Soil Information: Wageningen, The Netherlands, 2008. [Google Scholar]
  11. SEMARNAT-CP. Evaluación De La Degradación Del Suelo Causada Por El Hombre En La República Mexicana; Secretaria de Medio Ambiente y Recursos Naturales; Colegio de Postgraduados: Montecillo, Mexico, 2002. [Google Scholar]
  12. CONAFOR-UACh. Línea Base Nacional De Degradación De Tierras Y Desertificación. Informe Final.; Comision Nacional Forestal-Universidad Autonoma de Chapingo: Zapopan, Jalisco, Mexico, 2013. [Google Scholar]
  13. Del Barrio, G.; Sanjuan, M.E.; Hirche, A.; Yassin, M.; Ruiz, A.; Ouessar, M.; Valderrama, J.M.; Essifi, B.; Puigdefabregas, J. Land degradation states and trends in the northwestern Maghreb drylands, 1998–2008. Remote Sens. 2016, 8, 603. [Google Scholar] [CrossRef] [Green Version]
  14. Van Lynden, G.W.; Oldeman, L.R. The Assment of the Status of Human-Induced Soil Degradation in South and Southeast Asia; ISRIC: Wageningen, The Netherlands, 1997. [Google Scholar]
  15. Pulido, J.; Bocco, G. How is land degradation assessed ? A global and local overview. Interciencia 2016, 36, 96–103. [Google Scholar]
  16. Gibbs, H.K.; Salmon, J.M. Mapping the world’s degraded lands. Appl. Geogr. 2015, 57, 12–21. [Google Scholar] [CrossRef]
  17. Nachtergaele, F.; Biancalani, R. Land Degradation Assessment: The LADA Approach. In Proceedings of the 19th World Congress of Soil Science, Brisbane, Australia, 1–6 August 2010; pp. 72–75. [Google Scholar]
  18. Gichenje, H.; Godinho, S. Establishing a land degradation neutrality national baseline through trend analysis of GIMMS NDVI Time-series. Land Degrad. Dev. 2018, 29, 2985–2997. [Google Scholar] [CrossRef]
  19. UNCCD. Default Data: Methods and Interpretation a Guidance Document for 2018 UNCCD Reporting; United Nations Convention to Combat Desertification: Bonn, Germany, 2018. [Google Scholar]
  20. Cowie, A.L.; Orr, B.J.; Castillo Sanchez, V.M.; Chasek, P.; Crossman, N.D.; Erlewein, A.; Louwagie, G.; Maron, M.; Metternicht, G.I.; Minelli, S.; et al. Land in balance: The scientific conceptual framework for Land Degradation Neutrality. Environ. Sci. Policy 2018, 79, 25–35. [Google Scholar] [CrossRef]
  21. Chasek, P.; Akhtar-Schuster, M.; Orr, B.J.; Luise, A.; Rakoto Ratsimba, H.; Safriel, U. Land degradation neutrality: The science-policy interface from the UNCCD to national implementation. Environ. Sci. Policy 2019, 92, 182–190. [Google Scholar] [CrossRef]
  22. Sims, N.C.; Green, C.; Newnham, G.J.; England, J.R.; Held, A.; Wulder, M.A.; Herold, M.; Cox, S.J.D.; Huete, A.R.; Kumar, L.; et al. Good Practice Guidance: SDG Indicator 15.3.1. Version 1.0; United Nations Convention to Combat Desertification: Bonn, Germany, 2017. [Google Scholar]
  23. Chasek, P.; Safriel, U.; Shikongo, S.; Fuhrman, V.F. Operationalizing Zero Net Land Degradation: The next stage in international efforts to combat desertification? J. Arid. Environ. 2015, 112, 5–13. [Google Scholar] [CrossRef]
  24. Stavi, I.; Lal, R. Achieving Zero Net Land Degradation: Challenges and opportunities. J. Arid Environ. 2015, 112, 44–51. [Google Scholar] [CrossRef]
  25. Akhtar-Schuster, M.; Stringer, L.C.; Erlewein, A.; Metternicht, G.; Minelli, S.; Safriel, U.; Sommer, S. Unpacking the concept of land degradation neutrality and addressing its operation through the Rio Conventions. J. Environ. Manag. 2017, 195, 4–15. [Google Scholar] [CrossRef]
  26. López-Santos, A. Neutralizar la degradación de las tierras, una aspiración global. ¿Es posible lograrlo en Mexico? Terra Latinoam. 2016, 34, 239–249. [Google Scholar]
  27. Kust, G.; Andreeva, O.; Cowie, A. Land Degradation Neutrality: Concept development, practical applications and assessment. J. Environ. Manag. 2017, 195, 16–24. [Google Scholar] [CrossRef]
  28. Akinyemi, F.O.; Ghazaryan, G.; Dubovyk, O. Assessing UN indicators of land degradation neutrality and proportion of degraded land for Botswana using remote sensing based national level metrics. Land Degrad. Dev. 2021, 32, 158–172. [Google Scholar] [CrossRef]
  29. Wunder, S.; Bodle, R. Achieving land degradation neutrality in Germany: Implementation process and design of a land use change based indicator. Environ. Sci. Policy 2019, 92, 46–55. [Google Scholar] [CrossRef]
  30. Willemen, L.; Crossman, N.D.; Quatrini, S.; Egoh, B.; Kalaba, F.K.; Mbilinyi, B.; de Groot, R. Identifying ecosystem service hotspots for targeting land degradation neutrality investments in south-eastern Africa. J. Arid Environ. 2018, 159, 75–86. [Google Scholar] [CrossRef]
  31. Kapović, M.; Barger, N.; Cerda, A.; Keesstra, S.; Marković, M. Assessing land condition as a first step to achieving land degradation neutrality: A case study of the Republic of Srpska. Environ. Sci. Policy 2018, 90, 19–27. [Google Scholar] [CrossRef]
  32. Kiani-harchegani, M.; Hamidreza, S. Practicing land degradation neutrality (LDN) approach in the Shazand Watershed, Iran. Sci. Total Environ. 2020, 698, 134319. [Google Scholar] [CrossRef] [PubMed]
  33. Nijbroek, R.; Piikki, K.; Söderström, M.; Kempen, B.; Turner, K.G.; Hengari, S.; Mutua, J. Soil organic carbon baselines for land degradation neutrality: Map accuracy and cost tradeoffs with respect to complexity in Otjozondjupa, Namibia. Sustainability 2018, 10, 1610. [Google Scholar] [CrossRef] [Green Version]
  34. Vågen, T.G.; Ann Winowiecki, L.; Neely, C.; Chesterman, S.; Bourne, M. Spatial assessments of soil organic carbon for stakeholder decision-making—A case study from Kenya. Soil 2018, 4, 259–266. [Google Scholar] [CrossRef] [Green Version]
  35. Peralta-Carreta, C.; Gallardo-Cruz, J.A.; Solórzano, J.V.; Hernández-Gómez, M. Classification of land use and vegetation in tree cover loss areas (2000-2016) in the Usumacinta river watershed. Madera Y Bosques 2019, 25, 1–19. [Google Scholar] [CrossRef] [Green Version]
  36. UNCCD. Land Degradation Neutrality Resilience at Local, National and Regional Levels; United Nations Convention to Combat Desertification: Bonn, Germany, 2015. [Google Scholar]
  37. INEGI. Prontuario De Información Geográfica Municipal De Los Estados Unidos Mexicanos Ixtacamaxtitlán, Puebla; INEGI: Puebla, Mexico, 2009. [Google Scholar]
  38. SEDESOL. Atlas De Riesgos Naturales Del Municipio De Ixtacamaxtitlán, Puebla; Secretaria de Desarrollo Social: Ixtacamaxtitlan, Puebla, Mexico, 2012. [Google Scholar]
  39. EIDH. Minería Canadiense En Puebla Y Su Impacto En Los Derechos Humanos: Por La Vida Y El Futuro De Ixtacamaxtitlán Y La Cuenca Del Río Apulco; Evaluación de Impacto en Derechos Humanos: Ixtacamaxtitlan, Puebla, Mexico, 2017. [Google Scholar]
  40. Bastidas-Orrego, L.M.; Ramírez-Valverde, B.; Cesín-Vargas, A.; Juárez-Sánchez, J.P.; Martínez-Carrera, D.; Vaquera-Huerta, H. Socioenvironmental Conflicts and Open-Pit Mining in the Sierra Norte De Puebla, Mexico. Textual 2019, 72, 35–66. [Google Scholar] [CrossRef]
  41. Humphreys-Bebbington, D.; Sauls, L. Evaluación Y Alcance De La Relación De Las Industrias Extractivas Y La Infraestructura Con La Deforestación: Mexico; Climate and Land Use Alliance: San Francisco, CA, USA, 2019. [Google Scholar]
  42. SEDESOL. Informe Anual Sobre La Situación De Pobreza Y Rezago Social, Ixtacamaxtitlán, Puebla; Secretaria de Desarrollo Social: Ixtacamaxtitlan, Puebla, Mexico, 2017. [Google Scholar]
  43. INEGI. Síntesis Geográfica Del Estado De Puebla; INEGI: Puebla, Mexico, 2000. [Google Scholar]
  44. SEMARNAT-CONAFOR. Inventario Estatal Forestal Y De Suelos: Puebla; Secretaría de Medio Ambiente y Recursos Naturales: Puebla, Mexico, 2013. [Google Scholar]
  45. ESA. European Space Agency—Climate Change Initiative—Land Cover. Available online: http://maps.elie.ucl.ac.be/CCI/viewer/index.php (accessed on 25 September 2021).
  46. Didan, K.; Munoz, A.B.; Solano, R.; Huete, A. MODIS Vegetation Index User ’s Guide; Version 3; The University of Arizona: Tucson, AZ, USA, 2015. [Google Scholar]
  47. CONAF. Reporte De Neutralidad En La Degradación De Las Tierras (NDT) Ante La Convención De Las Naciones Unidas De Lucha Contra la Desertificación (CNULD); Corporación Nacional Forestal: Santiago de Chile, Chile, 2017. [Google Scholar]
  48. Hengl, T.; De Jesus, J.M.; Heuvelink, G.B.M.; Gonzalez, M.R.; Kilibarda, M.; Blagotić, A.; Shangguan, W.; Wright, M.N.; Geng, X.; Bauer-Marschallinger, B.; et al. SoilGrids250m: Global Gridded Soil Information Based on Machine Learning. PLoS ONE. 2017, 12, 1–40. [Google Scholar] [CrossRef] [Green Version]
  49. Di Gregorio, A.; Jansen, L. Land Cover Classification System (LCCS): Classification Concepts and User Manual; Food and Agriculture Organization of the United Nations: Rome, Italy, 1998; Volume 53. [Google Scholar]
  50. Bickel, K.; Richards, G.; Köhl, M.; Vianna, R. Consistent Representation of Lands. In Guidelines for National Greenhouse Gas Inventories; IPCC: Wageningen, The Netherlands, 2006; p. 42. [Google Scholar]
  51. Pontius, R.G.; Shusas, E.; McEachern, M. Detecting important categorical land changes while accounting for persistence. Agric. Ecosyst. Environ. 2004, 101, 251–268. [Google Scholar] [CrossRef]
  52. Orr, B.; Cowie, A.; Castillo, V.; Chasek, P.; Crossmas, N.; Erlewein, A.; Louwagie, G.; Maron, M.; Metternicht, G.; Minelli, S.; et al. Scientific Conceptual Framework for Land Degradation Neutrality. A Report of the Science-Policy Interface; UNCCD: Bonn, Germany, 2017. [Google Scholar]
  53. Dogan, M. Tokat ili bitki yoğunluk sınıflarının LANDSAT-7 ETM+ uydu görüntüleri ve Coğrafi Bilgi Sistemleri ile araştırılması. J. Agric. Fac. Gaziosmanpasa Univ. 2014, 31, 47. [Google Scholar] [CrossRef]
  54. Mitri, G.; Nasrallah, G.; Gebrael, K.; Bou Nassar, M.; Abou Dagher, M.; Nader, M.; Masri, N.; Choueiter, D. Assessing land degradation and identifying potential sustainable land management practices at the subnational level in Lebanon. Environ. Monit. Assess. 2019, 191, 1–22. [Google Scholar] [CrossRef]
  55. Conservation International. Trends Earth Documentation. Realease 1.0.2; Conservation International: Arlington, VA, USA, 2020. [Google Scholar]
  56. Sims, N.C.; Barger, N.N.; Metternicht, G.I.; England, J.R. A land degradation interpretation matrix for reporting on UN SDG indicator 15. 3.1 and land degradation neutrality. Environ. Sci. Policy 2020, 114, 1–6. [Google Scholar] [CrossRef]
  57. Armenteras, D.; Rodríguez, N. Forest deforestation dynamics and drivers in Latin America: A review since 1990. Colomb. For. 2014, 17, 233–246. [Google Scholar] [CrossRef] [Green Version]
  58. CONAFOR. Evaluación Del Programa Nacional De Reforestacion, Estado De Puebla, PRONARE 2000–2001; Comision Nacional Foresta: Puebla, Mexico, 2002. [Google Scholar]
  59. Cervantes, V.; Carabias, J.; Arriaga, V. Evolución de las Políticas Públicas de Restauración Ambiental. Capital Natural De Mexico 2008, 3, 155–226. [Google Scholar]
  60. INEGI. Anuario Estadístico Y Geográfico De Puebla 2014; INEGI: Puebla, Mexico, 2014. [Google Scholar]
  61. INEGI. Anuario Estadístico Y Geográfico De Puebla 2015; INEGI: Puebla, Mexico, 2015. [Google Scholar]
  62. INEGI. Anuario Estadístico Y Geográfico De Puebla 2016; INEGI: Puebla, Mexico, 2016. [Google Scholar]
  63. INEGI. Encuesta Intercensal: Grado de marginación por municipio; INEGI: Puebla, Mexico, 2015. [Google Scholar]
  64. INEGI. Destino de la producción agropecuaria en el estado de Puebla; INEGI: Puebla, Mexico, 1997. [Google Scholar]
  65. Tapia Guerrero, L.A. Infraestructura carretera y economía regional. El caso de los productores de ajo de Oaxaca y Puebla. Región Y Soc. 2018, 30, 1–35. [Google Scholar] [CrossRef]
  66. INEGI. Censo Agrícola, Ganadero y Forestal 2007; INEGI: Puebla, Mexico, 2017. [Google Scholar]
  67. Bautista, S.; López, C.; Juárez, A. Producción avícola familiar en una comunidad del municipio de Ixtacamaxtitlán, Puebla. Técnica Pecu. En Mexico 2007, 45, 41–60. [Google Scholar]
  68. Radel, C.; Jokisch, B.D.; Schmook, B.; Carte, L.; Aguilar-Støen, M.; Hermans, K.; Zimmerer, K.; Aldrich, S. Migration as a feature of land system transitions. Curr. Opin. Environ. Sustain. 2019, 38, 103–110. [Google Scholar] [CrossRef]
  69. Rosendo-Chávez, A.; Herrera-Tapia, F.; Vizcarra-Bordi, I.; Baca-Tavira, N. Desarrollo territorial rural: Agricultura y migración en el sur del Estado de Mexico. Econ. Soc. y Territ. 2018, xviii, 1243–1274. [Google Scholar] [CrossRef]
  70. Camacho-Sanabria, R.; Camacho-Sanabria, J.M.; Balderas-Plata, M.Á.; Sánchez-López, M. Cambios de cobertura y uso de suelo: Estudio de caso en progreso hidalgo, estado de mexico. Madera Bosques 2017, 23, 39–60. [Google Scholar] [CrossRef] [Green Version]
  71. Ren, Y.; Lü, Y.; Fu, B.; Comber, A.; Li, T.; Hu, J. Driving Factors of Land Change in China’s Loess Plateau: Quantification Using Geographically Weighted Regression and Management Implications. Remote Sens. 2020, 12, 453. [Google Scholar] [CrossRef] [Green Version]
  72. Abdullah, H.M.; Islam, I.; Miah, M.G.; Ahmed, Z. Quantifying the spatiotemporal patterns of forest degradation in a fragmented, rapidly urbanizing landscape: A case study of Gazipur, Bangladesh. Remote Sens. Appl. Soc. Environ. 2019, 13, 457–465. [Google Scholar] [CrossRef]
  73. Kędra, M.; Szczepanek, R. Land cover transitions and changing climate conditions in the Polish Carpathians: Assessment and management implications. Land Degrad. Dev. 2019, 30, 1040–1051. [Google Scholar] [CrossRef]
  74. Huang, S.; Kong, J. Assessing land degradation dynamics and distinguishing human-induced changes from climate factors in the Three-North Shelter Forest Region of China. ISPRS Int. J. Geo-Inf. 2016, 5, 158. [Google Scholar] [CrossRef] [Green Version]
  75. Global Support Program. Methodological Note for the Establishment of Voluntary National Targets for Land Degradation Neutrality Using the UNCCD Indicator Framework; United Nations Convention to Combat Desertification: Bonn, Germany, 2016. [Google Scholar]
  76. Lopez, C. Ganadería Campesina En Agostaderos De Uso Comun: Estudio De Caso En Ixtacamaxtitlán, Puebla. Master’s Thesis, Colegio de Postgraduados, Puebla, Mexico, 2005. [Google Scholar] [CrossRef]
  77. Ivits, E.; Cherlet, M. Land Productivity Dynamics in Europe—Towards Valuation of Land Degradation in the EU; EUR 26500; Joint Research Centre, European Commission: Petten, The Netherlands, 2013. [Google Scholar] [CrossRef]
  78. Chappell, A.; Webb, N.P.; Leys, J.F.; Waters, C.M.; Orgill, S.; Eyres, M.J. Minimising soil organic carbon erosion by wind is critical for land degradation neutrality. Environ. Sci. Policy 2019, 93, 43–52. [Google Scholar] [CrossRef]
  79. Cha, S.; Kim, C.; Kim, J.; Lee, A.L.; Park, K.; Koo, N.; Kim, Y.S.; Cha, S.; Kim, C.; Kim, J.; et al. Land-use changes and practical application of the land degradation neutrality (LDN) indicators: A case study in the subalpine forest ecosystems, Republic of Korea. Forest Sci. Technol. 2020, 16, 8–17. [Google Scholar] [CrossRef]
  80. Zimmermann, M.; Meir, P.; Silman, M.R.; Fedders, A.; Gibbon, A.; Malhi, Y.; Urrego, D.H.; Bush, M.B.; Feeley, K.J.; Garcia, K.C.; et al. No differences in soil carbon stocks across the tree line in the Peruvian Andes. Ecosystems 2010, 13, 62–74. [Google Scholar] [CrossRef]
  81. Serrano, J.I.B.; Pacheco, L.A.C.; Jiménez, A.H.; Paredes, J.D.G.; Molina, M. Changes in organic carbon stocks in soils under different plant covers. Cultiv. Trop. 2015, 36, 63–69. [Google Scholar]
  82. Bastidas-Orrego, L.M.; Juárez Sánchez, J.P.; Ramírez Valverde, B.; Cesín Vargas, A. Percepción de los posibles efectos de la minería a cielo abierto y su impacto en la agricultura en Ixtacamaxtitlán, Puebla. Mexico. Scr. Nova. Rev. Electrónica Geogr. Y Ciencias Soc. 2021, 25, 33–53. [Google Scholar] [CrossRef]
  83. Rappo, S.; Vázquez, R.; Amaro, M.; Formacio, X. La disputa por los territorios rurales frente a la nueva cara del extractivismo minero y los procesos de resistencia en Puebla, Mexico. Rev. NERA 2015, 18, 28–206. [Google Scholar]
  84. Arroyo-Ortega, I.; Tamaríz-Flores, V.; Torres-Ramírez, E.; Handal-Silva, A.; Chávez-Bravo, E.; Cervantes-Gutiérrez, V.; Castelán Vega, R. Cambios en la cubierta terrestre a través de los mapas ESA-CCI-LC (2000–2015), Ixtacamaxtitlán, Puebla. Madera Y Bosques 2021, 27, 1–15. [Google Scholar] [CrossRef]
  85. Meyer, B.C.; Mezosi, G.; Kovács, F. Landscape degradation at different spatial scales caused by aridification. Morav. Geogr. Rep. 2017, 25, 271–281. [Google Scholar] [CrossRef] [Green Version]
Figure 1. Location of the municipality of Ixtacamaxtitlan, Puebla, Mexico.
Land 11 00562 g001
Figure 2. (a) Land Cover spatial distribution for 2000 and 2015 in Ixtacamaxtitlan, Puebla, México; (b) Annual trend of Land Cover categories for 2000 to 2015.
Land 11 00562 g002
Figure 3. (a) Spatial distribution of NDVI classes for 2000 and 2015 in Ixtacamaxtitlan, Puebla, México; (b) Mean annual trend of NDVI for 2000 to 2015.
Land 11 00562 g003
Figure 4. (a) Spatial distribution of Land Productivity Dynamics (LPD) between 2000 and 2015 in Ixtacamaxtitlan, Puebla, México; (b) Distribution (area and %) of Land Productivity Dynamics (LPD) classes between 2000 and 2015.
Land 11 00562 g004
Figure 5. (a) Soil Organic Carbon (SOC) stock distribution for 2000 and 2015 in Ixtacamaxtitlan, Puebla, México; (b) Soil Organic Carbon (SOC) mean annual trend for 2000 to 2015.
Land 11 00562 g005
Figure 6. (a) Spatial Distribution of Land Degradation between 2000 and 2015 in Ixtacamaxtitlan, Puebla, México; (b) State of each indicator evaluated in Ixtacamaxtitlan, Puebla, México (2000–2015).
Land 11 00562 g006
Table 1. Land Cover (LC) Classification.
CodeCategories (UNCCD)Classification Description (ESA-CCI-LC)
1Forest landsTree cover; broadleaved/needle leaved; evergreen/deciduous; closed to open; 15 to 50% cover.
2GrasslandsMosaic natural vegetation, tree, shrub, herbaceous cover (>50%)/cropland (<50%); scrubland, grassland; lichens and mosses; sparse vegetation, tree, shrub, herbaceous cover (<15%).
3CroplandsCropland, rainfed/irrigated; with/without herbaceous, tree, or shrub cover; or associated with natural vegetation.
4WetlandsTree cover, flooded, saline water; tree cover, flooded, fresh or brackish water; shrub or herbaceous cover, flooded, fresh/saline/brackish water.
5SettlementsUrban areas.
6Other landsBare areas; permanent snow and ice.
7Water bodiesWater bodies.
Adapted from UNCCD [19].
Table 2. Changes in Land Cover (LC) categories from 2000 to 2015 in Ixtacamaxtitlan.
CategoriesLC 2000LC 2015Change
(km2)(%)(km2)(%)(%)
Forest lands207.6136.57207.3536.53−0.13
Grasslands153.4427.03139.4924.57−9.09
Croplands205.2636.16219.4138.65+6.89
Settlements1.360.241.420.25+4.41
Table 3. Distribution of NDVI classes for 2000 and 2015. Ixtacamaxtitlan, Puebla, México.
NDVI20002015Change
(km2)(%)(km2)(%)(%)
Very weak253.1544.5997.1617.11-61.61
Weak282.3149.73311.2154.82+10.23
Moderate32.225.67150.3426.48+366.85
Intensive008.981.58+100.00
Table 4. Land Cover changes and NDVI classes between 2000 and 2015 for LPD (Land Productivity Dynamics) in Ixtacamaxtitlan, Puebla, Mexico.
Land Cover
Categories 2000
Land Cover
Categories 2015
ChangeNDVI Class 2015Land Productivity Dynamics ClassTrend *
(km2)(%)
Forest landsForest lands8.911.57IntensiveIncreasing productivityNo Change
GrasslandsGrasslands0.060.01IntensiveStable, not stressedNo Change
Forest landsForest lands131.8523.23ModerateStable, not stressedNo Change
Forest landsGrasslands0.060.01ModerateStable but stressedNegative
Forest landsCroplands0.250.04ModerateEarly signs of declineNegative
GrasslandsGrasslands12.402.18ModerateStable but stressedNo Change
GrasslandsForest lands0.190.03ModerateIncreasing productivityPositive
CroplandsCroplands5.210.92ModerateEarly signs of declineNo Change
CroplandsForest lands0.380.07ModerateIncreasing productivityPositive
Forest landsForest lands63.8611.25WeakStable, not stressedNo Change
Forest landsGrasslands0.990.17WeakEarly signs of declineNegative
Forest landsCroplands1.210.21WeakDeclining productivityNegative
GrasslandsGrasslands114.3020.13WeakStable but stressedNo Change
GrasslandsForest lands0.730.13WeakStable, not stressedPositive
GrasslandsCroplands7.211.27WeakEarly signs of declineNegative
CroplandsCroplands120.9821.31WeakEarly signs of declineNo Change
CroplandsForest lands0.990.17WeakStable not stressedPositive
CroplandsSettlements0.060.01WeakDeclining productivityNegative
SettlementsSettlements0.880.15WeakDeclining productivityNo change
Forest landsForest lands0.440.08Very weakStable, but stressedNo change
Forest landsCroplands0.040.01Very weakDeclining productivityNegative
GrasslandsGrasslands11.672.06Very weakEarly signs of declineNo change
GrasslandsCroplands6.871.21Very weakDeclining productivityNegative
CroplandsCroplands77.6513.68Very weakDeclining productivityNo change
SettlementsSettlements0.490.09Very weakDeclining productivityNo change
* Trend considered as a positive or negative change in the Land Cover (LC) category or no change in the study period.
Table 5. SOC (Soil Organic Carbon) stock losses due to negative changes in LC in Ixtacamaxtitlan, 2000–2015.
Land CoverChange AreaSOC Stock 2000SOC Stock 2015Initial SOC Stocks 2000Final SOC Stocks 2015Change in SOC Stock
20002015(km2)(t ha−1)(t ha−1)(tC) *(tC) *(tC) *
Forest landsGrasslands1.0596.3595.9410,117.0610,073.82−43.24
Forest landsCroplands1.4996.8789.3514,433.5713,312.83−1120.74
GrasslandsCroplands14.0962.6958.5088,330.5882,432.73−5897.85
CroplandsSettlements0.0680.0079.00504.00479.70−6.30
* Tons of Carbon.
Table 6. Land Cover and state of degradation in Ixtacamaxtitlan, 2000–2015.
Land Cover CategoryDegradationStableImprovement
(km2)(%) *(km2)(%) *(km2)(%) *
Forest lands0.500.09206.1636.320.690.12
Grasslands12.722.24126.7622.330.000.00
Croplands93.2316.42126.1922.230.000.00
Settlements1.420.250.000.000.000.00
* Percentage of the total area of the territory (567.68 km2).
Publisher’s Note: MDPI stays neutral with regard to jurisdictional claims in published maps and institutional affiliations.

