Article

Climate Adaptation Heuristic Planning Support System (HPSS): Green-Blue Strategies to Support the Ecological Transition of Historic Centres

by
Maria Rosa Trovato
1,* and
Cheren Cappello
2
1
Department of Civil Engineering and Architecture, University of Catania, 95124 Catania, Italy
2
Department of Architecture Design and Urban Planning, University of Sassari, Piazza Duomo 6, 07041 Sassari, Italy
*
Author to whom correspondence should be addressed.
Land 2022, 11(6), 773; https://doi.org/10.3390/land11060773
Submission received: 25 March 2022 / Revised: 16 May 2022 / Accepted: 20 May 2022 / Published: 24 May 2022
(This article belongs to the Special Issue Landscapes at Risk. Social Capital Asset in the COVID-Scape Climate)

Abstract

:
The issue of climate has posed major and urgent challenges for the global community. The European Green Deal sets out a new growth strategy aimed at turning the European Union into a just and prosperous society, with a modern, resource-efficient, and competitive economy, which will no longer generate net greenhouse gas emissions by 2050. Cities in this context are committed on several fronts to rapid adaptation to improve their resilience capacity. The historic centre is the most vulnerable part of a city, with a reduced capacity for adaptation, but also the densest of values, which increase the complexity of the challenge. This study proposes an integrated tool, Heuristic Planning Support System (HPSS), aimed at exploring green-blue strategies for the historic centre. The tool is integrated with classic Planning Support System (PSS), a decision process conducted from the perspective of heuristic approach and Geographic Information System (GIS). It comprises modules for technical assessment, environmental assessment Life Cycle Assessment (LCA), economic assessment Life Cycle Cost (LCC), Life Cycle Revenues (LCR), and Discounted Cash Flow Analysis (DCFA) extended to the life cycle of specific interventions, the Multi-Attribute Value Theory (MAVT) for the assessment of energy, environmental, identity, landscape, and economic values. The development of a tool to support the ecological transition of historic centres stems from the initiative of researchers at the University of Catania, who developed it based on the preferences expressed by a group of decision makers, that is, a group of local administrators, scholars, and professionals. The proposed tool supports the exploration of green-blue strategies identified by decision makers and the development of the plan for the historic district of Borgata di Santa Lucia in Syracuse.

1. Introduction

The challenges facing cities have changed dramatically in recent years. Issues such as digital transition, climate change, biodiversity loss, resource scarcity, migratory movements, demographic change, pandemics, social inequalities, and rapidly changing economies are at the heart of the debate [1,2,3,4,5].
The need for an epochal change in the economic and social framework has become increasingly apparent because of the exacerbation of the consequences of climate change, the increasing alarm cry from the scientific world, and a new general public awareness of the situation [6,7,8,9,10,11,12,13,14].
In this regard, in fact, in 2019, the European Commission made public the European Green Deal, which defines a new growth strategy aimed at transforming the European Union (EU) into a just and prosperous society, equipped with a modern, resource-efficient, and competitive economy, which will no longer generate net greenhouse gas emissions by 2050, and where economic growth will be decoupled from resource use. The European Green Deal proposed by the European Commission [15] promotes an acceleration of the implementation of the principles of sustainability set out by the Bruntland Commission (more than three decades ago) [16], the United Nations Conference on Sustainable Development in 1992 [17], the Kyoto Agreement in 1997 [18], the United Nations Conference on Sustainable Development-or Rio + 20 in 2012 [19,20], the Millennium Development Goals in 2015 [21], and the Conference of the Parties–21 (COP-21-Paris Agreement) [22].
The European Commission has outlined several objectives, policies, and key actions to be developed by the EU and the Member States [23,24]. The main objectives are the improvement of health and quality of life of European citizens, the protection of nature, and the transformation of the current economic model without anyone being excluded from this process or left behind. Coordinating the transition from a linear economy model, based on extraction, production, distribution, and use and disposal (where all end-of-life products are transformed into waste at the expense of the environment and with the risk of consumption of all existing raw materials), to a circular economy model, in which the production and consumption system exploits natural raw materials that can be recycled or reused [25] by extending the life cycle of products, minimising waste and environmental impact, means promoting such an ecological transition process, which is instrumental in pursuing these objectives.
Given that 75% of the European population lives in cities and that buildings account for about 40% of the EU’s energy consumption and 36% of CO2 production [23], the Green Deal, from the perspective of a circular economy, promotes the reduction of the use of resources and CO2 emissions, the recycling of materials, and the reuse of the existing building stock.
Under the impetus of the Green Deal, a Horizon 2020-Green Deal call entitled “Building and renovating in an energy and resource efficient way” was launched, which promoted a series of research aimed at promoting the general guidelines proposed by the European Commission and influencing urban renewal and building renovation [26,27].
These actions, together with others, such as the political price of energy, digitalisation, etc., would allow the European Union to meet the challenge of improving energy efficiency and, at the same time, ensuring high level of employment, given that the envisaged increasing investment in the construction sector, which generates around 9% of European Gross Domestic Product (GDP), would foster the creation of 18 million jobs [23,28].
Although the social and economic repercussions of the COVID-19 pandemic in 2020 have, on the one hand, led to a setback for environmental policies, on the other, they have brought about a strong boost to European ecological policies, triggering the largest financial and implementation stimulus package ever funded in Europe, which has been instrumental in implementing those actions aimed at pursuing the objectives set out in the Green Deal and the Sustainable Development Goals (SDGs). The objective is a more environmentally friendly, digital, and resilient Europe.
The Next-Generation EU [29], within this framework, is a temporary instrument designed to respond to the economic and social damage generated by the pandemic, whose declared objective is to combat the climate crisis, recognized as the main threat of our time, and, through this challenge, to relaunch a new economy, reduce vulnerability, increase social capital, and steer Europe towards a new development perspective based on decarbonisation, the circular economy, and new patterns of production and consumption.
Next-Generation EU is the main tool used to promote recovery and resilience. It requires member states to allocate 37% of the funds of their National Recovery and Resilience Plans (NRRP) or Recovery and Resilience Plan (RRP) projects related to ecological transition.
This choice denotes the willingness to take the opportunity provided by the extraordinary funds of the Recovery Fund to accelerate the green transition. The ecological transition will need to be accompanied and supported by the digital process and administrative logic, to which a further 20% of the entire RRP budget is allocated.
What is innovative in the context of ecological transition, which is so massively adopted by institutions compared, for example, to the concept of sustainable development, is the firm awareness of the need for change, which implicit in the transition term itself: it is necessary not only to adapt our system to a more sustainable approach, but also to change it. Our economy must be restructured in such a way that respects, preserves, and values the entire planet that hosts us.
Cities are playing a leading role in action to reduce global CO2 emissions and improve quality and increase the quantity of natural heritage. They represent one of the privileged contexts in which to implement the ecological transition process to achieve the objectives by 2050 [30,31,32,33,34,35,36,37,38].
Measures to improve the efficiency of the existing real estate and the creation of green infrastructure, in contexts characterized by a high concentration of historic and cultural heritage, raise several issues from technical, technological, economic–financial, social, environmental, cultural-identity, administrative, and political points of view.
There are many trade-offs generated by interventions to implement ecological transition in the historic centre. While the latter represents the most vulnerable and inelastic portion of the city, it is characterised by interlinked and stratified values that must be protected as representative of a place and its identity.
Is the ecological transition possible for old towns? Surely it must be possible, provided that a perspective capable of integrating all the elements previously mentioned is adopted.
From a thermodynamic perspective, the historic centre is not a closed system, whose order represents a mortal equilibrium, but an open system characterized by disorder, by flows of energy, matter, and information that allow it to “transire” (to pass) to a new state with enhanced resilience.
The information flows that cross through the historic centre must be able to mediate the trade-offs and identify the convergences related to the interventions necessary for the pursuit of the 2050 objectives [39,40,41,42].
The ecological transition of the historic centre is a multi-goal, multi-strategic, multi-layer, multi-stakeholder, and complex value process.
In view of this special condition, the ecological transition must be implemented based on integrated information processes. The adoption of a heuristic perspective can help public and private decision makers identify solutions that are most likely to work or be corrected [43,44,45,46].
For this purpose, this study’s objective is to define an integrated instrument finalized for the exploration of the green-blue strategies and the design layouts at the scale of the single building units, and at the urban scale of the historic district of the Borgata di Santa Lucia in Syracuse.
The district of Borgata di Santa Lucia is the second historic centre of the city of Syracuse. It has developed in more recent times than the other and older old town, namely Ortigia. The latter is the main nucleus of the UNESCO Site “Syracuse and the Necropolis rock of Pantalica” and is subject to strict constraints of protection and conservation that make it incompatible with interventions aimed at favouring the ecological transition. The district of Borgata di Santa Lucia is subject to less stringent constraints than Ortigia, offering greater opportunities for adaptation to combat climate change. Our research group has been working for five years to build a detailed database for this neighbourhood, and now we have a level of information that allows us to develop a tool to support its ecological transition.
The proposed tool is a particular Planning Support System (PSS), which is generally used for long-range problems and strategic issues and may even be designed explicitly to facilitate group interaction and discussion [47].
The PSS proposed in this study has been developed through the integration of different tools such as the Geographic Information System (GIS), a Decision System Support (DSS) based on Value-Focused Thinking [48], and some computer-based models that allow one to analyse and evaluate the data contained in a database developed in an Excel environment. The proposed instrument integrates economic and environmental assessment, that related to the perception of the urban landscape and the identity of the context [49].
In this case, the proposed tool helps to explore the range of possible decisions and planning choices that are a priori unknown. Since the tool is developed from a heuristic perspective, it has been called Heuristic Planning Support System (HPSS).
The outcomes integrate complex information, such as the system of architectural-urban constraints, the cost-effectiveness also extended to environmental externalities, and the financial feasibility and multi-criteria analysis with reference to energy-environmental, identity, landscape, and economic criteria.
The paper is organised into the following sections:
Section 2 introduces an overview of the ecological transition critical issues in the historic centres; Section 3 illustrates the Heuristic Planning Support System (HPSS) tool and its components; Section 4 introduces the case study of the historic district of Borgata di Santa Lucia in Syracuse; Section 5 reports and discusses the results; Section 6 and Section 7 proposes some reflections on the adopted HPSS tool, synthesizes the results, and identifies the lines of future development of this research.

2. An Overview on the Ecological Transition Critical Issues in the Historic Centres

The ecological transition of historic centres is more complex than in other parts of the city, and this makes this challenge more challenging.
Ecological transition critical issues in the historic centres can be summarized based on general and specific questions (Table 1).

3. Methods

3.1. Planning Support System (PSS)

Among the tools proposed in the literature is the Planning Support System (PSS), which is widely used as planning support from a strategic perspective. [70].
PSS is a relatively recent tool, emerging on the planning scene in the mid-1990s as a geo-technology tool entirely dedicated to supporting and improving specific planning tasks [71,72].
This tool is connected to the Geographic Information System (GIS), but while the latter is a general-purpose tool for acquiring, storing, manipulating, analysing, and displaying geo-referenced data and applicable to many different problems, PSS is focused on supporting planning tasks.
In most cases, the PSS includes a GIS, especially if the planning task requires spatial data. The PSS is related to the Spatial Decision Support System (SDSS). The former generally pays particular attention to strategic and long-term problems. SDSSs are generally designed to support short-term policymaking by isolated individuals or business organisations [73,74].
The main function of the SDSS is supporting the operational decision-making process; the PSS aims to support the strategic planning activity [75].
The PSS usually consists of a combination of theory, data, information, knowledge, methods, and tools that are configured as an integrated framework with a shared graphic user’s interface [76].
Many consider PSS a valuable support tools that will enable planners to better manage the complexity of planning processes, leading to better quality plans and saving time and resources [77].
The definition of PSS has evolved over time. Harris and Batty [71] were the first to define the PSS by combining a range of computer-based methods and models into an integrated system used to support a particular planning function [78,79,80].
Batty (1995) [71] has suggested that PSS was a subset of geo-computer technologies, dedicated to supporting those involved in design, exploring, representing, analysing, visualizing, predicting, prescribing, designing, implementing, monitoring, and discussing the issues associated with the need to plan. Klosterman [72,81], Brail, and Klosterman [82] suggest that PSS have matured as integrated information systems and software structures that synthesize the three components of traditional DSS—information, models, and visualization—and deliver them to the public sphere.
Geertman and Stillwell [83] considered PSSs as tools based on geographic information technology incorporating a suite of components (theories, data, information, knowledge, methods, tools, and meta-information) collectively supporting certain specific parts of a single planning task. Brail [84], instead, pointed out that many PSSs are developed and used to provide projections in the future or could support an estimate of the impacts arising from any form of development. There is no unambiguous and rigorous definition of PSS, but according to Klosterman and Pettit [85], all definitions tend to match the same type of functionality within this category of support tools. Many researchers see the PSS as a tool to improve knowledge and information management in planning processes. These functions provide enormous help to those involved in managing the ever-increasing complexity of planning activities.
Regarding the new developments of the PSS, Klosterman believes that it can integrate and expand the main components of the traditional DSS, and therefore also those of the SDSS, effectively supporting the planning and decision-making process at the same time [72,81].
This is only partially true, as a PSS in its classical structure alone can meet the needs of planning support, provided that the decision process is set beforehand, namely the set of alternatives is known.
Most decision-making problems investigated in the literature consider the set of alternatives as “dates”. In fact, as pointed out by several authors [85], the decision-making analysis focuses mainly on how to choose an alternative without considering how it was defined.
Scholars on organizational behaviour maintain that the decisional process is much less systematic than what is established by the rational–normative model, which means that it is based on absolute rationality, as it takes for granted that decision makers apply several rational criteria during the decision-making process, which is also considered rational. Such special conditions are rare and circumscribed. Decisions are made with limited rationality; that is, decision makers are only able to recognize a limited number of alternatives and are only aware of some of the consequences of each alternative [86,87,88].
Heuristic processes are used to find answers and solutions that are most likely to work or be correct.
The process aimed at supporting the ecological transition of the Borgata district of S. Lucia can be considered as having limited rationality.
The decision-making process is not known; that is, the set of alternatives to be placed at the base of the decision is not given, and in this case it must itself be explored according to a heuristic approach.
In addition, a heuristic approach can also support the development of a heterodox perspective of the issue. In this perspective, the development of the decision-making process can integrate other perspectives besides the economic–financial one, such as the historical–cultural, architectural–urban, and environmental ones. Hence, there is a need to define a PSS that incorporates this heuristic perspective, namely a Heuristic Planning Support System (HPSS).

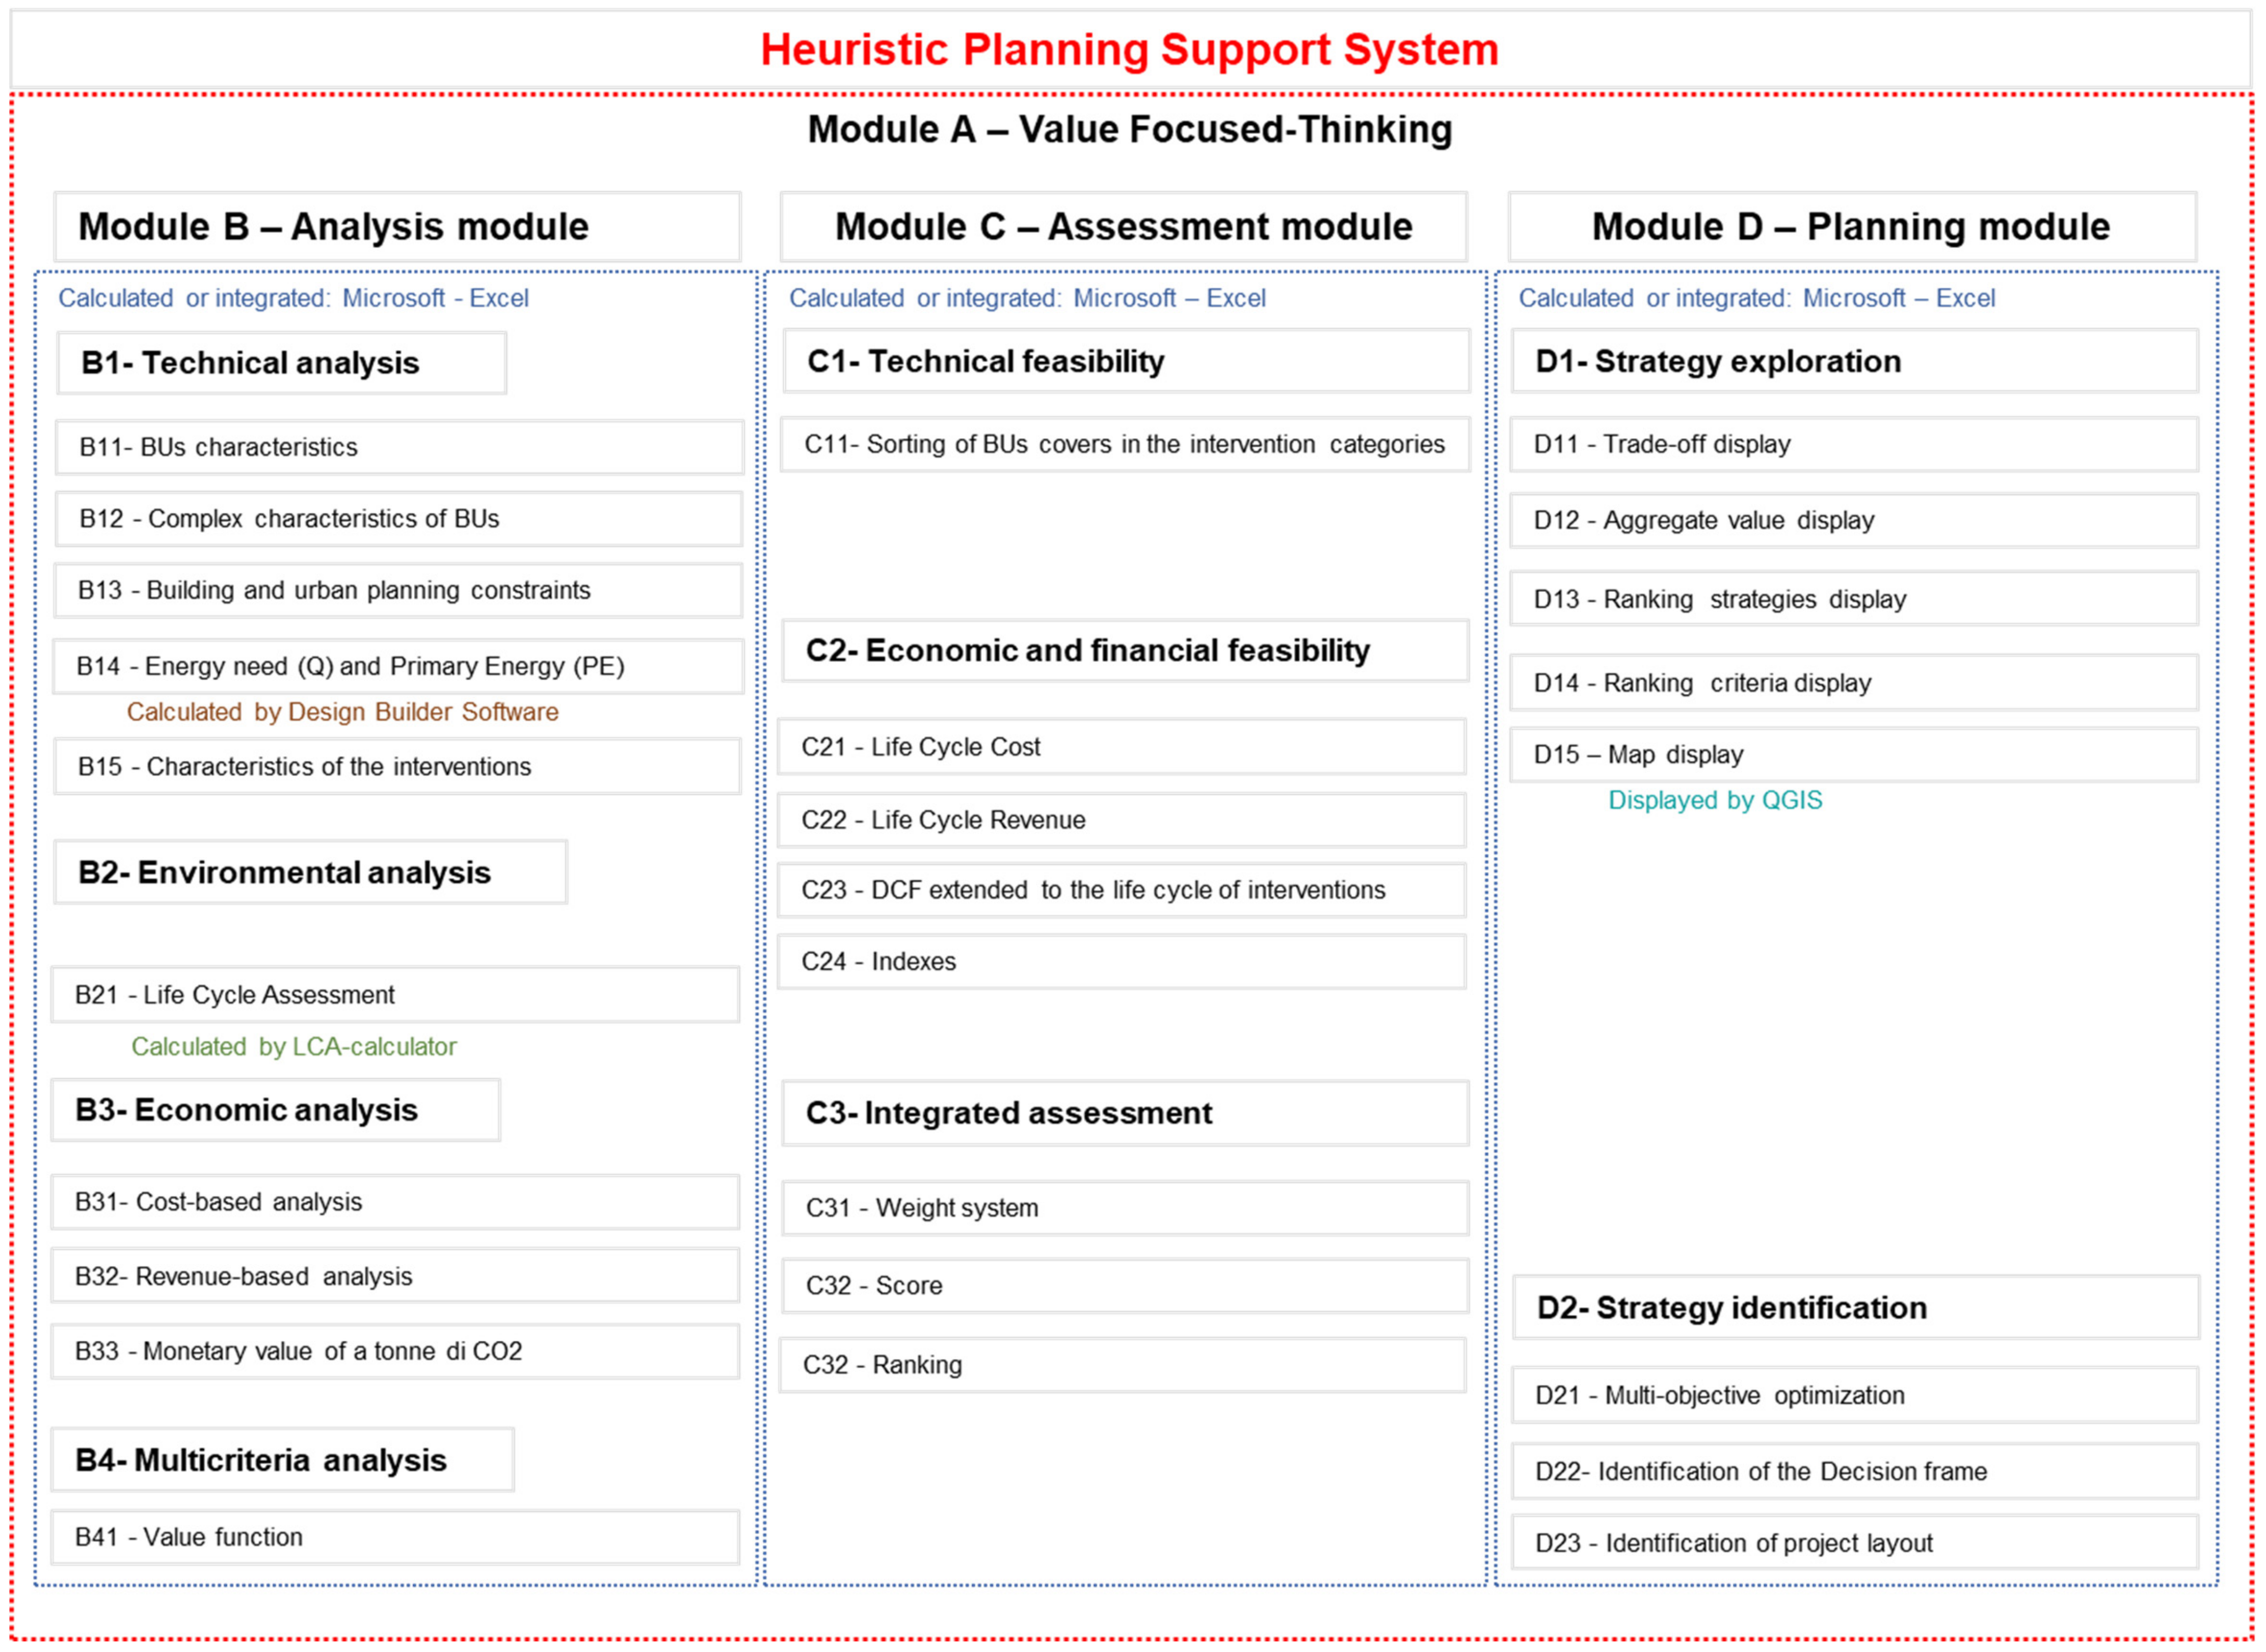
3.2. Heuristic Planning Support System (HPSS)

The ecological transition process of historic centres, due to its multi-objective, multi-strategic, multi-layer, and multi-stakeholder nature and complex values, can be implemented efficiently only if supported by a strategic perspective of the energy–environmental issue, by a heuristic approach, and by appropriate tools.
The tools should foster the exploration of objectives and strategies, identify potential trade-offs and convergences, mediate trade-offs based on multi-scale and multi-attribute evaluation, and support the identification of integrated strategies and a set of unknown and a priori established alternatives.
The process of exploring objectives/strategies and alternatives can be supported by a specific integrated tool that, because of the heuristic nature of the approach, can be defined as a Heuristic Planning Support System (HPSS). We have developed this tool HPSS, which will be presented in this section (Figure 1).
The HPSS tool proposed in this study consists of several modules:
A.
The module supporting the identification of decision-making is based on value-focused thinking.
B.
The analysis module integrates different levels of analysis aimed at:
  • The construction of a geodatabase, developed with the help of specific software, referring to the characteristics of building units and building and urban planning constraints; the characteristics of potential interventions from a technical and economic point of view (revenues and direct costs of interventions, revenues and environmental costs of interventions); and energy (the energy needs (Q) and primary energy (PE), environmental (GHH emission);
  • Supporting multi-criterial analysis.
C.
The evaluation module integrates different levels of data built in the previous module and outputs the verification of technical feasibility, economic and financial feasibility, and the aggregate assessment of interventions with reference to the criteria selected by decision makers.
D.
The planning module allows one to visualize, for any level of objective and strategy the decision makers want to explore, the performance of interventions with reference to individual and aggregate building units, and their localization in the study context.
Below are the specifications for the different modules integrated in the HPSS.

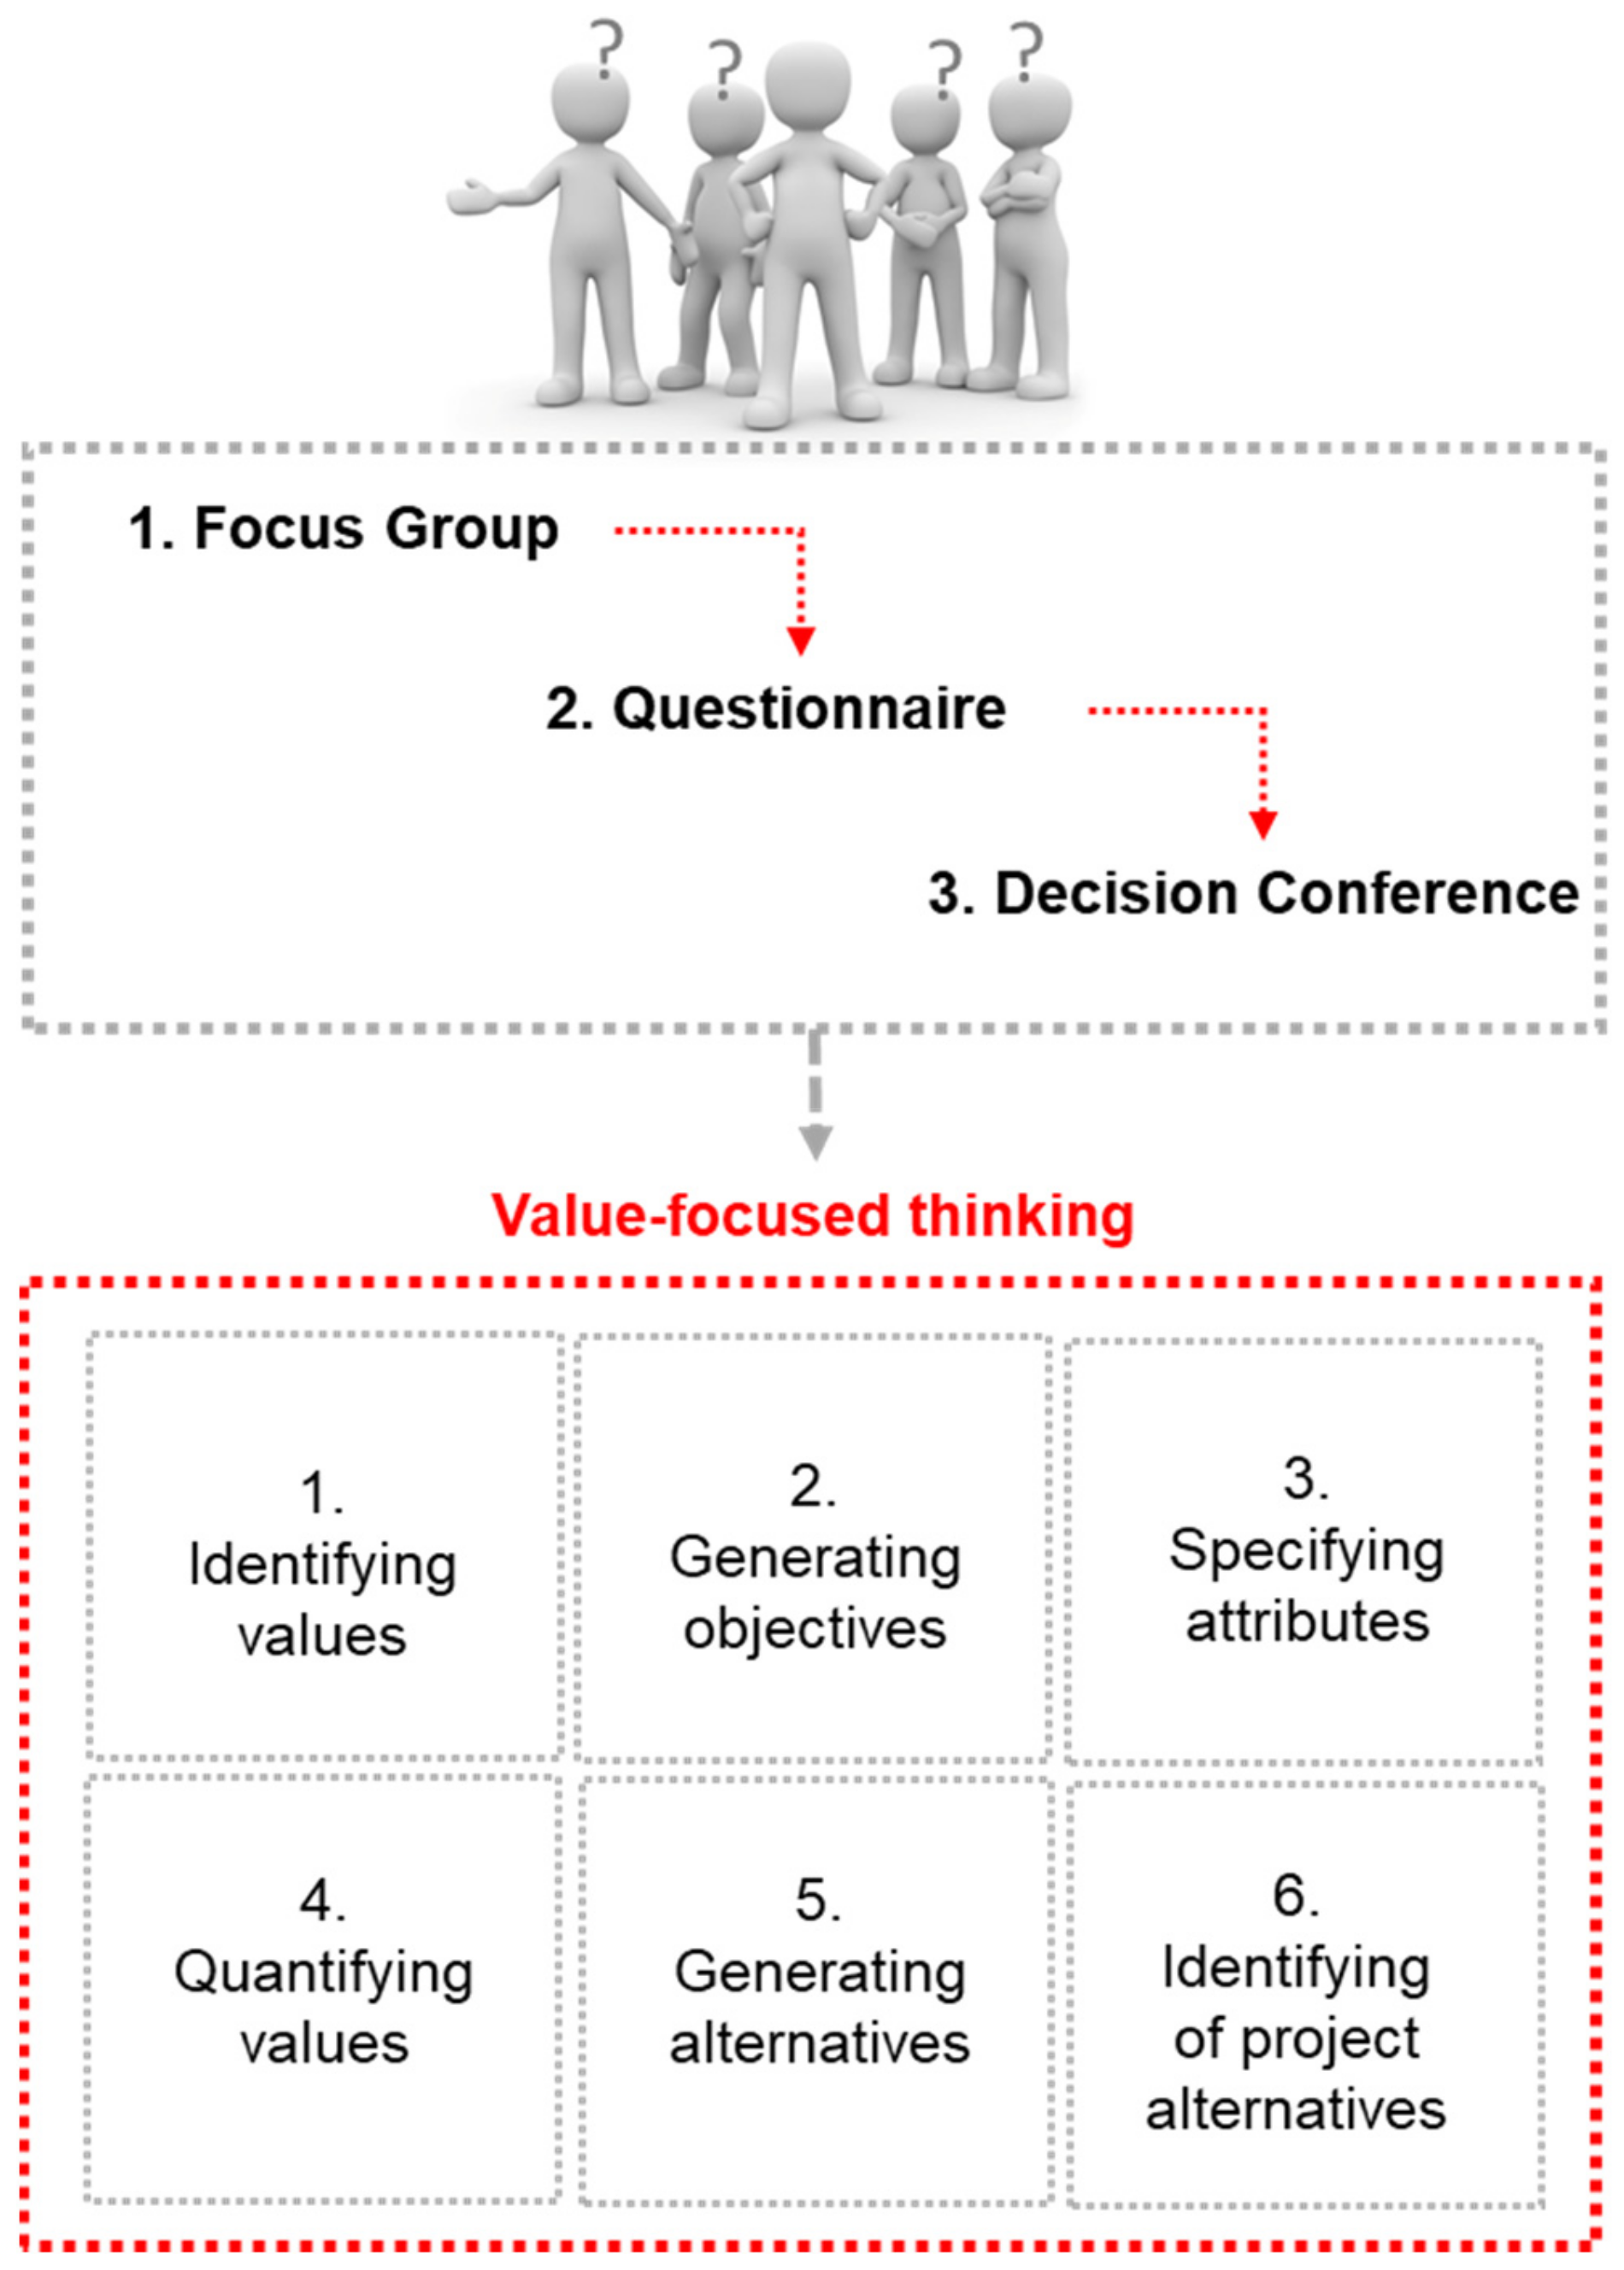
3.2.1. Module A—Decision Process in the Perspective of Heuristic Approach. Value-Focused Thinking (VFT)

A rational decision-making model assumes that the decision maker has complete or perfect information about alternatives, time, cognitive abilities, and resources to evaluate each choice over the others. From this perspective, it is assumed that individuals are able to make choices that will maximize the benefits and minimize any cost.
In a rational decision-making model, factors that cannot be quantified, such as ethical concerns or the value of altruism, personal feelings, loyalty, or a sense of obligation, are excluded.
The objectivity of the rational decision-making model determines a bias towards preference for facts, data, and analyses that integrate intuition or desires.
Researchers who have criticized the rational decision-making model have pointed out that it has unrealistic assumptions regarding the quantity of available information, which is rarely complete or perfect; the difficulty in accessing information; the fact that it takes too long to access information; the availability of adequate resources to access resources; and limitations in the ability of individuals to conduct analysis and think through competing alternatives.
Individuals will manifest greater limitations in making rational choices as the complexity of the decision increases.
Some researchers in the field of behavioural economics have tried to explain why human behaviour often goes against pure economic rationality.
From this perspective, Herbert A. Simon [89] proposed the theory of limited rationality, which represents a more holistic way of understanding decision-making.
Decision-making in the context of limited rationality can still be considered rational, as decision makers act rationally based on limited information.
In fact, given the limited capacity and resources of decision makers to achieve the optimal solution, they can apply their rationality to a set of choices that have already been limited by the lack of complete information and resources, reaching a satisfactory solution rather than an optimal one. The theory of limited rationality, therefore, is not a theory of irrationality.
With reference to the need to renounce unrealistic assumptions such as omniscience and the optimization of rational theories, Simon defined two cognitive styles of decision makers: maximising and satisficers [90].
The former tries to make an optimal decision, the latter simply tries to find a solution that is “quite good” [91].
The theory of limited rationality can be applied to decision-making in the context uncertainty, where not all alternatives, consequences, and probabilities are known.
Gerd Gigerenzer argues that simple heuristics, that is, experiential problem-solving techniques, can converge towards better decision-making results than those based on more accurate processes and seeking the optimal solution, for which a lot of information is required.
Various heuristics can be characterized by specific organizational principles.
Gigerenzer et al., 1999 [92] proposed three main organizational principles, called Building Blocks (BB): search rules, stop rules, and decision rules.
Based on the building blocks highlighted and developed by Gigerenzer et al., 1999 [92], Gigerenzer and Selten, 2001 [93], and Gigerenzer and Gaissmaier, 2011 [94], four main heuristics can be identified: Minimalist, Take the best, Tallying, and Mapping.
The Minimalist heuristic proposed by Gigerenzer et al., 1999 [92] is a model of decision-making based on a single reason. This heuristic is characterized by a minimum amount of information which is necessary to decide. It considers only a random goal (BB-search rule) for which the scores of the alternatives (BB-stop rule) are compared. The alternative, which records the highest value, represents the one with the highest value for the decision maker (BB-decision rules).
Even the heuristic Take the best [92,94] supports a model of decision-making based on a single reason, then, on a single objective (BB-search rule).
In this case, the minimum amount of information is not considered, but the preferences of the decision maker are.
The heuristic compares all the scores of the alternatives (BB-search rule and stop rule) and identifies the one that maximizes the goal.
The alternative that registers the highest value represents the one that has the highest value for the decision maker (BB-decision rules).
The two heuristics Tallying and Mapping belong to the trade-off decision-making class [94]. Both heuristics consider multiple goals in random order (BB-search rule), ignoring preference information.
The stop rule in both cases provides for a break in the count when the alternative with the highest score is identified for each goal.
The Tallying heuristic chooses the alternative with the highest positive value for all objectives (BB-stop rule) [95].
The Mapping heuristic identifies all the alternatives that are above the median score in a goal (building block-stop rule) and chooses the preferred alternative from most goals (BB-decision rule) [94].
In the literature, the question of how small-information decision-making strategies (heuristic or intuitive decision-making) can influence the outcome of a decision has been widely discussed by many researchers [96,97,98,99,100]. These studies investigate the effects on decision making and ignore information about objectives, preferences, or assessments.
There are many studies in the literature that have developed heuristics to support the solutions to problems with high complexity, such as the integration of wind energy and other renewable energy resources in electrical systems [101], the search for parking spaces [102], water management [103], health [104], and information technology [105] and management [106].
The adoption of a heuristic perspective of the generation of alternatives, as a decision process, is more suitable for the purpose of this study.
We propose in this study an iterative heuristic belonging to the class of the decision-making trade-off, with a multi-objective search rule (such as the heuristics Tallying and Mapping). It integrates information about decision makers’ preferences such as the Take-the-best heuristic. Our heuristic considers n-tuple shared objectives identified based on the preferences of the decision makers, and for each of them, it compares all the aggregated scores of the alternatives evaluated based on a set of criteria (BB-search rule and stop rule), identifying the one that registers the highest value for the decision maker (BB-decision rules).
From the perspective of a heterodox approach, this heuristic allows one to compare all the aggregated scores of the alternatives evaluated based on a set of criteria with reference to the economic profile, that is, its economic and financial performance (BB-sub-search rule and the stop sub-rule), and with reference to an integrated profile, that is, its performance related to other aspects besides the economic (BB-sub-search rule and stop sub-rule), identifying the highest value for the decision maker for the two profiles (BB-sub-decision rules for each profile).
In order to ensure that all relevant and important information in the decision-making process can be identified, that is, objectives, strategies, and alternatives, we have selected from among the approaches proposed by Operations Research, the Value-focused-thinking one.
This approach is considered a best practice from the decision analysis literature and has all the potential to effectively support the modelling phase of the decision problem as well as the project one, which deserves to be explored carefully, highlighting that, starting from the structuring of the objectives, it is possible to analyse different strategies and actions.
Value-focused thinking is an approach that starts by identifying values and then uses these values to evaluate and improve the set of alternatives provided to decision makers [48,107].
Value-focused thinking describes and illustrates concepts and procedures to create better alternatives for decision problems, identifying decision opportunities, and using fundamental values to guide and integrate decision-making activities [108].
The use of this technique is appropriate when dealing with conflicting objectives, complex alternatives, and major sources of uncertainty.
Value-focused thinking can lead to better decisions because
  • It results in a better set of objectives to evaluate the alternatives, as generating objectives is an explicit purpose of Value-focused thinking;
  • It facilitates the creation of alternatives, some of which might be better than those initially selected as potential ones;
  • It proactively defines decision opportunities that are more attractive to deal with than the decision problems forced upon us.
The key concepts of Value-focused thinking are values, attributes, objective functions, alternatives, and decision frame.
From these concepts, the following phases can be derived: identification of values, generation of objectives, specification of attributes, quantification of values, creation of alternatives, and identification of project alternatives.
The process aims at identifying a series of objectives that can be structured based on the concatenation of several tools, such as focus groups, questionnaires, and decision conferences.
Decision-making conferences are work meetings supported by facilitators, aimed at problem-solving, including expert conflict resolution [109].
In the field of organizational planning, Schuman and Rohrbaugh, 1991 [110], highlight various purposes of a decision conference, such as definition of objectives, organizational priorities, budget allocation, strategic plans, etc.
Phillips, 2006 [111], states that a decision conference can support the participants’ shared understanding of the issues under discussion and the generation of a common purpose. Schuman and Rohrbaugh, 1991 [109], point out that a decision conference can be identified as an ideal arena for reaching consensus on complex and unstructured issues and can succeed in reaching a consensus decision.
The decision makers throughout this process (Figure 2) were invited to express an order of preference for each n-tuple of objectives and at different levels.
In this case, both goals and strategies can be explored in their respective domains based on decision makers’ preferences, highlighting trade-offs, and convergences. Their exploration can support the identification of the decision frame and shared type by fostering the identification of a rational and feasible structure of preferences compared to the ones characterized by limited and uncertain rationality.

3.2.2. Module B—Analysis Module

The analysis module is instrumental for the construction of the database, as it integrates basic information and the outputs of technical, energy, environmental, economic, and multi-criterial analysis.
The database contains data on the basic real estate characteristics of BUs and the complex real estate characteristics, building and town planning constraints, and the characteristics of potential interventions from technical, energy (the energy needs (Q), primary energy (EP), environmental (GHG emission), and economic (direct revenues and costs, environmental revenues, and costs of interventions) points of view.

Technical Analysis

The BUs database was constructed based on data collected through survey forms about the characteristics of real estate. The detected characteristics of real estate are: dimensional, positional extrinsic or localization, the use of different floors, positional intrinsic, technological, architectural, state of conservation, and energy.
The data on building and urban planning constraints derived from the General Zoning Plan and the Detailed Plan are integrated into specific records in Excel.
The data on the real estate characteristics exported in csv are elaborated in QGIS for the estimation of complex characteristics for the BUs, that is, the shading, the visibility of the interventions from the road, and the degree of fragmentation of the roofs.
The outputs produced by this analysis phase are integrated into specific records in Excel.
The selection of potential interventions was conducted through the administration of a questionnaire to decision makers.
The decision makers identified two main types of interventions that specifically concern the roofs of BUs, namely the green roof and the installation of photovoltaic panels.
The solutions to the installation of photovoltaic panels have been selected with reference to the “Guidelines for the improvement of energy efficiency in cultural heritage. Architecture, historical and urban centres and nuclei”, published by the Ministry of Cultural Heritage and Activities (MIBAC) [112], which are a useful tool to guide energy-improvement interventions for cultural heritage.
The guidelines for the insertion of photovoltaic panels on the roofs of historic buildings include the use of integrated roof solutions; the arrangement of the panels in a continuous line, above the eaves line, over the entire length of the roof, or possibly covering the whole surface of the pitched roof with the best exposure; and the choice of colours of the photovoltaic panels that match the existing roof colours.
The selected solutions for photovoltaics differ in terms of being installed with 1.5 kW, 3 kW, and 6 kW power; producibility (kWh) with reference to the site and its characteristics, i.e., azimuth angle (South, East–West) and tilt (0°–30°) [113]; grid-connected stand-alone systems with accumulation and connected to the network; and use of monocrystalline silicon and BIPV.
The HEMERA System has been selected for the BIPV solution [114].
The selected green roof solutions are grouped as referring to the roof type as follows: A1 for pitched roofs with extensive greening; B1 for flat, non-walk-on roofs with extensive greening; and B2 for flat, walk-on roofs with intensive greening.
These solutions were built for each type of intervention in the records on the technical, energy, environmental, and economic characteristics, which are instrumental to conducting the support analyses.
DesignBuilder Software was used to estimate the energy characteristics of the interventions. It complies with EN 15316, UNITS 11300 parts 1–4 [115] and is used to estimate the energy need (Q) and the primary energy (PE) for heating, cooling, and domestic hot water (DHW) in the different categories of intervention.

Environmental Analysis
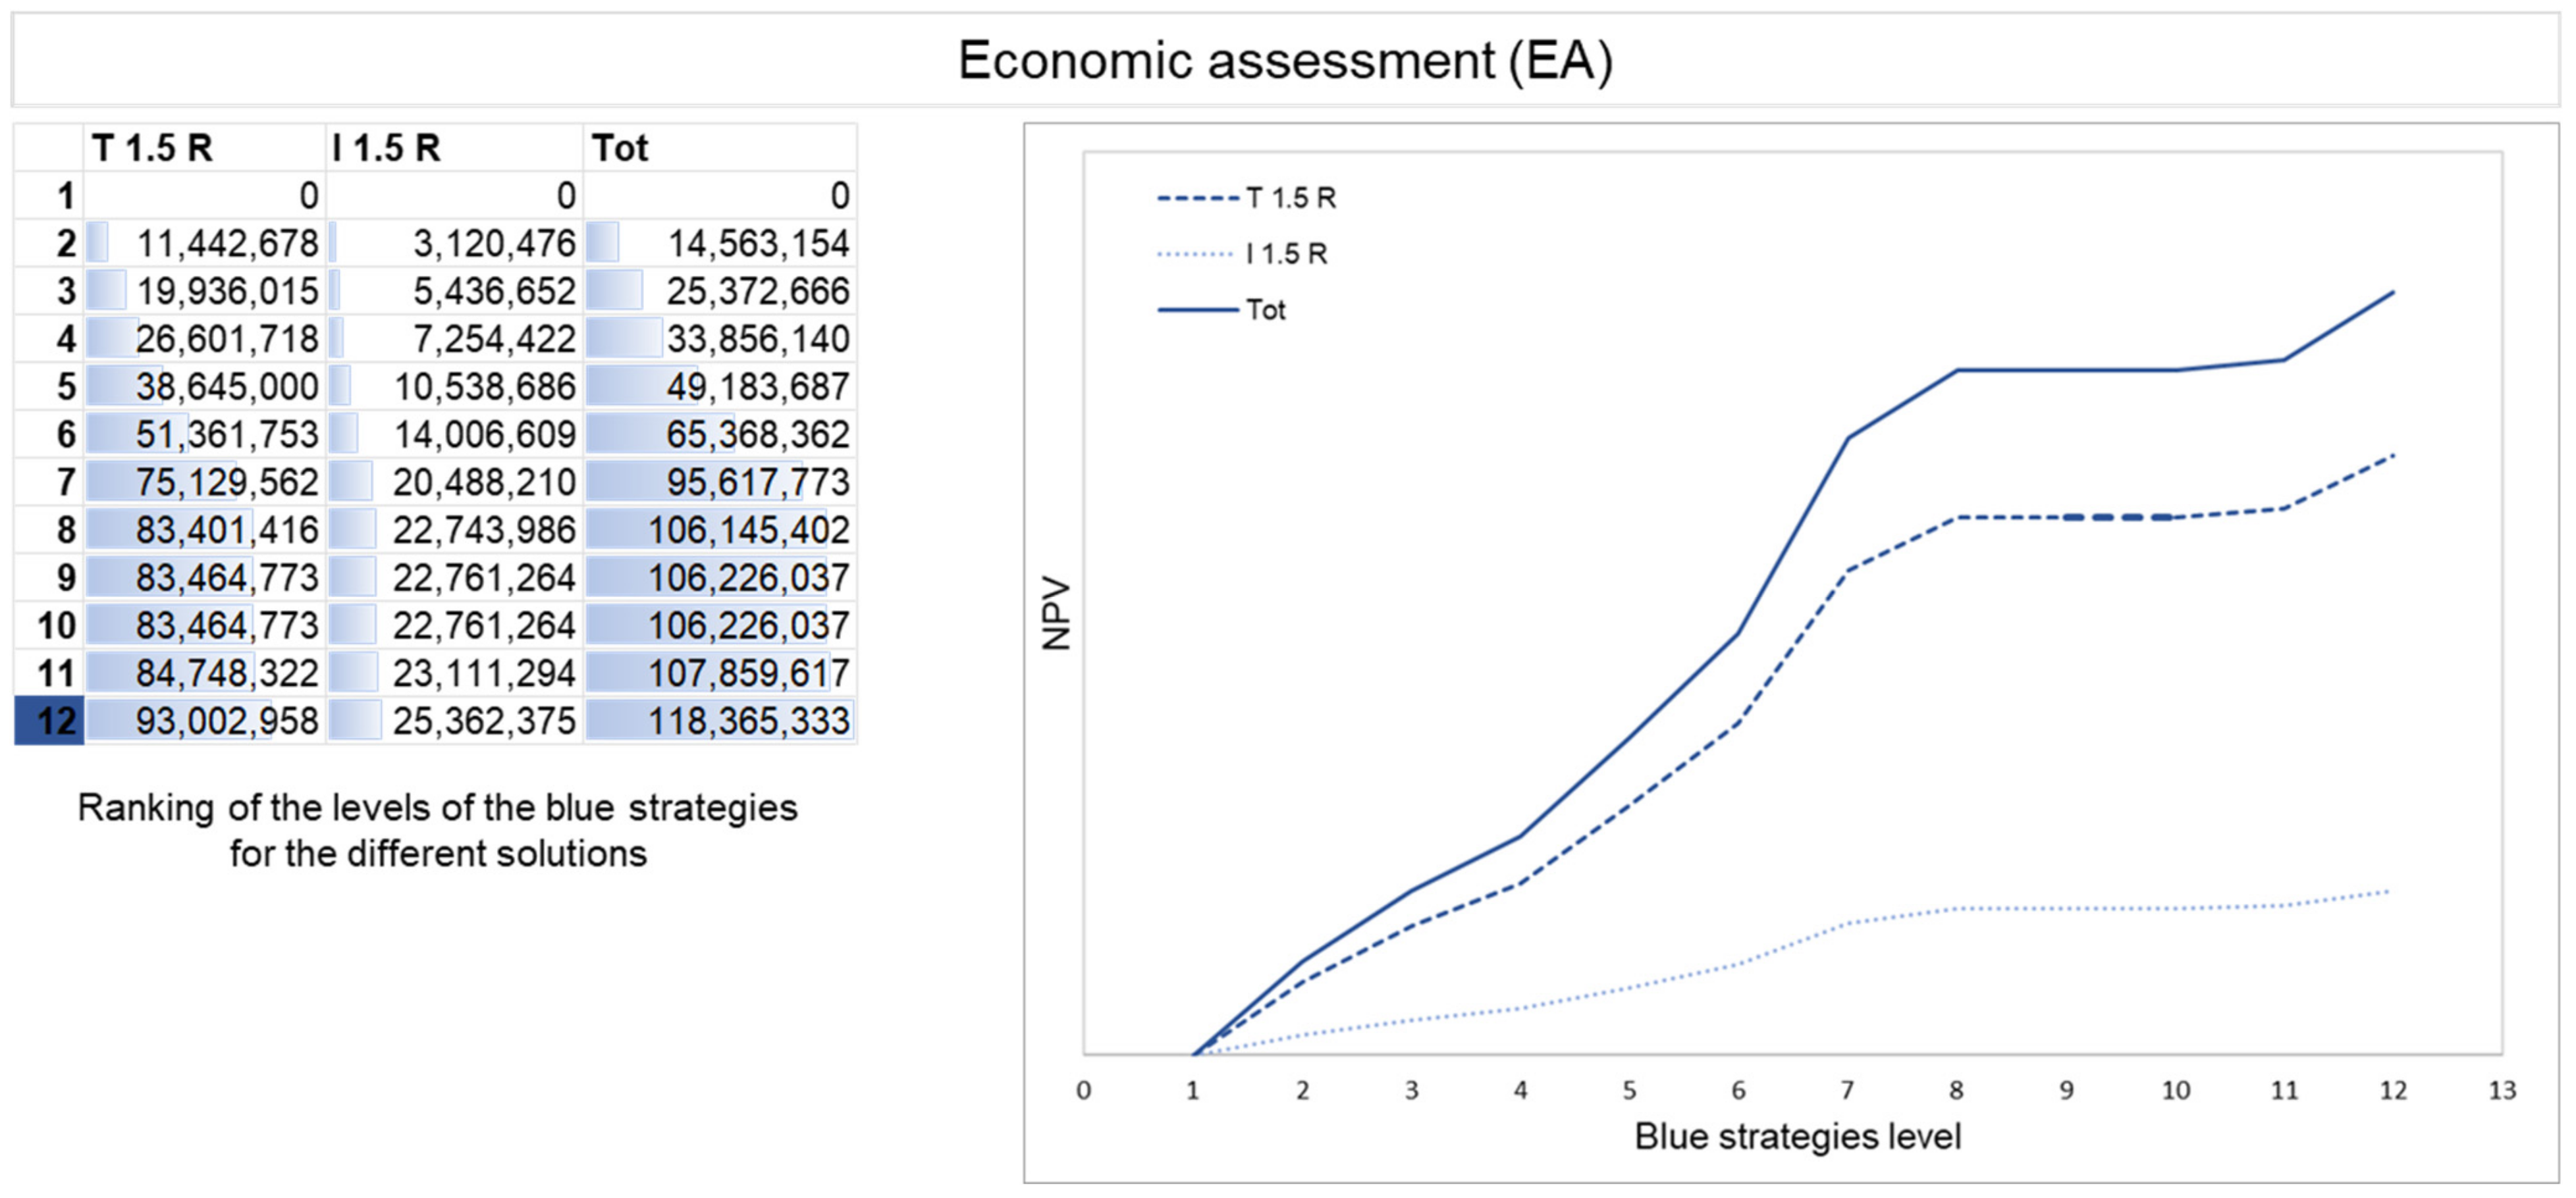
A life-cycle assessment (LCA) was carried out to estimate the environmental characteristics of the interventions.
LCA is a methodology used to assess the environmental impacts associated with all the phases of the life cycle of a product and specifically in this study for the interventions under assessment. LCA is an instrumental methodology for estimating the carbon footprint related to the emission of GHGs generated at all stages of the product/intervention life, namely: extraction, processing, and transport of building materials; construction and demolition of buildings; direct energy consumption from buildings; and waste disposal.
In this study, LCA was implemented using LCA-calculator [116,117], a software that is widely used in the literature to support product/intervention carbon footprint estimation. It is used to estimate and compare, with other studies, the direct and indirect CO2 emissions from all phases of the product/intervention life cycle [118].
LCA-calculator software performs LCA according to International Organization for Standardization (ISO) 2006. It uses eco-invent reference database v2.2. It estimates the carbon incorporated in materials and material production processes in accordance with ISO 14020 and ISO 14040, as well as ISO 14025. The software outputs an aggregate measure of the GWP (Global Warming Potential) of all 100-year emissions, expressed in kg CO2 equivalent, calculated based on the characteristic factors provided by the IPCC [119].
The environmental analysis of the interventions is shown in Appendix A.1. Environmental Assessment.

Economic Analysis

For the estimation of the economic characteristics of the interventions, the following analyses were conducted: cost-based analysis, revenue-based analysis, analysis of the monetary value of a tonne of CO2, and analysis of the costs and revenues extended to the life cycle of the interventions, that is, the Life Cycle Costing and Life Cycle Revenue.
The cost-based analysis was conducted based on surveys on the regional price of public works in the Sicily Region in 2019 and, alternatively, on that of the Emilia-Romagna Region 2018 or on estimates requested by established companies in the sector.
The costs for the design and supervision were calculated as a percentage of the costs of work; the annual maintenance costs [120] were calculated as the differentiated percentages for each type of work.
The environmental costs related to the life cycle of the photovoltaic plant and the green roof can be estimated by multiplying the negative externality determined based on the LCA by the monetary value of a tonne of CO2.
The environmental benefits related to the life cycle of the photovoltaic plant and green roof can be estimated by multiplying the positive externality determined based on the LCA by the monetary value of a tonne of CO2.

The Monetary Value of Tonnes of CO2

The estimation of the monetary value of a tonne of CO2 allows for the calculation of the monetary value of externalities produced in the life cycle by the interventions analysed in this study: photovoltaic system and green roof.
The monetary value of one tonne of CO2 was determined based on data collected in an analysis of the literature review on the subject proposed in the article of Trovato et al., 2020 [121].
The monetary value of a tonne of CO2 can be estimated based on two different approaches: the social cost of carbon (SCC) and the marginal cost of abatement (MAC) curve [122,123].
The first approach measures the long-term damage caused by the CO2 emissions produced each year. The second approach, through the construction of the curve of the marginal cost of abatement (MAC), allows the following to be identified: the cost of the last unit of CO2 abated for a defined level of abatement; the total abatement costs estimated through the integral of the abatement cost curve; and the average abatement cost obtained by dividing the total abatement cost by the quantity of abated emissions [124].
The level of reliability offered by climate change forecasting models generates uncertainty about the assessment of impacts, resulting in poor availability of data to support the SCC estimation, which can only be estimated for certain types of impacts.
Nevertheless, climate change forecasting models are considered a good approach for estimating the monetary value of the CO2 emissions related to climate change impacts.
The review of the literature on SCC estimation reported in the article by Trovato et al. [121] highlights, among the best practices, three different integrated assessment models (IAM) [125], which were proposed by the Interagency Working Group (IWG), namely: DICE (Dynamic Integrated Climate–Economy model), developed by William Nordhaus (Yale University) [126]; FUND (Framework for Uncertainty, Negotiation, and Distribution model), originally developed by Richard Tol (University of Sussex); and PAGE (Policy Analysis of the Greenhouse Effect model), developed by Chris Hope (University of Cambridge).
These models are based on a discount rate of 3% [127] to estimate different SCC values, based on the DICE-2010R model of $40 per ton of CO2; based on the FUND3.8 model of $22 per ton of CO2; based on the PAGE09 model of $74 per ton of CO2.
Other SCC estimates proposed in the literature include one proposed by the OECD [128] and the European Union survey, and one proposed by Ricke K. et al. [129], which showed different values from those estimated by the Interagency Working Group.
In the first case, the estimate of the SCC led to identification with reference to 2014, with a value of CO2 emissions of $56 per ton and with reference to 2025 of $115 per ton. In the second case, the estimate of the SCC led to the identification of a range CO2 emission values of $177–805 per ton.
The second approach, namely MAC, is used in the European Union in the emissions trading system, namely the EU ETS. A monetary value of EUR 40/tonne CO2-eq has been estimated using MAC until 2020 [130], for which no further estimates are currently available.
To identify a monetary value of CO2 emissions and thus support the estimation of the monetary value of externalities produced by interventions in their life cycle with reference to literature data, with reference to the two approaches (SCC and MAC), and with reference to the 3.3% social discount rate set for Italy from the Cost–Benefit Analysis Guidelines [131,132,133], we have chosen to confirm the value of 40 EUR /ton of CO2-eq identified in the article Trovato et al. [121], which is close to the average value of the SCC values calculated by the IWG models. This choice is due to the absence in the literature of further estimates on the monetary value of one ton of CO2 emissions.

Life Cycle Cost

In the field of building processes, the role of cost components is based on various elements constituting the feasibility of an intervention, including the construction process (Life Cycle Costing in construction), the life cycle (whole global costing), and management (Life Cycle Costing) [134].
The Global Cost formula according to the LCC approach is expressed by the following Equation (1) [135,136,137]:
C G = C I + s = 1 t C M + C r 1 + r t + v = 1 n C d m + C d p V r 1 + r n
where C G is the life cycle cost; C I is the investment costs; C M is the maintenance cost; C r is the replacement cost; C d m is the cost of dismantling and C d p is the disposal cost; V r is the residual value; t is the year in which the cost occurred and N the number of years of the whole period considered for the analysis; and   r is the discount rate. The “traditional” LCC methodology is a tool for measuring economic but not environmental performance. The economic and environmental assessment of interventions can also be conducted based on the integration of LCA and LCC [138,139,140].
For the assessment of the environmental impacts produced by interventions [141,142,143,144,145,146,147], it is necessary to provide a more in-depth analysis in order to identify the individual effects to be computed in the LCA. Environmental assessment can be integrated into the classic LCC formula. The new LCC formula considers the negative externalities related to the increase in CO2 emissions (Equation (2)).
C G = s = 1 t C M + C r 1 + r t + v = 1 n C d m + C d p V r 1 + r n + z = 1 q I R C O 2 1 + r q

Life Cycle Revenue

Revenues related to interventions can also be analysed from a life-long perspective.
They mainly concern the energy savings and CO2 emission reductions determined by LCA both for the photovoltaic system and for the green roof (Equation (3)).
R G = i = 1 T E S 1 + r T + j = 1 N R E C O 2 1 + r N
E S represents energy saving, R E C O 2 the reduction of CO2 emissions throughout the life cycle.
In the case of a green roof, the environmental benefits may also concern the benefits related to the absorption of pollution, and therefore it would be correct to add k = 1 Q A P 1 + r Q , where A P represents the absorption of pollution offered by the green roof.
In the database estimating both the Life Cycle Costing-based analysis and the Life Cycle Revenue-based analysis, it is necessary to integrate the records of the results of the LCA for the types of photovoltaic plants and the green roof with the records related to the cost and revenue analysis.
The economic analysis extended to the life cycle of the interventions is reported in Appendix A.2 Economic Assessment.

Multicriteria Analysis

In the database, it is possible to integrate information in order to define specific value profiles. Value profiles are instrumental to characterize decision makers’ preferences. In this regard, decision makers should identify a set of criteria that are instrumental to characterize their preferences on interventions aimed at combating the effects of climate change in the historic centre.
The multicriterial approach used for modelling decision makers’ preferences is Multi-Attribute Value Theory (MAVT). It is an additive MCDA approach.
The MAVT is an algorithm that is widely used in the literature to support decision-making in numerous problems [148,149,150,151], and for this reason, we will report only some information. This will allow the reader to analyse a set of alternatives even from a perspective characterized by conflicting objectives.
Operationally, in this algorithm, the main objective is divided into secondary objectives in order to structure the decision problem through a hierarchy of first- and second-level criteria and defining a tree structure called the tree of criteria, from the higher-order criterion to the leaf criterion, or that of a lower level.
For each criterion, a value function is constructed that represents how the incremental value changes as the performance level of the alternative changes. As a rule, the value function has a range of variation between 0 and 1.
For each criterion, a weight is set representing the importance attached to it by the decision maker [148,152].
The system of weights normally follows the rule of having a sum equal to one.
Each alternative in decision-making is assessed based on the standard additive aggregation rule (Equation (4)) [148], which provides an aggregate measure of the value of the alternative with reference to its performance on each criterion:
V a = k = 1 s w i v i a
where s   is the number of criteria, w i is the weight of the criterion i , and v i a is the value function for the criterion that reflects the performance of the alternative a with respect to the criterion i .
A MAVT module has been integrated in Excel to build value functions for each identified criterion.
All the estimated data in the various technical, energy, environmental, economic, and value profiles analyses can be collected in specific records in Excel. These records support the assessments conducted in Module C.
The different database records, either as basic data or as output of the analysis processes, can be used for spatial analysis in QGIS. The visualization of thematic maps of the analysis results is instrumental to increase the awareness of decision makers on the issue under analysis.

3.2.3. Module C—Assessment Module

The evaluation module offers tools to support the exploration of goals and strategies. This module consists of several operational tools to produce as outputs the technical feasibility, economic-financial feasibility, and the integrated assessment of interventions based on the MAVT approach.

Technical Feasibility

For the technical feasibility of the interventions on the individual BUs, logical propositions of this type are built if ‘the characteristics of the BUs, the building and urban constraints, energy demand are...’, and then ‘BUs will be allocated in the intervention category...’.
Logical propositions allow the data query to help to sort the BUs into different intervention categories.
Database query outputs can be integrated into QGIS to support BUs’ spatial analysis of each intervention category.

Economic and Financial Feasibility

The economic and financial evaluation is instrumental to verify the feasibility of the interventions.
A tool aimed at verifying the economic and financial feasibility has been defined with reference to the Discounted Cash Flow Analysis (DCFA) [153,154] integrated into the life cycle of interventions.
This tool integrates the information contained in module B for all the components of the DCFA, including those related to the life cycle of the interventions [155,156], i.e., Life Cycle Costing and Life Cycle Revenue.
It also incorporates a series of investment assessment criteria aimed at verifying economic and financial feasibility (Appendix A.3. Investment assessment criteria).

Integrated Assessment

The MAVT module integrated in Excel allows one to measure the aggregate value for each type of intervention or with reference to aggregate types of intervention, producing their ranking.

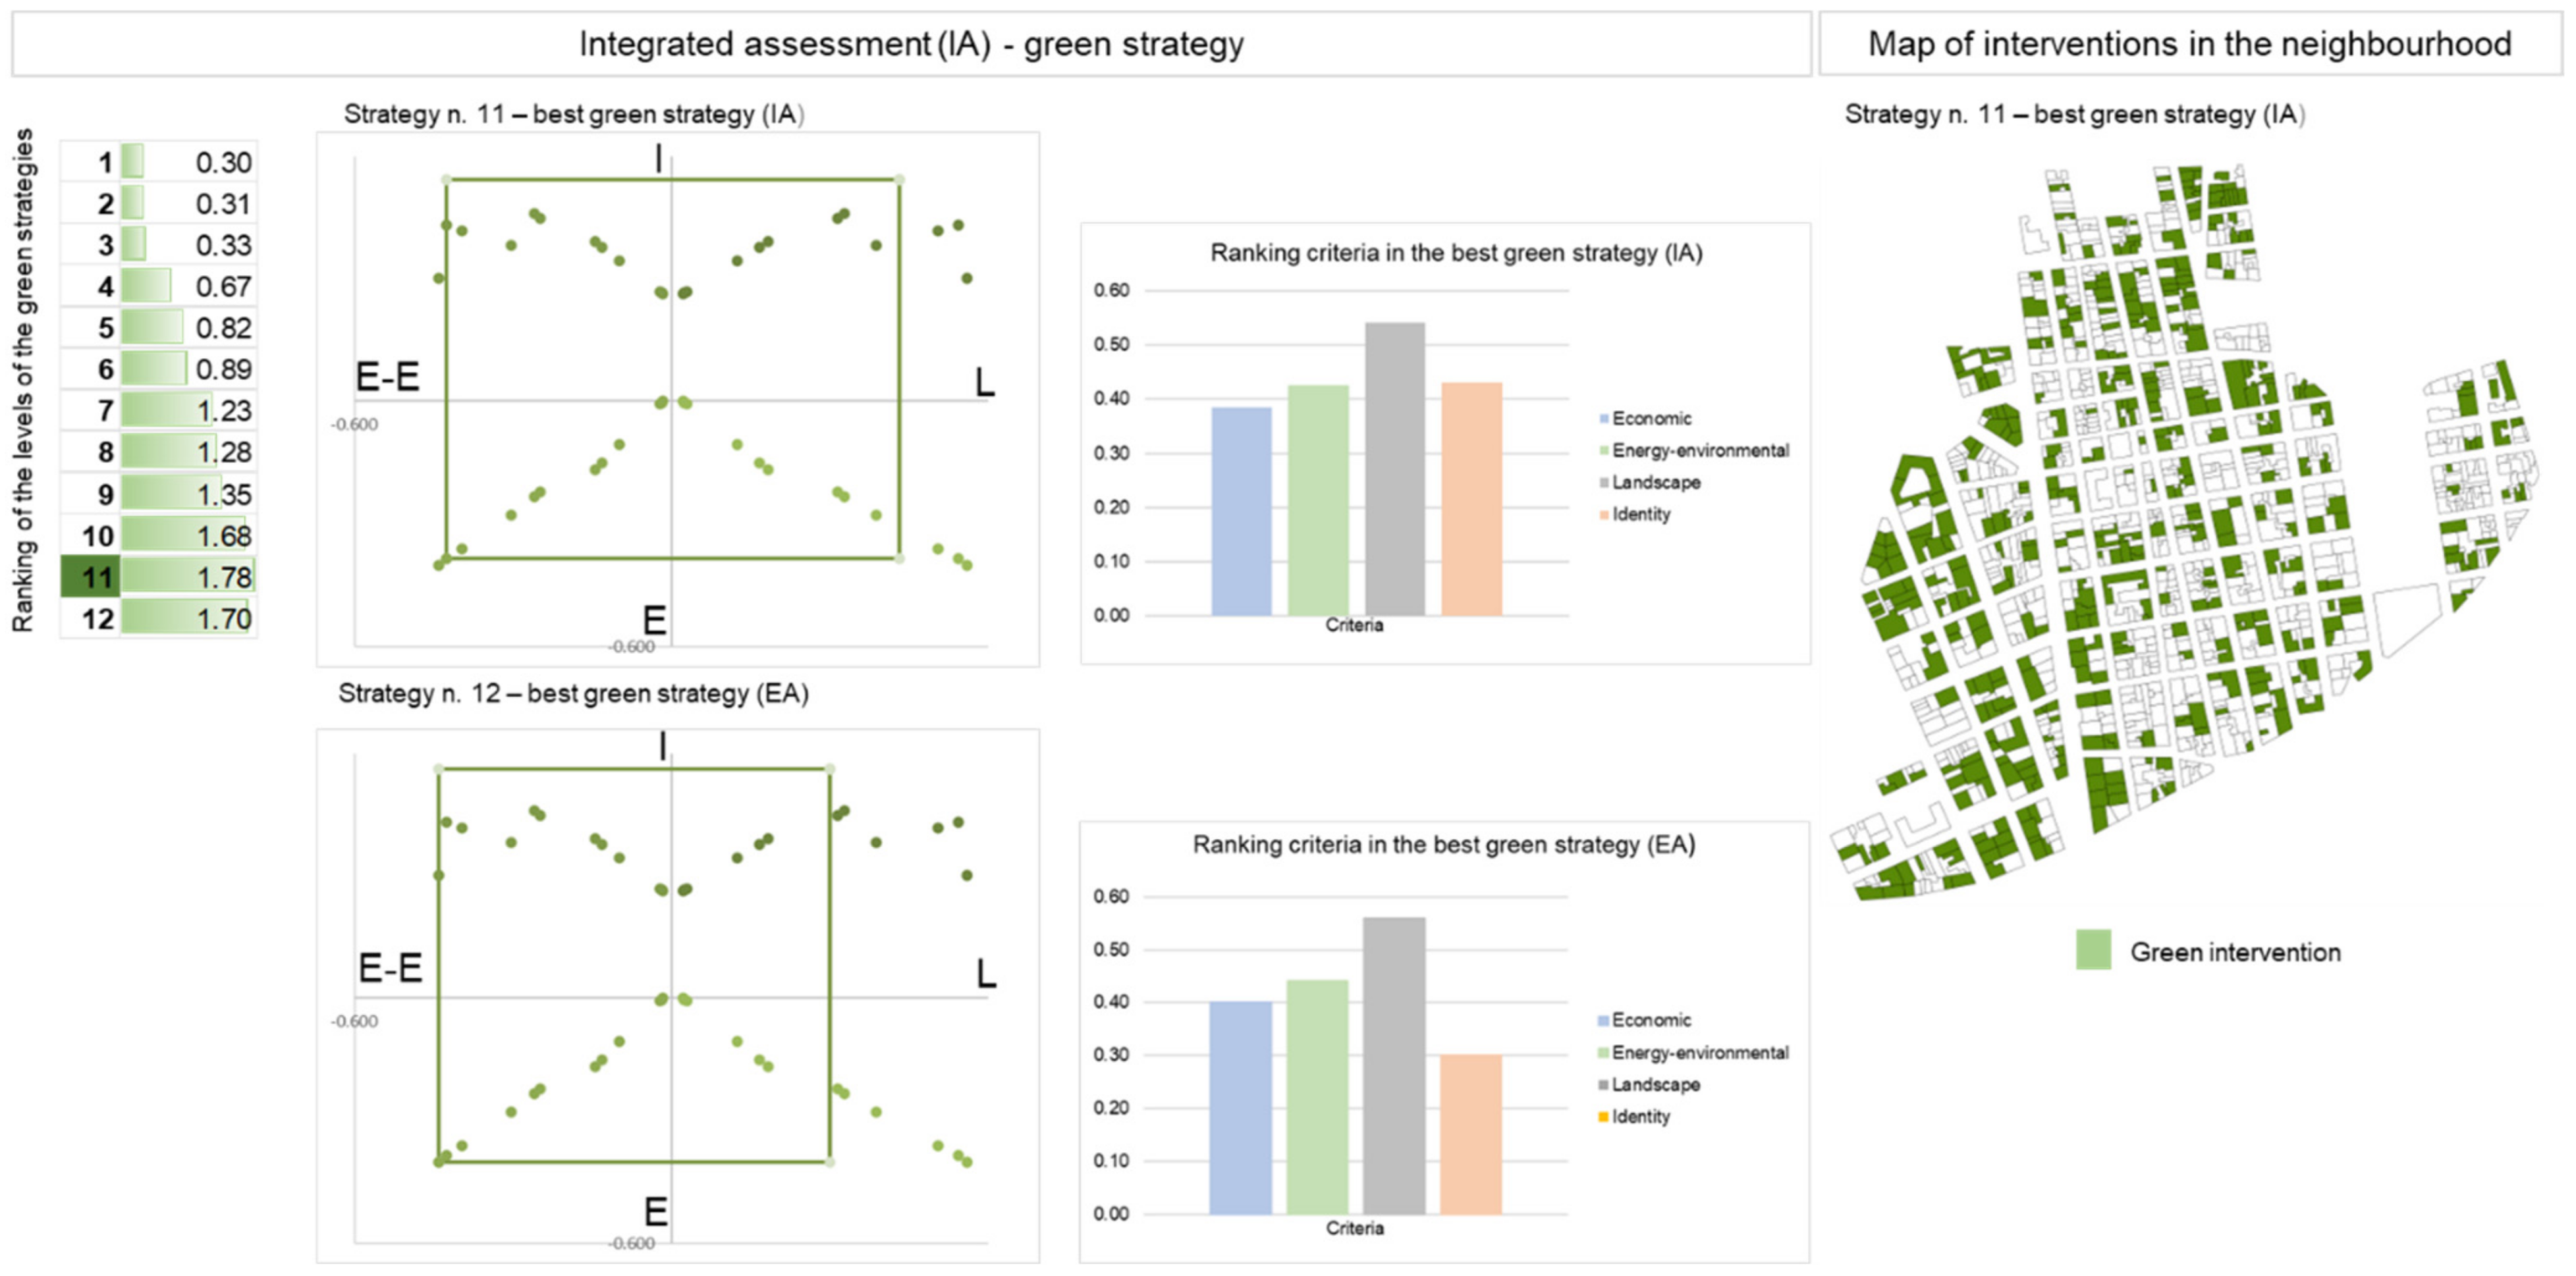
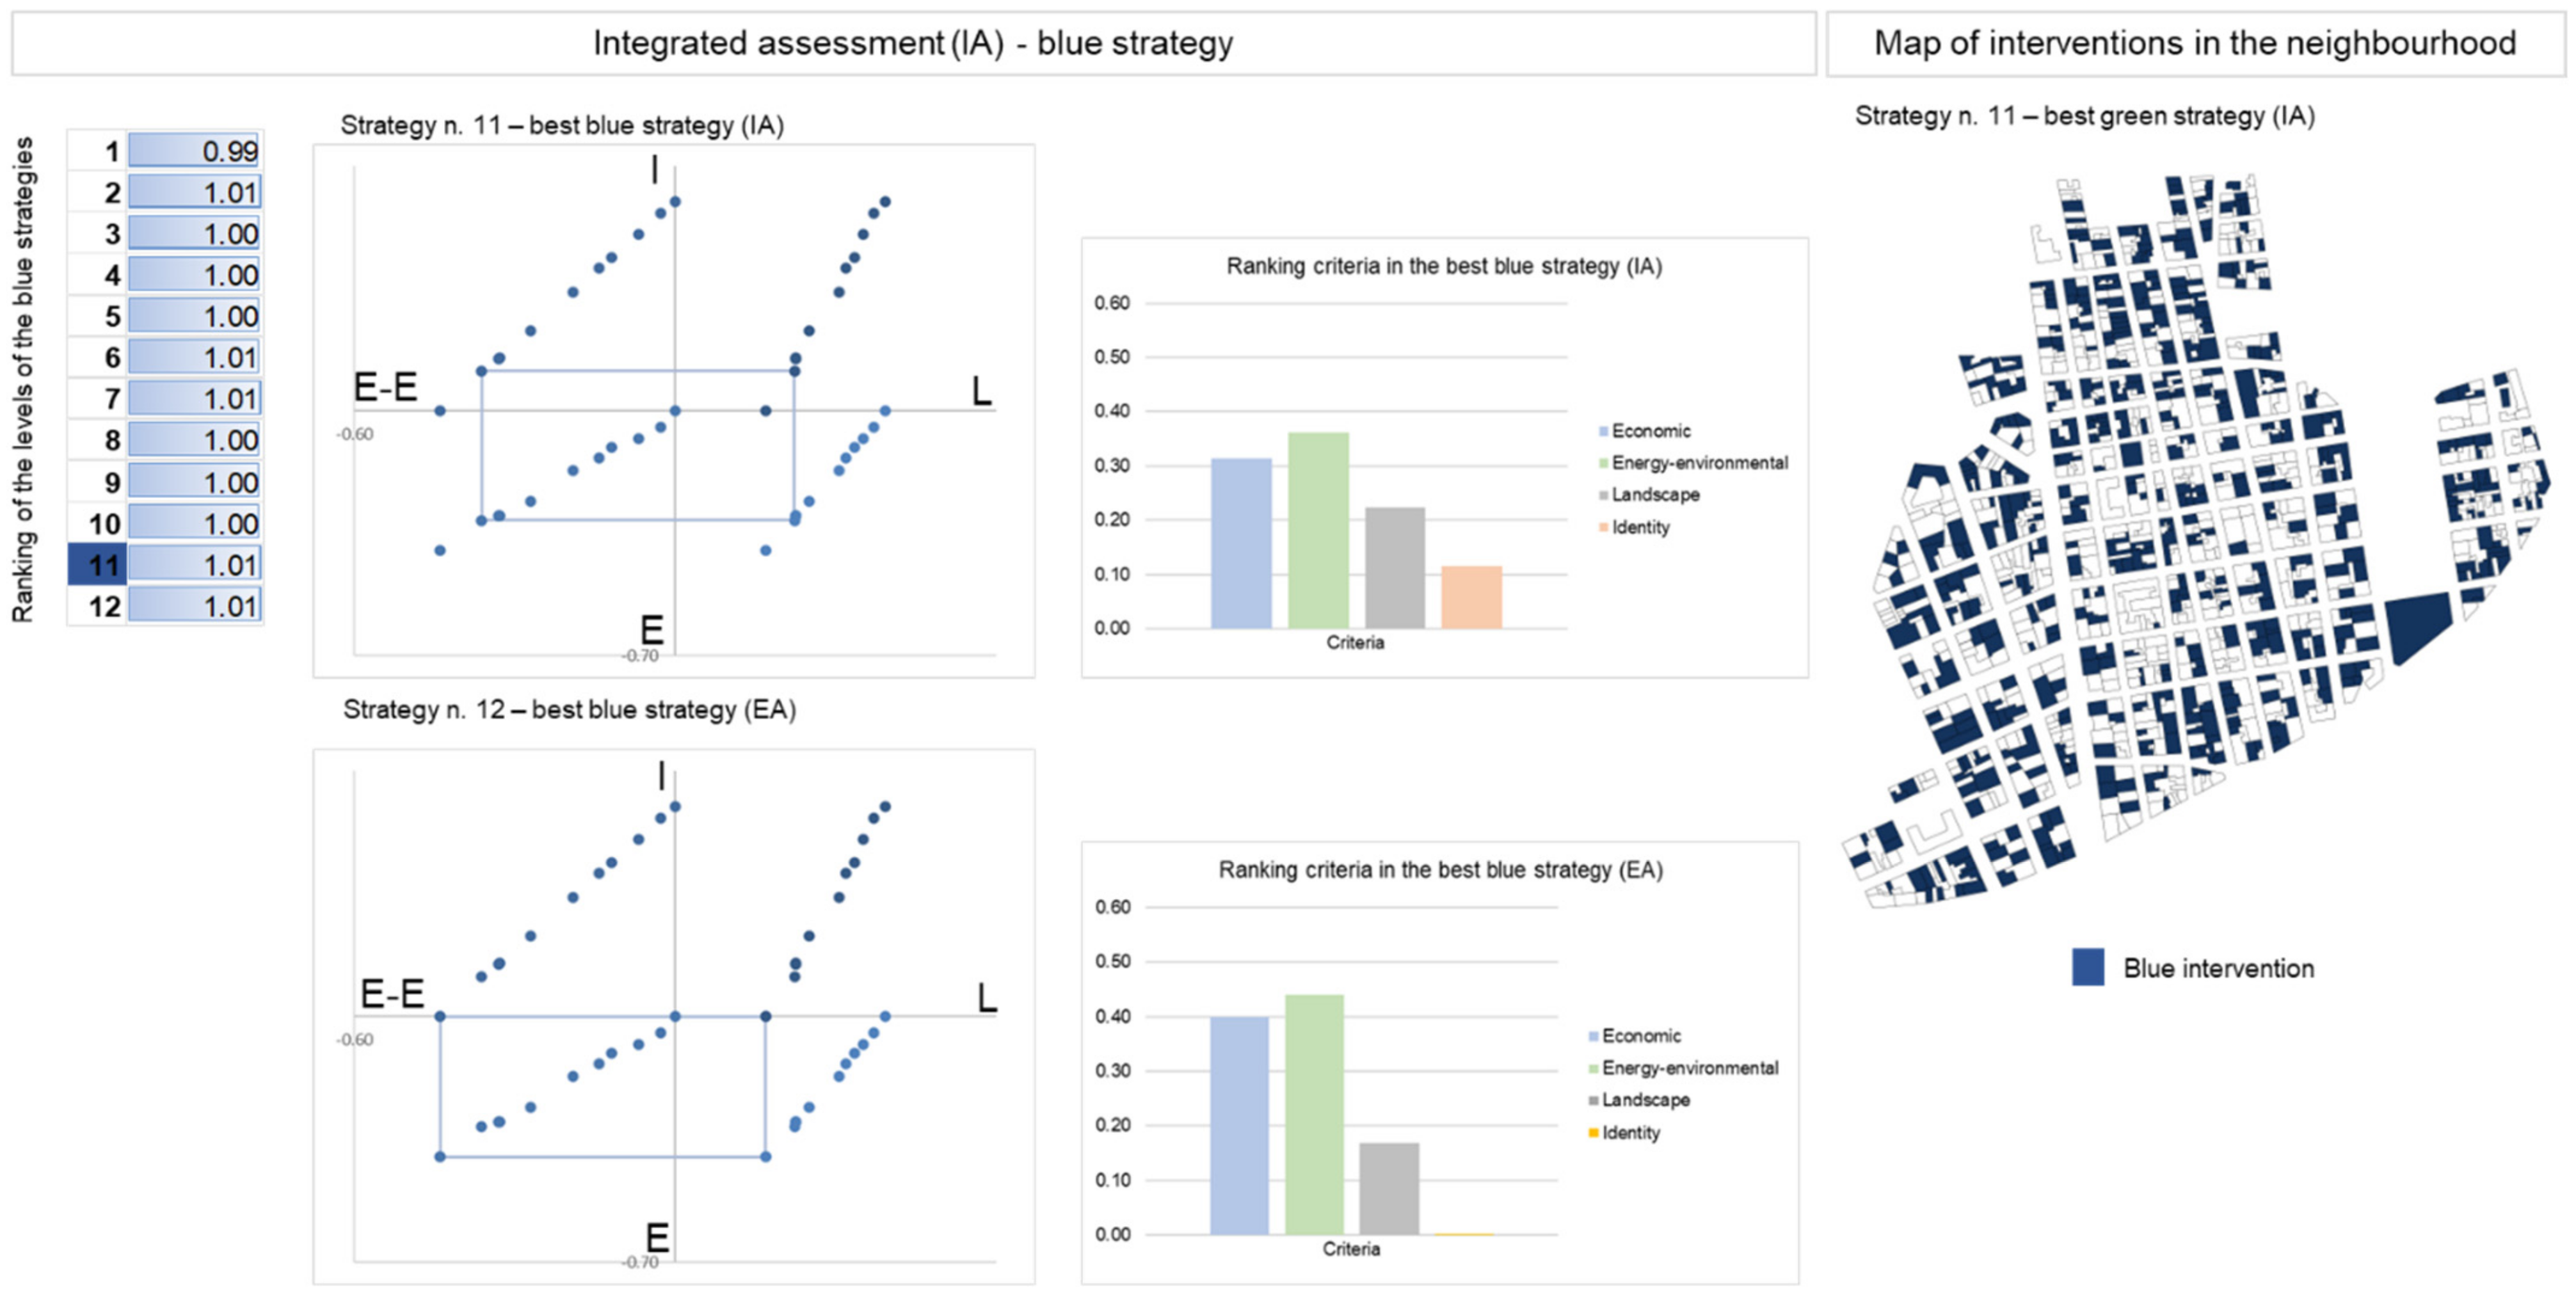
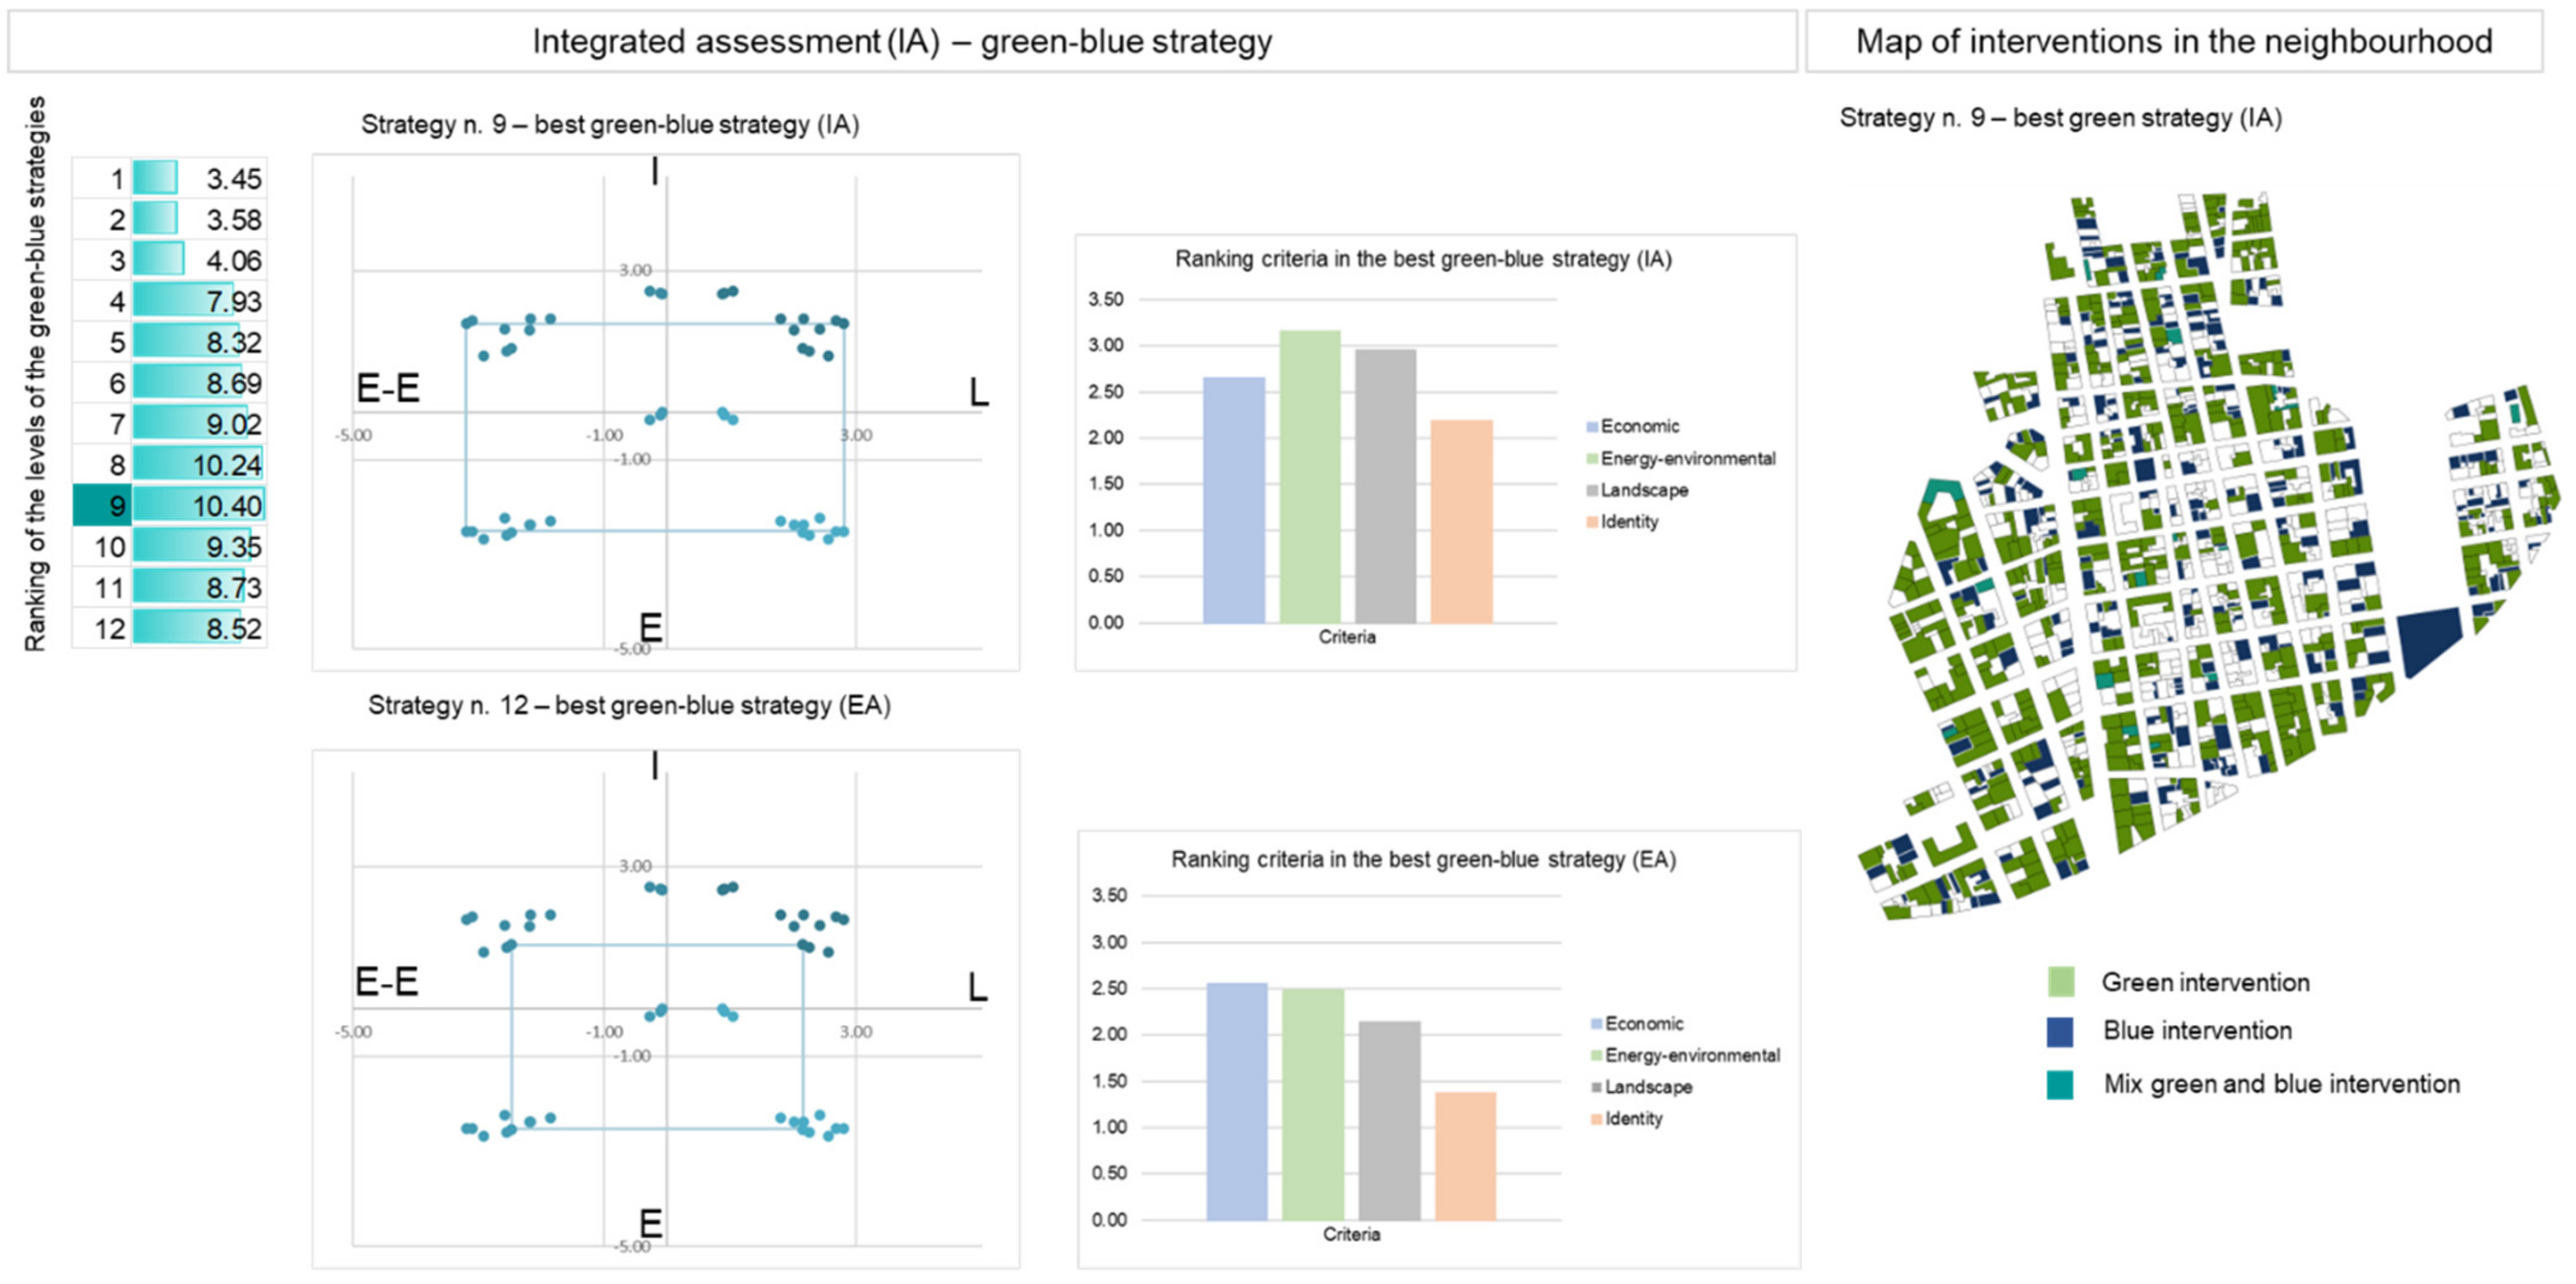
3.2.4. Module D—Planning Module

The planning module aggregates all the information contained in the previous modules. Additionally, in this case, the database can be interrogated on the basis of logical propositions of the type “If…, then…”.
This module helps the decision maker to explore the performance of interventions with reference to any n-tuple of objectives, strategies, and their levels.
This module offers different visualizations of the effects induced by different queries, some developed directly in Excel, and others with the help of QGIS:
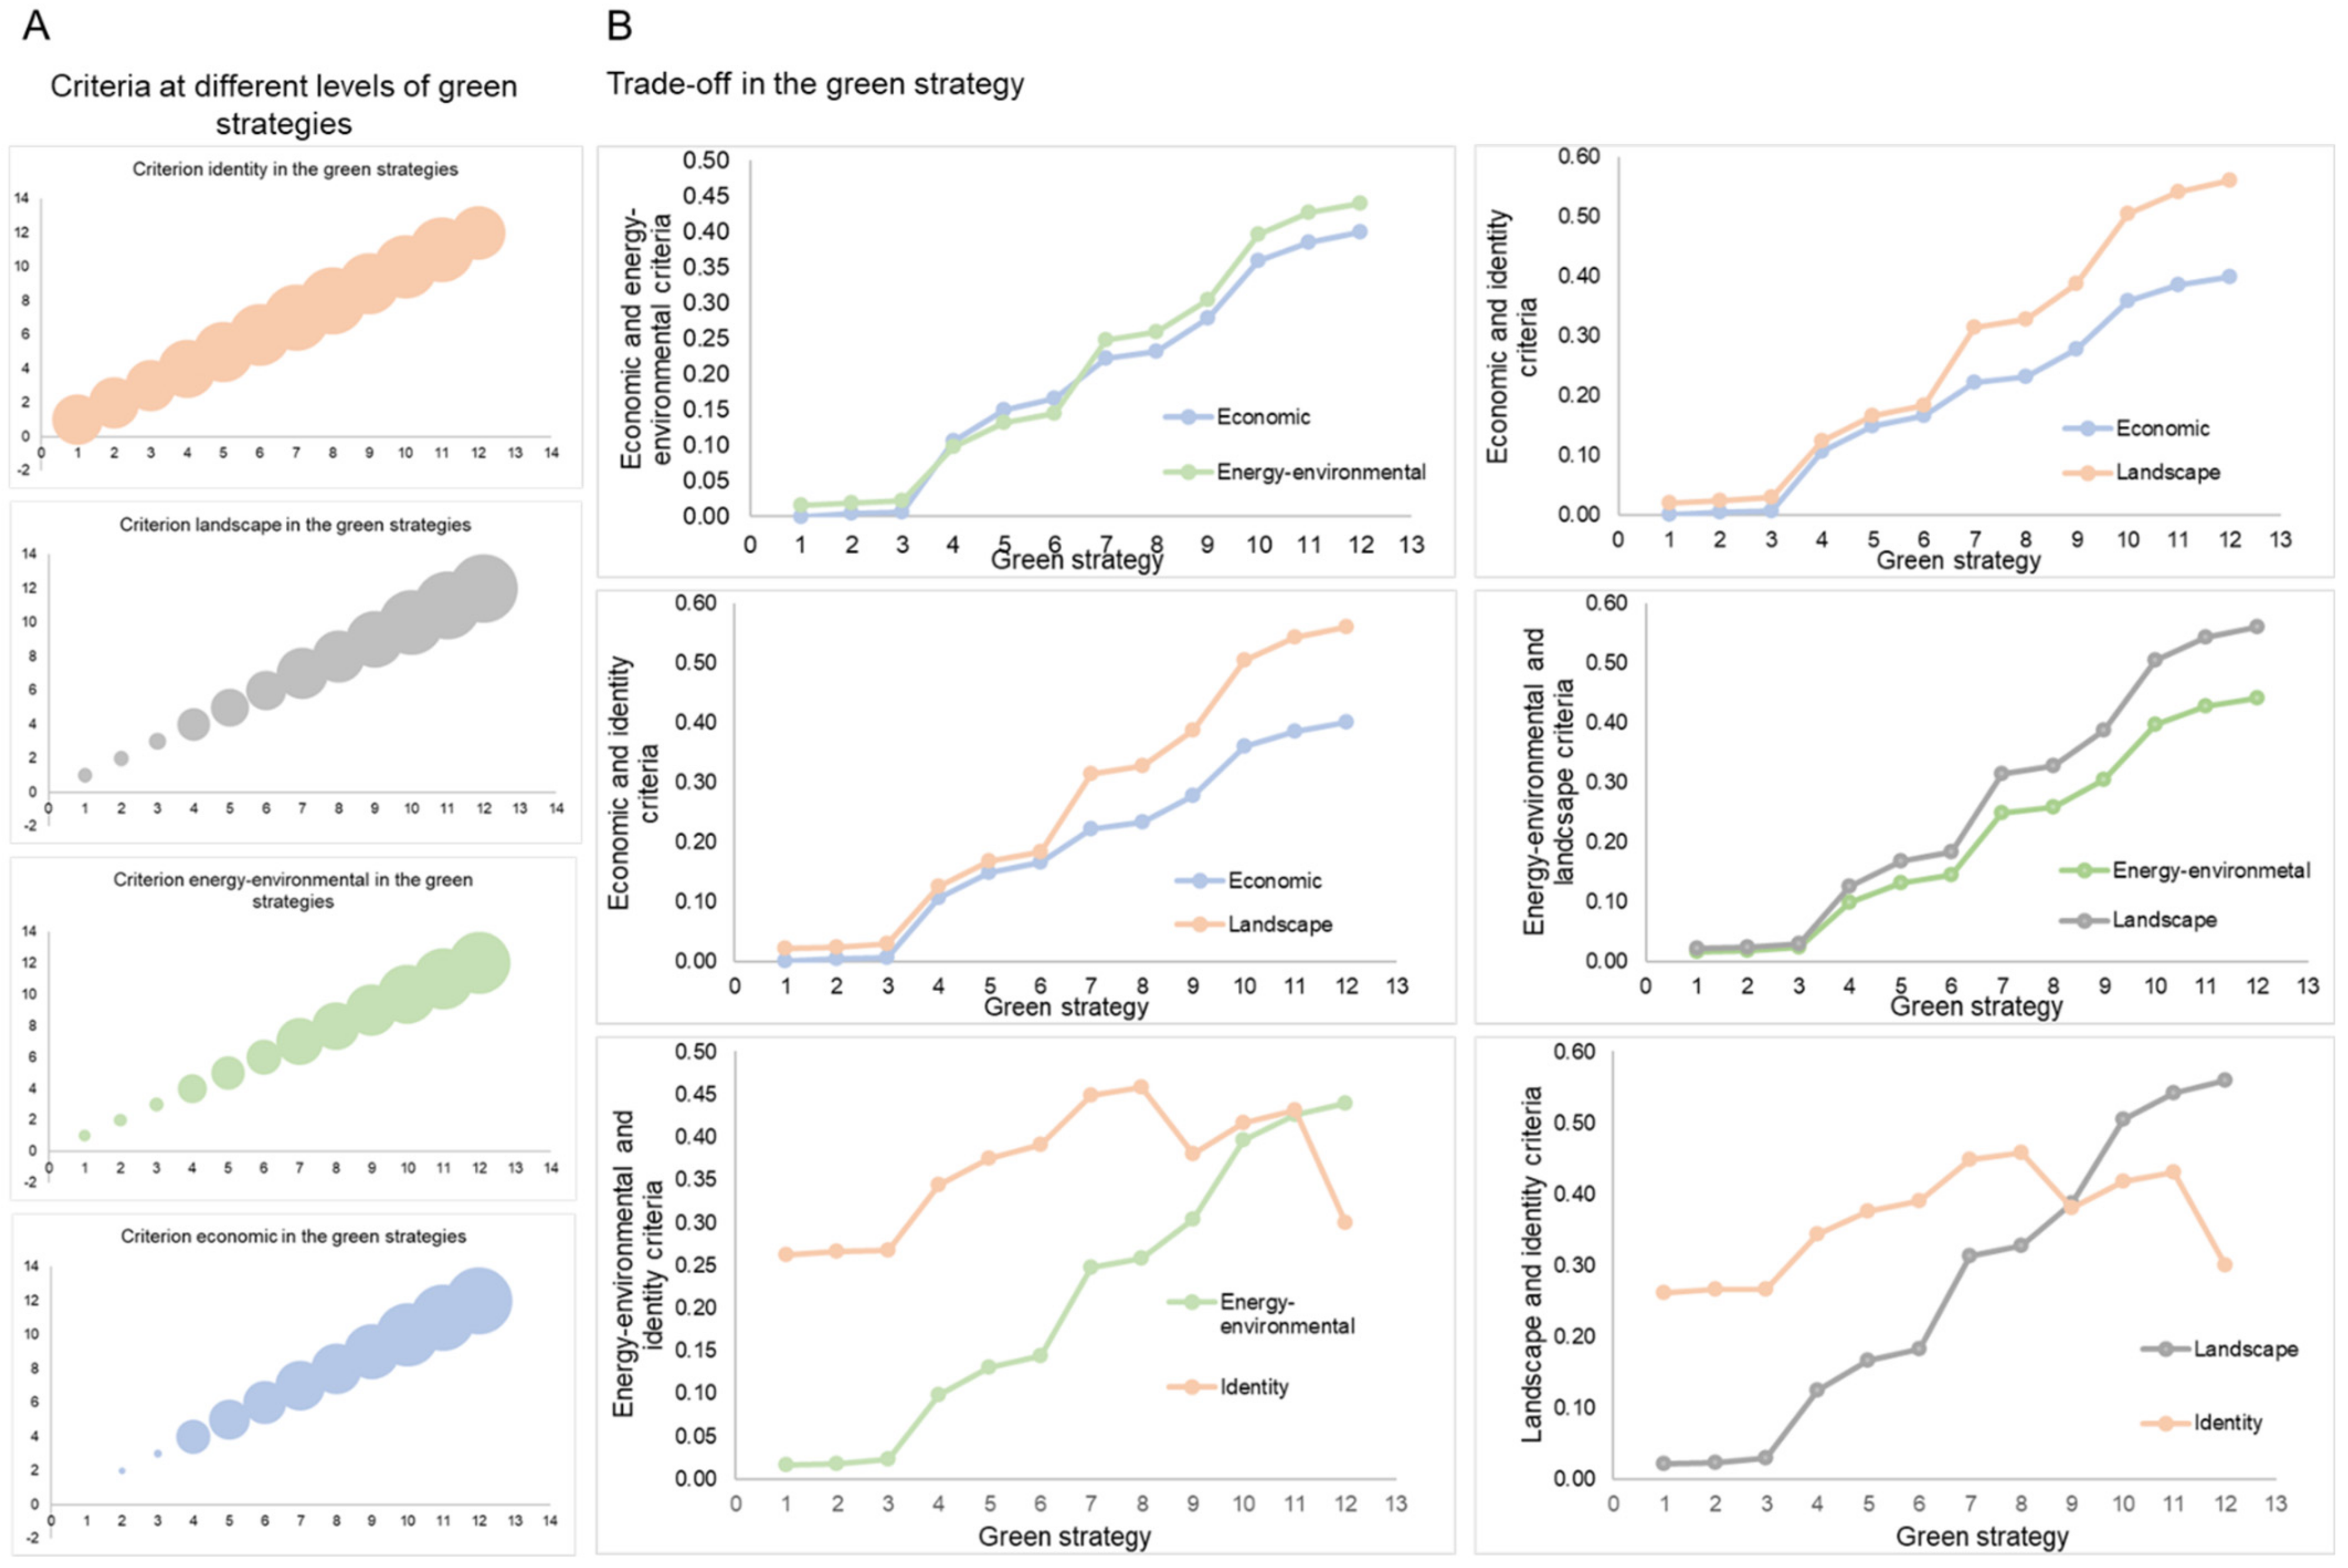
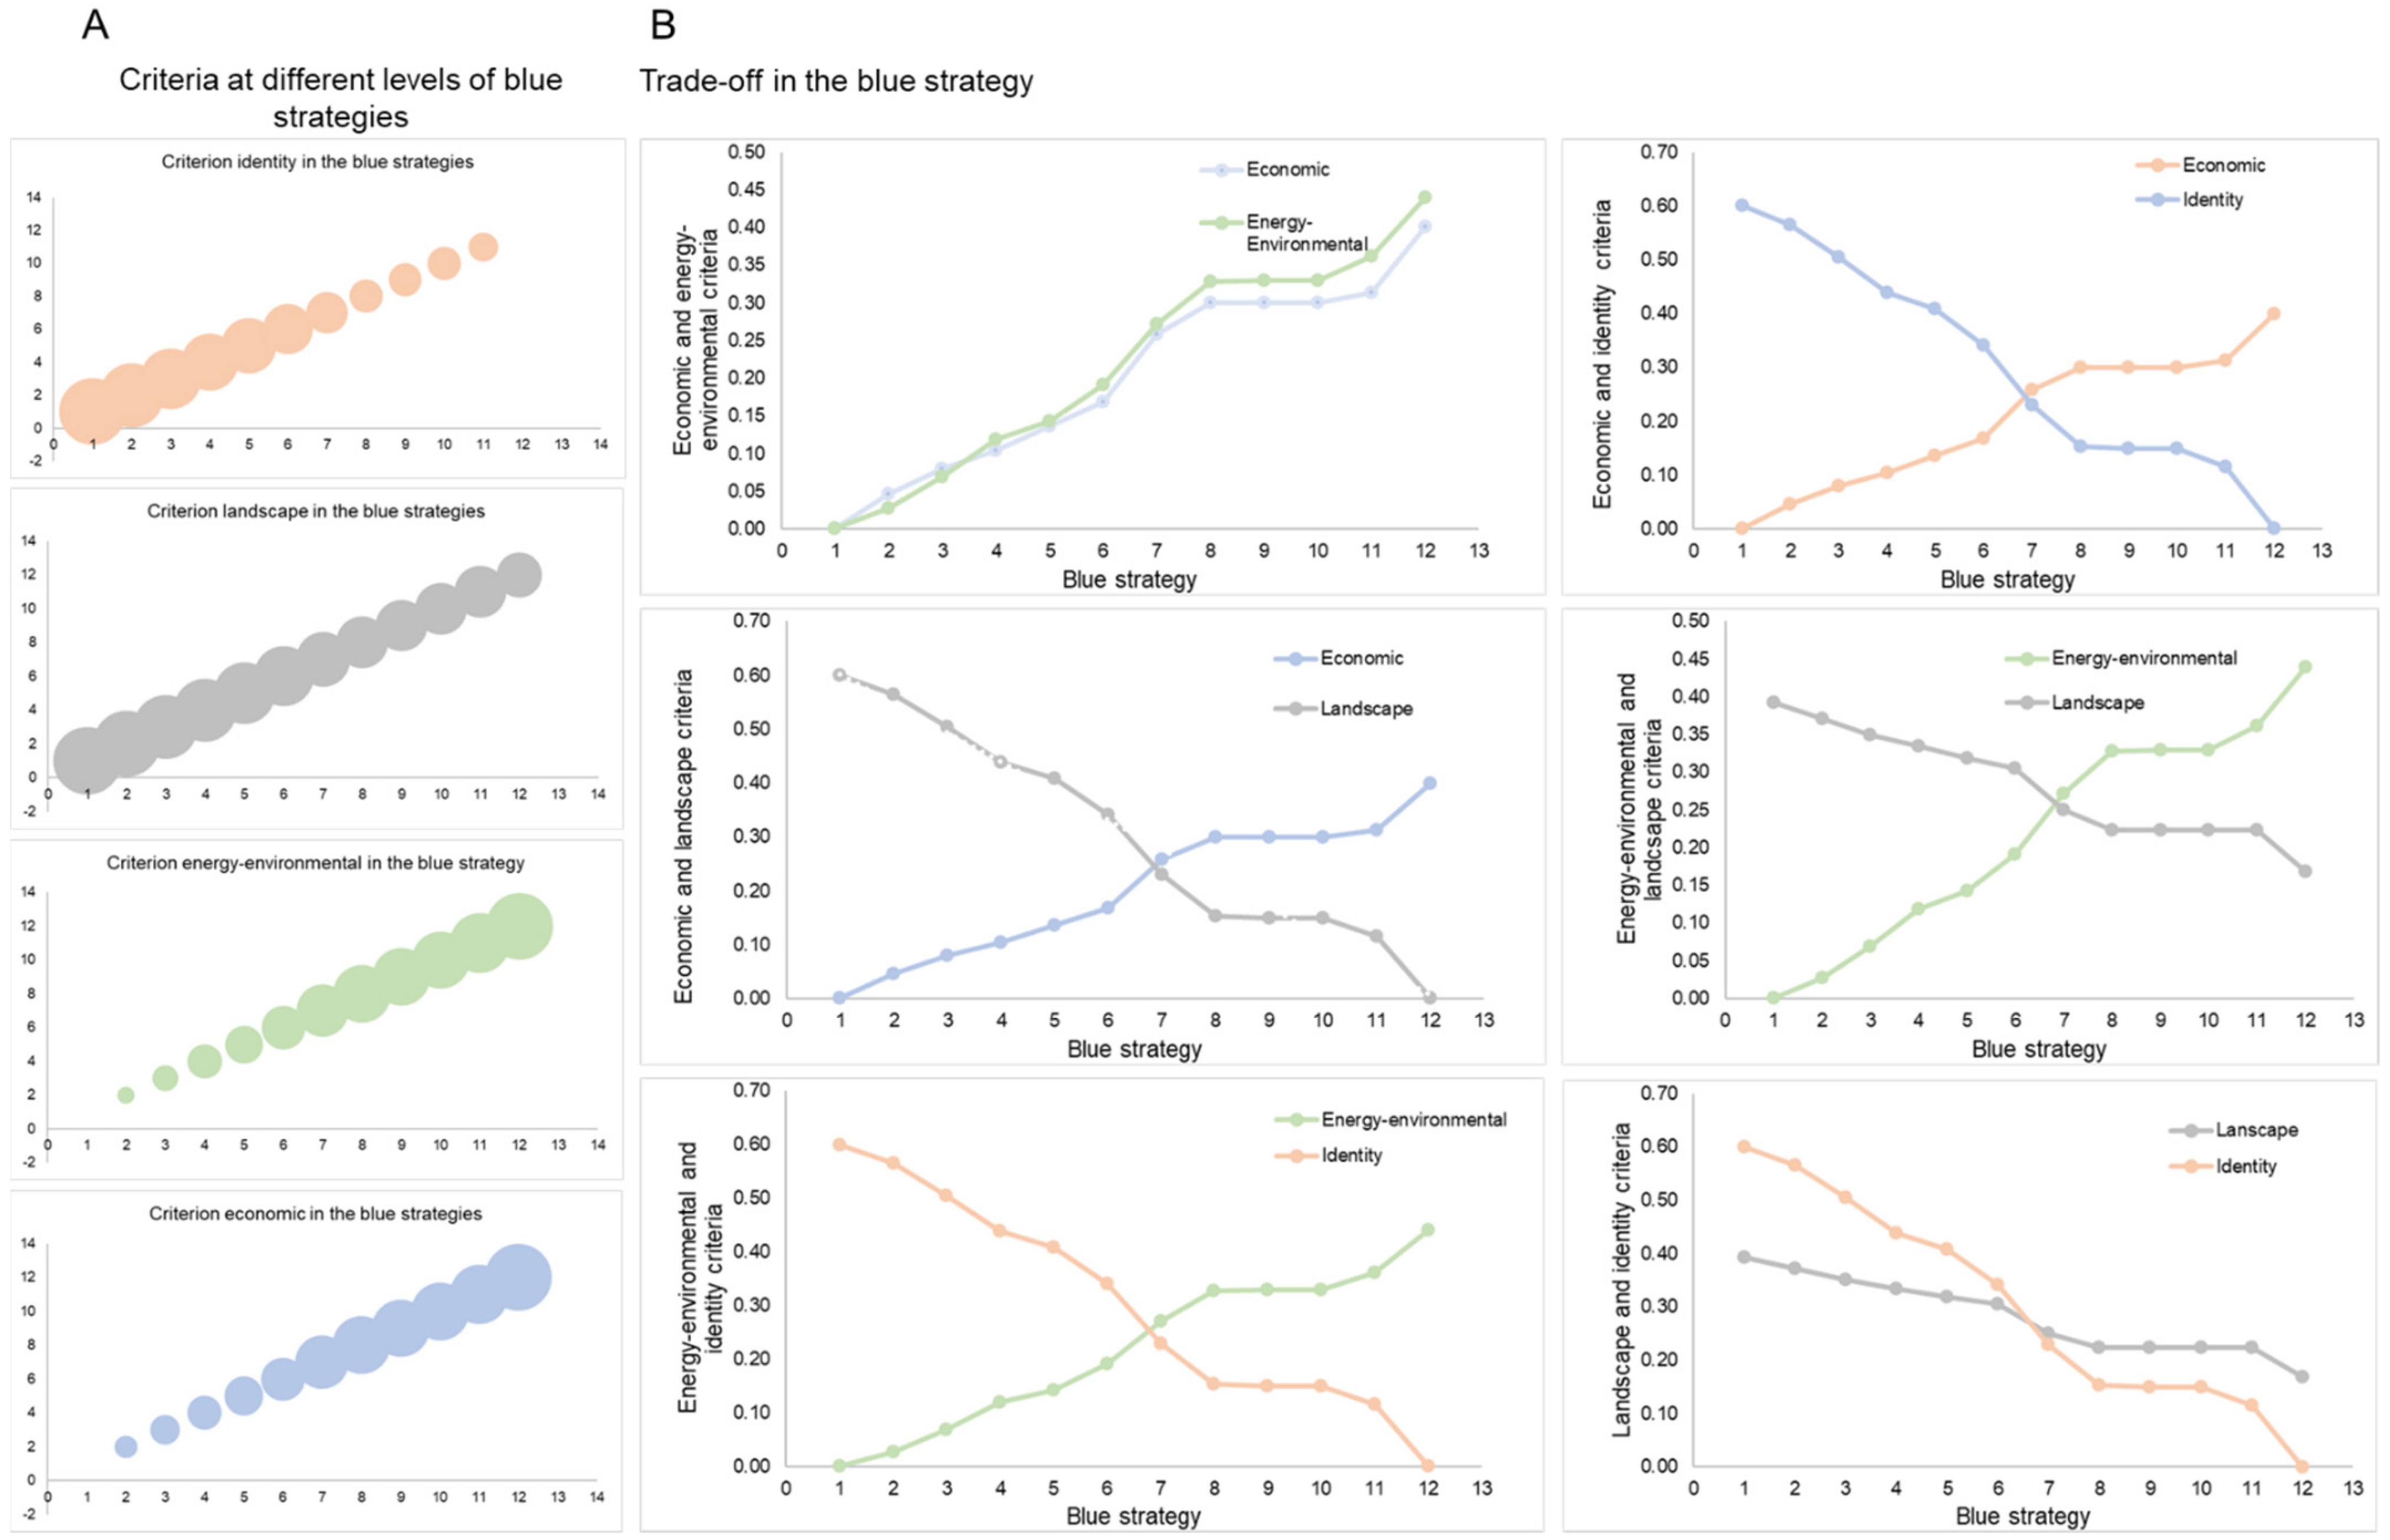
  • Paired comparison of criteria to highlight trade-offs and convergence between them;
  • Comparison between the four criteria, supported by a polygon built on the basis of their assessments, whose size and symmetry with respect to the axes help decision makers identify their effects and the prevailing direction;
  • Aggregate score of criteria assessments and their ranking;
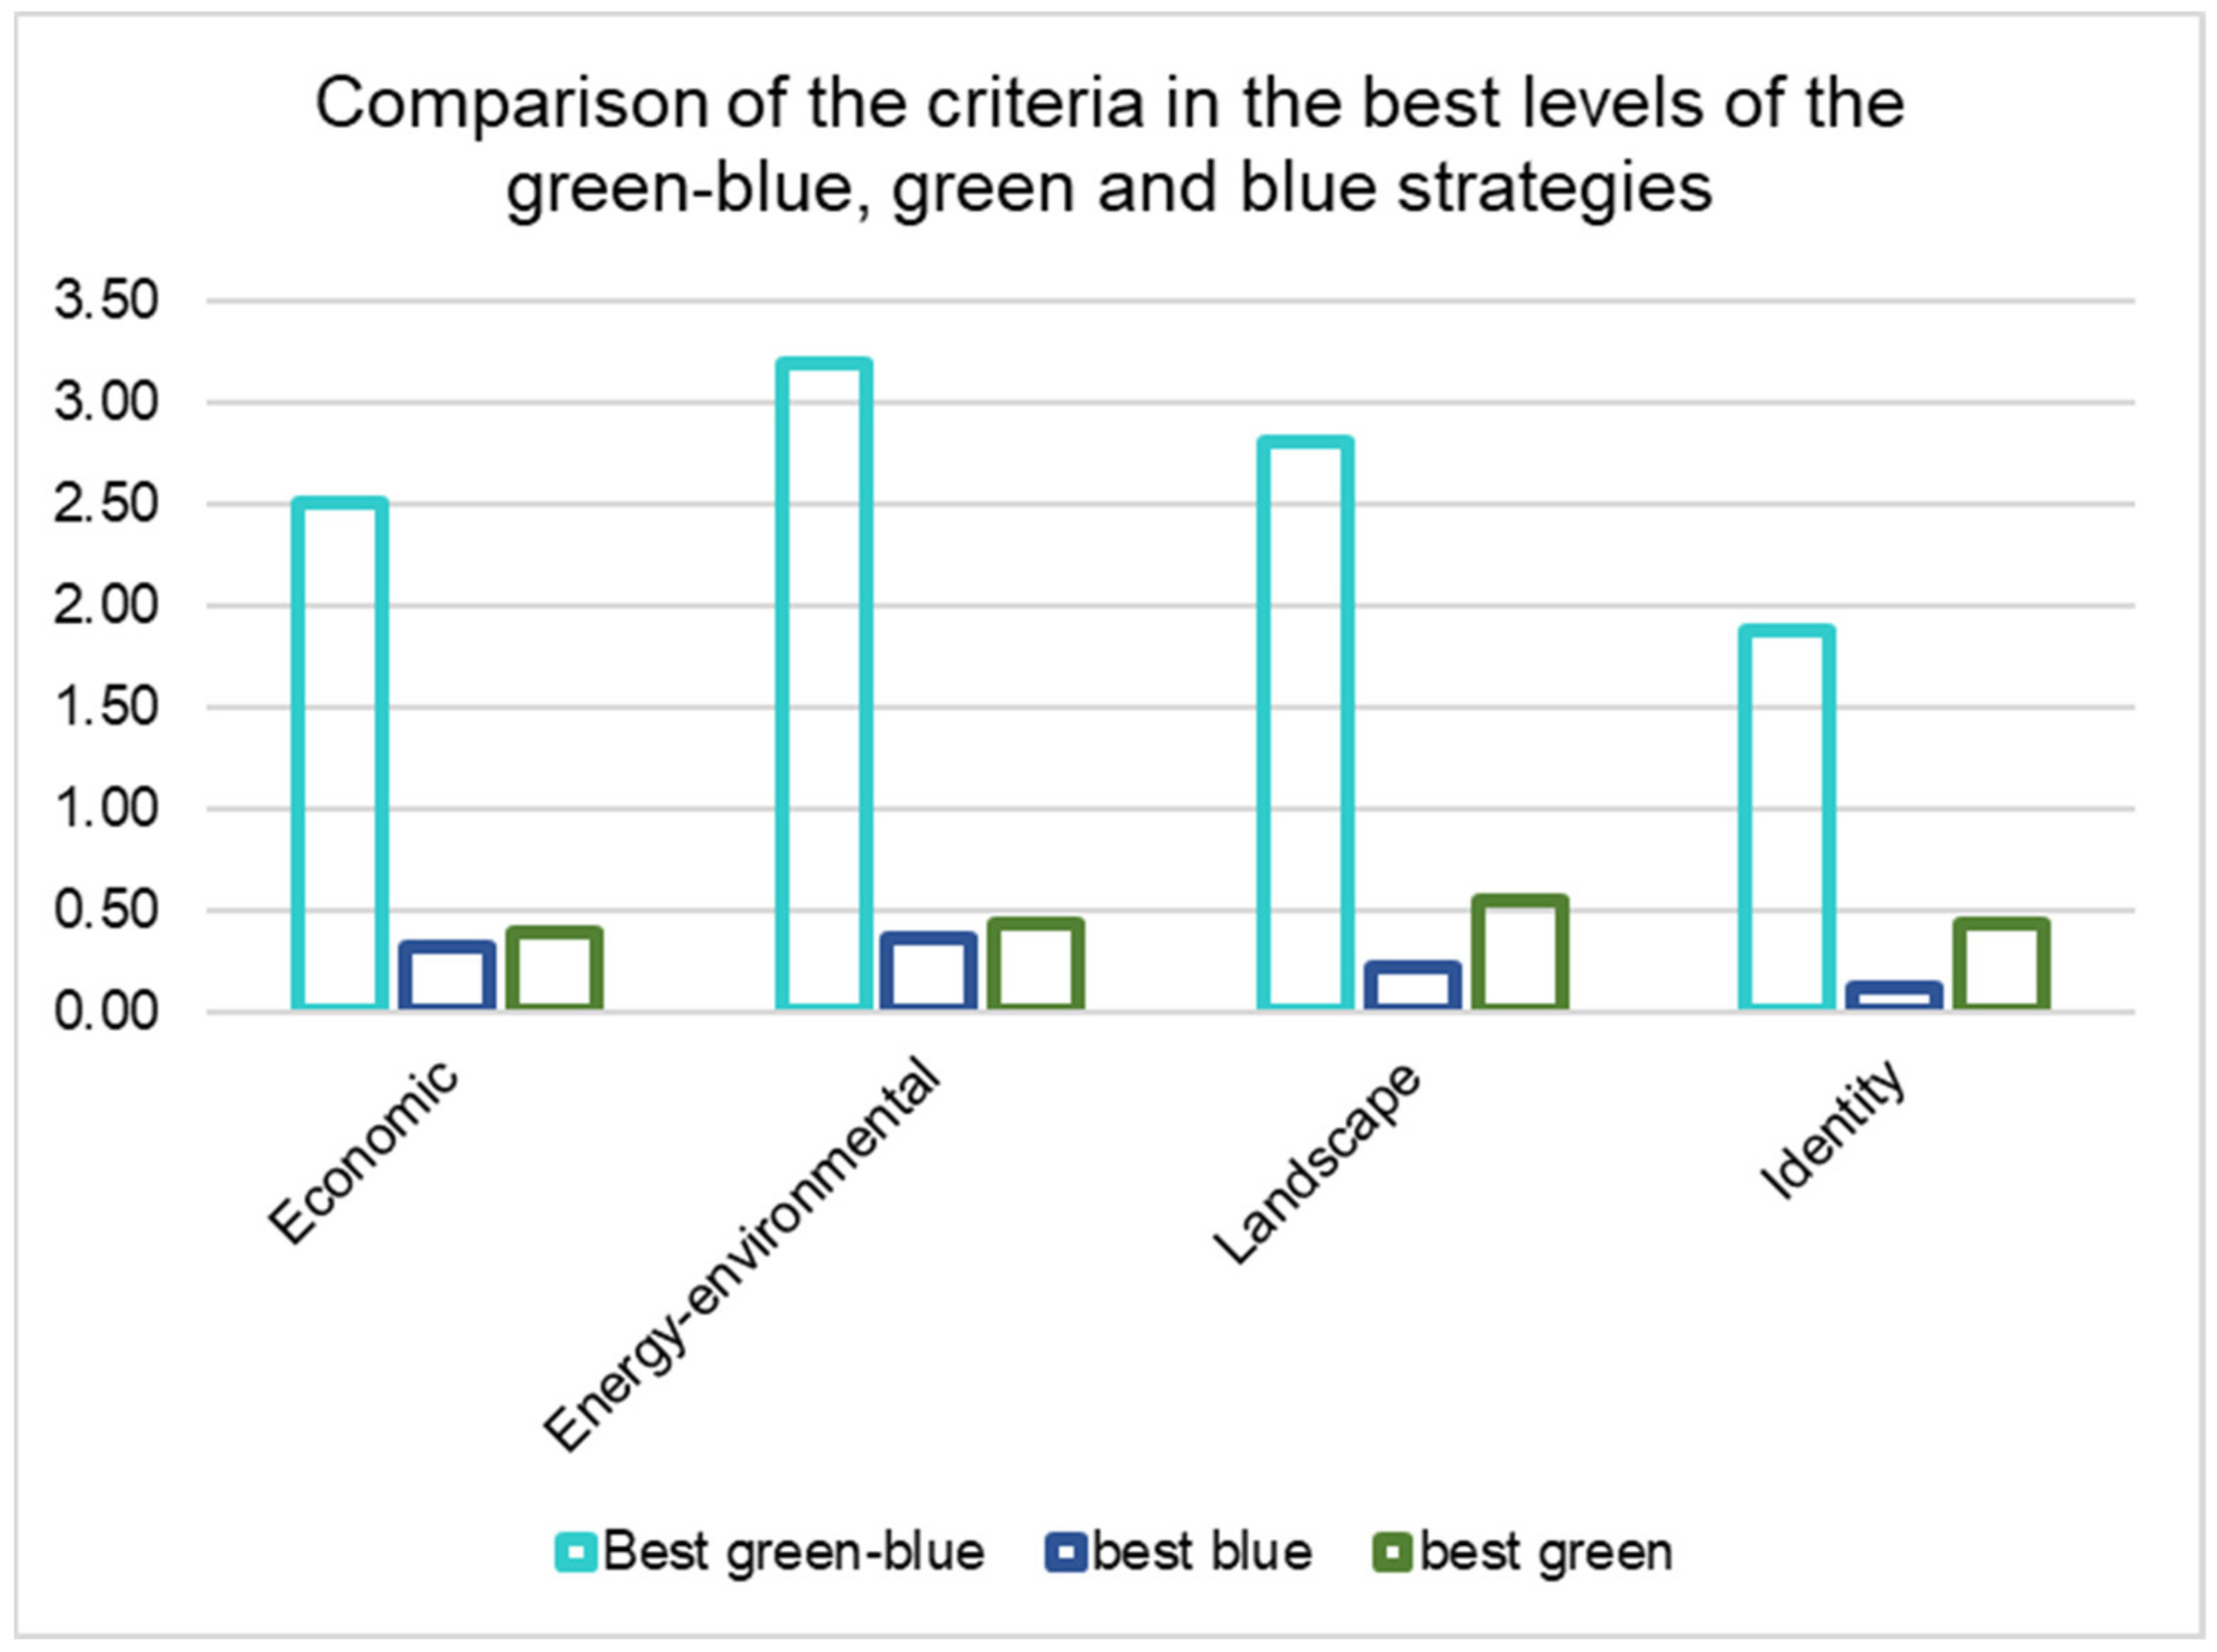
  • Comparison of performance between criteria;
  • Spatialization of interventions in the neighbourhood.

4. Study Area

The exploration of green-blue strategies and alternatives at the scale of individual building units and at the urban scale with the HPSS tool was conducted for the historic district of the Borgata di Santa Lucia in Syracuse. The aim was to identify a design layout to facilitate the ecological transition of the district by integrating energy-environmental needs with those of identity, the historic urban landscape, and its constraints, aimed at their protection and conservation.
The Borgata di Santa Lucia is the second historic centre, in addition to Ortigia, in Syracuse.
We have selected this sample area because it is subject to a regime of constraints that are less stringent than those provided for in the urban planning tools for the historic centre Ortigia.
Ortigia, moreover, is part of the UNESCO Site “Syracuse and the Rocky Necropolis of Pantalica”; for this historic centre, the constraints of protection and conservation of the specificity of this site make it incompatible the interventions aimed at favouring its ecological transition.
The Borgata di Santa Lucia consists of the portion of urban territory between Via Torino to the east, Via Piave to the west, Viale Teocrito to the north, and the coast of “the long rocks—Riva port Lakio” to the south. In the ancient Greek period, it was part of Akradina, which, according to historians, included the territory between the area of Umbertina and the current via Maria Politi Laudien.
The Borgata di Santa Lucia is of great scientific and operational interest for development as a unitary urban entity within the vast program of social and civil reform started with the demolition of the walls that encircled the ancient nucleus of Ortigia around 1865.
The construction of the district began in 1886; before that date, this area was used for agricultural purposes. The first buildings were aimed at meeting the demand for residency for the less well-off population.
The neighbourhood occupies an area of 637,806 square metres. The population settled with reference to the last ISTAT census of 2011 [157] in the village of S. Lucia is 7674 inhabitants. The total number of buildings in the neighbourhood is 1876. The number of empty dwellings is 1295. The real estate is characterized by a number of buildings with a single floor of 635 units, two floors of 675 units, three floors of 245 units, four floors of 106 units, and for a greater number of four floors of 215 units [157].
Apart from some phenomena of building degradation and some out-of-scale replacements, the appreciable level of widespread architectural quality and the strategic value of the district in terms of its positional and landscape characteristics and low building density give rise to positive prospects of heritage, social, and identity regeneration.

5. Results

In a first phase of the process was organized with the support of the professional associations of architects and engineers of Syracuse, a "Focus Group" on the platform GoTowebinar (19 July 2021) which were invited to participate local administrators, scholars, professions, and industry enterprises. In this event, the question of actions to promote the ecological transition in the historic centres was introduced and discussed, and in particular, the case of the Borgata di Santa Lucia was introduced. One hundred and fifty participants attended this event.
At the end of the event, a questionnaire was administered to all participants.
Professional orders have made a link available on the relevant websites for those who did not participate in the Focus Group to fill out the questionnaire. At the end of this first process, 180 questionnaires were collected.
This first administration of the questionnaire was a pre-test for the drafting of a slightly modified structure of a second questionnaire that was administered at the end of a second Focus Group, organized with the support of the professional associations of architects and engineers on the platform GoTowebinar (13 September 2021). In addition, local administrators, scholars, professions, and industry enterprises were invited to participate in this second event. Two hundred participants took part in this event and completed a questionnaire at the end of it.
The link on the websites of the professional orders allowed the number of the surveyed questionnaires for this second phase to increase to 248.
In a third phase, two Decision Conferences were organized to detect the preferences of decision makers. These two events were held in compliance with the measures taken by the government to combat the spread of COVID-19.
In the first Decision Conference (19 October 2021), the results of the second questionnaire were presented. Only twelve subjects (three local administrators, two architects, two engineers, two members of civic and environmental associations, two scholars, and one industry enterprise) participated in the Decision Conference due to the restrictions due to the pandemic, as well as two facilitators.
Access to the event for all other interested parties was guaranteed through the GoTowebinar platform.
The second Decision Conference (3 November 2021) was attended by the same stakeholders as the first one, which in this study represents the group of decision makers. Again, other stakeholders participated via the GoTowebinar platform.
In the first Decision Conference, the decision makers identified four main objectives: improving the energy efficiency of BUs (Ev), fostering the production of electricity from renewable sources (E), protecting the historical-cultural identity (I), and the quality of the urban landscape of the neighbourhood (L).
The decision makers were then invited to give an order of preference for each objective (Ev), (E), (I), (L), and for each n-tuple of objectives (Ev, E), (Ev, L), (Ev, I), (E, L), (E, L), (I, L), (Ev, E, I), (Ev, E, L), (Ev, I, L), (E, I, L), (E, Ev, I, L).
As a result of the first Decision Conference, they provided the following orders of partial shared preference:
I L ,   I E v ,   L E v ,   I E ,   L E ,   E v E
I , L E v ,   I L ,   I E v ,   L E v I E ,   L E ,   E v E
I , L E v l h ,   I L ,   I E v ,   L E v ,   I E ,   L E ,   E v E l h t h r e s h o l d   n o t   k n o w n
      I , L ,   E v , E ,   I , L E v ,   I L ,   I E v ,   L E v ,   I E ,   L E ,   E v E
I , L ,   E v E ,   I , L E v ,   I L ,   I E v ,   L E v ,   I E ,   L E ,   E v E
I , L ,   E v E l i ,   I , L E v ,   I L ,   I E v ,   L E v ,   I E ,   L E ,   E v E l i t h r e s h o l d   n o t   k n o w n
In the second Decision Conference, the decision makers confirmed the choice of the four criteria, and they were again invited to give an order of preference for each objective and for each n-tuple of objectives.
They provided the following orders of partial shared preference:
I , L E v l h , E l i I , L E v ,   I L ,   I E v ,   L E v ,   I E ,   L E ,   E v E l h t h r e s h o l d   n o t   k n o w n ,   l i t h r e s h o l d   n o t   k n o w n
The decision makers from the stage of identification of the objectives were aware of the convergent nature of some of them and the divergent nature of some other ones. Their declared preferences reflect their inability to simultaneously manage objectives of a different nature.
The above process is uncertain and characterized by limited rationality. The preference structure of decision makers in this case is uncertain. It can be identified as the output of a process of exploration of the effects of these objectives.
In the second Decision Conference, the decision makers were invited to outline a set of strategies and levels of strategies with reference to the selected objectives. The decision makers initially identified two main strategies: green and blue.
The green strategy (G) favours green roof interventions on BU roofs.
The blue strategy (B) favours the interventions that include the installation of photovoltaic systems in the roofs of BUs.
Subsequently, the decision makers stated that they also wanted to explore a hybrid strategy aimed at pursuing the green-blue strategy (G-B).
The decision makers were invited to declare a partial order of preference on strategies, and they provided the following information:
  • s t r a t e g y   G S t a t e g y   B
  • s t r a t e g y   G B S t a t e g y   G S t r a t e g y   B
Based on this information, an exploration of the objectives and strategies selected by the decision makers can be supported through the database integrating the analysis and evaluation modules.
The decision makers were invited to identify a set of criteria from which they derived their preferences for interventions aimed at combating the effects of climate change in the historic centre, and they identified the following: identity, landscape, energy-environmental, and economic.
Through module B of analysis and module C of evaluation, the instrumental information to analyse the actions activated from the various selected strategies can be produced.
The database contains all the information on BUs, technical, environmental, and economic interventions, and querying the database gives as output the technical feasibility, the economic and financial feasibility, and an integrated assessment, which provides a qualitative analysis of the performance of the interventions with reference to four selected criteria.
Based on the preferences of the decision makers, the first exploration concerns the green strategy. This strategy, with reference to the preference of the decision makers (Equation (9)), selects actions that promote the energy efficiency of BUs (green roof solution). These solutions are perceived by decision makers in a more convergent way in terms of identity and landscape.
The green strategy was explored from a baseline scenario of zero (state of fact), promoting different levels of action implementation, from a minimum to a maximum level, considering the maximum green roof area that can be installed on BUs roofs. In total, 12 levels of implementation of the green strategy were explored.
The economic evaluation of actions implementing different levels of the green strategy, based on the DCFA extended to the life cycle, identifies the best performance at level 12 for all analysed green solutions.
The NPVs for the different levels of green strategy highlight their economic profiles (Figure 3) with reference to the individual green solutions and the total mix of solutions that can be installed on the roofs of the neighbourhood based on technical feasibility.
The economic criterion is one of the criteria identified by decision makers, whose performance will have to be compared to the aggregate one with reference to the four criteria considered.
Module D allows one to produce for each query the visualization of the outputs of the MAVT module integrated in the tool, with reference to the criteria at the different levels of strategies.
The weight system has been defined by the decision makers based on an iteration process supported by the visualizations offered by module D.
The decision makers, based on the visualizations of the criteria values at the different levels of green strategy, have identified the set of weights and the level of trade-offs they can consider acceptable.
The visualization to support the selection of weights consists of two different control modes: the bubble size in the left (A) diagrams of Figure 4 that measures the values of the criteria in the different strategies, and the paired comparison between the values of the criteria in the right (B) diagrams of Figure 4, which is instrumental to highlight the trade-offs and the convergences between them.
Module D allows one to produce for each query, through the MAVT module integrated in the tool, the visualization of the outputs of the integrated evaluation based on an aggregate score of the evaluations on the four criteria and provides a ranking for the different levels of the strategy. The integrated evaluation makes it possible to identify the best level of the green strategy with reference to the four criteria, which in this case is represented by level 11 (Figure 5).
Strategy 12, which turned out to be better from an economic point of view, offers an overall performance of the four criteria lower than strategy 11. Module D allows one to compare the two levels of strategies based on the area of the polygon representing the aggregate assessment of the four criteria and on its position in relation to the axes as well.
In this case, the area of the polygon for level 12 is slightly smaller than for level 11. The position of the polygon in the four quadrants supports the identification of the effects of the strategy level on the paired criteria.
In this case, the comparison shows for level 12 a position of the polygon that less symmetrical than for level 11.
Level 12 of the green strategy shows impacts of intensity comparable to level 11 for criteria E, E–E, and L, but lower intensity for criterion I. The latter criterion, as can be seen from the structure of decision makers’ preferences and from the weight system, has a greater importance than all the others.
Therefore, level 11 is preferable because it performs better for criterion I with equal values of E–E, E, and L, and it is consequently more consistent with the preference structure declared by the decision makers.
In addition, module D allows one to visualize, through the integrations of the information obtained on QGIS, the map of green interventions on BUs in the neighbourhood, supporting decision makers throughout the control of the distribution and dislocation of interventions.
The mix of green interventions for the best strategy from the point of view of the aggregate assessment consists of 463 interventions of type A1, 148 interventions of type B1, and 297 interventions of type B2. A total of eighty-four per cent of BUs roofs were used for green solutions for strategy level 11, of which forty-three per cent were from solution A1, fourteen per cent were from solution B1, and twenty-seven per cent were from solution B2.
Subsequently, based on the preferences of the decision makers, a second exploration concerned the blue strategy. This strategy, with reference to the preference of decision makers (Equation (12)), promotes action to encourage the production of energy from renewable sources by installing traditional photovoltaic panels or BIPV on the roofs of BUs. This solution is perceived by decision makers as more divergent in terms of identity and landscape.
The blue strategy was explored from a baseline scenario of zero (state of fact), promoting different levels of implementation of the action, from a minimum level up to a maximum level that considers the maximum surface area of the BUS roofs on which it is possible to install photovoltaic systems.
The decision makers selected between the photovoltaics power options analysed 1.5 kw for both traditional and integrated technology, as this has been considered the most compatible one, due to the high degree of fragmentation of BU properties.
In total, 12 levels of implementation of blue strategies were explored in this case. The economic evaluation of actions implementing different levels of the blue strategy, based on the DCFA extended to the life cycle, identifies the best performance at level 12 for all blue solutions (traditional and integrated) under analysis. The NPVs for the different levels of the blue strategy highlight their economic profiles (Figure 6) with reference to the individual blue solutions and the total mix of solutions that can be allocated on the roofs of the district on the basis of technical feasibility.
Here, too, the economic performance of the various levels of the blue strategy is compared to the aggregate performance of the four criteria considered.
The visualizations shown by module D support the selection of weights by means of two different control modes: the bubble size on the left-side (A) diagrams in Figure 7 measures the values of the criteria in the different strategies; the paired comparison between the values of the criteria in the right-side (B) diagrams of Figure 7 are instrumental to highlight the trade-offs and the convergences between them.
The integrated assessment allows one to identify the best level of the blue strategy with reference to the four criteria, which in this case is represented by level 11 for all the installed powers and for the different types of photovoltaic panels (Figure 8). Strategy 12, which turned out to be the best from an economic point of view, offers an overall performance in terms of the four criteria that is lower than strategy 11. The comparison of the two levels of the blue strategies based on the area of the polygon and its position with respect to the axes shows that a score for level 12 is slightly lower than that for level 11, with impacts with the same trend, which is moved further forward towards the criteria E–E and E but with different intensities.
Both levels of the blue strategy increase criteria E and E–E, to a greater extent for level 12 of the blue strategy than for level 11, but level 11 increases criteria L and I more significantly. Criterion I for level 12 is zero, which is not acceptable regarding the preferences of decision makers, because the mix of photovoltaic panel solutions is more balanced in level 11, enabling better performance for criteria L and I.
The BIPV solution is considered more compatible in terms of identity and is capable of improving the quality of the urban landscape, as its installation requires a refurbishment intervention of the roofs.
Level 11 of the blue strategy is therefore preferable because it is more consistent with the preference structure declared by decision makers.
Additionally, in this case, the mapping of green interventions on BUs in the neighbourhood supports the decision makers in the control action of the distribution and the dislocation of interventions.
The mix of blue interventions provides the best strategy in terms of aggregate evaluation and consists of 377 interventions of type T 1.5 (traditional photovoltaics) and 289 interventions of type I 1.5 (BIPV). Sixty-two per cent of BUs roofs are used in blue solutions for strategy level 11, of which twenty-seven per cent are used in solution T 1.5 and thirty-five per cent in solution I 1.5.
Subsequently, based on the preferences of the decision makers, a third exploration concerned the green-blue strategy. This strategy, with reference to the preference of decision makers (Equation (13)), promotes integrated actions to improve the energy efficiency of buses (green roof solution) and to foster the production of energy from renewable sources with the installation of traditional photovoltaic panels or BIPV on BUs roofs. The green-blue strategy has been explored starting from a baseline scenario of zero (state of fact), promoting consistency with the preferences of the decision makers and giving priority to the allocation of green interventions rather than the blue ones.
In total, 12 implementation levels for the green-blue strategy were explored in this case as well.
Strategy 12 is the best from an economic point of view, as it is characterised by the increased use of BUs roofs for blue solutions, but it offers an overall performance in terms of the four criteria that is lower than strategy 9, which is the best regarding the integrated assessment.
The position of the polygon in the four quadrants that supports the identification of the effects of the strategy level on the paired criteria highlights a less symmetrical position of the polygon for the green-blue strategy level 12 compared to level 9, and impacts all criteria at lower intensity, particularly for criteria I (Figure 9).
Level 9 of the green-blue strategy is characterised by a mix of green and blue interventions with 195 interventions of type A1, 124 interventions of type solution B1, 198 interventions of type B2, 68 interventions of type T solution I 1.5, and interventions of type 209 solution I 1.5 (Figure 9). Seventy-four per cent of Bus roofs are used, of which forty-eight per cent are used for green solutions (18% A1, 12% B1, and 18% B2) and twenty-six per cent for blue solutions (6% T 1.5 and 20% I 1.5). Some Bus roofs are used for both green and blue interventions, with a roof utilization index of 1.58%. Twenty-six per cent of Bus roofs remain unused.

6. Discussion

The general objective of promoting the ecological transition of the Borgata district of S. Lucia in order to combat climate change poses several aesthetic, symbolic, functional, and identity issues of the urban landscape in its historic centre overlooking the sea surrounding the island of Ortigia. It also poses technical issues, related to the compatibility of energy efficiency interventions with the green roof system and the production of energy from renewable sources with the installation of photovoltaic panels, and economic issues, concerning the actual feasibility of interventions in a situation that is a priori considered less convenient, especially in the context of a life-cycle assessment [121].
The decision makers have difficulty expressing their preferences, as this process is characterised by uncertainty. This uncertainty is mostly due to the poor ability to divide the overall objective into sub-objectives, but above all to the difficulty of managing a multi-objective problem and a low level of awareness of the effects related to potential scenarios.
At the beginning of this research, when we administered a questionnaire to stakeholders aimed at defining sub-objectives and strategies to support interventions in the historic centre, the answers highlighted different and often contradictory perceptions of the issue. Certainly, from the early stages, the issue of energy efficiency and the production of energy from renewable sources was clear to the stakeholders, but it was not clear how the latter could be implemented in a vulnerable context and characterized by numerous constraints.
The decision makers were aware that some of the objectives identified (Ev, E, I, and L) had a convergent and divergent nature, but for this reason they were unable to manage them simultaneously.
The process was uncertain and characterized by limited rationality. The preference structure of decision makers was uncertain and in some cases contradictory.
Our group began to build the database in Excel over five years ago, and about 15 units worked on it. We had the database and the know-how to build a tool capable of integrating technical, environmental, energy, and economic analyses of interventions in order to support the exploration of sub-objectives and strategies, aimed at reducing uncertainty and helping structure the preferences of decision makers.
Due to the heuristic nature of the process under analysis, we realized that decision makers needed a tool to support the definition of an a priori unknown decision frame that is instrumental to managing a multi-objective process, and we aimed at planning actions capable of jointly maximizing these objectives.
Hence, there is a need to define a tool, such as HPSS, that integrates the classic PSS, developed as a planning support from a strategic perspective; the decision process, from the perspective of heuristic approach; and the GIS.
Module D made it possible to identify, through a process of iteration and subsequent adjustment, the system of weights that best corresponded to the preferences that were gradually identified in the process and to explore the performance of interventions with reference to any n-tuple of objectives, strategies, and their selected levels.
The visualization offered by the module has accompanied decision makers in the long and difficult process of identifying a system of preferences that they might consider acceptable. It helps decision makers to compare the performance of the pairs of criteria in order to highlight and analyse the trade-offs and the convergence between them; compare the performance of the four criteria, with the help of a polygon built on the basis of their assessments, whose size and symmetry with respect to the axes help decision makers to identify the effects and the prevailing direction of them; identify the best level of strategies on the basis of the aggregate score of the criteria assessments and their ranking; and check the allocation of interventions in the neighbourhood.
Based on the partial order of preferences, 12 levels of implementation of the green strategy were primarily explored, because the green objective was perceived as more convergent with that of the identity and urban quality of the landscape. Subsequently, based on the economic assessment, the decision makers chose to explore 12 levels of implementation of the blue strategy, which they considered to be the most cost-effective overall, as evidenced by the results of the evaluation criteria of targeted investments, but less convergent with the objective of preserving the identity and quality of the landscape.
Based on the results obtained from the exploration of green and blue strategies, the decision makers expressed the need to explore an integrated green-blue strategy.
The prospect of a green-blue strategy began to be perceived as the one that could best combine the energy-environmental and economic issues with those of the protection of the identity and quality of the landscape.
The exploration of the 12 levels of the green-blue strategy showed better performance on all criteria considered, with levels of effectiveness in terms of achievement of the highest targets.
Based on the comparison of the rankings of the criteria for the best levels of the green, blue, and green-blue strategies (Figure 10), it is possible to highlight that the latter offers the best performance for all criteria and therefore is preferable to the others.
The decision makers selecting the green-blue strategy as the best ones are aware of having to sacrifice part of the economic profitability offered by the blue one, as well as the fact that it is more profitable than the green one.
They are also aware of the importance of the economic criterion but acknowledge that the others are perhaps more important regarding the issue of ecological transition and the specific reference context, a historic neighbourhood, with all the complexities that derive from it.
Based on the results obtained from the exploration of green, blue, and green-blue strategies, decision makers were able to identify an order of preference with reference to the objectives Ev, E, I, and L (Equation (14)).
I , L E v l h , E l i I , L E v ,   I L ,   I E v ,   L E v ,   I E ,   L E ,   E v E E v l h ,   l h t h r e s h o l d ,   E l i ,   l i t h r e s h o l d max   ( I ,   L )  
They primarily pursue the objective of the protection of the identity and quality of the landscape, and the energy efficiency of BUs and the production of energy from renewable sources is subject to the identification of a certain threshold of theirs that jointly maximizes I and L.
Now that the decision frame is defined, the decision makers are able to define a structure of preference from which it is possible to derive the choice of the interventions aimed at promoting the ecological transition of the neighbourhood of Borgata di S. Lucia.
Further analyses using the HPSS tool can be conducted to identify the project layout for the district with an even better performance. In this regard, other combinations of systems can be explored in addition to grid-connected ones, such as stand-alone systems with accumulation and connected to the network; other installed powers; or a mix of installed power, in addition to 1.5 kw. The decision makers selected this phase in order to optimize the process of ecological transition of the neighbourhood.

7. Conclusions

The issue of climate has posed major and urgent challenges to the global community. Cities in this context are committed on several fronts to rapid adaptation in order to improve their resilience capacity.
In this regard, the ecological transition of cities is a process that will have to be implemented quickly, given the urgency of the underlying issue.
Cities are engaged in several actions aimed at increasing the energy efficiency of buildings, increasing their green infrastructure endowment, and producing energy from renewable sources, in order to meet the target of zero net greenhouse gas emissions by 2050 [23].
Such actions are characterized by different levels of complexity in relation to the specific context in which they are generally and locally implemented in relation to the particularities of the urban fabric involved. The historic centres represent the most vulnerable part of the city, with a reduced capacity for adaptation, but also those denser of interconnected and stratified values that must be protected.
The issue of “transire” (to pass) to a new state with enhanced resilience, for the old town, represents a more challenging task that can be tackled only with the support of specific tools capable of combining multi-dimensional, multi-scale, multi-objective, multi-strategic, multi-layer, multi-stakeholder, and complex values. The HPSS tool developed and proposed in this study combines the classic PSS developed as a support for planning in a strategic perspective with the decision process in the perspective of heuristic approach and the GIS [158,159,160,161].
The HPSS tool responds to the need to encourage the exploration of objectives and strategies in a context such as the operational planning of interventions to mitigate the effects of climate change in the historic centre.
This process is characterised by limited rationality, namely the difficulty of public decision makers to recognize a set of actions that can be considered efficient from the point of view of achieving the objective and therefore known a priori.
The exploratory capacity of the instrument helps to divide the general objective into sub-objectives and identify the trade-offs related to the often divergent nature of the energy-environmental objectives, urban landscape, identity, and economics; it also allows us to measure the aggregate value produced by the specific strategy and by the different levels of the considered strategy and favours the comparison between different strategies.
The tool integrates several evaluation processes, i.e., technical, environmental, economic multicriterial, and instrumental, to facilitate the exploration of objectives and strategies.
The stakeholder group can be extended; indeed, in a subsequent phase of research, we also intend to integrate the local community.
The ecological transition of cities, and especially of historic centres, is a process that can only be implemented with the active involvement of citizens.
The Agenda 2030 with reference to Objective 11 “Sustainable Cities and Communities” promotes the involvement of citizens in the city planning process [20].
The operation of a wide audience of stakeholders can be resolved with the promotion of new forms of partnership, as indicated in Agenda 2030 with reference to Objective 17 “Partnership by Objectives”.
The inclusiveness of the process and the partnership with reference to objectives 11 and 17 of the SDGs are instrumental to pursue goal 13, “Combating climate change”.
In this context, The New Charter of Leipzig also promotes participatory planning and management of cities as well, based on participatory decision-making processes [48,162,163,164,165,166,167] and partnerships between public actors, the public and private sectors, and civil society.
In this perspective, the promotion of the approach of placemaking [168,169] can improve a neighbourhood and a city, as it is capable of capitalizing on the resources, inspiration, and potentials of a local community, translating them into the creation of quality public spaces that contribute to people’s health, happiness, and well-being [170].
Communities can collectively reinvent public spaces and strengthen the connection between people and places, supported by creative models that are capable of integrating physical, cultural, and social that define and their continually evolve a place [171].
The tool proposed in this study is still certainly an instrument that will have to be refined. The database for the historic district of Borgata di S. Lucia was built in different phases of research, in which the quality and richness of information gradually improved.
There is still ample room for improvement of the database, which comprises sections related to calculating the energy needs (Q) and primary energy (PE) for heating; Cooling different types of BUs (building units); LCA for green roofs with intensive greening, for which the data are currently partial; LCA for traditional photovoltaics; and BIPV, for which the data are currently partial.
Other integrations may include exploring other blue solutions, such as district- and block-scale centralized plants or the creation of Energy Communities.
In another research study, we are developing a detailed 3D model of the Borgata of S. Lucia in order to identify the mitigation measures for the Urban Heat Island (UHI) [140].
The results of this research could converge in the database, and other functions could be developed to enrich the proposed tool.
The future development of this research will be aimed at resolving the questions raised above. An in-depth study of the green roof literature with intensive greening will provide a better information framework to improve the proposed tool [172,173].
The proposed HPPS is a tool that can be used to support planning in other contexts, cities, and other historic centres, once integrated into the relevant database.

Author Contributions

Conceptualization, M.R.T.; methodology, M.R.T.; software, M.R.T. and C.C.; validation, M.R.T. and C.C.; formal analysis, M.R.T.; investigation, M.R.T. and C.C.; resources, M.R.T. and C.C.; data curation, M.R.T. and C.C.; writing—original draft preparation, M.R.T.; writing—review and editing, M.R.T.; visualization, M.R.T. and C.C.; supervision, M.R.T.; project administration, M.R.T.; funding acquisition, M.R.T. All authors have read and agreed to the published version of the manuscript.

Funding

This work was financed by the University of Catania in a project entitled “Architettura a Rischio: Demolire, Recuperare, Restaurare. Il tema della qualità nel progetto sul patrimonio—ARDeRe, scientific responsible De Medici S.”, which is part of the general project “Piano della Ricerca Dipartimentale 2020–2022 of the Department of Civil Engineering and Architecture”.

Institutional Review Board Statement

Not applicable.

Informed Consent Statement

Informed consent was obtained from all subjects involved in the study.

Data Availability Statement

Not applicable.

Conflicts of Interest

The authors declare no conflict of interest.

Abbreviations

PSSPlanning Support System
HPSSHeuristic Planning Support System
SDGsSustainable Development Goals
NRRPNational Recovery and Resilience Plan
RRPRecovery and Resilience Plan
BBBuilding Blocks
VFTValue-focused thinking
DCFADiscounted Cash Flow Analysis
LCALife Cycle Assessment
LCCLife Cycle Cost
LCRLife Cycle Revenue
Building Integrated PhotovoltaicBIPV
SCCSocial Cost of Carbon
MACMarginal Cost of Abatement
MAVTMulti-Attribute Value Theory

Appendix A

Appendix A.1. Environmental Assessment

The energy simulation software “DesignBuilder” has been used to model some types of BUs for construction technology, geometric characteristics, and technological solutions in a Mediterranean climate in order to assess the performance and potentials for improvement concerning the greening of the roofs.
DesignBuilder, which provides a graphical interface for the Energy Plus numeric code [174], has been used to assess energy needs (Q) and primary energy (PE) for space heating and cooling.
The air conditioning system was set to operate at a temperature of 19 °C during the heating period (1 December–31 March) and 26 °C during the cooling period (1 June–30 September). Internal gains were considered with reference to an occupation density of 0.05 people/sqm and a lighting and equipment power density of 4.5 W/sqm. Moreover, concerning air quality, an air exchange rate of 0.5 vol/h−1 was used.
The model created in DesignBuilder for a BU in reinforced concrete with standard construction technology and geometric characteristics in the district Borgata di S. Lucia, Syracuse showed a 11.2% reduction in energy demand for the heating period and a 34.2% reduction for the cooling period.
The carbon footprint was calculated only for the extensive green roof intervention. The carbon footprints of the materials were calculated using the unit impact value (in kg CO2 eq/kg of product) obtained from the eco-invent database.
For the intervention of an intensive green roof, the carbon footprint was estimated based on analysis of the literature review [175,176,177,178,179,180,181,182,183,184,185,186,187,188,189,190,191,192,193].
The extensive green roof intervention is characterized by a low additional load, as it does not require any additional structural reinforcement and is therefore particularly suitable for existing building structures. The types of vegetation used are moss, sedum, grass, and succulent plants (foliar area index 5.0/sqm), which are very common plants and are suitable to be used on an extensive green roof in a Mediterranean climate [194].
They are small plants that grow on the ground rather than upwards, providing good roof cover and membrane protection [195].
The substrate consists of a thin layer (10 cm) of porous soil: typically, a mixture of sand, clay, mineral aggregates, and organic matter. The soil is placed above the filtering layer, which is made with a geotextile fabric that filters the soil granules to prevent them from filling up the draining layer [196].
The green roof life cycle is reported in Table A1.
Table A1. Green roof life cycle phases.
Green Roof Life Cycle PhasesCarbon Footprint (kg CO2 eq/m2)
CO2 embodied in green roof29.67
Transportation8.69
Usage 0.18
Carbon sequestration–0.91
Net CO2 equivalent emissions37.63
For the calculation of the carbon footprints of photovoltaic panels, a figure from the literature was taken as reference, i.e., 0.045 kg CO2-eq kwh [197,198,199,200,201,202], which is a partial database, since, between the different stages of the life cycle, it takes into account transport, installation, and operation as data, but in-depth analyses for the estimation of CO2 emissions related to the disposal phase are yet not available.

Appendix A.2. Economic Assessment

The cost-based analysis and revenue-based analysis were conducted for all interventions, namely green roof solution A, B, C, and D and photovoltaic/BIPV.
Costs were taken into account for the calculation of C G : C I is the investment cost, C M is the maintenance cost, C r is the replacement cost, C d m is the cost of dismantling and C d p is the disposal cost (and the related environmental costs of the intervention), and V r was considered zero.
Revenues were considered for the calculation of R G , with energy savings at current unit prices of electricity, and the government incentives calculated as a percentage of the work, with reference to a 50% incentive provided for the renovation of the house [203], as these interventions alone do not fall under the 110% Eco-bonus [204] and the environmental benefits associated with the intervention. Records of C G and R G in the various interventions were created, whose data are expressed in terms of EUR /square metre to facilitate interoperability between the data in the database.
The costs for green roof solutions are A 191.91 EUR/sqm, B 157.68 EUR/sqm, C 181.10 EUR/sqm and D 308.66 EUR/sqm, and for the traditional photovoltaics, 1.5 kw 292.55 EUR/sqm, 3 kw 244.78 EUR/sq m, 6 kw 220.87 EUR/sqm. The costs for BIPV are 1.5 kw 370.92 EUR/sqm, 3 kw 358.52 EUR/sqm, and 6 kw 549.75 EUR/sqm.
The revenues for green roof solutions are A 16.50 EUR/sqm, B 14.28 EUR/sqm, C 17.11 EUR/sqm, and D 17.11 EUR/sqm. The revenues for traditional photovoltaics are 1.5 kw 38.02 EUR/sqm, 3 kw 36.01 EUR/sqm, and 6 kw 34.96 EUR/sqm. The revenues for BIPV are 1.5 kw 33.38 EUR/sqm, 3 kw 32.94 EUR/sqm, and 6 kw 43.15 EUR/sqm.
Based on the data integrated in the database for C G and R G , it is possible to determine all the economic indices [205].
The automatic procedure allows us to calculate the cost-effectiveness also extended to environmental externalities and financial feasibility for each type.

Appendix A.3. Investment Economic Assessment Criteria

  • The net present value ( N P V ) is the sum of the incoming and outgoing cash flows, that is, revenues ( R ) and costs ( C ), over a defined time horizon ( T ), discounted at the discount rate r . NPV is less than, equal to, or more than the (net) future value (FV) if the discount rate ( r ) [206] is more than, equal to, or less than 0; N P V is expected to be significantly positive in the case of a private player:
    N P V = i = 0 T R i C i 1 + r i 0
  • The total rate of return ( T R R ) is the more significant index of profitability and is expressed as the ratio between N P V and the present cost. T R R should be greater than the opportunity cost of capital c k .
    T R R = i = 0 T R i C i 1 + r i i = 0 T C i 1 + r i c k
  • The internal rate of return ( I R R ) is the discount rate r I R R at which N P V = 0 , that is, the maximum rate of return that can be extracted by an investment. It only depends on the distribution of the stream along the time horizon of the investment:
    i = 0 T R i C i 1 + r I R R i = 0
  • The external rate of return (ERR)—also called modified internal rate of return (MIRR)—refers to both the cost of the investment and the interest on the reinvested cash and is calculated based on an interest rate external to the investment at which net (positive) cash flows generated by the investment over its time horizon can be invested or borrowed r * (Minimum Attractive Rate of Return—MARR or hurdle rate). The external rate of return r e * is the rate at which the investment costs discounted at the rate r equal the future value at time T of the positive cash flows ( C F i > 0 ) deferred at the rate r * , given C F i = R i C i . In other words, ERR is the IRR of an ideal investment whose unique cost is the initial investment cost calculated as the NPV at the rate r of the negative cash flows over the time horizon T and whose unique revenue is the future value (at year T) of the positive cash flows at the rate r * . IRR is r e * .
    i = 0 T C F i < 0 1 + r e * i = i = 0 T C F T 1 > 0 1 + r * T i
  • The elasticity ( E r ) is the marginal N P V at the discount rate r :
    E r = δ N P V r N P V r δ r r r
  • The discounted payback period ( D P P ) is the number of years it takes to break even from undertaking the investment cost ( I 0 ) by discounting future cash flows and recognizing the time value of money ( r > 0 ) [207,208]; the higher the discount rate, the longer the D P P . More simply, a payback period ( P P ) can be calculated without taking into account the time preference rate ( r = 0 ) [209]. In general, P P is the ratio between the total investment cost and the annual constant or average cash flow. Often, the variability of the cash flow over the lifetime of the project reduces the reliability of the formulas usually implemented for D P P , so a more general formula can be proposed considering N P V i , and then:
    D P P = i N P V i = 0
  • The average period at the rate r ( P r ) [210,211,212,213] is a sort of time elasticity and can be considered as the average period of deferment of the i t h annual net discounted cash flows ( C F i ) given the discount factor:
    P r = i = 0 T i C F i 1 + r i i = 0 T C F i 1 + r i
The discount rate r is an important indicator of the intertemporal solidarity [214,215,216,217,218,219] practiced with the implementation of the project, and it enables two different and complementary prospects, the private one as the means and the public one as the ends.
Concerning the first one, the discount rate can be assumed to be the well-known weighted average cost of capital ( W A C C ), referring to the funds in terms of debt ( D ) and equity ( E );
W A C C = i d D + i e E D + E
where   i d is the interest rate for debt and i e is the opportunity cost of equity, which respectively, refer to the active and passive interest rates charged to households and consumers, according to the statistics of Bank Italia (2021), set at 4.66% (over 5 years loan life) and 0.12%, assuming a leverage of 50% and W A C C of 2.39%.

References

  1. IPCC. Climate change, economic and social dimensions of climate change. In Contribution of the Working Group III to the Second Assessment Report of the Intergovernmental Panel on Climate Change; Cambridge University Press: Cambridge, UK, 1995. [Google Scholar]
  2. IPCC. Climate Change, Mitigation, Contribution of Working Group III to the Third Assessment Report of the Intergovernmental Panel on Climate Change; Cambridge University Press: Cambridge, UK, 2001. [Google Scholar]
  3. IPCC. Climate Change, Mitigation, Contribution of Working Group III to the Fourth Assessment Report of the Intergovernmental Panel on Climate Change; Cambridge University Press: Cambridge, UK, 2007. [Google Scholar]
  4. IPCC. Contribution of working group I to the fifth assessment report of the intergovernmental panel on climate change. In Climate Change 2013: The Physical Science Basis; Stocker, T.F., Qin, D., Plattner, G.K., Tignor, M., Allen, S.K., Boschung, J., Nauels, A., Xia, Y., Bex, V., Midgley, P.M., Eds.; Cambridge University Press: Cambridge, UK; New York, NY, USA, 2013. [Google Scholar]
  5. IPCC. Climate Change 2014: Mitigation, Contribution of Working Group III to the Fifth Assessment Report of the Intergovernmental Panel on Climate Change; Cambridge University Press: Cambridge, UK, 2014. [Google Scholar]
  6. EEA. Climate Change, Impacts and Vulnerability in Europe 2012; EEA: Copenhagen, Denmark, 2012. [Google Scholar]
  7. Europe Commission. The EU Strategy on Adaptation to Climate Change. 2018. Available online: https.//ec.europa.eu/clima/policies/adaptation/what_en (accessed on 20 August 2021).
  8. World Resources Institute. From Planning to Action: Mainstreaming Climate Change Adaptation Into Development. 2018. Available online: https://www.wri.org/research/planning-action-mainstreaming-climate-change-adaptation-development (accessed on 20 August 2021).
  9. UN Habitat. CityRAP Tool-City Resilience: Action Planning Tool. 2018. Available online: https.//unhabitat.org/city-resilience-action-planning-tool-cityrap (accessed on 20 August 2021).
  10. C40 Cities. Climate Action Planning Framework. 2017. Available online: https://unfccc.int/sites/default/files/resource/53_C40_Talanoa_submission_March%2029.pdf (accessed on 20 August 2021).
  11. IISD. Building a Climate Resilient City. 2017. Available online: https://www.iisd.org/projects/building-climate-resilient-city (accessed on 20 August 2021).
  12. C40 Cities. Integrating Climate Adaptation Toolkit. 2020. Available online: https://city2city.network/integrating-climate-adaptation-toolkit-urban-planners-and-adaptation-practitioners (accessed on 20 August 2021).
  13. ASEAN. Guidebook for Urban Resilience. 2018. Available online: https://aurf.ahacentre.org/index.php?option=com_content&view=article&id=105&Itemid=567 (accessed on 20 August 2021).
  14. UN Habitat. Planning for Climate Change: A Strategic, Values-Based Approach For Urban Planners. 2014. Available online: https://unhabitat.org/planning-for-climate-change-a-strategic-values-based-approach-for-urban-planners (accessed on 20 August 2021).
  15. European Commission. The European Green Deal, COM (2019) 640 Final, Brussels. 2019. Available online: https://ec.europa.eu/info/strategy/priorities-2019-2024/european-green-deal_en (accessed on 2 April 2021).
  16. World Commission on Environment and Development: Our Common Future. 1987. Available online: http://sustainabledevelopment.un.org/content/documents/5987our-common-future.pdf (accessed on 2 April 2021).
  17. United Nations Framework Convention on Climate Change: Rio de Janeiro, Brazil. 1992. Available online: https://unfccc.int/resource/docs/convkp/conveng.pdf (accessed on 2 April 2021).
  18. UNFCCC. Kyoto Agreement, 1997, Kyoto. Available online: https://www.unfccc.int/resource/docs/convkp/kpeng.pdf (accessed on 2 April 2021).
  19. United Nations. Resolution Adopted by the General Assembly on 27 July 2012, Brazil. 2012. Available online: http://www.un.org/en/development/desa/population/migration/generalassembly/docs/globalcompact/A_RES_66_288.pdf (accessed on 2 April 2021).
  20. United Nations. The 2030 Agenda for Sustainable Development. 2015. Available online: http://sdps.un.org/goals. (accessed on 2 April 2021).
  21. United Nations. Millennium Development Goals, New York. 2015. Available online: https://www.un.org/millenniumgoals/2015_MDG_Report/pdf/MDG%202015%20rev%20(July%201).pdf (accessed on 2 April 2021).
  22. UNFCCC. Paris Agreement, 12 December 2015, Paris. Available online: https://www.unfccc.int/sites/default/files/english_paris_agreement.pdf (accessed on 2 April 2021).
  23. European Council. European Green Deal. Available online: https://www.consilium.europa.eu/en/policies/green-deal/ (accessed on 2 April 2021).
  24. European Semester Autumn Package: Creating an Economy That Works for People and the Planet. Available online: http://www.ec.europa.eu (accessed on 2 April 2021).
  25. Mangialardo, A.; Micelli, E. Reconstruction or reuse? How real estate values and planning choices impact urban redevelopment. Sustainability 2020, 12, 4060. [Google Scholar] [CrossRef]
  26. European Commision. Building and Renovating in an Energy and Resource Efficient Way. Available online: https://ec.europa.eu/info/sites/default/files/research_and_innovation/green_deal/gdc_stakeholder_engagement_topic_04-1_buildings.pdf (accessed on 2 April 2021).
  27. Robert, S.; Machado, M. Horizon 2020-Green Deal Call: Day 2 Area 4: Energy and Resource Efficient Buildings. Available online: https://ec.europa.eu/info/sites/default/files/research_and_innovation/events/presentations/area4_topic_4.1_energy_and_resource_efficient_buildings.pdf (accessed on 2 April 2021).
  28. Napoli, G.; Barbaro, S.; Giuffrida, S.; Trovato, M.R. The European green deal: New challenges for the economic feasibility of energy retrofit at district scale. In New Metropolitan Perspectives, Proceedings of the NMP 2020, Smart Innovation, Systems and Technologies, Online, 26–28 May 2020; Bevilacqua, C., Calabrò, F., Della Spina, L., Eds.; Springer: Cham, Switzerland, 2021; Volume 178, pp. 1248–1258. [Google Scholar] [CrossRef]
  29. European Commission. Report from the Commission to the European Parliament and the Council; Semi-annual report on the execution of the Next Generation EU funding operations pursuant to Article 12 of Commission Implementing Decision C(2021)2502, June–December 2021; European Commission: Brussels, Belgium, 20 December 2022. [Google Scholar]
  30. Bicknell, J.; Dodman, D.; Satterthwaite, D. Adapting Cities to Climate Change: Understanding and Addressing the Development Challenges; Earthscan: London, UK, 2009. [Google Scholar]
  31. Cannon, T.; Müller, D. Vulnerability, resilience and development discourses in context of climate change. Nat. Hazards 2010, 55, 621–635. [Google Scholar] [CrossRef]
  32. Comfort, L.K.; Boin, A.; Demchak, C.C. Designing Resilience: Preparing for Extreme Events; University of Pittsburgh Press: Pittsburgh, PA, USA, 2010. [Google Scholar]
  33. Trovato, M.R. A multi-criteria approach to support the retraining plan of the Biancavilla’s old town. In 3rd International New Metropolitan Perspectives, Proceedings of the International Symposium on New Metropolitan Perspectives, Reggio Calabria, Italy, 22–25 May 2018; Smart Innovation, Systems and Technologies; Bevilacqua, C., Calabro, F., Della Spina, L., Eds.; Springer: Cham, Switzerland, 2019; Volume 101, pp. 434–441. [Google Scholar] [CrossRef]
  34. Davoudi, S.; Crawford, J.; Mehmood, A. Planning for Climate Change: Strategies for Mitigation and Adaptation for Spatial Planners; Earthscan: London, UK, 2010. [Google Scholar]
  35. European Environment Agency. Urban Adaptation to Climate Change in Europe: Challenges and Opportunities for Cities Together with Supportive National and European Policies; European Environment Agency: Copenhagen, Denmark, 2012. [Google Scholar]
  36. Giannelli, A.; Giuffrida, S.; Trovato, M.R. Madrid Rio Park. Symbolic Values and Contingent Valuation. Valori e Valutazioni 2018, 21, 75–85. [Google Scholar]
  37. German Stadtklimalotse/City Climate Guide [WWW Document]. 2012. Climate Change-Proof Urban Development-Tackling Causes and Effects of Climate Change by Urban Concepts. Available online: www.stadtklimalotse.net/ (accessed on 2 April 2021).
  38. Givoni, B. Climate Considerations in Building and Urban Design; Wiley: Hoboken, NJ, USA, 1998. [Google Scholar]
  39. Prigogine, I.; Nicolis, G. Self-Organization in Non-Equilibrium Systems; Wiley: Hoboken, NJ, USA, 1977. [Google Scholar]
  40. Glansdorff, P.; Prigogine, I. Thermodynamics Theory of Structure, Stability and Fluctuations; J. Willey & Sons: New York, NY, USA; London, UK, 1971. [Google Scholar]
  41. Giuffrida, S.; Trovato, M.R.; Falzone, M. The information value for territorial and economic sustainability in the enhancement of the water management process. In Computational Science and Its Applications–ICCSA 2017, Proceedings of the ICCSA 2017, Trieste, Italy, 3–6 July 2017; Lecture Notes in Computer Science; Borruso, G., Cuzzocrea, A., Apduhan, B.O., Rocha, A.M.A.C., Taniar, D., Misra, S., Gervasi, O., Torre, C.M., Stankova, E., Murgante, B., Eds.; Springer: Cham, Switzerland, 2017; Volume 10406, pp. 575–590. [Google Scholar] [CrossRef]
  42. Giuffrida, S.; Ferluga, G.; Valenti, A. Capitalisation rates and ‘real estate semantic chains’: An application of clustering analysis. Int. J. Bus. Intell. Data Min. 2015, 10, 174–198. [Google Scholar] [CrossRef]
  43. Della Spina, L.; Giorno, C.; Galati Casmiro, R. An integrated decision support system to define the best scenario for the adaptive sustainable re-use of cultural heritage in Southern Italy. In New Metropolitan Perspectives; Bevilacqua, C., Calabrò, F., Della Spina, L., Eds.; NMP 2020. Smart Innovation Systems and Technologies; Springer: Cham, Switzerland, 2020; Volume 177. [Google Scholar] [CrossRef]
  44. Della Spina, L. Cultural Heritage: A Hybrid Framework for Ranking Adaptive Reuse Strategies. Buildings 2021, 11, 132. [Google Scholar] [CrossRef]
  45. Trovato, M.R.; Giuffrida, S. The choice problem of the urban performances to support the Pachino’s redevelopment plan. Int. J. Bus. Intell. Data Min. 2014, 9, 330–355. [Google Scholar] [CrossRef]
  46. Trovato, M.R.; Micalizzi, P.; Giuffrida, S. Assessment of landscape co-benefits in natura 2000 site management plans. Sustainability 2021, 13, 5707. [Google Scholar] [CrossRef]
  47. Harris, R.; Batty, M. Locational models, geographic information and planning support systems. J. Plan. Educ. Res. 1993, 12, 184–198. [Google Scholar] [CrossRef] [Green Version]
  48. Keeney, R.L. Value-Focused Thinking. A Path to Creative Decision Making; Harvard University Press: Cambridge, MA, USA, 1993; Volume 2. [Google Scholar]
  49. Giuffrida, S.; Gagliano, F.; Giannitrapani, E.; Marisca, C.; Napoli, G.; Trovato, M.R. Promoting Research and Landscape Experience in the Management of the Archaeological Networks. A Project-Valuation Experiment in Italy. Sustainability 2020, 12, 4022. [Google Scholar] [CrossRef]
  50. Napoli, G.; Giuffrida, S.; Trovato, M.R. A paradigm interpreting the city and the analytic network process for the management of urban transformations. In 3rd International New Metropolitan Perspectives, Proceedings of the International Symposium on New Metropolitan Perspectives, Reggio Calabria, Italy, 22–25 May 2018; Bevilacqua, C., Calabrò, F., Della Spina, L., Eds.; Springer Science and Business Media Deutschland GmbH: Cham, Switzerland, 2019; Volume 100, pp. 672–680. [Google Scholar] [CrossRef] [Green Version]
  51. Trovato, M.R. Human Capital Approach in the Economic Assessment of Interventions for the Reduction of Seismic Vulnerability in Historic Centre. Sustainability 2020, 12, 8059. [Google Scholar] [CrossRef]
  52. Gabrielli, L.; Giuffrida, S.; Trovato, M.R. Real estate landscapes and the historic city: On how looking inside the market. In 3rd International New Metropolitan Perspectives, Proceedings of the International Symposium on New Metropolitan Perspectives, Reggio Calabria, Italy, 22–25 May 2018; Smart Innovation, Systems and Technologies; Bevilacqua, C., Calabro, F., Della Spina, L., Eds.; Springer: Cham, Switzerland, 2019; Volume 101, pp. 269–276. [Google Scholar] [CrossRef]
  53. Giuffrida, S. The grammar of the house and of the city. Theoretical approaches for generating project. Valori e Valutazioni 2019, 23, 65–75. [Google Scholar]
  54. Giuffrida, S. The true value. on understanding something. In Appraisal: From Theory to Practice. Green Energy and Technology; Stanghellini, S., Morano, P., Bottero, M., Oppio, A., Eds.; Springer: Cham, Switzerland, 2017. [Google Scholar] [CrossRef]
  55. Napoli, G.; Giuffrida, S.; Trovato, M.R. Fair planning and affordability housing in urban policy. In The Case of Syracuse (Italy), Proceedings of the ICCSA 2016, Beijing, China, 4–7 July 2016; LNCS 9789; Gervasi, O., Apduhan, B.O., Taniar, D., Torre, C.M., Wang, S., Misra, S., Murgante, B., Stankova, E., Rocha, A.M.A.C., Eds.; Springer International Publishing: Cham, Switzerland, 2016; pp. 46–62. [Google Scholar] [CrossRef]
  56. Trovato, M.R. An Axiology of Residual Green Urban Areas. Environments 2021, 8, 53. [Google Scholar] [CrossRef]
  57. Musolino, M.; Malerba, A.; De Paola, P.; Musarella, C.M. Building Efficiency Adopting Ecological Materials and Bio Architecture Techniques. ArcHistoR 2019, 6, 1–10. [Google Scholar]
  58. Malerba, A.; Massimo, D.E.; Musolino, M.; Nicoletti, F.; De Paola, P. Post carbon city: Building valuation and energy performance simulation programs. In New Metropolitan Perspectives: Local Knowledge and Innovation; Series: Smart Innovation, Systems and Technologies; Calabrò, F., Della Spina, L., Bevilacqua, C., Eds.; Springer: Berlin/Heidelberg, Germany, 2019; Volume 101, pp. 513–531. [Google Scholar] [CrossRef]
  59. Gill, S.E.; Handley, J.F.; Ennos, A.R.; Pauleit, S. Adapting cities for climate change: The role of the green infrastructure. Built Environ. 2007, 33, 115–133. [Google Scholar] [CrossRef] [Green Version]
  60. Voskamp, I.M. Composing Sets of Blue-Green Measures to Reduce Urban Vulnerability to Climate Change. An Integrated Approach to Pluvial Flooding, Heat Stress and Drought; Wageningen University: Wageningen, The Netherlands, 2013; pp. 1–98. [Google Scholar]
  61. Gagliano, A.; Giuffrida, S.; Nocera, F.; Detommaso, M. Energy efficient measure to upgrade a multistory residential in a nZEB. AIMS Energy 2017, 5, 601–624. [Google Scholar] [CrossRef]
  62. Della Spina, L. Multidimensional Assessment for Culture-Led and Community-Driven Urban Regeneration as Driver for Trigger Economic Vitality in Urban Historic Centers. Sustainability 2019, 11, 7237. [Google Scholar] [CrossRef] [Green Version]
  63. Della Spina, L.; Giorno, C.; Galati Casmiro, R. Bottom-Up processes for culture-led urban regeneration scenarios. In Computational Science and Its Applications, Proceedings of the ICCSA 2019, Saint Petersburg, Russia, 1–4 July 2019; Lecture Notes in Computer Science; Misra, S., Gervasi, O., Murgante, B., Stankova, E., Korkhov, V., Torre, C., Rocha, A.M.A.C., Taniar, D., Apduhan, B.O., Tarantino, E., Eds.; Springer: Cham, Switzerland, 2019; Volume 11622, pp. 93–107. [Google Scholar] [CrossRef]
  64. Cellura, M.; Cusenza, M.A.; Longo, S. Energy-related GHG emissions balances: IPCC versus LCA. Sci. Total Environ. 2018, 628, 1328–1339. [Google Scholar] [CrossRef]
  65. Napoli, G.; Mamì, A.; Barbaro, S.; Lupo, S. Scenarios of climatic resilience, economic feasibility and environmental sustainability for the refurbishment of the early 20th century buildings. In Values and Functions for Future Cities, Green Energy and Technology; Mondini, G., Stanghellini, S., Oppio, A., Bottero, M., Abastante, F., Eds.; Springer: Berlin/Heidelberg, Germany, 2019; pp. 89–115. ISBN 978-3-03023784-4. ISSN 1865-3529. [Google Scholar] [CrossRef]
  66. Nocera, F.; Giuffrida, S.; Trovato, M.R.; Gagliano, A. Energy and New Economic Approach for Nearly Zero Energy Hotels. Entropy 2019, 21, 639. [Google Scholar] [CrossRef] [Green Version]
  67. Giuffrida, S.; Gagliano, F.; Nocera, F.; Trovato, M.R. Landscape assessment and Economic Accounting in wind farm Programming: Two Cases in Sicily. Land 2018, 7, 120. [Google Scholar] [CrossRef] [Green Version]
  68. Nasca, L.; Giuffrida, S.; Trovato, M.R. Value and Quality in the Dialectics between Human and Urban Capital of the City Networks on the Land District Scale. Land 2022, 11, 34. [Google Scholar] [CrossRef]
  69. Napoli, G.; Corrao, R.; Scaccianoce, G.; Barbaro, S.; Cirrinclone, L. Public and Private Economic Feasibility of Green Areas as a Passive Energy Measure: A Case Study in the Mediterranean City of Trapani in Southern Italy. Sustainability 2022, 14, 2407. [Google Scholar] [CrossRef]
  70. Geertman, S.; Stillwell, J. Planning Support Systems: Best Practice and New Methods; The GeoJournal Library; Springer: Dordrecht, The Netherlands, 2009; Volume 95, pp. 1–26. [Google Scholar] [CrossRef]
  71. Batty, M. Planning support systems and the new logic of computation. Reg. Dev. Dialogue 1995, 16, 1–17. [Google Scholar]
  72. Klosterman, R. Planning support systems: A new perspective on computer-aided planning. J. Plan. Educ. Res. 1997, 17, 45–54. [Google Scholar] [CrossRef]
  73. Clarke, M. Geographical information systems and model-based analysis: Towards effective decision support systems. In Geographical Information Systems for Urban and Regional Planning; Scholten, H., Stillwell, J., Eds.; Kluwer: Dordrecht, The Netherlands, 1990; pp. 165–175. [Google Scholar]
  74. Trovato, M.R.; Giuffrida, S. A DSS to Assess and Manage the Urban Performances in the Regeneration Plan: The Case Study of Pachino. In International Conference on Computational Science and Its Applications, Proceedings of the ICCSA 2014, Guimarães, Portugal, 30 June–3 July 2014; Murgante, B., Misra, S., Rocha, A.M.A.C., Torre, C.M., Rocha, J.G., Falcão, M.I., Taniar, D., Apduhan, B.O., Gervasi, O., Eds.; Springer: Cham, Switzerland, 2014; Volume 8581, pp. 224–239. [Google Scholar] [CrossRef]
  75. Della Spina, L. Strategic Planning and Decision Making: A Case Study for the Integrated Management of Cultural Heritage Assets in Southern Italy. In New Metropolitan Perspectives, Proceedings of the NMP 2020, Online, 26–28 May 2020; Smart Innovation, Systems and Technologies; Bevilacqua, C., Calabrò, F., Della Spina, L., Eds.; Springer: Cham, Switzerland, 2021; Volume 178. [Google Scholar] [CrossRef]
  76. Klosterman, R. "The What If? Planning Support System". In Planning Support Systems, Integrating Geographic Information Systems, Models and Visualization Tools; Brail, R., Klosterman, R., Eds.; ESRI Press: Redlands, CA, USA, 2001; pp. 263–284. [Google Scholar]
  77. Giuffrida, S.; Casamassima, G.; Trovato, M.R. Le norme EMAS-ISO nella valutazione della qualità del servizio idrico integrato. Aestimum 2017, 70, 109–134. [Google Scholar] [CrossRef]
  78. Giuffrida, S.; Trovato, M.R. A semiotic approach to the landscape accounting and assessment. An application to the urban-coastal areas. In Proceedings of the 8th International Conference on Information and Communication Technologies in Agriculture, Food and Environment, HAICTA 2017, Chania, Crete Island, Greece, 21–24 September 2017; Salampasis, M., Theodoridis, A., Bournaris, T., Eds.; CEUR Workshop Proceedings: Aachen, Germany, 2017; pp. 696–708. [Google Scholar]
  79. Giuffrida, S.; Trovato, M.R.A. Semiotic-Sociological textures of landscape values. Assessments in urban-coastal areas. In Information and Communication Technologies in Modern Agricultural Development, Proceedings of the HAICTA 2017, Chania, Crete, Greece, 21–24 September 2017; Communications in Computer and Information Science; Salampasis, M., Bournaris, T., Eds.; Springer: Cham, Switzerland, 2019; Volume 953, pp. 35–50. [Google Scholar] [CrossRef]
  80. Giuffrida, S.; Trovato, M.R. From the object to land. Architectural design and economic valuation in the multiple dimensions of the industrial estates. In Computational Science and Its Applications, Proceedings of the ICCSA 2017, Trieste, Italy, 3–6 July 2017; Lecture Notes in Computer Science; Borruso, G., Cuzzocrea, A., Apduhan, B.O., Rocha, A.M.A.C., Taniar, D., Misra, S., Gervasi, O., Torre, C.M., Stankova, E., Murgante, B., Eds.; Springer: Cham, Switzerland, 2017; Volume 10406, pp. 591–606. [Google Scholar] [CrossRef]
  81. Klosterman, R.E. Guest editorial: New perspectives on planning support systems. Environ. Plan. B 1999, 26, 317–320. [Google Scholar] [CrossRef]
  82. Brail, R.; Klosterman, R. Planning Support Systems, Integrating Geographic Information Systems, Models and Visualization Tools; ESRI Press: Redlands, CA, USA, 2001. [Google Scholar]
  83. Geertman, S.; Stillwell, J. Planning Support Systems in Practice; Springer: Berlin/Heidelberg, Germany, 2003. [Google Scholar]
  84. Batty, M. Virtual London. In An Introduction to Geographical Information Systems; Heywood, I., Cornelius, S., Carver, S., Eds.; Pearson Educational, Prentice Hall: Harlow, UK, 2010; pp. 269–271. [Google Scholar]
  85. Dell’Ovo, M.; Oppio, A. Bringing the Value-Focused Thinking approach to urban development and design processes: The case of Foz do Tua area in Portugal. Valori e Valutazioni 2019, 23, 91–106. [Google Scholar]
  86. Khakee, A. New Principles in Planning Evaluation; Ashgate Publishing, Ltd: Farnham, UK, 2008. [Google Scholar]
  87. Khakee, A. Evaluation and planning: Inseparable concepts. Town Plan. Rev. 1998, 69, 35. [Google Scholar] [CrossRef]
  88. Keller, L.R.; Ho, J.L. Decision problem structuring: Generating options. IEEE Trans. Syst. Man Cybern. 1998, 18, 715–728. [Google Scholar] [CrossRef]
  89. Simon, H.A. Rational choice and the structure of environments. Psychol. Rev. 1956, 63, 129–138. [Google Scholar] [CrossRef] [Green Version]
  90. Simon, H.A. Models of Bounded Rationality; MIT Press: Cambridge, MA, USA, 1982. [Google Scholar]
  91. Simon, H.A. Invariants of human behavior. Annu. Rev. Psychol. 1990, 42, 1–19. [Google Scholar] [CrossRef]
  92. Gigerenzer, G.; Czerlinski, J.; Martignon, L. How good are fast and frugal heuristics. In Decision Science and Technology; Shanteau, J., Mellers, B.S., Schum, D.A., Eds.; Springer: Boston, MA, USA, 1999. [Google Scholar]
  93. Gigerenzer, G.; Selten, R. Bounded Rationality: The Adaptive Toolbox; The MIT Press: Cambridge, MA, USA, 2001. [Google Scholar]
  94. Gigerenzer, G.; Gaissmaier, W. Heuristic decision making. Annu. Rev. Psychol. 2011, 62, 451–482. [Google Scholar] [CrossRef] [PubMed] [Green Version]
  95. Von Helversen, B.; Rieskamp, J. The mapping model: A cognitive theory of quantitative estimation. J. Exp. Psychol. Gen. 2008, 137, 73. [Google Scholar] [CrossRef] [PubMed] [Green Version]
  96. Brusovansky, M.; Glickman, M.; Usher, M. Fast and effective: Intuitive processes in complex decisions. Psychon. Bull. Rev. 2018, 25, 1542–1548. [Google Scholar] [CrossRef] [PubMed]
  97. Hafenbrädl, S.; Waeger, D.; Marewski, J.N.; Gigerenzer, G. Applied decision making with fast-and-frugal heuristics. J. Appl. Res. Mem. Cogn. 2016, 5, 215–231. [Google Scholar] [CrossRef] [Green Version]
  98. Demiguel, V.; Garlappi, L.; Uppal, R. Optimal versus naive diversification: How inef-ficient is the 1/N portfolio strategy? Rev. Financ. Stud. 2009, 22, 1915–1953. [Google Scholar] [CrossRef] [Green Version]
  99. Katsikopoulos, K.V.; Martignon, L. Naïve heuristics for paired comparisons: Some results on their relative accuracy. J. Math. Psychol. 2006, 50, 488–494. [Google Scholar] [CrossRef]
  100. Thunholm, P. Decision Making under Time Pressure: To Evaluate or Not to Evaluate Three Options before the Decision Is Made. Military Decision Making and Planning: Towards a New Prescriptive Model. Ph.D. Thesis, Akademitryck Edsbruk, Stockholm University, Stockholm, Sweden, 2003. [Google Scholar]
  101. Methling, F.; Abdeen, S.J.M.; Nitzsch, R. Heuristics in multi-criteria decision-making: The cost of fast and frugal decisions. EURO J. Decis. Process. 2022, 10, 100013. [Google Scholar] [CrossRef]
  102. Karaliopoulos, M.; Katsikopoulos, K.; Lambrinos, L. Bounded rationality can make parking search more efficient: The power of lexicographic heuristics. Transp. Res. Part B 2017, 101, 28–50. [Google Scholar] [CrossRef] [Green Version]
  103. Siade, A.J.; Rathi, B.; Prommer, H.; Welter, D.; Doherty, J. Using heuristic multi-objective optimization for quantifying predictive uncertainty associated with groundwater flow and reactive transport models. J. Hydrol. 2019, 577, 123999. [Google Scholar] [CrossRef]
  104. Pandalai, S.P.; Schulte, P.A.; Miller, D.B. Conceptual heuristic models of the interrelationships between obesity and the occupational environment. Scand. J. Work Environ. Health 2013, 39, 221–232. [Google Scholar] [CrossRef] [Green Version]
  105. Chang, W.; Lo, Y.; Hong, Y. A Heuristic Model of Network-Based Group Decision Making for E-Services. In Proceedings of the 2009 Sixth International Conference on Information Technology: New Generations; 2009; pp. 326–331. [Google Scholar] [CrossRef]
  106. Nunes, M.; Abreu, A.; Bagnjuk, J.; D’Onfrio, V.; Saraiva, C. A heuristic model to identify organizational collaborative critical success factors (CSFs). In Proceedings of the 2021 International Young Engineers Forum (YEF-ECE), Online, 9 July 2021; pp. 63–68. [Google Scholar] [CrossRef]
  107. Keeney, R.L. Value-focused thinking: Identifying decision opportunities and creating alternatives. Eur. J. Oper. Res. 1996, 92, 537–549. [Google Scholar] [CrossRef]
  108. Keeney, R.L. Applying Value-Focused Thinking. Mil. Oper. Res. 2008, 13, 6–17. [Google Scholar] [CrossRef]
  109. Schuman, S.P.; Rohrbaugh, J. Decision conferencing for systems planning. Inf. Manag. 1991, 21, 147–159. [Google Scholar] [CrossRef]
  110. Phillips, L.; Bana e Costa, C.A. Transparent priorisation, budgeting and resource allocation with multi-criteria decision analysis and decision conferencing. Ann. Oper. Res. 2007, 154, 51–68. [Google Scholar] [CrossRef] [Green Version]
  111. Phillips, L.D. Decision Conferencing; Working Paper LSEOR 06.85; London School of Economics and Political Science: London, UK, 2006. [Google Scholar]
  112. Ministero per i Beni e le Attività Culturali. Linee di Indirizzo per il Miglioramento Dell’efficienza Energetica nel Patrimonio Culturale. Architettura, Centri e Nuclei Storici ed Urbani, 4 November 2015. Available online: https://storico.beniculturali.it/mibac/export/MiBAC/sito-MiBAC/Contenuti/MibacUnif/Comunicati/visualizza_asset.html_345420287.html (accessed on 2 April 2021).
  113. Regreen. Energia Che Rende. Available online: https://www.regreen.it/Sicilia/Siracusa/producibilita_photovoltaics (accessed on 2 April 2021).
  114. HEMERA. Sotto l’energia, Tutto in Torno la Bellezza. Available online: https://www.infobuildenergia.it/Allegati/2773.pdf (accessed on 2 April 2021).
  115. Design Builder—Energy Simulation Software, Version 3. Available online: http://designbuilder.co.uk (accessed on 2 April 2021).
  116. Nässén, J.; Holmberg, J.; Wadeskog, A.; Nyman, M. Direct and indirect energy use and carbon emissions in the production phase of buildings: An input–output analysis. Energy 2007, 32, 1593–1602. [Google Scholar] [CrossRef]
  117. Upton, B.; Miner, R.; Spinney, M.; Heath, L.S. The greenhouse gas and energy impacts of using wood instead of alternatives in residential construction in the United States. Biomass Bioenergy 2008, 32, 1–10. [Google Scholar] [CrossRef]
  118. LCA-Calculator. Available online: https://www.lcacalculator.com (accessed on 2 April 2021).
  119. Cellura, M.; Longo, S.; Montana, F.; Sanseverino, E.R. Multi-Objective Building Envelope Optimization through a Life Cycle Assessment Approach. In Proceedings of the 2019 IEEE International Conference on Environment and Electrical Engineering and 2019 IEEE Industrial and Commercial Power Systems Europe (EEEIC/I and CPS Europe), Genova, Italy, 11–14 June 2019; p. 8783807. [Google Scholar] [CrossRef]
  120. Giuffrida, S.; Trovato, M.R.; Circo, C.; Ventura, V.; Giuffrè, M.; Macca, V. Seismic Vulnerability and Old Towns. A Cost-Based Programming Model. Geosciences 2019, 9, 427. [Google Scholar] [CrossRef] [Green Version]
  121. Trovato, M.R.; Nocera, F.; Giuffrida, S. Life-Cycle Assessment and Monetary Measurements for the Carbon Footprint Reduction of Public Buildings. Sustainability 2020, 12, 3460. [Google Scholar] [CrossRef] [Green Version]
  122. Moore, F.C.; Diaz, D. Temperature impacts on economic growth warrant stringent mitigation policy. Nat. Clim. Chang. 2015, 5, 127–131. [Google Scholar] [CrossRef]
  123. Diaz, D.; Moore, F. Quantifying the economic risks of climate change. Nat. Clim. Chang. 2017, 7, 774–782. [Google Scholar] [CrossRef]
  124. Kesickia, F. Marginal Abatement Cost Curves for Policy Making–Expert-Based vs. Model-Derived Curves; Ucl Energy Institute: London, UK, 2011. [Google Scholar]
  125. Interagency Working Group on Social Cost of Greenhouse Gases. United States Government Technical Support Document: Technical Update of the Social Cost of Carbon for Regulatory Impact Analysis—Under Executive Order 12866; Interagency Working Group on Social Cost of Greenhouse Gases: Washington, DC, USA, 2016. [Google Scholar]
  126. Nordhaus, W. Revisiting the social cost of carbon. Proc. Natl. Acad. Sci. USA 2017, 114, 1518–1523. [Google Scholar] [CrossRef] [PubMed] [Green Version]
  127. Giuffrida, S.; Ventura, V.; Nocera, F.; Trovato, M.R.; Gagliano, F. Technological, axiological and praxeological coordination in the energy-environmental equalization of the strategic old town renovation programs. In Values and Functions for Future Cities; Mondini, G., Oppio, A., Stanghellini, S., Bottero, M., Abastante, F., Eds.; Springer Nature Switzerland AG: Cham, Switzerland, 2020; pp. 425–446. ISBN 978-3-030-23786-8. [Google Scholar] [CrossRef]
  128. Smith, S.; Braathen, N.A. Monetary Carbon Values in Policy Appraisal. An Overview of Current Practice and Key Issues; OECD: Paris, France, 2015; Volume 92. [Google Scholar]
  129. Ricke, K.; Drouet, L.; Caldeira, K.; Tavoni, M. Country-level social cost of carbon. Nat. Clim. Chang. 2018, 8, 895–900. [Google Scholar] [CrossRef]
  130. EIEA. CO2 Emission from Fuel Combustion—Highlights; EIEA: Amsterdam, The Netherlands, 2019. [Google Scholar]
  131. Commissione Europea. Guide to Cost-Benefit Analysis of Investment Projects. Economic Appraisal Toolfor Cohesion Policy 2014–2020. 2015. Available online: http://ec.europa.eu/regional_policy/sources/docgener/studies/pdf/cba_guide.pdf (accessed on 19 December 2014).
  132. Naselli, F.; Trovato, M.R.; Castello, G. An evaluation model for the actions in supporting of the environmental and landscaping rehabilitation of the Pasquasia’s site mining (EN). In Computational Science and Its Applications-ICCSA 2014, Proceedings of the ICCSA 2014, Guimaraes, Portugal, 30 June–3 July 2014; Murgante, B., Misra, S., Rocha, A.M.A.C., Torre, C.M., Rocha, J.G., Falcão, M.I., Taniar, D., Apduhan, B.O., Gervasi, O., Eds.; Springer International Publishing: Cham, Switzerland, 2014; Volume 8581, pp. 26–41. [Google Scholar] [CrossRef]
  133. Trovato, M.R.; Giuffrida, S. The Monetary Measurement of Flood Damage and the Valuation of the Proactive Policies in Sicily. Geosciences 2018, 8, 141. [Google Scholar] [CrossRef] [Green Version]
  134. Fregonara, E. Valutazione Sostenibilità Progetto. In Life Cycle Thinking e Indirizzi Internazionali; Ricerche di Tecnologia dell’Architettura; Franco Angeli: Milan, Italy, 2016. [Google Scholar]
  135. Glunch, P.; Baumann, H. The life cycle costing (LCC) approach: A conceptual discussion of its usefulness for environmental decision-making. Build. Environ. 2004, 39, 571–580. [Google Scholar] [CrossRef] [Green Version]
  136. Manganelli, B.; Morano, P.; Tajani, F.; Salvo, F. Affordability assessment of energy-efficient building construction in Italy. Sustainability 2019, 11, 249. [Google Scholar] [CrossRef] [Green Version]
  137. Fregonara, E.; Giordano, R.; Ferrando, D.G.; Pattono, S. Indicatori economico-ambientali a sostegno delle decisioni di investimento: Un focus sulla fase di fine vita degli edifici. Edifici 2017, 7, 65. [Google Scholar]
  138. ISO 15686-5, Building and Constructed Assets–Service-Life Planning–Part 5: Life Cycle Costing, ISO/TC 59/ CS 14. 2008. Available online: https://www.iso.org/standard/39070.html (accessed on 2 April 2021).
  139. ISO 15686-5.2 Buildings and Constructed Assets-Service Life Planning: Part 5, Life-Cycle Costing. 2017. Available online: https://www.iso.org/standard/61148.html (accessed on 2 April 2021).
  140. Trovato, M.R.; Giuffrida, S. Circular economy in urban and environmental valuation. In Urban Heat Stress and Mitigation Solutions; An Engineering Perspective; Costanzo, V., Marletta, L., Evola, G., Eds.; Wiley: Hoboken, NJ, USA, 2021. [Google Scholar]
  141. CIRAIG. Life Cycle Assessment of the Environmental Impacts Resulting from the Implementation of Urban Heats Island Mitigation Measures; Institute National De Santè Publique Québec: Montréal, QC, Canada, 2011. [Google Scholar]
  142. Genchi, Y.; Ihara, T. Environmental impact assessment of urban air temperature increase based on endpoint-type life cycle impact (Part 2)–Quantification of environmental impact in Tokyo. In Proceedings of the Seventh International Conference on Urban Climate, Yokohama, Japan, 29 June–3 July 2009. [Google Scholar]
  143. Kosareo, L.; Ries, R. Comparative environmental life cycle assessment of green roofs. Build. Environ. 2007, 42, 2606–2613. [Google Scholar] [CrossRef]
  144. Saiz, S.; Kennedy, C.; Bass, B.; Pressnail, K. Comparative Life Cycle Assessment of Standard and Green Roofs. Environ. Sci. Technol. 2006, 40, 4312–4316. [Google Scholar] [CrossRef]
  145. Ihara, T.; Genchi, Y. Environmental impact assessment of urban heat Island phenomena based on endpoint-type life cycle impact assessment methodology. J. Environ. Eng. 2008, 73, 1407–1415. [Google Scholar] [CrossRef]
  146. Genchi, Y. Life Cycle Impact Assessment of Urbain Heat Island in Tokyo. «LIME: Lifecycle Impact Assessment Method Based on Endpoint Modeling». Presentation by the National Institute of Advanced Industrial Science and Technology (AIST), Tsukuba, Japan. 2006. Available online: http://www.iea.org/work/2006/heat/8_Genchi.pdf (accessed on 2 April 2021).
  147. Genchi, Y.; Iraha, T. Environmental impact assessment of urban air temperature increase based on endpoint-type life cycle impact (Part 1)–Its framework. In Proceedings of the Seventh International Conference on Urban Climate, Yokohama, Japan, 29 June–3 July 2009. [Google Scholar]
  148. Keeney, R.; Raiffa, H. Decisions with Multiple Objectives: Preferences and Value Trade-Offs; Wiley: New York, NY, USA, 1976. [Google Scholar]
  149. Von Winterfeldt, D.; Edwards, W. Decision Analysis and Behavioral Research; Cambridge University Press: Cambridge, UK, 1986. [Google Scholar]
  150. Belton, V.; Stewart, T. Multiple Criteria Decision Analysis: An Integrated Approach; Kluwer Academic Press: Boston, MA, USA, 2002. [Google Scholar]
  151. Greco, S.; Ehrgott, M.; Figueira, J. Multiple Criteria Decision Analysis: State of the Art Surveys; Springer: Berlin/Heidelberg, Germany, 2005. [Google Scholar]
  152. Beinat, E. Value Functions for Environmental Management; Kluwer Academic Publishers: Dordrecht, The Netherlands, 1997. [Google Scholar]
  153. Bottarelli, M.; Gabrielli, L. Payback period for a ground source heat pump system. Int. J. Heat Technol. 2011, 29, 145–150. [Google Scholar]
  154. Gabrielli, L.; Bottarelli, M. Financial and economic analysis for ground-coupled heat pumps using shallow ground heat exchangers. Sustain. Cities Soc. 2016, 20, 71–80. [Google Scholar] [CrossRef]
  155. Giuffrida, S.; Ventura, V.; Trovato, M.R.; Napoli, G. Axiology of the historical city and the cap rate the case of the old town of Ragusa superior. Valori Valutazioni 2017, 18, 41–55. [Google Scholar]
  156. Blecic, I.; Cecchini, A.; Plaisant, A. Constructing strategies in strategic urban planning: A case study of a decision support and evaluation model. In Computational Science and Its Applications, Proceedings oft the ICCSA 2011, Santander, Spain, 20–23 June 2011; Murgante, B., Gervasi, O., Iglesias, A., Taniar, D., Apduhan, B.O., Eds.; Springer: Berlin/Heidelberg, Germany, 2011; Volume 6783, pp. 277–292. [Google Scholar] [CrossRef]
  157. ISTAT. Territorial Bases and Census Variable. Available online: https://www.istat.it/it/archivio/104317 (accessed on 2 April 2021).
  158. Geertman, S.; Stillwell, J. Planning support systems: An inventory of current practice. Comput. Environ. Urban Syst. 2004, 28, 291e310. [Google Scholar] [CrossRef]
  159. Brömmelstroet, M.T. Performance of planning support systems. Comput. Environ. Urban Syst. 2013, 41, 299–308. [Google Scholar] [CrossRef]
  160. Pelzer, P.; Geertman, S.; Van der Heijden, R.; Rouwette, E. The added value of planning support systems: A practitioner’s perspective. Comput. Environ. Urban Syst. 2013, 48, 16–27. [Google Scholar] [CrossRef]
  161. Albers, M.; Deppisch, S. Resilience in the light of climate change: Useful approach or empty phrase for spatial planning? Eur. Plan. Stud. 2013, 21, 1598–1610. [Google Scholar] [CrossRef]
  162. Hendricks, M.D.; Meyer, M.A.; Gharaibeh, N.G.; Van Zandt, S.; Masterson, J.; Cooper, J.T.; Horney, J.A.; Berke, P. The development of a participatory assessment technique for infrastructure: Neighborhood-level monitoring towards sustainable infrastructure systems. Sustain. Cities Soc. 2018, 38, 265–274. [Google Scholar] [CrossRef]
  163. Priori, L.; Alencar, M.H.; de Almeida, A.T. Coping with Climate Change Effects on Urban Infrastructure—Problem Structuring Based on Value-Focused Thinking Methodology. In Lifelong Learning and Education in Healthy and Sustainable Cities; Azeiteiro, U.M., Akerman, M., Leal Filho, W., Setti, A.F.F., Brandli, L.L., Eds.; World Sustainability Series; Springer: Cham, Switzerland, 2018. [Google Scholar] [CrossRef]
  164. Hassan, O. Application of value-focused thinking on the environmental selection of wall structures. J. Environ. Manag. 2004, 70, 181–187. [Google Scholar] [CrossRef]
  165. León, O.G. Value-focused thinking versus alternative-focused thinking: Effects on generation of objectives. Organ. Behav. Hum. Decis. Process. 1999, 80, 213–227. [Google Scholar] [CrossRef]
  166. Priori, L.; Alencar, M.H.; de Almeida, A.T. Adaptations to possible climate change impacts: Problem structuring based on VFT methodology. In Innovation in Climate Change Adaptation, Climate Change Management; Leal Filho, W., Ed.; Springer International Publishing: Cham, Switzerland, 2016. [Google Scholar] [CrossRef]
  167. Walker, B.; Salt, D. Resilience Thinking—Sustaining Ecosystems and People in a Changing World; Island Press: Washington, DC, USA, 2006. [Google Scholar]
  168. Loh, C.G. Placemaking and implementation: Revisiting the performance principle. Land Use Policy 2019, 81, 68–75. [Google Scholar] [CrossRef]
  169. Nicodemus, A.G. Fuzzy vibrancy: Creative placemaking as ascendant US cultural policy. Cult. Trends 2013, 22, 213–222. [Google Scholar] [CrossRef]
  170. Pelling, M. Adaptation to Climate Change; Routledge: London, UK, 2011. [Google Scholar]
  171. Cooper-Marcus, C.; Francis, C. People Places. Design Guidelines for Urban Open Space; John Wiley and Sons: New York, NY, USA, 1998. [Google Scholar]
  172. Speak, A.F.; Rothwell, J.J.; Lindley, S.J.; Smith, C.L. Reduction of the urban cooling effects of an intensive green roof due to vegetation damage. Urban Clim. 2013, 3, 40–55. [Google Scholar] [CrossRef]
  173. Lee, L.S.; Jim, C.Y. Thermal-irradiance behaviours of subtropical intensive green roof in winter and landscape-soil design implications. Energy Build. 2020, 209, 109692. [Google Scholar] [CrossRef]
  174. Energy Plus. Engineering Reference. In The Reference to Energy Plus Calculation, Green Roof Model (Ecoroof); University of Illinois: Champaign, IL, USA; University of California: Oakland, CA, USA, 2011; pp. 123–132. [Google Scholar]
  175. Giama, E.; Papageorgiou, C.; Theodoridou, I.; Papadopoulos, A.M. Life Cycle Analysis and Life Cycle Cost Analysis of green roofs in the Mediterranean climatic conditions. Energy Sources Part A Recovery Util. Environ. Eff. 2021, Part A, 1–14. [Google Scholar] [CrossRef]
  176. Alcazar, S.S.; Olivieri, F.; Neila, J. Green roofs: Experimental and analytical study of its potential for urban microclimate regulation in Mediterranean–continental climates. Urban Clim. 2016, 17, 304–317. [Google Scholar] [CrossRef]
  177. Piccinini Scolaro, T.; Ghisi, E. Life cycle assessment of green roofs: A literature review of layers materials and purposes. Sci. Total Environ. 2022, 829, 154650. [Google Scholar] [CrossRef]
  178. Carter, T.; Keeler, A. Life-cycle cost-benefit analysis of extensive vegetated roof systems. J. Environ. Manag. 2008, 87, 350–363. [Google Scholar] [CrossRef]
  179. Karteris, M.; Theodoridou, I.; Mallinis, G.; Tsiros, E.; Karteris, A. Towards a green sustainable strategy for Mediterranean cities: Assessing the benefits of large-scale green roofs implementation in Thessaloniki, Northern Greece, using environmental modelling, GIS and very high spatial resolution remote sensing data. Renew. Sustain. Energy Rev. 2016, 58, 510–525. [Google Scholar] [CrossRef]
  180. Li, W.C.; Yeung, K.K.A. A comprehensive study of green roof performance from environmental perspective. Int. J. Sustain. Built Environ. 2014, 3, 127–134. [Google Scholar] [CrossRef] [Green Version]
  181. Vijayaraghavan, K. Green roofs: A critical review on the role of components, benefits, limitations and trends. Renew. Sustain. Energy Rev. 2016, 57, 740–752. [Google Scholar] [CrossRef]
  182. Shafique, M.; Luo, X.; Zuo, J. Photovoltaic-green roofs: A review of benefits, limitations, and trends. Sol. Energy 2020, 202, 485–497. [Google Scholar] [CrossRef]
  183. ISO/TS 14067; Greenhouse Gases and Carbon Footprint of Products and Requirements and Guidelines for Quantification and Communication (Technical Specifications). International Organization for Standardization: Geneve, Switzerland, 2013.
  184. Chenani, S.B.; Lehvävirta, S.; Häkkinen, T. Life cycle assessment of layers of green roofs. J. Clean. Prod. 2015, 90, 153–162. [Google Scholar] [CrossRef]
  185. Bianchini, F.; Hewage, K. How “green” are the green roofs? Lifecycle analysis of green roof materials. Build. Environ. 2012, 48, 57–65. [Google Scholar] [CrossRef]
  186. Berardi, U.; GhaffarianHoseini, A.; GhaffarianHoseini, A. State-of-the-art analysis of the environmental benefits of green roofs. Appl. Energy 2014, 115, 411–428. [Google Scholar] [CrossRef]
  187. Bianchini, F.; Hewage, K. Probabilistic social cost-benefit analysis for green roofs: A lifecycle approach. Build. Environ. 2012, 58, 152–162. [Google Scholar] [CrossRef]
  188. Shafique, M.; Azam, A.; Rafiq, M.; Ateeq, M.; Luo, X.; Xiaowei, L. An overview of life cycle assessment of green roofs. J. Clean. Prod. 2020, 250, 119471. [Google Scholar] [CrossRef]
  189. Gagliano, A.; Detommaso, M.; Nocera, F.; Berardi, U. The adoption of green roofs for the retrofitting of existing buildings in the Mediterranean climate. Int. J. Sustain. Build. Technol. Urban Dev. 2016, 7, 116–129. [Google Scholar] [CrossRef]
  190. Gagliano, A.; Detommaso, M.; Nocera, F.; Patania, F.; Aneli, S. The retrofit of existing buildings through the exploitation of the green roofs—A simulation study. Energy Procedia 2014, 62, 52–61. [Google Scholar] [CrossRef] [Green Version]
  191. Gagliano, A.; Detommaso, M.; Nocera, F.; Evola, G. A multi-criteria methodology for comparing the energy and environmental behavior of cool, green and traditional roofs. Build. Environ. 2015, 90, 71–81. [Google Scholar] [CrossRef]
  192. Sailor, D. A green roof model for building energy simulation programs. Energy Build. 2008, 40, 1466–1478. [Google Scholar] [CrossRef]
  193. Peri, G.; Rizzo, G.; Scaccianoce, G.; Sorrentino, G. Role of Green Coverings in Mitigating Heat Island Effects: An Analysis of Physical Models. Appl. Mech. Mater. 2012, 260, 251–256. [Google Scholar] [CrossRef]
  194. Coma, J.; Pérez, G.; Cabeza, L.F. Life cycle assessment of green roofs. In Nature Based Strategies for Urban and Building Sustainability; Butterworth-Heinemann: Oxford, UK, 2018. [Google Scholar] [CrossRef]
  195. UNI. 11235:2007 Criteria for Design, Execution, Testing and Maintenance of Roof Garden; UNI: Milan, Italy, 2007. [Google Scholar]
  196. Fernandez-Antolin, M.M.; del Río, J.M.; Costanzo, V.; Nocera, F.; Gonzalez-Lezcano, R.A. Passive design strategies for residential buildings in different Spanish climate zones. Sustainability 2019, 11, 4816. [Google Scholar] [CrossRef] [Green Version]
  197. Stylos, N.; Koroneos, C. Carbon footprint of polycrystalline photovoltaic systems. J. Clean. Prod. 2014, 64, 639–645. [Google Scholar] [CrossRef]
  198. Riepe, S.; Nold, S.; Brailovsky, P.; Krenckel, P.; LFriedrich, L.; Janz, S.; Preu, R. Cast-mono silicon wafers for a austinalbe PV market growth. In Proceedings of the 37th EUPVSEC, Lisbon, Portugal, 7–11 September 2020; Available online: https://www.eupvsec-proceedings.com/proceedings?advanced[title]=Cast-mono+silicon+wafers+for+a+austinalbe+PV+market+growth&advanced[date]=2020&advanced[author]=Riepe&advanced[keyword]=&paper=49612 (accessed on 5 April 2021).
  199. Herceg, S.; Briem, A.; Fischer, M.; Brailovsky, P.; Dannenberg, T.; Held, M. A comparative life cycle assessment of PV modules-influence of database and background system. In Proceedings of the 38th EUPVSEC, Lisbon, Portugal, 6–10 September 2021; Available online: https://www.eupvsec-proceedings.com/proceedings?fulltext=A+comparative+life+cycle+assessment+of+PV+modules-influence+of+database+and+background+system&paper=50370 (accessed on 5 April 2021).
  200. Salibi, M.; Schönberger, F.; Makolli, Q.; Bousi, E.; Almajali, S.; Friedrich, L. Energy payback time of photovoltaic electricity generated by passivated emitter and rear cell (PERC) solar modules: A novel methodology proposal. In Proceedings of the 38th EUPVSEC, Lisbon, Portugal, 6–10 September 2021; Available online: https://www.eupvsec-proceedings.com/proceedings?offset=0&fulltext=Energy+payback+time+of+photovoltaic+electricity+generated+by+passivated+emitter+and+rear+cell+%28PERC%29+solar+modules%3A+A+novel+methodology+proposal (accessed on 5 April 2021).
  201. Brailovsky, P.; Friedrich, L.; Nold, S.; Riepe, S.; Rentsch, J. Sustainable PV Manufacturing Solutions for Relaunching the European PV Manufacturing Industry. PV International 46, 2021. Available online: https://publica.fraunhofer.de/entities/publication/a0699244-6efc-4852-a07c-56a79c882d1f/details (accessed on 5 April 2021).
  202. Müller, A.; Friedrich, L.; Reichel, C.; Herceg, S.; Mittag, M.; Neuhaus, D.H. A comparative life cycle assessment of silicon PV modules: Impact of module design, manufacturing location and inventory. Sol. Energy Mater. Sol. Cells 2021, 230, 111277. [Google Scholar] [CrossRef]
  203. Governo Italiano. Bilancio di Previsione Dello Stato per L’anno Finanziario 2021 e Bilancio Pluriennale per il Triennio 2021–2023. (20G00202) (GU Serie Generale n.322 del 30-12-2020-Suppl. Ordinario n. 46). Available online: htpps://www.gazzettaufficiale.it/atto/serie_generale/caricaDettaglioAtto/originario?atto.dataPubblicazioneGazzetta=2020-12-30&atto.codiceRedazionale=20G00202 (accessed on 2 March 2021).
  204. De Ruggiero, M.; Manganelli, B.; Marchianò, S.; Salvo, F.; Tavano, D. Comparative and evaluative economic analysis of ground mounted photovoltaic plants. In Green Energy and Technology; Springer: Berlin/Heidelberg, Germany, 2020; pp. 181–199. [Google Scholar] [CrossRef]
  205. Gabrielli, L.; Giuffrida, S.; Trovato, M.R. Gaps and overlaps of urban housing sub market: A fuzzy clustering approach. In Appraisal from Theory to Practice: Green Energy and Technology; Stanghellini, S., Morano, P., Bottero, M., Oppio, A., Eds.; Springer: Cham, Switzerland, 2017; pp. 203–219. [Google Scholar] [CrossRef]
  206. Napoli, G.; Giuffrida, S.; Trovato, M.R.; Valenti, A. Cap Rate as the Interpretative Variable of the Urban Real Estate Capital Asset: A Comparison of Different Sub-Market Definitions in Palermo, Italy. Buildings 2017, 7, 80. [Google Scholar] [CrossRef] [Green Version]
  207. Gabrielli, L.; Giuffrida, S.; Trovato, M.R. From surface to core: A multi-layer approach for the real estate market analysis of a central area in catania. In Computational Science and Its Applications, Proceedings of the ICCSA 2015, Banff, AB, Canada, 22–25 June 2015; Gervasi, O., Murgante, B., Misra, S., Gavrilova, M.L., Rocha, A.M.A.C., Torre, C.M., Taniar, D., Apduhan, B.O., Eds.; Springer: Cham, Switzerland, 2015; Volume III, pp. 284–300. [Google Scholar] [CrossRef]
  208. Gabrielli, L.; Giuffrida, S.; Trovato, M.R. Functions and perspectives of public real estate in the urban policies: The sustainable development plan of syracuse. In Computational Science and Its Applications, Proceedings of the ICCSA 2016, Beijing, China, 4–7 July 2016; Gervasi, O., Murgante, B., Misra, S., Rocha, A.M.A.C., Torre, C.M., Taniar, D., Apduhan, B.O., Stankova, E., Wang, S., Eds.; Springer: Cham, Switzerland, 2016; Volume IV, pp. 13–28. [Google Scholar] [CrossRef]
  209. Simonotti, M. La Stima Immobiliare Con Principi DI Economia E Applicazioni Estimative; UTET Libreria: Milan, Italy, 1997. [Google Scholar]
  210. Giuffrida, S.; Carocci, C.; Circo, C.; Giuffre, M.; Rosa Trovato, M.; Ventura, V. Axiological strategies in the old towns seismic vulnerability mitigation planning. Valori Valutazioni 2020, 25, 99–106. [Google Scholar]
  211. Hicks, J.R. Value and Capital; Clarendon Press: Oxford, UK, 1946. [Google Scholar]
  212. Giuffrida, S.; Di Mauro, S.; Valenti, A. Cap rate and the historic city. Past and future of the real estate of noto (Italy). In Computational Science and Its Applications, Proceedings of the ICCSA 2016, Beijing, China, 4–7 July 2016; Lecture Notes in Computer Science; Gervasi, O., Murgante, B., Misra, S., Rocha, A.M.A.C., Torre, C.M., Taniar, D., Apduhan, B.O., Stankova, E., Wang, S., Eds.; Springer: Cham, Switzerland, 2016; Volume 9789. [Google Scholar] [CrossRef]
  213. Giuffrida, S. A fair city. Value, time and the cap rate. In Integrated Evaluation for the Management of Contemporary Cities, Green Energy and Technology; Mondini, G., Fattinnanzi, E., Oppio, A., Bottero, M., Stanghellini, S., Eds.; Springer: Cham, Switzerland, 2018; pp. 425–439. [Google Scholar] [CrossRef]
  214. Giannelli, A.; Giuffrida, S.; Trovato, M.R. The beautiful city and the rent from information. monetary axiology of the shape surplus. Valori Valutazioni 2020, 27, 53–66. [Google Scholar] [CrossRef]
  215. Artese, S.; De Ruggiero, M.; Salvo, F.; Zinno, R. Research of the Critical Capitalization Rate in Building Damage Appraisal. Sustainability 2022, 14, 486. [Google Scholar] [CrossRef]
  216. Fregonara, E.; Corrado, C.; Pasquarella, O. LCC Analysis to evaluate the economic sustainability of technological scenarios on the district scale. Valori Valutazioni 2018, 21, 59–73. [Google Scholar]
  217. Giuffrida, S. City as hope. Valuation science and the ethics of capital. In Integrated Evaluation for the Management of Contemporary Cities, Green Energy and Technology; Mondini, G., Fattinnanzi, E., Oppio, A., Bottero, M., Stanghellini, S., Eds.; Springer: Cham, Switzerland, 2018; pp. 411–424. [Google Scholar] [CrossRef]
  218. Trovato, M.R.; Giuffrida, S. The protection of territory in the perspective of the intergenerational equity. In Green Energy and Technology; Springer: Berlin/Heidelberg, Germany, 2018; Volume Part F8, pp. 469–485. [Google Scholar] [CrossRef]
  219. Bottero, M.; Bravi, M.; Dell’Anna, F.; Marmolejo-Duarte, C. Energy efficiency choices and residential sector: Observable behaviors and valuation models. In Values and Functions for Future Cities. Green Energy and Technology; Mondini, G., Oppio, A., Stanghellini, S., Bottero, M., Abastante, F., Eds.; Springer: Cham, Switzerland, 2020. [Google Scholar] [CrossRef]
Figure 1. Heuristic Planning Support System (our processing).
Land 11 00773 g001
Figure 2. The process flow chart for identifying preference structures (our processing).
Land 11 00773 g002
Figure 3. Ranking of interventions for the different levels of green strategy based on the NPV–NPV in the different levels of the green strategy.
Land 11 00773 g003
Figure 4. (A). Values of the criteria for the different levels of green strategy. (B). Trade-off between the criteria for the set of weights selected by the decision makers.
Land 11 00773 g004
Figure 5. Ranking of the levels of the green strategy based on the aggregate assessment; comparison between the two levels of the strategy in economic terms and the integrated assessment; visualization of the ranking of the criteria for the best economic level and the integrated evaluation; map displaying the best level of the green strategy.
Land 11 00773 g005
Figure 6. Ranking of interventions for the different levels of the blue strategy based on the NPV–NPV in the different levels of the blue strategy.
Land 11 00773 g006
Figure 7. (A). Values of the criteria for the different levels of the blue strategy. (B). Trade-off between the criteria for the set of weights selected by the decision makers.
Land 11 00773 g007
Figure 8. Ranking of the levels of the blue strategy based on the aggregate assessment; comparison between the two levels of the strategy in economic terms and the integrated assessment; visualization of the ranking of the criteria for the best economic level and the integrated evaluation; map displaying the best level of the blue strategy.
Land 11 00773 g008
Figure 9. Ranking of the levels of the green-blue strategy based on the aggregate assessment; comparison between the two levels of the strategy in economic terms and the integrated assessment; visualization of the ranking of the criteria for the best economic level and of the integrated evaluation; map displaying the best level of the green-blue strategy.
Land 11 00773 g009
Figure 10. Comparison of criteria for the best level of strategies explored.
Land 11 00773 g010
Table 1. Ecological transition critical issues in the historic centres.
Critical IssuesSpecific Critical Issues
Built environmentTypological and technological heterogeneity of the building heritage
Poor adaptability and low levels of energy performance of building units
Vulnerability of the building stock [50]
Housing obsolescence
Constraints for the protection of specific features
Human environmentSocial vulnerability [38,39] due to the concentration in these contexts of the weakest social groups such as the elderly, immigrants, and families and the unfulfilled or insufficient process of social inclusion [51]
Economic and financial profile of subjects and real estate assetsFragmentation of property ownership
Concentration of income ranges in the medium–low type
Concentration of buildings for rent
Low awareness of the existence of financial instruments, such as incentive systems developed by national taxation to support the energy upgrading of buildings [52]
Limited access, due to the specific characteristics of the built environment, to the benefits provided by the incentive system [53,54,55]
Natural environmentHigh population density
Reduced endowment of natural capital [56]
Reduced resilience to the effects of climate change
Administrative Difficult technological and technical compatibility of the interventions with architectural and urban constraints [57,58,59,60,61]
Identity Poor compatibility of energy efficiency interventions with the quality of the urban landscape and the historical–cultural and aesthetic values
Political Difficulty to manage effectively the transition from a linear model to a circular one [62,63,64,65,66,67,68,69]
Publisher’s Note: MDPI stays neutral with regard to jurisdictional claims in published maps and institutional affiliations.

