Abstract
The cultural landscape of Chiang Mai city, which is characterized by the interlinkage between mountain and historical settlement, has faced the adverse impacts of visual intrusion in its buffer zone from urbanization. However, there are challenges to creating a quantitative visual evaluation for decision making in response to rapid urban change. This study evaluated the impact of building height on the city skyline and utilized existing cultural heritage locations on the mountain to define a protected visual zone while conducting a 3D-GIS-based visibility analysis to identify obstruction in three scenarios: the actual condition scenario (ACS) considering current conditions, the land use scenario (LUS) considering the land use ordinance, and the proposed scenario (PPS) considering mountain skyline protection, using computer-generated 3D city modeling. The comparative results from the analysis of viewshed, line of sight, and development area calculations revealed that the number of obstructed locations in the LUS decreased by 48.46%, and in the PPS, they decreased by 77.99%, while the development area increased by similar amounts, demonstrating that the city can grow and develop despite stricter height controls. In addition, based on a visual assessment, this study established a buffer distance and intensity to protect the integrity of the heritage while allowing the city to develop.
1. Introduction
In the past decade, challenges to urban heritage conservation have prompted local authorities to consider integrating the HUL concept, which is a relatively new approach to cultural landscape and urban heritage conservation that focuses on the incorporation of change management into policy and implementation. The school of thought on townscapes proposed by Gordon Cullen [1] of implementing the protection of visual integrity into urban conservation is one of the elements that the HUL approach focuses on. UNESCO has recognized the urban area as a cultural landscape that is the combination of natural and cultural heritage in a changing environment [2]. Recommendations have been made for adopting the idea of ‘landscape’ as an approach to urban heritage conservation that includes moving beyond protecting only the heritage property to considering a larger territory by taking into account the natural and cultural properties as well as the surrounding buffer as a holistic entity. Consequently, natural elements are not seen as physical features; rather, they are perceived as significant landmarks that express local identity and culture. As a result, effective management should be applied holistically and dynamically to fit the local context [3,4,5].
Urbanization is the primary reason for the decrease in the cultural landscape’s values and integrity because it results in intrusive buildings and development, which potentially contributes to adverse impacts on the interlinkage of natural–cultural heritages and breaks up the skyline. Recently, numerous cultural landscapes have been endangered or removed from the WH List because of the inappropriate built environment located in the crucial view zone (e.g., Dresden Elbe Valley in 2009, the Historic Centre of Vienna in 2017) [6,7]. Urbanization is taking place in developing countries, particularly in Asia. The urban growth rate will rise from 48% to 64% in 2050 [8], and the most populated mountain regions are based in Asia [9]. There are many mountains that are home to numerous cultural heritage sites representing local beliefs and the respect for nature, for instance, the sacred mountains in China, Japan, and South Korea. There are concerns that the rapidly growing infrastructure and development will accelerate the vulnerability of the cultural landscape, especially in historical cities that are not yet well-prepared [10]. Safeguarding the integrity and authenticity of the cultural landscape must be accomplished through important view protection and the management of visual impact in buffer zones. Nevertheless, the buffer zones are seen not only as intermediate settings that protect the property from potential threats outside the boundary, but also as places that connect the cultural landscape values as well as serving to encourage developments that are beneficial for the local community and/or restrict potential danger to the heritage’s values [11]. The recent Historic Urban Landscape approach (HUL) defines urbanization as a threat to historical/cultural assets and provides opportunities for the social and economic development of local communities. For this reason, effective buffer zone planning is needed to provide sufficient control and safeguard existing heritage values when adapting to the rapidly continuous changes of urbanization and growth. In the meantime, development planning requires effective tools to quantify the maximum level of change that could be allowed in the historic urban landscape or be acceptable to the local community [12,13]. As a result, both the impact and outcome of the new development proposal in the heritage buffer should be considered. This will provide scientific data of land use that will lead to the preservation of important skylines, contributing to the integrity and values of the cultural landscape.
In urban planning, the purpose of visual impact assessment is to preserve the view of important landmarks and natural areas. Most cases are based on the creation of a threshold, visual zone, or view cone [14,15,16,17]. Building intrusion accounts for visual impact whose inappropriate appearance in-between the observer and the target view can contribute to reducing the visibility of the feature or obstructing the visibility of specific features/views due to its height and dominance [18,19]. Visibility determines whether one or more locations can be seen from one another. Among various methods, viewshed and line of sight analyses are widely applied in the research and investigation into changes in the skyline and visual interrelationship between sites. The viewshed is a measurement of the visible surface from a specified location, while the line of sight tests the probability of seeing the visible target. Therefore, the concepts are similar, literally seeing or not seeing the target and determining whether it is visible or invisible. Both analyses consider elevation surface and use a sightline originating with the observer to the target points to calculate the ratio for each cell along the line and determine the cell ratio below. The height of the sightline ratio is considered visible and therefore obscured from view, which is estimated as the visual impact [14,20,21,22,23,24,25]. A series of factors and conditions can influence visibility, including the observer’s conditions (e.g., altitude, visual limitation), the viewing target’s conditions (e.g., size, distance), the condition of in-between space such as viewing direction, the height and location of landscape elements, and the atmospheric conditions [26]. The effectiveness of land use planning and the urban design strategy should also be examined as building construction is a consequence of land use decisions that may contribute to visual impacts on the significant landscape [27,28,29]. In the actual situations, many historical cities have integrated the idea of the visibility of the important natural/cultural heritage sites in their city planning. Kyoto is an excellent example of a city that is quite similar to Chiang Mai in terms of its character, which includes mountains, historical temples, and shrines. The city has adopted the ideology of Shakkei (referring to the imitation of famous scenic spots in garden design) [30] to incorporate the view of mountain landscape and the cultural heritage site as elements in planning the city and urban design. The different characters of the viewing zone were identified according to the significance to the sacred mountain and the important temples on it. The city has created two conservation concepts called ‘Perspective and Borrowed Landscapes’, to incorporate the visible areas of the sacred mountains as a background to the specific locations (e.g., gardens, historical sites, and public open spaces), and ‘Surrounding Scenery and View Area’, to include Kiyomizudera Temple on the sacred mountain as a protected view target. The concepts enhance and sustain the significant values of historical properties and their relationship to the mountain. Additionally, they protect significant views and historical sites in the mountainous city from the inappropriate intrusion of the built environment. This resulted in the designation of preservation district areas with regulations on the height and design of buildings at different view distance zones around the city and within the 50 m buffer zone of the temple [31]. Similar to Vilnius city, which aimed to preserve the panoramic views of the city, 3D modeling was adopted to examine the visibility of new development. The city conducted the analysis by investigating changes in the appearance of the panoramic historical landscape as a result of the emergence of new development. Consequently, it created guidelines for the visual protection and the development zoning that is proper to the city’s character [32]. Another example is Florence, Italy, a UNESCO site since 1982, which required an updated approach and/or charter to safeguard the Historic Garden as well as the intercultural development of the city’s people [33]. The city symbolizes Renaissance art, which is intertwined with complex artistic realization [34]. Florence’s management plan is still evolving and developing in collaboration with academic organizations (such as Heritage CITYlab, a joint laboratory) to apply scholastic interpretations of the historical landscape [35,36,37]. As seen, the city mainly determined the protected zoning code by considering the influence of new structures on its surrounding landscape. However, failure to consider the existing structures may adversely impact the significant landscape because of their potential to obstruct and decrease the visibility of the heritage views.
To illustrate potential changes and assess the visual impacts of new development on the urban landscape, three-dimensional (3D) city modeling using Geospatial Information System (GIS) data is helpful as it can forecast the effectiveness of both pre- and post-planning and evaluate against measures, urban design strategies, and controls. It can also provide the public with information that is easier to understand by creating various scenarios. Furthermore, the tool can help reduce time and labor when applied in the research, particularly concerning skyline protection and development impact mitigation, because of its capacity for processing large amounts of complex city spatial data [38]. In recent studies, the main focus has been on the challenge of visualizing future built environments to create inclusive urban planning/designing for non-expert stakeholders [39,40,41] and to integrate the add-on components into the historical context in order to foster economic and environmental sustainability [42]. Three-dimensional modeling creates a digital artifact that can lead to urban planning strategic debate and negotiation among multiple urban planning stakeholders [43,44,45]. However, static 3D modeling is becoming obsolete as the digital age progresses [46,47]. Dynamic modeling and interchangeable feedback according to its parameters or updated zoning regulations are considered important for responsive scenario evaluation in land use planning [48,49]. The automatic architectural massing generated by 3D GIS [50] is essential for evaluating the land use ordinance that will control building mass. Many studies on city design use procedural modeling tools to generate 3D massing studies [51,52,53,54,55,56,57]. In the critical land use zone containing historic and sensitive properties, generative urban planning such as 3D massing combined with GIS analytics creates a variety of evaluations and essential data collections [58,59,60,61]. These applications and toolkits enable researchers and practitioners to investigate critical issues while continuously testing the simulated environment in response to its problems.
2. Study Area
This study was conducted in Chiang Mai city, Thailand. The distinctive cultural landscape of Chiang Mai city is formed by the interrelationship between the historical walled settlement and the sacred mountain called Doi Suthep, which has been included in the World Heritage Tentative Lists since 2015 [62]. The historical walled city consists of traditional temples located east of the Doi Suthep mountain, where the mountain temples represent the places of worship. They are far from each other, approximately a 3 km distance, and the mountain landscape can be seen from many spots in the city. The area around the sites has been designated as the buffer zone, resulting in some areas that connect to one another serving as buffers for both heritage sites (see Figure 1).
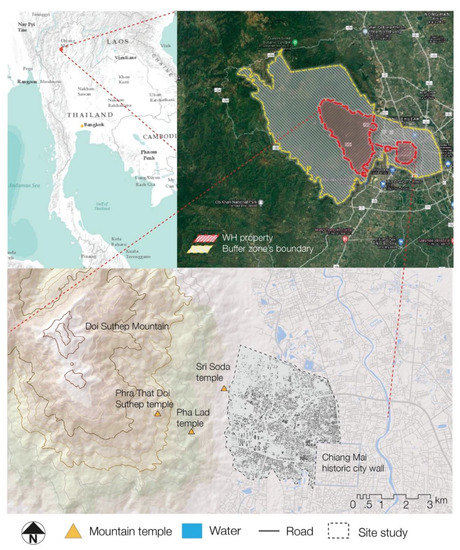
Figure 1.
Location of site study area (Source: Authors).
The study area included the mountain, the city wall, and the buffer zone area that lies between them. The mountain rises approximately 1658 m above mean sea level and has a total area of 165,604,500 m2 on the east side. Because of the city’s cultural landscape represented by the mountain and the old city, the mountain was determined as the target view, and the city wall area was chosen as the viewpoint location, while all buildings in the buffer zone were defined as obstacles.
The next section describes the characteristics of the cultural landscape of the city, the current condition, land use, and building height zoning, and states the issues surrounding cultural landscape conservation in the study area.
2.1. Chiang Mai’s Cultural Landscape
The cultural landscape of Chiang Mai city is characterized by the setting of the historical city wall and the sacred mountain. The city occupies a uniquely attractive setting, with the sacred Doi Suthep mountain in the west and sloping down to the east where the historical city wall with traditional temples is located. Chiang Mai had been the ancient capital of the Lanna Kingdom for 726 years. It is a walled city settlement located in the mountain region. The historical walled city is characterized by a rectangularly shaped city encircled by moats and walls, similar to what can be found in other Asian cities such as Xi’an and Kyoto. Nonetheless, the Chiang Mai city wall was planned by adopting the concept of the neighboring capital of Sukkhothai, which exemplified the knowledge and creativity in city planning [63]. Chiang Mai city adopted a perimeter design that was advantageous during wartime with respect to the sacredness of the mountain.
The city was carefully planned based on the animistic beliefs of indigenous Tai and Lawa, which combine the Hindu-Buddhist concepts of cosmology in association with the sacred mountain. Doi Suthep was considered sacred by the Chiang Mai people. It was worshipped long before the establishment of the city. The indigenous people view it as the place where their ancestors’ spirits reside and the key feature representing Mount Sumeru—the center of the universe that links between humans and devas in the Hindu-Buddhist cosmology. It was the essential element in planning the city. The historical city is located approximately 3 km from the foothills. The historical walled city is surrounded by moats and is a nearly square area of approximately 2.5 km2 located east of the sacred mountain and designated as territory of the sacred universe [64].
Within the historical city walls, the zoning layout of the temple is also influenced by the cosmology concept representing the universe. The pagoda represents Mount Sumeru; the main vihara (the pavilion for religious ceremonies) faces the eastern entrance of the temple and is surrounded by other viharas in four directions. This feature represents the four sacred continents, while the sand courts represent the ocean [65]. The temples within the city walls were built in different periods. Some were built during the time as the city’s establishment as the former king’s residence. Others were built in the early 20th century Buddha, influenced by the establishment of the pagoda containing Buddha relics on the Doi Suthep mountain [64], resulting in the cultural significance of each temple and its role in holding ceremonies in the city and/or at the community level. The pagoda was first established in Lanna history. It inspired building the temples on the mountain—Sri Soda, Fai Hin, Pha Lad, and Phra That Doi Suthep, located along the worship trail to the top of the mountain representing the four stages of enlightenment [66]—and other cities were inspired to place the pagodas on the mountain to express worshipfulness [64] (see Figure 1).
2.2. Current Building Heights in the Study Area
Building heights range from 12 to 23 m. In Thailand, according to building control acts [67] and zoning ordinances [68], the height of a low building is 12 m, a medium-high structure is 15 m, and buildings taller than 23 m are designated as large/tall buildings. As seen in Figure 2, most buildings in the study area are low-rise buildings, while some are buildings taller than 15 m, particularly in the middle part of the study area. The large group of high-rise buildings (>23 m) is located directly opposite the historical city walls.
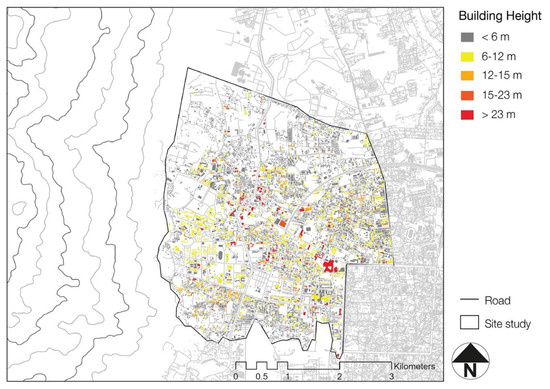
Figure 2.
Existing building heights in the study area (Source: Authors).
2.3. Land Use and Building Height Zoning in the Study Area
Before 2012, Chiang Mai city lacked building-control regulations. From 1996 to 1999, and again from 2006 to 2012, uncontrolled projects were only suppressed at the municipal level, where they would occupy historical areas. Uncontrolled and unregulated urban planning, resulting in massive projects and inappropriate building height, had a significant impact on urban development and the visual integrity of the site [69]. The lack of regulation created challenges and tension in the communication among stakeholders. The cultural environment was the key to maintaining nature’s sustainable role in responding to modernized developed areas.
According to the City Comprehensive Plan [68], the objective was to enhance efficient use that conformed to further community expansion as well as to support and encourage economic development. The land use of Chiang Mai was categorized into 11 zones. Therefore, there are eight categories in the study area, which are: low-density residential area, medium-density residential area, commercial and high-density residential area, educational area, religious area, government institutions and public utility area, recreational open space and environmental quality area, and cultural and identity conservation area. The land use in Chiang Mai city seems to determine the actual setting. The city core area was designated for conservation because of the existence of the ancient city wall and historical temples. Residential areas with high, medium, and low density were designated accordingly in the areas outside the conservation zone to allow the developments. The other land uses, such as educational and government institutions and public utilities, are near the city wall area, and the cultural and identity conservation area is near the foothills because of its original location.
The heights of buildings were determined according to their use. Buildings of 12 m height were determined for most land uses and around temples, while some areas needed to refer to the adjacent zone, and in some parts of the medium-density residential area are limited to 15 m (See Figure 3 and Figure 4 and Table 1).
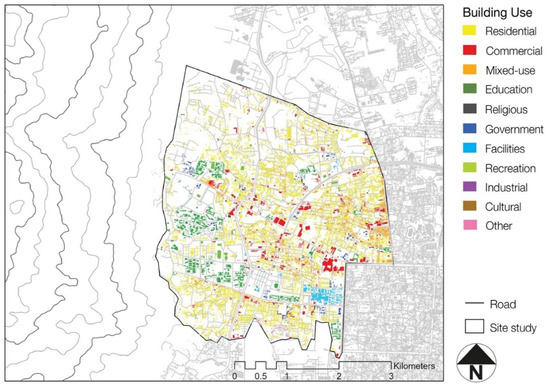
Figure 3.
Building uses in the study area (Source: Authors).
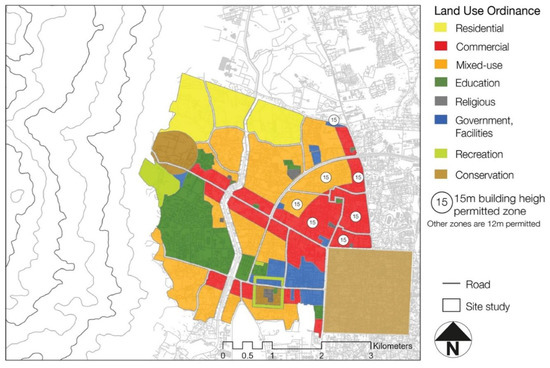
Figure 4.
Land use and height zoning in the study area (Source: Authors).

Table 1.
Building Heights Allowed According to Chiang Mai City Comprehensive Plan 2012.
Multiple changes have transformed the urban landscape in the city center, probably leading to the vulnerability of values and integrity in the nature–culture heritage. The urban sprawl has expanded into the agricultural area near the foothills [70], increasing the built-up area to 45% in the residential zone over the past 15 years [71]. The high building construction was in response to tourist activities and residential use after the city became the center of the northern region for several developments [72], enhancing the pressure on the buffer area. However, the preservation efforts of the city government to preserve the historical landscape have been insufficient and inefficient at balancing with modernization and globalization [73]. Even though various regulations and controls (e.g., Chiang Mai city land use comprehensive plan in 2012, the zoning ordinance, building control acts) have been implemented to manage building construction in the city, several aspects have hindered effective protection of the unique cultural landscape from the impact of intrusive buildings. First, failure to include cultural landscape conservation concepts into the current city planning has made Chiang Mai more vulnerable. The city has determined the building height levels with regard to the land use zoning based more on attempts to encourage economic developments, but less on considering the significant views. The mountain view as seen from places that have been listed as heritage properties should be protected from vertically intrusive buildings. Second, less attention to specific measures/controls supporting the interlinkage of the natural–cultural heritage has kept the city from providing effective protection. Specific approaches have not yet been integrated in city planning to enhance the buffer zone functions. According to the Chiang Mai city land use comprehensive plan (2012), the city zoning determining the land use seems to conflict between development and conservation zones. The medium-density residential zone was designated in the area adjoining the conservation area near the city wall. Without placing a buffer zone between them, medium-high-rise buildings (15 m high) are allowed close to the historical city wall. Finally, assessing the visual impacts in the urban landscape requires advanced tools that can provide a realistic estimation. However, the city plan is based on 2D evaluation, which is insufficient to investigate the visual impacts of building intrusion in the rapidly growing urban area. The view of Doi Suthep is important to the skyline of Chiang Mai city and needs specific protection. However, the current city plan and land use strategy overlook the visual integrity of the urban heritage. Rapid urbanization has exerted tremendous pressure on the nature–culture interlinkage, and the impacts of the proposed development in its buffer boundary zone need to be assessed, as well as the subsequent outcomes. Visual impact assessment to support specific treatment of the city’s unique cultural landscape is needed, using the most effective and advanced tools and in response to the ongoing rapid transformation in the area (see Figure 5).
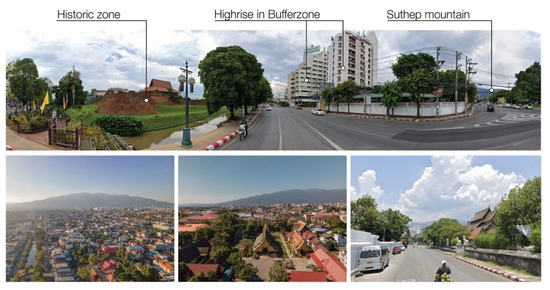
Figure 5.
Existing photo from different viewing spots in the study area (Source: Authors and Reprinted/adapted with permission from Ref. [74]. 2020, CMWHI).
This study has two aims: (1) to explore changes in the historical urban landscape of the mountain-historical city as a result of the zoning ordinance and land use designation, and (2) to contribute planning criteria for building heights and development to support decision making for the cultural landscape conservation of Chiang Mai city. Various scenarios will be created considering the current and future conditions by applying 3D city modeling, while the effectiveness of both pre- and post-planning will be investigated using GIS analysis. The findings will offer optimum values through a comparison of the results regarding the number of obstructions and locations and the amount of protected and development area in different scenarios that have adverse impacts on the visual integrity of the mountain-culture heritage. The conclusion may provide information to supporting further management and decision making on optimal criteria for future development in the buffer zone of Chiang Mai city.
3. Methodology
Visual intrusion zoning policies for historical cities, such as the Kyoto City Landscape Policy (2007) and Local Action Plan Vilnius Old Town (2011), have indicated a visual zone from specific places to the historical features and natural landmarks that maintain their heritage integrity. Preserving the mountain landscape view by considering the specific height level of buildings where historical temples are located to designate the protected skyline in Kyoto city, and using the 3D model to illustrate the impacts of new building on the panoramic historical landscape of Vilnius city, have proved useful in creating guidelines for future development that are in harmony with the existing wider setting.
This study was extended from those of the above cities to conduct an analysis of the mountain-historical landscape of Chiang Mai city, as the city is characterized by the interrelationship between the mountain and the historical walled city consisting of traditional temples. The view of the mountain should be protected, and the observer location can be set at the temples in the city wall. This study determined the Doi Suthep mountain as a target protected skyline. There are three important mountain temples located along the worship trail to the mountain top, and their location levels were determined as the protected skyline view zones. Moreover, the 3D model favored creating different scenarios of the city that were close to reality. This was applied to aid in evaluating the impacts of various height buildings in each scenario. Finally, we quantified the amount of change by considering protected and development areas in the area. The methodology included the following steps:
- (a)
- Identifying important landscape elements and viewpoint locations considering the relationship of cultural significance;
- (b)
- Creating scenarios regarding the actual condition, the current land use ordinance, and the future proposal;
- (c)
- Conducting a visibility analysis to assess the obstruction of the mountain skyline by building height designations in each scenario;
- (d)
- Calculating the amount of protected and development area to explore landscape change;
Comparing the results from all scenarios to provide quantitative information for future development and decision making.
3.1. Data Preparation for the Analysis Parameter
3.1.1. The Temples as Viewpoint Locations (The Observer)
Before conducting the visibility analysis, the viewpoint location should be determined and its location and value input considering the human field of vision added to the parameter to ensure accurate measurement. Viewpoint locations were usually chosen for public accessibility and the purpose of the study. For example, the study aimed to encourage tourism by selecting lookouts and scenic spots [75], while it aimed to improve the mountain forest scenery by choosing locations that many observers could publicly access and that provided spaces for the observer to see various target views [76].
The main purpose of this study was to examine the specific landscape of Chiang Mai city. The viewpoint locations were considered with regard to historical and cultural significance and the relationship between heritage properties. As the cultural landscape of Chiang Mai city consisted of mountain and the heritage properties, particularly traditional temples, we considered the temples within the historical city wall as observer locations. There are more than 40 traditional temples in the city wall area, including abandoned temples. This study includes only the temples that are still in use because the abandoned temples have not remained in their original condition. They are only a ruined pagoda and inaccessible areas (such areas do not offer a viable location). Thus, 38 temples located within the city wall area were set as the viewpoint locations for this study. The viewpoints were placed at the access points of these 38 temples (No.1–38 in Figure 5). The observer height was set at 1.6 m above ground level according to an average human eye level.
3.1.2. Determination of the Mountain Skyline Levels (The Target View)
The view of the Doi Suthep mountain as seen from temples is the important skyline that defines Chiang Mai city’s image. This was used as the baseline for the analysis in the study.
This study focused on the natural skyline of the mountain, discovering that features appearing in the foreground could affect the attractiveness of the scene. According to the prior study, inappropriate building development has critical impacts, particularly vertical structures that negatively affect visual attractiveness and have a stronger impact than horizonal ones [77]. Therefore, to promote development in the city while protecting the views of the mountain, the city can set the mountain ridgeline as the baseline in determining proper buildings heights for future development. The studies focusing on aesthetic evaluation and preferences of building silhouette and mountain skyline suggested that the building height can be set in relation to the maximum height of the mountain [19,78]. Meanwhile, a recent study argued that the closest and lowest vegetation ridgeline with high value landscape elements could be the skyline threshold in setting the parameters for building-height intrusion because the closest ridgeline provides the mountain landscape with the most picturesque detail and results in better visual quality [79].
Moreover, as seen in the example of Kyoto city, a protected visual zone defines the levels of building height in relation to the height of the mountain where the temple heritage is located. In the case of this study, the studied mountain was where the three important temples were located, so this study took the similar step of utilizing the different height levels of the mountain ridgeline to identify the area sensitive to building obstruction. Three out of the four mountain temples are still active: Sri Soda temple, Pha Lad temple, and Phra That Doi Suthep temple. Their locations at elevation surface levels—350, 550, and 950 m, respectively—were determined as the protected visual zone (see Figure 6).
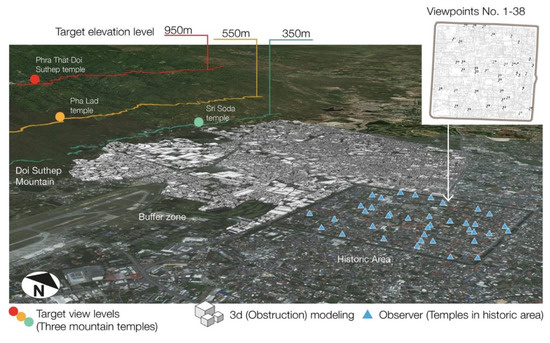
Figure 6.
Determination of mountain skyline levels and viewpoint locations (Source: Authors).
3.2. Three-Dimensional City Model Scenarios for Visual Impact Assessment
The existing condition of buildings and the future of buildings affected by the land use ordinance were considered visual obstructions in this study. The actual condition scenario served as the baseline for visual integrity to define the current situation in the study area. In contrast, the land use scenario simulated possible future situations and the efficiency of the land use ordinance in protecting visual integrity in the buffer area. Figure 7 illustrates the 3D city model process in this study using the conventional method of GIS 3D extrusion and computer-generated architecture.
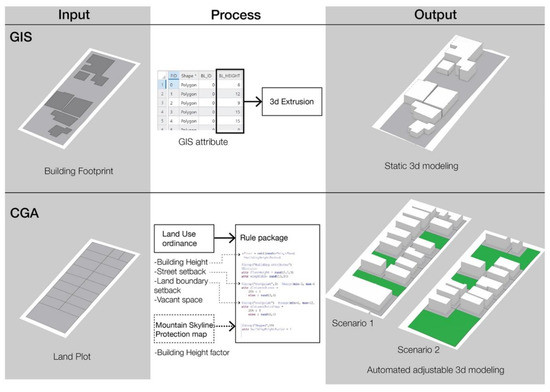
Figure 7.
GIS 3d extrusion and CGA 3d modeling (Source: Authors).
3.2.1. Conventional GIS 3D Extrusion for the Actual Condition Scenario (ACS)
The input parameter for the actual condition was critical in this study. The focus was on the baseline of visual obstruction. Building data for input parameters were existing shapefiles of building footprints transformed into 3D modeling in ArcGIS Pro using 3D analysis. The extruded building used the attribute of building height as the z value, and then the extruded polygon was used to retrieve the model. Because the study focused on the accuracy of 3D buildings based on DEM data of the ground surface, the extrusion type used in this study was the base height approach. The developed area comprised the secondary essential data. The existing building’s shapefile attribute contained the number of floors, calculated as the gross floor area (GFA). The GFA represented the developed area, which was calculated by multiplying the number of floors by the area of the footprint. The obstructed visual result was used to create the mountain skyline protection map. The map showed the location of the obstructed points that have been built up. The point was then processed using kernel analysis to determine the intensity of the visual obstruction. The kernel density map was used as an input parameter for the proposed scenario. When combined with visual assessment and developed area volume, this scenario served as the baseline for comparison with the following scenarios.
3.2.2. CGA (Computer-Generated Architecture) of Land Use Scenario (LUS) and Proposed Scenario (PPS)
The effectiveness of the current land use ordinance in protecting the visual integrity of the natural–cultural area was assessed in this finding. The simulation of future building compliance with the ordinance was required to evaluate the land use scenario. CGA, or computer-generated architecture, was the solution for simulating the 3D obstruction model. CGA is the systematic and procedural built-up environment generated by the area’s rules, determined in this study by its land use [80,81]. The user-defined rule file generated the 3D model through the initial shape from the CGA procedural [51,82,83]. ArcGIS CityEngine was used to create the 3D modeling in this process.
The initial shape in the study area was a land parcel/land plot. The rule was based on a land use zoning ordinance that specified the shape of a potential building. The rule in this study was building height, which was the result of floor height and the number of floors. However, Chiang Mai’s land use regulation determined only the maximum height permitted in each zone. As a result, the floor heights in this study ranged from 2.5 m to 3.0 m, with the number of floors varying from one to five. The zone’s land use ordinance determined the maximum number of floors; for example, if the zone’s land use ordinance specified a maximum height of 12 m, the maximum number of floors was four, and the maximum height was 12 m (3 m floor height × 4 number of floors). There were eight zoning ordinances in the study area that determined the maximum building height allowance. Furthermore, a less complicated rule to generate the model, such as setback from the street and building, was included in the CGA rule [84]. The building’s shape was adjusted and generated in a systematic manner based on its initial shape (land parcel).
In addition to the LUS, the proposed scenario (PPS) was evaluated to simulate the best-case scenario for the site’s visual integrity. The proposed scenario used the same set of zoning determinations and CGA method as LUS, but it included the mountain skyline protection map from the ACS as another factor in determining building height. Instead of the heritage adjacent zone, the proposed scenario allowed for the development of an appropriate zone. For example, in the northern part of the historical city, building heights are limited to 15 m. In this scenario, affected by the skyline map, they were reduced to 6–9 m, whereas in future areas of mixed-use/commercial zone, 15 m building height were allowed instead of the LUS’s 12 m. They contained the same buildings as the LUS, but with different building heights based on the mountain skyline protection map’s coefficient. As a result, the CGA rule was based on the LUS, but with the additional coefficient factor of the mountain skyline protection map to multiply the number of floors, whereas some zones decreased them, especially those adjacent to historical areas, and some zones increased, ranging from −2 to 2 floors, but none exceeded 15 m. Table 2 indicates the input parameter and factors that generated the 3D modeling of each scenario.
Table 2.
Input parameter and factors to generate 3D modelling by scenario.
The generated models in LUS and PPS represented views obstructed by buildings in the same way that the actual condition scenario did. To evaluate the land use ordinance’s efficacy as LUS and simulate the best-case scenario as PPS, the model was further embedded in the DEM as ground elevation. The developed area was generated as GFA by CityEngine. The model and its attributes were transferred to ArcGIS as the geodatabase for visual evaluation and comparison with the actual condition scenario.
3.3. Mountain Skyline Obstruction Analysis
This analysis identified the area sensitive to building height with regard to the three ridgelines of the mountain mentioned above. In this case, the linear line of sight (LLOS) tool in ArcGIS 2.7 (ESRI Inc., Redlands, CA, USA) was applied, which determines if one or more targets are visible from a given viewpoint considering elevation surface and obstruction within a visual radius in the calculation of visibility analysis. The tool requires specific materials for input in the analysis parameter–elevation surface, multipatch building data, viewpoint data, and target point data. This study used the Digital Elevation Model (DEM) with a resolution of 30 m × 30 m provided by NASA’s EARTHDATA [85]. Viewpoint data needs to determine the value of the field of view (FOV) and observer’s height for the visibility analysis. In general, 124 degrees is the proper value to set as the human visual field [86,87], and the observer’s height should be set at 1.6 m above the ground level according to the average human eye level. Therefore, when setting the FOV at 124 degrees in the initial experiment, the visible area was found to cover the studied mountain. Therefore, it can be assumed that the observer could see the whole range of the mountain. Hence, the FOV value was not required to set in this phase of analysis (see Table 3).
Table 3.
The Input Data Types and Values for the Analysis Parameter.
The tool works by creating sightlines that extend from the observer to the viewing target (point data) and determining visibility along the created lines. The point data were set as the target view at each elevation level. The distance from the north to south of the mountain is approximately 5 km, so that we created the target point data at every 100 m distance, 50 points in total owing to the limitation of computation. After that we conducted the LLOS analysis for all 38 viewpoints separately and with regard to three elevation levels. Finally, the locations of obstructing buildings were identified, and the zone of mountain skyline sensitivity was later defined considering the number of obstructing buildings (see Figure 8).
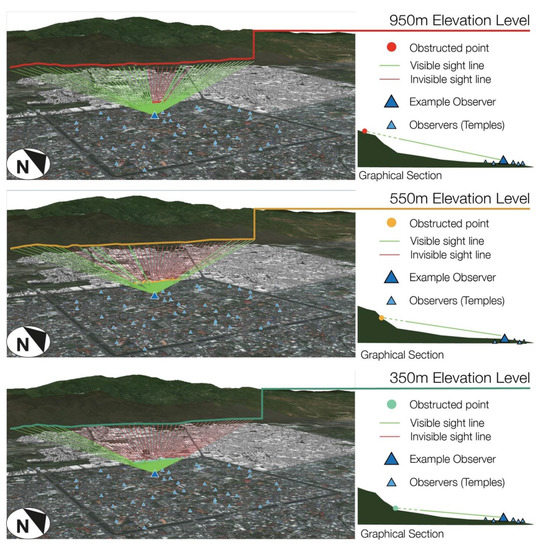
Figure 8.
Mountain skyline obstruction analysis (Source: Authors).
3.4. Calculation of Protected and Development Areas
In all scenarios, the visible area proportion of the mountain was determined as the protected area for this study. It was measured by the viewshed, the raster-based analysis tool to determine the visible areas of the wide topographic vista with different terrain heights from one or more observers. The tool created outputs to represent visible and invisible surface areas indicated by values of 1 and 0, respectively. As this study attempted to examine the visible area of a particular mountain and the number of observers who can see it, which may increase or decrease according to different scenarios, the cumulative viewshed was rather suitable. This tool required elevation surface, building data, and viewpoint data for the analysis parameters. In this case, the value of viewpoint data was set at a 124-degree FOV and the observer’s height at 1.6 m above the ground level. In addition, the Digital Elevation Model (DEM) was used as the input elevation surface for viewshed analysis (see Table 3). However, the original DEM data only represented the bare ground surface and excluded building data such as heights or locations. Therefore, this study generated the surface map by combining building data into the ground elevation (DEM). As a result, the new raster dataset was created for analysis. Finally, the visible mountain area was computed in square meters (m2), as indicated by the output surface raster (see Figure 9).
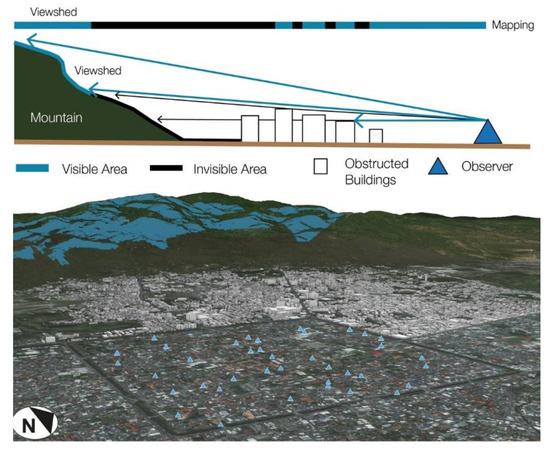
Figure 9.
Viewshed analysis (Source: Authors).
This study considered the total gross floor area (GFA) of each scenario for the development area. The number of floors was multiplied by the footprint area contained in the building shapefile’s attributes, and all the values were aggregated. The GFA of both scenarios was calculated in square meters (m2).
By applying all the results from the mountain skyline obstruction analysis, calculations of the protected and development areas were compared (see Figure 10).
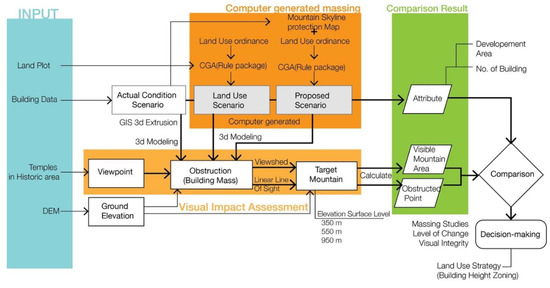
Figure 10.
Research methodology.
4. Results and Discussion
In the ACS results, the 3D modeling was noticeably varied in its height and mass (see Figure 11a). The historical city is bordered by medium- and high-rise buildings, which include massive buildings in the northwest and medium-rise buildings along this corridor. Meanwhile, high-rise facilities buildings cluster near the historical area in the west corridor to the mountain, but they are still farther away than the northwest buildings cluster. As seen in the example in Figure 11b, the viewshed analysis result revealed the visible area of the mountain; in the ACS, it was abundantly obvious that the low-to-mid elevation area was cut off and invisible. The northwest corridor leading to the mountain was the most obscured area on the viewshed map. The ACS’s 3D modeling largely obstructed the line of sight in the northwest of the historical area; even the 950 m elevation LLOS was obstructed in this location, according to the LLOS analysis, which was consistent with the viewshed analysis (See Figure 11a,c). The highly obstructed LLOS can be seen in the obstruction location and density maps (see Figure 11d–f). According to the kernel density map, the obstruction location was pervasive in the northwest corridor. This high level of obstruction might be the cause of the invisible viewshed area in the mountain’s low-to-mid elevation. The west corridor to the mountain appeared to be obstructed by buildings along the west corridor, though not to the same extent as the northwest corridor. Although the LLOS in the northwest area was seriously obstructed at 950 m, the viewshed result still presented a visible area in the mid-high level of the mountain, and the mid-to-high elevation level was still intact.
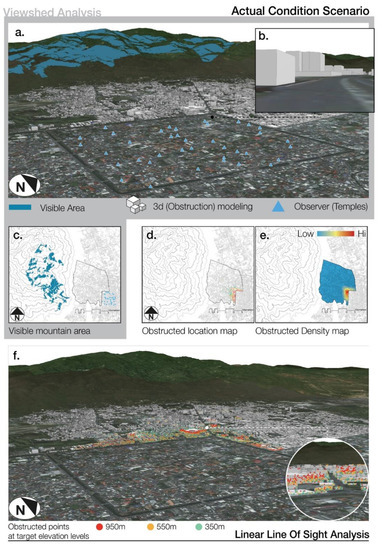
Figure 11.
Results of the Actual Condition Scenario (a) Viewshed result in 3D (b) A sample view at human eye-level (c) Viewshed map (d) Obstructed location map (e) Obstructed density map (f) Obstructed locations at three elevation levels (Source: Authors).
Because the land plot size varied for the LUS, the 3D modeling that simulated the land use ordinance, the CGA was able to generate different sizes of 3D mass based on its land because of the minimal distribution in the building height range, which was limited to 12–15 m (see Figure 12a,b). The low level of building height influenced the viewshed study outcome; the observers could see the low-mid-high elevation area (temples) (see Figure 12a,c). Consistent with the viewshed result, the 950 m elevation level had visibility lines and a few obstructions. In the northwest and west corridors, the 550 m and 350 m elevations were currently the most obstructed LLOS (see Figure 12d–f). According to the obstructed location and density maps, the obstructed locations continued to cluster in the historical city’s northwest. These maps illustrated the critical location for view protection from the temples to the mountain, which was identical to the ACS location. On the other hand, the kernel density clustered primarily at the northwest corner and did not extend into the corridor. Under LUS height regulation, visual impediments in the west section and its corridor were at a minimum. In summary, the LUS was significantly beneficial in terms of protecting visual integrity, and both viewshed and LLOS findings revealed improved performance. Nonetheless, this scenario was entirely based on regenerated buildings at the study site to assess the efficacy of a recent land use ordinance with the aim of preserving the site’s conservation area.
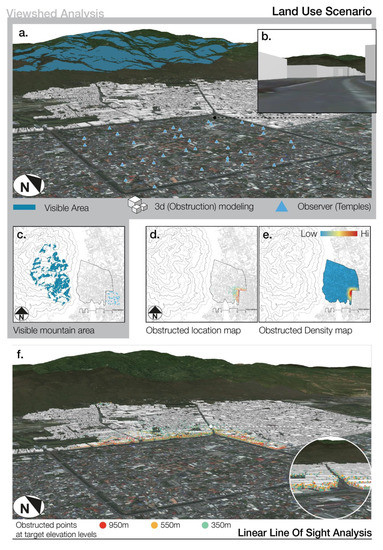
Figure 12.
Results of the Land Use Scenario (a) Viewshed result in 3D (b) A sample view at human eye-level (c) Viewshed map (d) Obstructed location map (e) Obstructed density map (f) Obstructed locations at three elevation levels (Source: Authors).
The generated 3D modeling for the PPS was influenced by the mountain skyline protection map. The map was utilized as a factor in determining whether to raise or lower building heights in accordance with LUS’s land use ordinance. According to the mountain skyline protection map, the building height adjacent to the historical city was reduced from 12–15 m to 3–6, or 6–9 m, mainly in the northwest and west of the historical city (see Figure 13a,b). On the contrary, the greater the distance from the historical city of the commercial/mixed-use zoning ordinance, the higher the building height. Depending on the land plot and addition regulations, this ranged from 9–12 m to 12–15 m. This map’s conditional factor strengthened the viewshed and LLOS while still allowing the development area to grow. The viewshed analysis result reflected the intention of view protection. It completed the viewable region of Doi Suthep mountain (See Figure 13a,c). All elevation levels were visible. The LLOS data demonstrated a decrease in the number of obstructed lines of sight, particularly in the historical area’s northwest corner. The obstructed location and kernel density map confirmed the efficiency of PPS in view protection; the high-density area was greatly reduced (see Figure 13d–f). It was concentrated in the northwest but had a low density, indicating that the buildings obstructed fewer lines of sight.
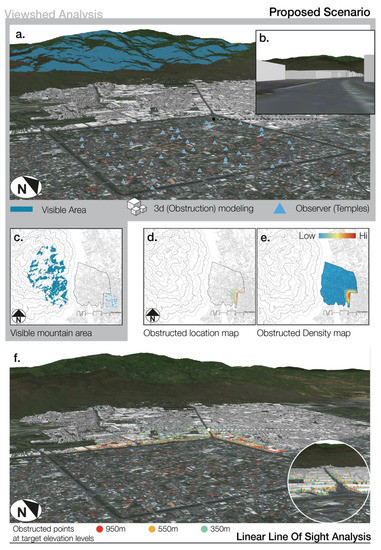
Figure 13.
Results of the Proposed Scenario (a) Viewshed result in 3D (b) A sample view at human eye-level (c) Viewshed map (d) Obstructed location map (e) Obstructed density map (f) Obstructed locations at three elevation levels (Source: Authors).
The LLOS 3D view indicated a sparsely obstructed points of 950 m and 550 m (red and orange, respectively), with the majority of the obstructed points being at 350 m elevation level (see Figure 11, Figure 12 and Figure 13). This resembled the LUS, including the coherence with the viewshed analysis and LLOS. The land use ordinance, which was also implicated in this scenario, proved to protect views effectively. To improve visual integrity, the mountain skyline protection used in this scenario demonstrated its ability to reduce visual intrusion in both study outcomes while retaining the development area by relocating high (high-rise) buildings to the appropriate zones.
Scenarios Comparison
According to the results shown in Table 4, the actual condition scenario (ACS) had a total number of buildings of 10,663, while the land use scenario (LUS) and the proposed scenario (PPS) had 12,256 in total. They were not significantly different in terms of the number of buildings. There would be 1593 more buildings if all land plots were built up. The LUS and PPS shared the same land plots and rule package, as stated in the methodology. Thus, the number of buildings and average building height shared similar values, with the only difference being the building height locations in zones defined by the mountain skyline protection map.
Table 4.
Results of the linear line of sight and viewshed analysis, the area calculation, and change (%).
In effect, lower building height contributed to more mountain visibility. The lower the building heights, the easier it was to see the mountain area. The perceptual scenes with the same viewpoint at human eye level, as depicted in the square frame image, showed that the LUS and PPS provided more visible areas of the mountain than the ACS scene (see Figure 11, Figure 12 and Figure 13a–c). Considering each elevation surface level, the number of obstructing buildings was less significantly changed (%) at all levels, except the 950 m elevation surface, where the number of obstructing buildings in the LUS decreased to nearly half the number in the ACS (LUS at 681 compared to ACS at 1011). As expected, the number of obstructing buildings in the PPS decreased 77% from that of the ACS (PPS at 568). Moreover, the 550 m and 350 m elevation surfaces in the PPS decreased 24 and 7.2%, respectively, while the LUS was only 550 m decreased at 7.95%. The visible mountain area of the ACS was 6,805,800 m2, the LUS was 8,902,800 m2, and the PPS was 9,016,200 m2, which were increased 21.56 and 24.52% from the ACS, respectively (see Table 4).
As shown in Figure 11, Figure 12 and Figure 13d–f, the locations of obstructing buildings and their heights in the area near the city wall were critical, considering height. The obstruction locations were mostly the buildings in the ACS that were higher than 9 m and in the LUS and PPS where the height was limited at 12 m. The building height in the ACS was also considerably high. The obstruction points were concentrated in the buildings higher than 23 m. This meant that the high buildings in the northwest area near the city wall affected the mountain visibility, and in order to protect the visual integrity of the heritage, the height of buildings within the zone should be lower than those determined by the current land use regulation. The land use ordinance showed an effective performance at safeguarding the visual connection in both the LUS and PPS. Additionally, the increased view protection variables from the mountain skyline protection map were applied to the PPS to limit the height in an adjacent historical region while constructing buildings in more suitable places revealed a significant difference in view protection from the ACS and LUS. Furthermore, the LUS and PPS suggested that greater distance can allow the building height at higher levels, such as 15 m, when other essential factors are considered.
The above results indicated that lowering the height of buildings does not mean decreasing development area. The number of buildings was not significantly different between both scenarios. However, the results indicated the possibility for development areas that increase 66% in both the LUS and PPS if determining the building height according to land use regulation. This indicated that the land use regulation can protect the visual integrity of the city’s cultural landscape and encourage development growth in appropriated areas such as mixed-use and commercial zones that are nonadjacent to the historical area.
There was a significant change in the level of visual obstruction, with the obstruction at 350 m elevation slightly decreasing. Because of the rising angle of elevation, the lowest level of elevation was the most obstructed, even by a low-to-mid building height. To qualify the level of change in visual obstruction, the study found that the radius from the historical area, as defined by temple observers, was clustered along the eastern and northern parts of the historical area. According to this discovery, the area adjacent to the historical city may require a higher intensity of visual height control, differing from 12 m in the 2012 land use ordinance (4 floors) to 6–9 m (2–3 floors), depending on the distance from the historical area (see Figure 14). On the other hand, the greater the distance from the historical city, the greater the possibility for the building to increase its height for development purposes from 12 m to 15 or 18 m (from 4 floors to 5–6 floors). Even though the developed area volume in the LUS and PPS was increased by more than threefold, the scenario used the maximum developed area capacity of 70%. Furthermore, it is necessary to achieve a balance between the buffer of a protected area (lower building height) and the opportunity for the city to grow as a developed area (increased building height). The findings of this study indicated that an urban plan capable of intensifying and qualifying visual control to protect the historical area as a buffer area should be implemented. Although the LUS and PPS are idealistic generated scenarios, the method proved to be useful in assessing the effective performance of land use ordinances and establishing the leverage in negotiations between view protection and city development growth.
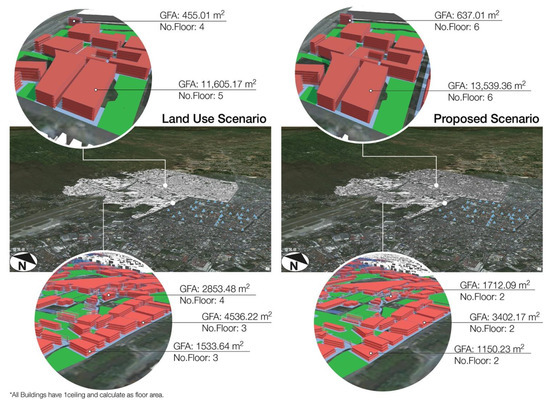
Figure 14.
Comparison of development areas between LUS and PPS (Source: Authors).
Between the ACS, LUS, and PPS, nearly every zoning ordinance stated a maximum building height of 12 m, but the ordinance cannot be enforced for the ACS buildings that exceeded the 2012 urban plan before it was enacted. Some ACS buildings in the commercial zone and facility zone adjacent to a historical area have had significant negative effects on the visual integrity of the area; these buildings, especially those in the facility zone, cannot be changed to comply with the 2012 urban plan building height level. Notably, at least for the expansion of these facilities, the relocation option may be considered to reduce the adversary effect, not only on the historical area’s visual integrity but also on other factors. On the other hand, the study indicated that the sensitive area for visual protection adjacent to the historical area for the commercial ordinance zone comprised of the medium-density residential zone. The commercial area in this sensitive zone could be separated or new overlay zoning created to reduce the visual threat of low-mid-rise building height. To comply with this protection ideology while minimizing the impact on urban economic growth, the medium-density residential area farther away from the historical area may allow mid-rise as the maximum allowed height of buildings. The Transfer Development Right (TDR) is an intriguing tool to consider in this situation. The commercial area may be able to transfer the development rights of the area, with height as an intensive bonus, to a medium-density residential area.
Moreover, this study defined the buffer zone’s boundary to provide adequate supportive protection for the interlinkage of the natural–cultural heritage of Chiang Mai city. In general, it has been set as 200–400 m around the property [11], while this study suggested setting it based on the potentially obstructed location. The area around the city wall should be set as another layer in addition to the buffer to determine the level of management/control and ensure that uses and activities in the adjacent area will not adversely impact the visual integrity of the mountain-historical city (see Figure 11). In this area, it can be useful to more closely define zoning intensity than in other areas to protect potential visual threats from mid-rise and high-rise buildings.
5. Conclusions
Previous investigation of changes in the urban landscape has frequently taken the form of map visualization in response to development dynamics, but limited data are available. As a result, numerical data are equally vital for decision making, particularly when it comes to the foreseeable protected and development areas because they provide a concrete estimate of the plan’s benefits, both to heritage and the local community. This research provided a measurable approach for exploring, measuring, and comparing the area as well as possible changes in the urban landscape, which can be considered in future development designations. However, the calculation was based only on the building area without considering its uses and design, which could impact the outcome.
Many historical cities have demonstrated potential approaches to creating criteria for development zoning and assessing building intrusion impact on the visual integrity of the distinctive skyline expressed by historical structures. This study applied the 3D-GIS-based analysis to contribute planning criteria for building heights to support conservation of Chiang Mai city’s significant skyline as expressed by the mountain and the historical city. This study used 3D-GIS-based analysis as a visualizing tool in the context of landscape conservation. The ability to project changes to the city’s important skyline based on the maximum heights permitted in the land parcel was enabled by 3D city modeling, making it more accessible to a wider range of users and providing stakeholders with the complete picture. This will support spatial governance by facilitating discussion and enhancing dialogue among diverse stakeholders, resulting in increased transparency in government decision making. All 3D modeling were viable for comparative evaluation when used with GIS visual analysis. They were able to define an acceptable amount of change and evaluate the effectiveness of land use ordinances in protecting the visual integrity of historical cities and natural resources such as mountains.
This study’s main visual assessment methods were the linear line of sight and the viewshed analysis. The temples in the historical city of Chiang Mai were chosen as observer locations, while the mountain that provides a natural resource for the city was chosen to be targeted, to highlight the cultural element that is expressed through its natural setting. As for Chiang Mai, the important landscape elements of the religious city were identified as temples according to their cultural significance. This study found that by conducting LLOS analysis on various heights of the mountain ridgeline, it was possible to assess the mountain skyline obstruction and identify the building height sensitive zone. As a result, the ridgeline elevation levels for the targeted mountain were determined by three temples on the mountaintop. The LLOS was able to reveal extensive information on the obstructed view location from the observer to a target, where the 3D modeling of the scenario was located. Furthermore, the viewshed analysis was crucial for extracting visible areas and determining the protected area as an overview visual visibility area of the entire mountain at the same location as observer and target. Then, the additional development areas in different scenarios retrieved from 3D modeling provided supportive information for discussing optimum criteria for future development allowed in the buffer zone and the future benefits. In response to the study’s objective, various scenarios (ACS, LUS, and PPS) provided visual assessment results and the number of development areas to be considered and plausible criteria for a forthcoming land use ordinance.
The results revealed that current building height zoning and land use regulation can protect the cultural landscape’s integrity. The LLOS result improved the most in the 950 m surface level of LUS and PPS, from 48.5 to 78%, respectively. In the best-case scenario of PPS, it enhanced the LLOS at 550 and 350 m, which LUS slightly increased. In addition, using viewshed analysis in both LUS and PSS, the overall mountain visibility area increased by about a quarter compared to the ACS. Furthermore, the PPS revealed the optimal building height requirement to ensure adequate preservation of the mountain skyline by restricting building height adjacent to the historical city region. The economic growth allowance continued to perform well in terms of the development area, with both scenarios increasing by more than 65%. These critical results suggested that the mountain skyline obstruction analysis can be used as a tool for establishing quality control in visual resources and is an appropriate measure to mitigate the adversary visual impact of development with optimum/reasonable intensity of control rather than zoning the same height in the whole area; as shown in this study, the area close to the city wall requires a more intense level of height controls in order to reduce the adverse impacts of the inappropriate built environment on the interlinkage of mountain-urban heritage. To protect the interlinkage in the natural–cultural area described in this study, a stronger land use ordinance may be required. Meanwhile, proper zones of land use distant from the historical city should allow for additional building height to encourage urban development growth. Balancing preservation and urban development in a visual integrity strategy is challenging. To encourage implementation, planning management instruments such as the Transfer Development Right (TDR) allow the exchange of rights in land-plot ownership, and an incentive bonus such as lower taxation for owners who comply with the visual protection is necessary. These innovative urban planning strategies to promote visual integrity balancing might be implemented through overlay planning that superimposes the current land use ordinance and/or is included in the upcoming land use ordinance of Chiang Mai historical city.
In the absence of appropriate buffer zone management of Chiang Mai city, the approach to determine the buffer zone in this study can provide an alternative way to define the protected boundary by considering the levels of visible mountain ridgeline and locations of intrusive buildings. This could be a starting point for the city in setting the buffer boundary. It sheds some light on the UNESCO buffer zone definition and the visual integrity in mountain-urban heritage. In the same way, as Kyoto’s view protection plan attempts to safeguard the important tangible heritage by supporting the strong relationship between nature and heritage, Chiang Mai shares the proximity of a mountain and a religious city. Furthermore, as recommended by the city of Vilnius, it is necessary to build a technological platform to communicate and balance the challenges of change management in accordance with the Historic Urban Landscape approach to protect visual integrity. The finding could aid the city in deciding land allocation for high building construction and defining the level of change management and control. It is true that we cannot demolish excessively tall buildings to give them a new height. Furthermore, in most circumstances, the regulation has no retroactive consequence, and it cannot control existing buildings. As a result, by employing two scenarios, this study attempted to provide a comprehensive picture of what could occur following the execution of a specific proposal. On the other hand, the LUS and PPS are idealistic scenarios for evaluating the performance of the land use regulation and offering the best-case scenarios to the historical city area. Apart from visual integrity, this study disregarded potentially concerning issues, such as natural/environmental factors or any socioeconomic issues. Further research can be conducted to extend the findings of this study and provide a clear direction for ensuring the impact and outcome of proposal development.
Author Contributions
J.S. designed the study, conducted the analysis, interpreted the conclusion, and contributed to the mapping of Chiang Mai city; N.M. and N.S. conceived the study, discussed the analysis, and participated in revising the manuscript. All persons designated as authors qualified for authorship, they participated sufficiently in the work to take public responsibility for portions of the content. J.S., as corresponding author, takes responsibility for the integrity of the work from inception to published article. All authors have read and agreed to the published version of the manuscript.
Funding
This study was supported by JSPS KAKENHI, Grant Numbers JP20KK0101 and JP20F40066, and was conducted as research of the ICT Machizukuri Design project of SDGs research institute at Saga University.
Institutional Review Board Statement
Not applicable.
Informed Consent Statement
Not applicable.
Data Availability Statement
The datasets generated during and/or analyzed during the current study are not publicly available due to [CONTAINING INFORMATION THAT COULD COMPROMISE RESEARCH PARTICIPANT PRIVACY] but are available from the corresponding author on reasonable request.
Acknowledgments
The authors would like to express deep gratitude to the Department of Civil Engineering and Architecture for Doctoral student positions during the research conducted.
Conflicts of Interest
The authors declare no conflict of interest.
References
- Cullen, G. The Concise Townscape; Reinhold Publishing Corporation: New York, NY, USA, 1961. [Google Scholar]
- UNESCO. The UNESCO Recommendation on the Historic Urban Landscape Report of the Second Consultation on its Implementation by Member States, 2019 UNESCO World Heritage Centre. 2019. Available online: https://whc.unesco.org/en/hul/ (accessed on 14 February 2022).
- Taylor, K. Cities as Cultural Landscapes. In Reconnecting the City: The Historic Urban Landscape Approach and the Future of Urban Heritage; Bandarin, F., van Oers, R., Eds.; John Wiley & Sons, Ltd.: Hoboken, NJ, USA, 2015; pp. 179–202. [Google Scholar]
- Larsen, P.B.; Wijesuriya, G. Nature-Culture Interlinkages in World Heritage: Bridging the Gap. Georg. Wright Soc. 2017, 34, 142–153. [Google Scholar]
- Antrop, M. Balancing heritage and innovation—The landscape perspectives. BSGLg 2017, 69, 41–51. [Google Scholar]
- UNESCO. Dresden Is Deleted from UNESCO’s World Heritage List; United Nations World Tourism Organization: Madrid, Spain, 2009. [Google Scholar]
- Blanchard, B. Historic Centre of Vienna inscribed on List of World Heritage in Danger—UNESCO World Heritage Centre . 6 July 2017. Available online: https://whc.unesco.org/en/news/1684 (accessed on 22 March 2022).
- Palanivel, T. Rapid Urbanisation: Opportunities and Challenges to Improve the Well-Being of Societies|Human Development Reports. 6 September 2017. Available online: https://hdr.undp.org/en/content/rapid-urbanisation-opportunities-and-challenges-improve-well-being-societies (accessed on 22 March 2022).
- Ehrlich, D.; Melchiorri, M.; Capitani, C. Population Trends and Urbanisation in Mountain Ranges of the World. Land 2021, 10, 255. [Google Scholar] [CrossRef]
- Rössler, M.; Lin, R.C.-H. Cultural Landscape in World Heritage Conservation and Cultural Landscape Conservation Challenges in Asia. Built Herit. 2018, 2, 3–26. [Google Scholar] [CrossRef]
- UNESCO. World Heritage and Buffer Zones. UNESCO World Heritage Centre. 2009. Available online: https://whc.unesco.org/en/series/25/ (accessed on 22 May 2021).
- Pereira Roders, A. Lessons from the Island of Mozambique on Limits of Acceptable Change. In Swahli Historic Urban Landscapes: Report on the Historic Urban Landscape Workshops and Field Activities on the Swahili Coast in East Africa 2011–2012; van Oers, R., Haraguchi, S., Eds.; UNESCO: Paris, France, 2013; pp. 40–49. [Google Scholar]
- Azpeitia, A.; Id, S.; Garai-Olaun, A.A.; De, A.; Fuente, L.; Id, A. Historic Urban Landscapes: A Review on Trends and Methodologies in the Urban Context of the 21st Century. Sustainability 2018, 10, 2603. [Google Scholar] [CrossRef]
- Danese, M.; Nolè, G.; Murgante, B. Visual Impact Assessment in Urban Planning. Geocomput. Urban Plan. 2009, 176, 133–146. [Google Scholar]
- Greater London Authority. London View Management Framework. 2012. Available online: https://www.london.gov.uk/what-we-do/planning/implementing-london-plan/planning-guidance-and-practice-notes/london-view-management%0Awww.london.gov.uk (accessed on 21 November 2021).
- Moggridge, H. Visual analysis: Tools for conservation of urban views during development. In Managing Historic Cities; van Oers, R., Haraguchi, S., Eds.; UNESCO World Heritage Centre: Paris, France, 2010; pp. 65–71. [Google Scholar]
- Forczek-Brataniec, U. Assessment of Visual Values as a Tool Supporting the Design Decisions of the Cultural Park Protection Plan. The Case of Kazimierz and Stradom in Kraków Chair of Landscape Architecture. Sustainability 2021, 13, 6990. [Google Scholar] [CrossRef]
- Hernández, J.; García, L.; Ayuga, F. Assessment of the visual impact made on the landscape by new buildings: A methodology for site selection. Landsc. Urban Plan. 2004, 68, 15–28. [Google Scholar] [CrossRef]
- Zacharias, J. Preferences for view corridors through the urban environment. Landsc. Urban Plan. 1999, 43, 217–225. [Google Scholar] [CrossRef]
- Nutsford, D.; Reitsma, F.; Pearson, A.L.; Kingham, S. Personalising the viewshed: Visibility analysis from the human perspective. Appl. Geogr. 2015, 62, 1–7. [Google Scholar] [CrossRef]
- Akristiniy, V.A.; Dikova, E.A. The visual-landscape analysis during the integration of high-rise buildings within the historic urban environment. E3S Web Conf. 2018, 33, 01044. [Google Scholar] [CrossRef]
- Germino, M.J.; Reiners, W.A.; Blasko, B.J.; McLeod, D.; Bastian, C.T. Estimating visual properties of rocky mountain landscapes using GIS. Landsc. Urban Plan. 2001, 53, 71–83. [Google Scholar] [CrossRef]
- Wright, D.K.; Maceachern, S.; Lee, J. Analysis of Feature Intervisibility and Cumulative Visibility Using GIS, Bayesian and Spatial Statistics: A Study from the Mandara Mountains. PLoS ONE 2014, 9, 112191. [Google Scholar] [CrossRef] [PubMed][Green Version]
- Bartie, P.; Mackaness, W. Improving the sampling strategy for point-to-point line-of-sight modelling in urban environments. Int. J. Geogr. Inf. Sci. 2016, 31, 805–824. [Google Scholar] [CrossRef]
- Huss, R.E.; Pumar, M.A. Effect of Database Errors on Intervisibility Estimation. Photogramm. Eng. Remote Sens. 1997, 63, 415–424. [Google Scholar]
- Weitkamp, G.; Bregt, A.; van Lammeren, R. Measuring Visible Space to Assess Landscape Openness. Landsc. Res. 2011, 36, 127–150. [Google Scholar] [CrossRef]
- Yu, S.M.; Han, S.S.; Chai, C.H. Modeling the value of view in high-rise apartments: A 3D GIS approach. Environ. Plan. B Plan. Des. 2007, 34, 139–153. [Google Scholar] [CrossRef]
- Yasumoto, S.; Jones, A.P.; Nakaya, T.; Yano, K. The use of a virtual city model for assessing equity in access to views. Comput. Environ. Urban Syst. 2011, 35, 464–473. [Google Scholar] [CrossRef]
- Saeidi, S.; Mirkarimi, H.; Mohammadzadeh, M.; Salmanmahiny, A.; Arrowsmith, C. Assessing the visual impacts of new urban features: Coupling visibility analysis with 3D city modelling. Geocarto Int. 2018, 34, 1315–1331. [Google Scholar] [CrossRef]
- Sfakiotaki, D. Analysis of Movement in Sequential Space: Perceiving the Traditional Japanese Tea and Stroll Garden. 2005. Available online: http://herkules.oulu.fi/isbn9514276531/ (accessed on 20 March 2022).
- World Bank Group. Cultural Heritage, Sustainable Tourism and Urban Regeneration: Capturing Lessons and Experience from Japan with a Focus on Kyoto; World Bank Group: Washington, DC, USA, 2018. [Google Scholar]
- European Unions. Local Action Plan: Vilnius Old Town. Vilnius. 2011. Available online: https://urbact.eu/sites/default/files/vilnius_action_plan.pdf (accessed on 10 December 2021).
- ICOMOS. The Florence Declaration on Heritage and Landscape as Human Values; ICOMOS: Florence, Italy, 2014. [Google Scholar]
- UNESCO. Historic Centre of Florence—UNESCO World Heritage Centre. Available online: https://whc.unesco.org/en/list/174/?fbclid=IwAR2OMMlnbMpc7Ai2N2b85sgPH_eB2pZOR8Vnw1h6m-3i1z8VThvS24cs0as (accessed on 14 April 2022).
- UNESCO. Monitoring of the Management Plan of the Historic Centre of Florence; UNESCO: Florence, Italy, 2018. [Google Scholar]
- UNESCO. The Management Plan of the Historic Centre of Florence; UNESCO: Florence, Italy, 2016. [Google Scholar]
- Jagiełło, M. Do We Need a New Florence Charter? The Importance of Authenticity for the Maintenance of Historic Gardens and Other Historic Greenery Layouts in the Context of Source Research (Past) and Taking into Account the Implementation of the Sustainable Development Idea (Future). Sustainability 2021, 13, 4900. [Google Scholar] [CrossRef]
- Guney, C.; Girginkaya, S.; Cagdas, G.; Yavuz, S. Tailoring a geomodel for analyzing an urban skyline. Landsc. Urban Plan. 2012, 105, 160–173. [Google Scholar] [CrossRef]
- Imottesjo, H.; Kain, J.-H. The Urban CoCreation Lab—An Integrated Platform for Remote and Simultaneous Collaborative Urban Planning and Design through Web-Based Desktop 3D Modeling, Head-Mounted Virtual Reality and Mobile Augmented Reality: Prototyping a Minimum Viable Product and Developing Specifications for a Minimum Marketable Product. Appl. Sci. 2022, 12, 797. [Google Scholar] [CrossRef]
- Fagerholm, N.; Käyhkö, N.; Ndumbaro, F.; Khamis, M. Community stakeholders’ knowledge in landscape assessments—Mapping indicators for landscape services. Ecol. Indic. 2012, 18, 421–433. [Google Scholar] [CrossRef]
- Pantić, M.; Cilliers, J.; Cimadomo, G.; Montaño, F.; Olufemi, O.; Torres Mallma, S.; van den Berg, J. Challenges and Opportunities for Public Participation in Urban and Regional Planning during the COVID-19 Pandemic—Lessons Learned for the Future. Land 2021, 10, 1379. [Google Scholar] [CrossRef]
- Peluchetti, A.; Guazzi, G.; Lucchi, E.; Dall’Orto, I.; Polo López, C.S. Criteria for building types selection in preserved areas to pre-assess the Building Integrated Photovoltaics solar potential—The case study of Como land area. IOP Conf. Ser. Earth Environ. Sci. 2021, 863, 012003. [Google Scholar] [CrossRef]
- Imottesjo, H.; Kain, J.H. The Urban CoBuilder—A mobile augmented reality tool for crowd-sourced simulation of emergent urban development patterns: Requirements, prototyping and assessment. Comput. Environ. Urban Syst. 2018, 71, 120–130. [Google Scholar] [CrossRef]
- Allen, M.; Regenbrecht, H.; Abbott, M. Smart-phone augmented reality for public participation in urban planning. In Proceedings of the 23rd Australian Computer-Human Interaction Conference, Canberra, Australia, 28 November 2011; pp. 11–20. [Google Scholar]
- Gill, L.; Lange, E. Getting virtual 3D landscapes out of the lab. Comput. Environ. Urban Syst. 2015, 54, 356–362. [Google Scholar] [CrossRef]
- Du, J.; Zou, Z.; Shi, Y.; Zhao, D. Zero latency: Real-time synchronization of BIM data in virtual reality for collaborative decision-making. Autom. Constr. 2018, 85, 51–64. [Google Scholar] [CrossRef]
- Bouchlaghem, D.; Shang, H.; Whyte, J.; Ganah, A. Visualisation in architecture, engineering and construction (AEC). Autom. Constr. 2005, 14, 287–295. [Google Scholar] [CrossRef]
- Hudson-Smith, A.; Evans, S.; Batty, M. Building the virtual city: Public participation through e-democracy. Knowl. Technol. Policy 2005, 18, 62–85. [Google Scholar] [CrossRef]
- Thoneick, R. Integrating Online and Onsite Participation in Urban Planning. Int. J. E-Plan. Res. 2021, 10, 1–20. [Google Scholar] [CrossRef]
- Thrift, N.; French, S. The automatic production of space. Trans. Inst. Br. Geogr. 2002, 27, 309–335. [Google Scholar] [CrossRef]
- Wang, X.; Song, Y.; Tang, P. Generative urban design using shape grammar and block morphological analysis. Front. Archit. Res. 2020, 9, 914–924. [Google Scholar] [CrossRef]
- Jan, H.; Kunze, A.; Schmitt, G. Using shape grammars for master planning. In Design Computing and Cognition 08—Proceedings of the 3rd International Conference on Design Computing and Cognition; Springer: Dordrecht, The Netherlands, 2008; pp. 655–673. [Google Scholar] [CrossRef]
- Stouffs, R.; Janssen, P. A Rule-Based Generative Analysis Approach for Urban Planning; Springer: Singapore, 2017; pp. 125–136. [Google Scholar] [CrossRef]
- Koziatek, O.; Dragićević, S. iCity 3D: A geosimualtion method and tool for three-dimensional modeling of vertical urban development. Landsc. Urban Plan. 2017, 167, 356–367. [Google Scholar] [CrossRef]
- Schnabel, M.A.; Zhang, Y.; Aydin, S. Using Parametric Modelling in Form-based Code Design for High-dense Cities. Procedia Eng. 2017, 180, 1379–1387. [Google Scholar] [CrossRef]
- Müller, P.; Wonka, P.; Haegler, S.; Ulmer, A.; van Gool, L. Procedural modeling of buildings. In ACM SIGGRAPH 2006 Papers; Association for Computing Machinery: New York, NY, USA, 2006; pp. 614–623. [Google Scholar] [CrossRef]
- Shirinyan, E.; Petrova-Antonova, D. Geo-Information Modeling Buildings in CityGML LOD1: Building Parts, Terrain Intersection Curve, and Address Features. Int. J. Geo-Inf. 2022, 11, 166. [Google Scholar] [CrossRef]
- García-Esparza, J.A.; Altaba Tena, P. A GIS-based methodology for the appraisal of historical, architectural, and social values in historic urban cores. Front. Archit. Res. 2020, 9, 900–913. [Google Scholar] [CrossRef]
- Xu, Z.; Coors, V. Combining system dynamics model, GIS and 3D visualization in sustainability assessment of urban residential development. Build. Environ. 2012, 47, 272–287. [Google Scholar] [CrossRef]
- Büyükkılıç Koşun, S.; Hamamcıoğlu Turan, M. Effect of urban transformation on the values of historic sites around mosques: Two cases in Manisa, Turkey. Front. Archit. Res. 2020, 9, 890–899. [Google Scholar] [CrossRef]
- Pepe, M.; Costantino, D.; Alfio, V.S.; Angelini, M.G.; Garofalo, A.R. Geo-Information A CityGML Multiscale Approach for the Conservation and Management of Cultural Heritage: The Case Study of the Old Town of Taranto (Italy). Int. J. Geo-Inf. 2020, 9, 449. [Google Scholar] [CrossRef]
- UNESCO. Monuments, Sites and Cultural Landscape of Chiang Mai, Capital of Lanna—UNESCO World Heritage Centre. Available online: https://whc.unesco.org/en/tentativelists/6003/ (accessed on 20 February 2021).
- Soraya, T. Becoming Thai; Chulalongkorn University: Bangkok, Thailand, 1999. [Google Scholar]
- Sodabunlu, T. The Design of Chiang Mai City in Lanna Culture (In Thai). Master’s Thesis, Silpakorn University, Bangkok, Thailand, 2003. [Google Scholar]
- Supasri, J. Hor dhamma silpa Lanna (In Thai) [Lanna Dhamma & Contemporary Art Learning Center]. Najua 2015, 12, 384–408. [Google Scholar]
- Wonglanka, W.; Han, F. Doi Suthep Mountain, The Living Heritage. J. World Herit. Stud. 2020, 2020, 30–37. [Google Scholar] [CrossRef]
- Building Control Acts (in Thai). 2000. Available online: https://www.dpt.go.th/wan/lawdpt/data/02/117_75_070843_20.pdf (accessed on 20 January 2021).
- Department of Public Works and Town & Country Planning. Chiang Mai City Land Use Comprehensive Plan 2012. 2013. Available online: https://www.dpt.go.th/wan/lawdpt/data/01/2555/130_43a_210556.pdf (accessed on 26 January 2021).
- Apavajarut, D. Creative Seminar on ‘Good Governance on Thai Urban Planning’(In Thai); Thailand Environment Institute: Nonthaburi, Thailand, 2010; pp. 11–22. [Google Scholar]
- Srinurak, N.; Mishima, N. The impact of urban sprawl on cultivated area in river city of Chiang Mai. In International Symposium on Lowland Technology; Saga University: Saga, Japan, 2014; pp. 1–8. [Google Scholar]
- Sangawongse, S.; Ruangrit, V. Towards a GIS-based Urban Information System to Plan a Smarter Chiang Mai. Nakhara J. Environ. Des. Plan. 2015, 11, 1–8. [Google Scholar]
- Charoenmuang, D.A. Sustainable Cities in Chiang Mai: A Case of a City in a Valley; Chiang Mai University: Chiang Mai, Thailand, 2007. [Google Scholar]
- Rincon, H.; Dwita, R. Preservation of Cultural and Historic Heritage as a Tool for Sustainable Development. In Managing Intermediate Size Cities: Sustainable Development in a Growth Region of Thailand; Romanos, M., Auffrey, C., Eds.; Springer: Dordrecht, The Netherlands, 2002; pp. 295–320. [Google Scholar]
- Chiang Mai World Heritage Initiative Project (Final Report). 2020. Available online: https://cmu.ac.th/en/article/ef3fb21a-2c44-47fc-b11b-1886f70dacf2 (accessed on 28 March 2022).
- Qiu, Y.; Gao, J.; Zhan, Q. The Study of Landscape Visual Impact Assessment in Mountain Tourism Area. In Proceedings of the 2011 International Conference on Management and Service Science, Wuhan, China, 12–14 August 2011; pp. 1–4. [Google Scholar] [CrossRef]
- Lee, K.Y.; Seo, J.I.; Kim, K.-N.; Lee, Y.; Kweon, H.; Kim, J. Application of Viewshed and Spatial Aesthetic Analyses to Forest Practices for Mountain Scenery Improvement in the Republic of Korea. Sustainability 2019, 11, 2687. [Google Scholar] [CrossRef]
- Schroeder, H.W. Visual impact of hillside development: Comparison of measurements derived from aerial and ground-level photographs. Landsc. Urban Plan. 1988, 15, 119–126. [Google Scholar] [CrossRef]
- Stamps, A.E. Fractals, skylines, nature and beauty. Landsc. Urban Plan. 2002, 60, 163–184. [Google Scholar] [CrossRef]
- Tara, A.; Thomas, N.; Chenoweth, A.; McCormick, G.; Davis, A.; Chow, D. Growing by place: Identifying building height limits using skyline thresholds. J. Digit. Landsc. Archit. 2020, 2020, 614–625. [Google Scholar] [CrossRef]
- ESRI. Terminology. In CityEngine Resource; ESRI: Redlands, CA, USA, 2019. [Google Scholar]
- Lipp, M. Interactive Computer Generated Architecture; Vienna University of Technology: Vienna, Austria, 2007. [Google Scholar]
- ESRI. CGA Modeling Overview. In CityEngine Resource; ESRI: Redlands, CA, USA, 2019. [Google Scholar]
- ESRI. Working with Rules. In CityEngine Resource; ESRI: Redlands, CA, USA, 2019. [Google Scholar]
- ESRI. Rule Package. In CityEngine Resource; ESRI: Redlands, CA, USA, 2019. [Google Scholar]
- NASA. Earthdata Search. Available online: https://search.earthdata.nasa.gov/search (accessed on 29 January 2021).
- Panero, J.; Zelnik, M. Human Dimension & Interior Space; Watson-Guptill: New York, NY, USA, 1979. [Google Scholar]
- Tara, A.; Lawson, G.; Renata, A. Measuring magnitude of change by high-rise buildings in visual amenity conflicts in Brisbane. Landsc. Urban Plan. 2021, 205, 103930. [Google Scholar] [CrossRef]
Publisher’s Note: MDPI stays neutral with regard to jurisdictional claims in published maps and institutional affiliations. |
© 2022 by the authors. Licensee MDPI, Basel, Switzerland. This article is an open access article distributed under the terms and conditions of the Creative Commons Attribution (CC BY) license (https://creativecommons.org/licenses/by/4.0/).