Article

A Refined Rural Settlements Simulation Considering the Competition Relationship among the Internal Land Use Types: A Case Study of Pinggu District

1
State Key Laboratory of Earth Surface Processes and Resource Ecology, Beijing Normal University, Beijing 100875, China
2
School of Natural Resources, Faculty of Geographical Science, Beijing Normal University, Beijing 100875, China
3
College of Engineering, China Agricultural University, Beijing 100091, China
*
Author to whom correspondence should be addressed.
Land 2022, 11(5), 661; https://doi.org/10.3390/land11050661
Submission received: 28 March 2022 / Revised: 24 April 2022 / Accepted: 25 April 2022 / Published: 29 April 2022
(This article belongs to the Special Issue Efficient Land Use and Sustainable Urban Development)

Abstract

:
Simulating the future evolution of the internal land use structure of rural settlements (RSILUS) is vital for rural land management. However, previous simulation studies have mostly regarded rural settlements as a whole, thereby ignoring their internal structural variations. In this paper, as an example, we select Pinggu District, which has experienced the impact of rapid urbanization and has an unstable rural land use structure (LUS); then, we examine the driving factors of the changes in the RSILUS, construct a cellular automata (CA)–Markov simulation model specifying the RSILUS, and simulate its changes in 2025. The results indicate the following. (1) The influencing factors of various land use changes in rural settlements in Pinggu District differ significantly. Basic land, such as living functional land, is greatly influenced by natural resources, whereas production functional land is subject to socioeconomic factors. (2) The simulation results demonstrate that from 2015 to 2025, the production and living functional land areas of rural settlements will decrease as a whole. Accordingly, the distribution of rural public service land (RPSL) will tend to remain stable, and the trends of land use abandonment and functional degradation will continue as rural areas continue to recede. Our study enriches the research on rural land use systems by refining the simulation of rural settlements to focus on their internal structure. The differentiation and complexity of the changes in rural LUS types further suggests that rural planning and renewal should adapt to the changing conditions of the RSILUS, and the LUS should be adjusted to improve the constructed environment in human settlements and equalize urban and rural areas.

1. Introduction

From the late 20th century to the early 21st century, the global urbanization and industrialization process has entered a new stage of rapid development [1,2], which ultimately accelerated the flow of urban—rural factors, produced a heavy impact on the rural economy and industrial structure, and greatly changed the existing land use structure (LUS) of the countryside. Meanwhile, the rural exodus continues in some areas, and rural decline has assumed global prominence [3,4,5,6].
A rural settlement forms the core of relationships among rural inhabitants and constitutes the foundation for both production and life activities [7]. Within this context, optimizing the rural LUS and rationally allocating rural land resources have become important means for the revitalization of rural settlements. Accordingly, the basic premise of making rural land management decisions and enhancing the high-efficiency use of rural land is determining the differences in the LUS of rural settlements and understanding their change trends [8].
Historically, scholars in rural geography, sociology, land science, and other academic fields have extensively studied rural settlements, mainly from an overall perspective, including analyzing the driving mechanisms of changes in rural settlements from basic laws [9,10,11,12,13], their spatial morphological characteristics [7,14], the evolution of rural settlement patterns and zoning [15,16,17,18,19], the multilevel development and suitability evaluation of rural settlements [20,21,22], the consolidation of rural land [23], the spatial reconstruction of rural settlements [24,25,26], and the structural adjustment and layout optimization of a rural area [27,28,29,30]. As such, a vast body of research integrating theory, method, and application has systematically been formed.
Nevertheless, various policies focusing on rural issues and supporting rural development have recently emerged in countries worldwide (such as the rural revitalization strategy in China and the Rural Development Programmes in the member states of the EU), which have led to a more in-depth study of rural settlements. The optimization of the allocation of rural resources and factors has become the basic guarantee for stimulating rural development. It was inevitable, then, that a major focus would be to optimize the internal land use structure of rural settlements (RSILUS) [31]. Correspondingly, studies on the RSILUS have received increasing attention [32,33], and numerous relevant case studies have been performed, such as research on the regional differences in the RSILUS [34,35], rural residential land changes and their impacts [36], and functional land use transformations based on the RSILUS [37,38].
Thus, the simulation of rural settlements is important for predicting future changes in rural land quantity and differentiating their spatial patterns. In particular, simulating the evolutionary pattern of the RSILUS under the current conditions of socioeconomic development could enable its future development trend to be predicted, providing guidance for adjusting the RSILUS through policy interventions and planning. It is therefore vital to manage the scientific development of land consolidation in rural areas and to promote intensive and economical land use.
As rural settlement is an important part of the regional land use structure, its simulation ideas and methods are mainly based on land use change simulation models, including the future land use evolution trends under different socioeconomic development patterns, regional land use changes under different policy or planning orientations, environmental effects of land use changes under different ecological protection scenarios [39,40,41,42,43], etc. The commonly used simulation methods include the system dynamics model, cellular automata model, CLUE-S model, etc. In contrast, rural settlements are characterized by a small scale and scattered distribution, their evolutionary mechanisms are more complex, and there are relatively few simulation studies on rural settlements. Occasionally, scholars have drawn on existing simulation models, such as the cellular automata (CA) model, the system dynamics model, etc., to carry out simulations of rural settlements [44,45,46,47], aiming to focus on their changes in the spatial pattern under different development trends and policy interventions to guide a healthy development. However, the above simulation studies on rural settlements have all regarded the evolution of rural settlements as a manifestation of land use change or have considered it as a whole in simulations [48,49], and neglect the competition between different land use types within rural settlements, thus ignoring differences in the internal land use structure. There are few reports of simulation studies on the RSILUS.
China is the world’s largest developing country; as of late 2018, its rural resident population was approximately 560 million, or 40.42% of the country’s total population. Nevertheless, China is still in an important developmental phase of socioeconomic transformation and rapid urbanization. The rural-to-urban migration and the resulting growth in the urban population accompanying this urbanization have led to increased demands for urban construction land, which has triggered an acute conflict between the supply and demand of available land. In addition, urban and rural spatial structures are evolving at an accelerating rate; as a result, rural settlements are facing substantially high pressures of land adjustment [50,51,52,53,54], and the RSILUS is unstable.
Therefore, selecting Pinggu District of Beijing as an example, this paper simulated the RSILUS using a CA–Markov model and analyzed its future evolution. We aimed to explore the following two questions: (1) What are the factors influencing the RSILUS in Pinggu District, and how do they differ? (2) Under the prevailing economic and social dynamics of development, what changes will occur in the RSILUS in Pinggu District? Since previous simulation studies have paid relatively little attention to the RSILUS, this study contributes to the literature on simulating the RSILUS within the context of future changes in rural livelihood and LUS adjustment.

2. Study Area and Data Gathering
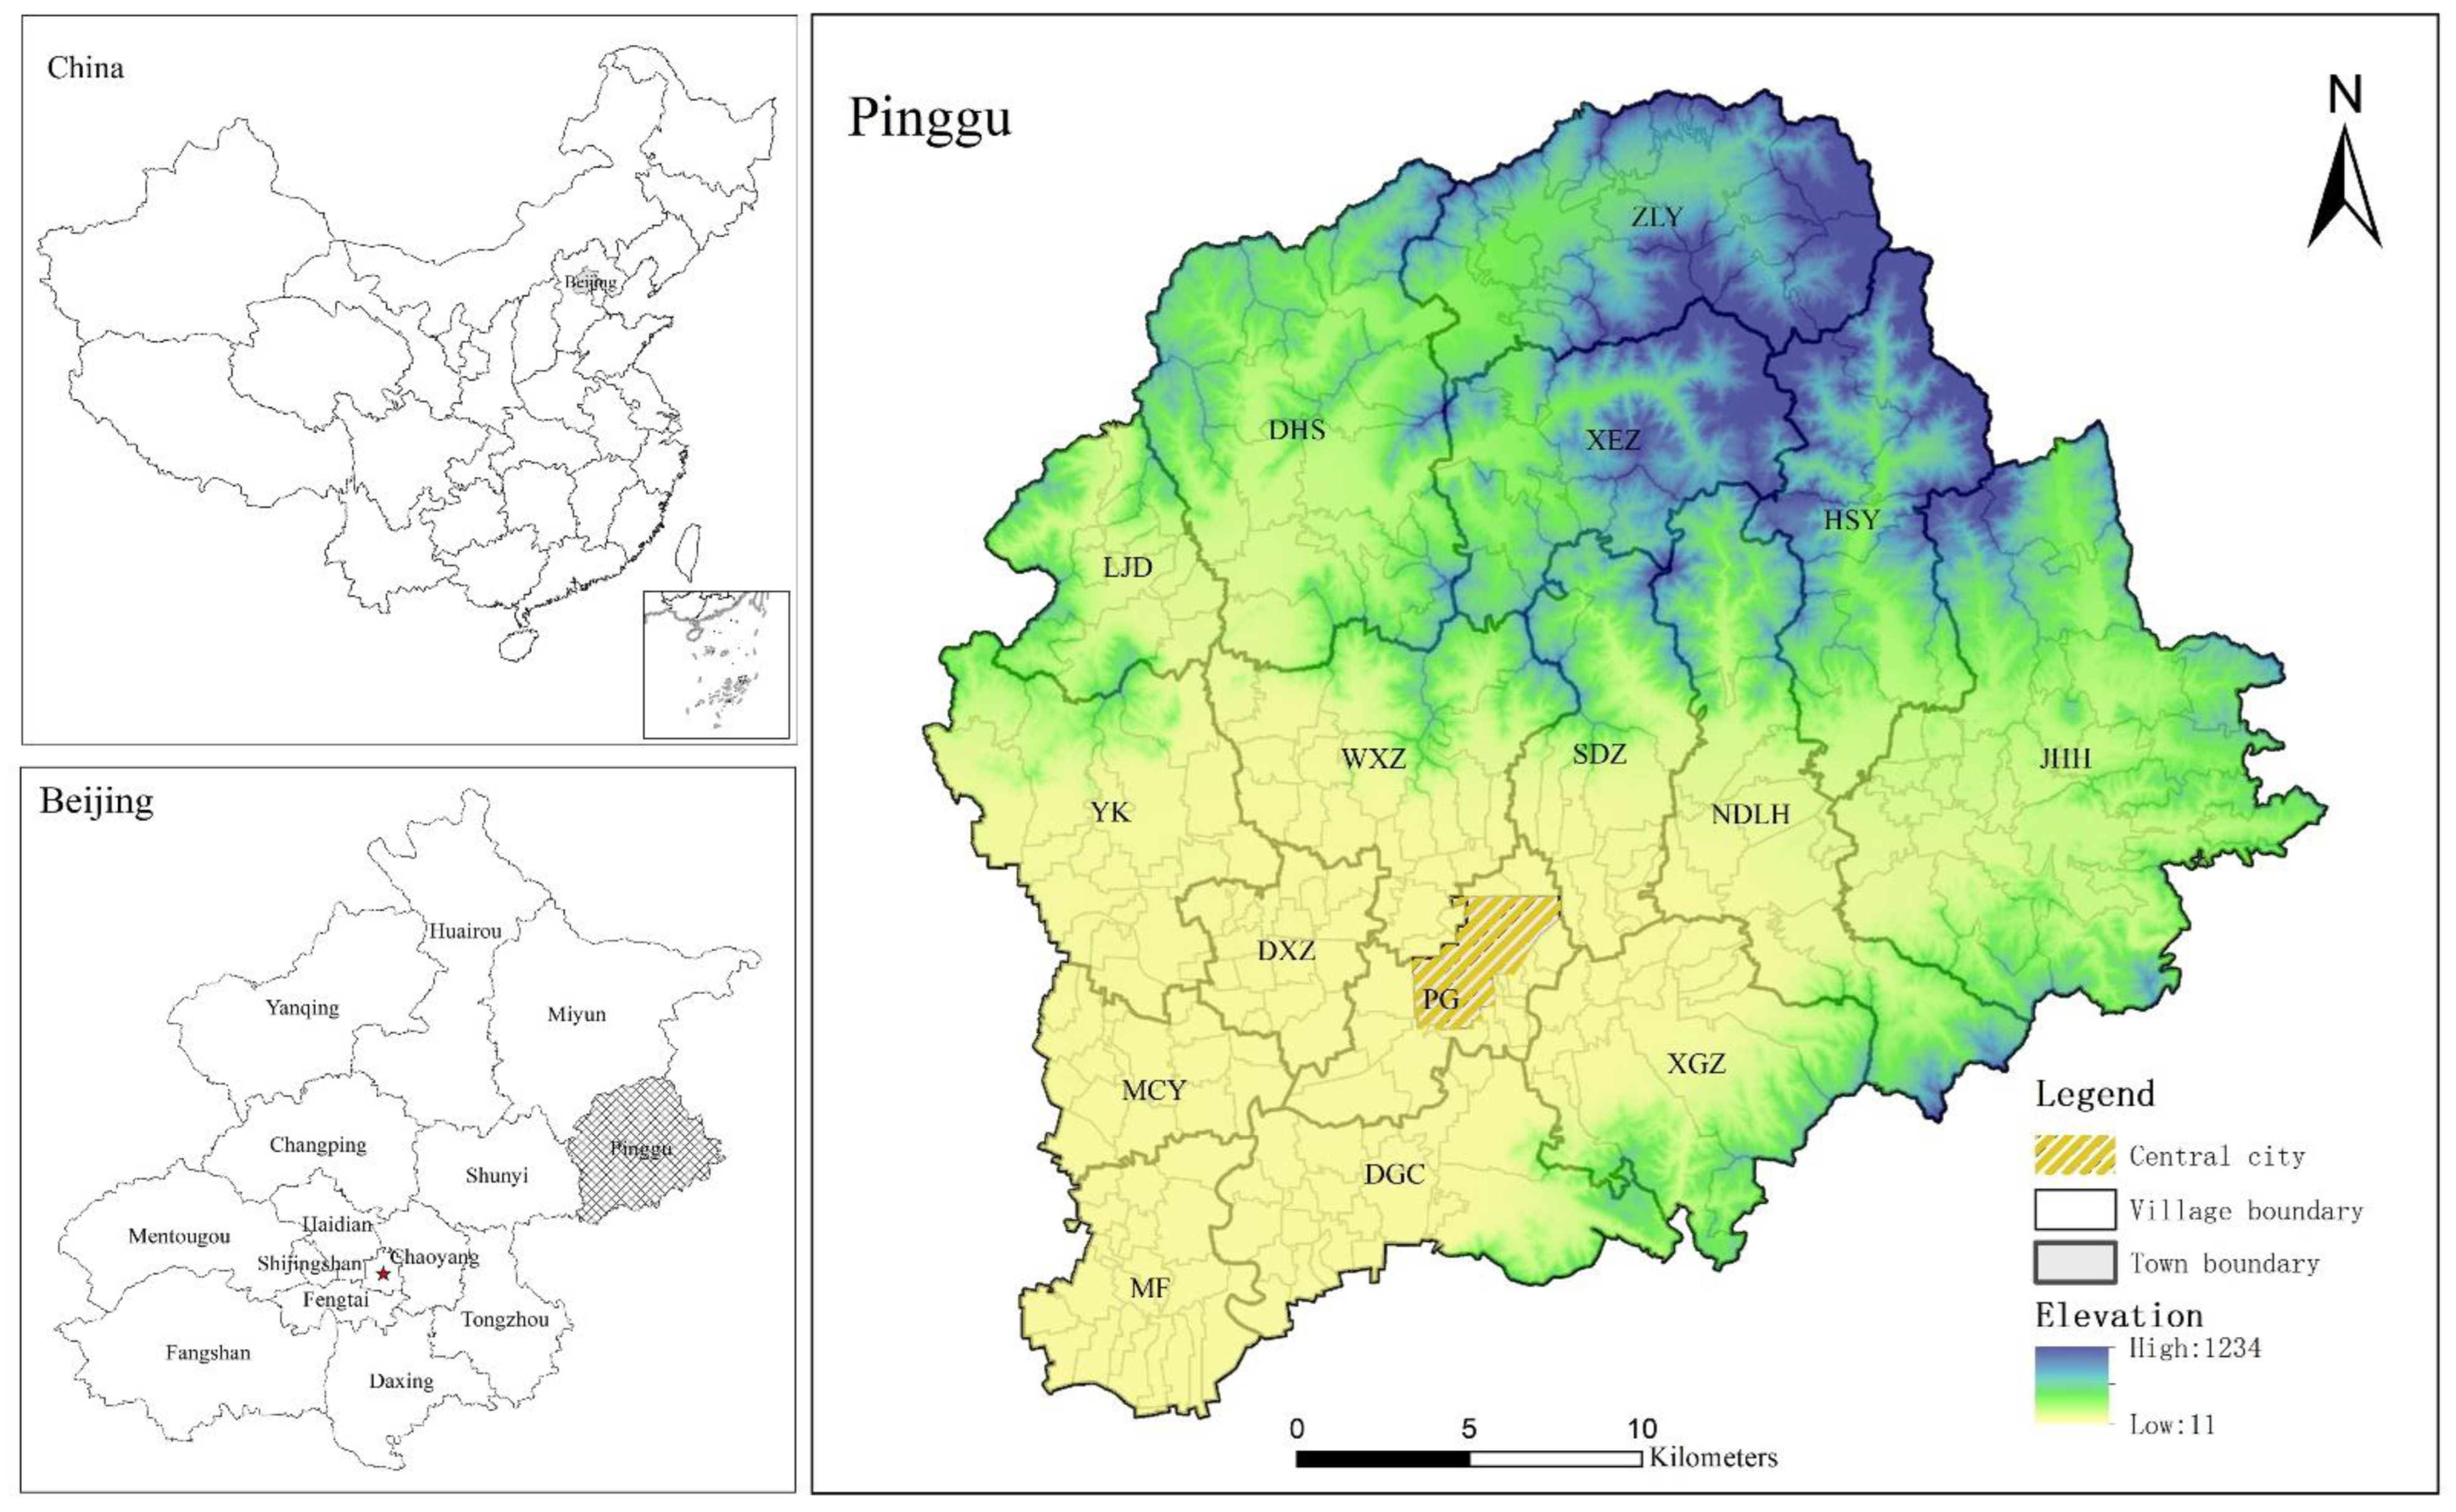
2.1. Study Area

Beijing is both the capital of China and the second-largest city in the country. In its growth, the city has expanded rapidly, which has notably altered its landscape function and land use status, which have had far-reaching impacts on rural residential areas [55]. Pinggu District is located between 40°02′ and 40°22′ north latitude and 116°55′21″ and 117°24′07″ east longitude and belongs to the outer suburbs of Beijing. It is an important hub connecting the two major airports of Beijing and Tianjin and the new port of Tianjin; consequently, the area has become the Jingdong Development Gateway in the Bohai Economic Circle. The terrain in Pinggu District is high in the northeast and low in the southwest, with mountainous areas, shallow mountainous areas, and plains each accounting for 1/3 of the district, and cultivated land spans 7673.33 hectares. Pinggu District has jurisdiction over 14 towns, 2 townships, 2 offices and 275 administrative villages. At present, Pinggu District is in the late stage of industrialization and accelerated urbanization. This rapid urbanization has led to the continuous expansion of urban space, which has exerted considerable impacts on the rural LUS, making Pinggu an ideal case study for the current development background(Figure 1).

2.2. Data Gathering and Processing

The data employed for this study included geospatial, socioeconomic, and survey data. Among them, the RSILUS data in three periods (i.e., 2005, 2015, and 2019) were derived from the archived land use data of the corresponding years and obtained via investigation and interviews accordingly. The digital elevation model (DEM) data were downloaded from the Resource and Environment Data Cloud Platform in the Chinese Academy of Sciences (http://www.resdc.cn/, accessed on 21 May 2020), while the socioeconomic and demographic data were retrieved from the 2005 and 2015 Statistical Yearbooks of Pinggu District.
First, we extracted rural residential land from the current land use maps of Pinggu District in 2005, 2015, and 2019. In addition to the classification system of land use status (GB/T21010-2010), rural residential land was subdivided into seven land use types: rural commercial land (RCL), rural industrial land (RIL), rural housing land (RHL), rural public service land (RPSL), rural religious land (RRL), rural street land (RSL), and rural vacant land (RVL). According to the functions performed by these various LUS types, RCL and RIL were merged into production functional land, while RHL, RPSL, RRL, and RSL were merged into living functional land, and RVL was labelled as potential functional land. Thereafter, adopting the administrative division map of each village as a base map, a spatial database of the relevant driving factors and various LUS types of rural settlements was established, and unified projection and co-ordinate transformations were carried out. Finally, considering the scope of the study area, the patch area, and the operational efficiency of the model, the RSILUS data and all spatial factors in Pinggu District were rasterized, and the grid size was set to 10 m ×10 m.

3. Methodology

This section is divided by subheadings. It should provide a concise and precise description of the experimental results, their interpretation, as well as the experimental conclusions that can be drawn.

3.1. Driving Force Model Construction of the RSILUS Change

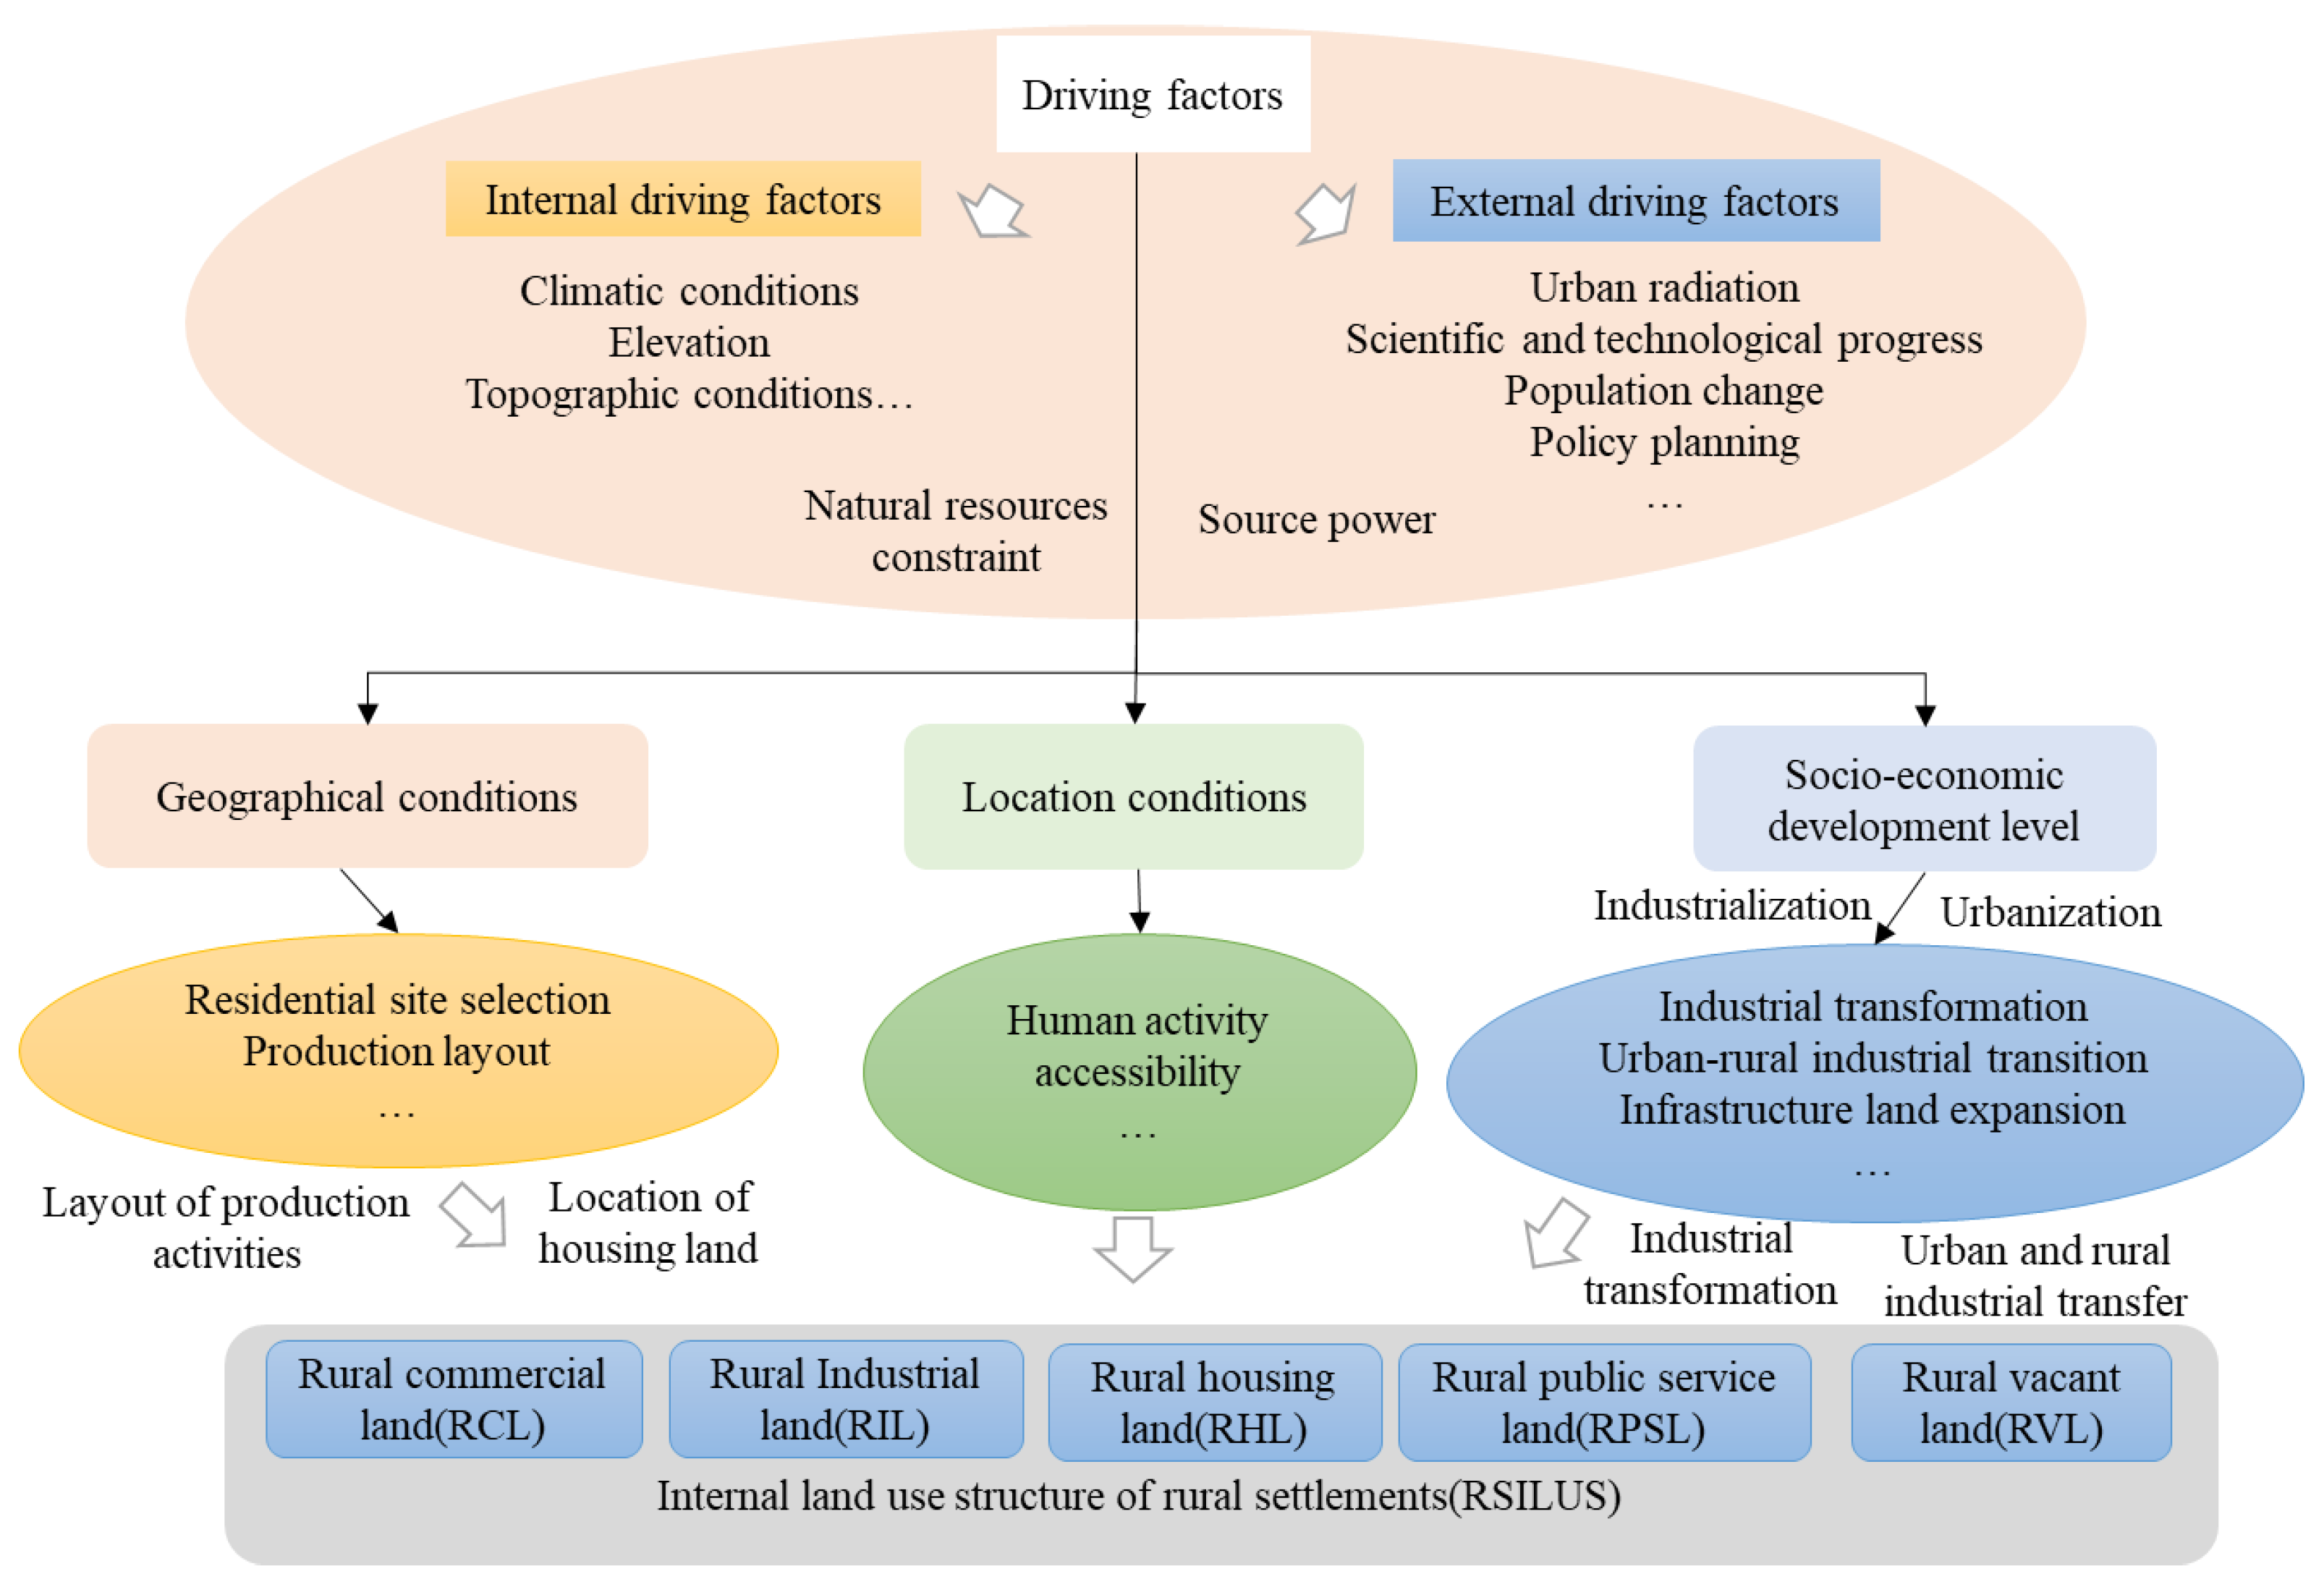
3.1.1. Selection of the Driving Factors

Different spatial distributions and combinations of various rural settlement types constitute the basic morphology of rural settlements in a region. It is generally believed that changes in rural settlements are the result of the combined effects of both internal and external driving factors [44]. The former factors, such as the natural climate, topography, altitude, and location conditions, often play a decisive role in the initial locations of rural settlements and limit the basic status of rural settlements and their internal land use; thus, these factors could be regarded as natural resource constraints on the changes in the RSILUS [9]. The latter factors, such as socioeconomic development, scientific and technological progress, population change, and policy planning, determine the pattern of the RSILUS by changing the rural livelihood type, industrial structure, and agricultural structure; thus, these factors impose considerable effects on the changes in the RSILUS and represent the resource power of rural settlement change [44].
Each land type within a rural settlement is subject to the interactions between internal and external factors within a given area, including its own geographical conditions, location, socioeconomic level, etc. Specifically, geographical conditions have a direct influence on the location of RHL and the layout of production activities. In addition, to a certain extent, the location of the settlement determines the role of urban–rural interactions in the accessibility of human activities [56], thus affecting the layout and scale of RHL, RIL, and RVL. Rural socioeconomic development is driven mainly by industrialization and urbanization, which change RIL and RPSL in rural settlements through industrial transformation, infrastructure expansion, and the migration from rural to urban areas for industry [57]. In particular, with the outflow of the rural population to urban areas, farmers move to work in nonagricultural industries, obviously resulting in the abandonment of rural farmland, which further impacts the scale and layout of RVL (Figure 2).
Therefore, considering the representativeness and availability of data, this study comprehensively considered the internal and external driving factors influencing changes in the RSILUS as independent variables affecting the changes in the RSILUS in Pinggu District (Figure 2). From the perspective of geographical conditions, we selected topographical conditions (elevation and slope), hydrological conditions (distance to rivers), and regional natural resource ownership (cultivated land area and cultivated land area per capita). From the perspective of location, we selected spatial accessibility factors, such as the distances from towns and roads. Finally, from a socioeconomic development perspective, we selected the rural net income per capita, gross domestic product (GDP) per capita, income structure of nonagricultural industries (the proportions of income from secondary and tertiary industries), and rural employment structure (proportions of secondary and tertiary industry employment).

3.1.2. Construction of the Driving Force Model

The spatial logistic regression model is a concise and effective method used to analyze and explain land use change [44,58]. Thus, we adopted a binary logistic regression model to quantify the correlations between the RSILUS and its various influencing factors.
In the binary logistic regression model, a specific land use type is regarded as the dependent variable of a binary classification (the land use type grid attribute is assigned a value of 1 for this type of land use and 0 otherwise), and the various driving factors are regarded as the independent variables. The probability ( P i ) of a certain land type occurring in a given grid is:
Logit ( P i ) = l n [ P i 1 P i ]   = β 0 + β 1 X 1 + β 2 X 2 + + β n X n
where β 0 is a constant term; β 1 , β 2 , ,   β n are the regression coefficients, which quantify the correlations of the driving factors and the magnitudes of their effects; and X 1 , X 2 , , X n are the driving factors.
With the use of CLUE-S software, we randomly extracted spatially consistent multilayer grid attribute information and imported it into SPSS 21.0. Then, the stepwise regression method was applied to identify the factors with a significant impact on the changes in the various categories of rural settlements, quantify their relationship, and analyze their driving mechanisms.
The goodness of fit of the equation was tested via the receiver operating characteristic (ROC) curve, whose value ranges from 0.5 to 1, thereby quantifying the correlation between the probability of each site type in the spatial distribution and the real pattern. The higher the ROC value is, the closer the spatial distribution of land in rural residential areas determined with the constructed model is to the actual situation and the higher the goodness-of-fit of the model. An ROC value greater than 0.7 is usually considered to indicate that the selected driver has good explanatory power [59].

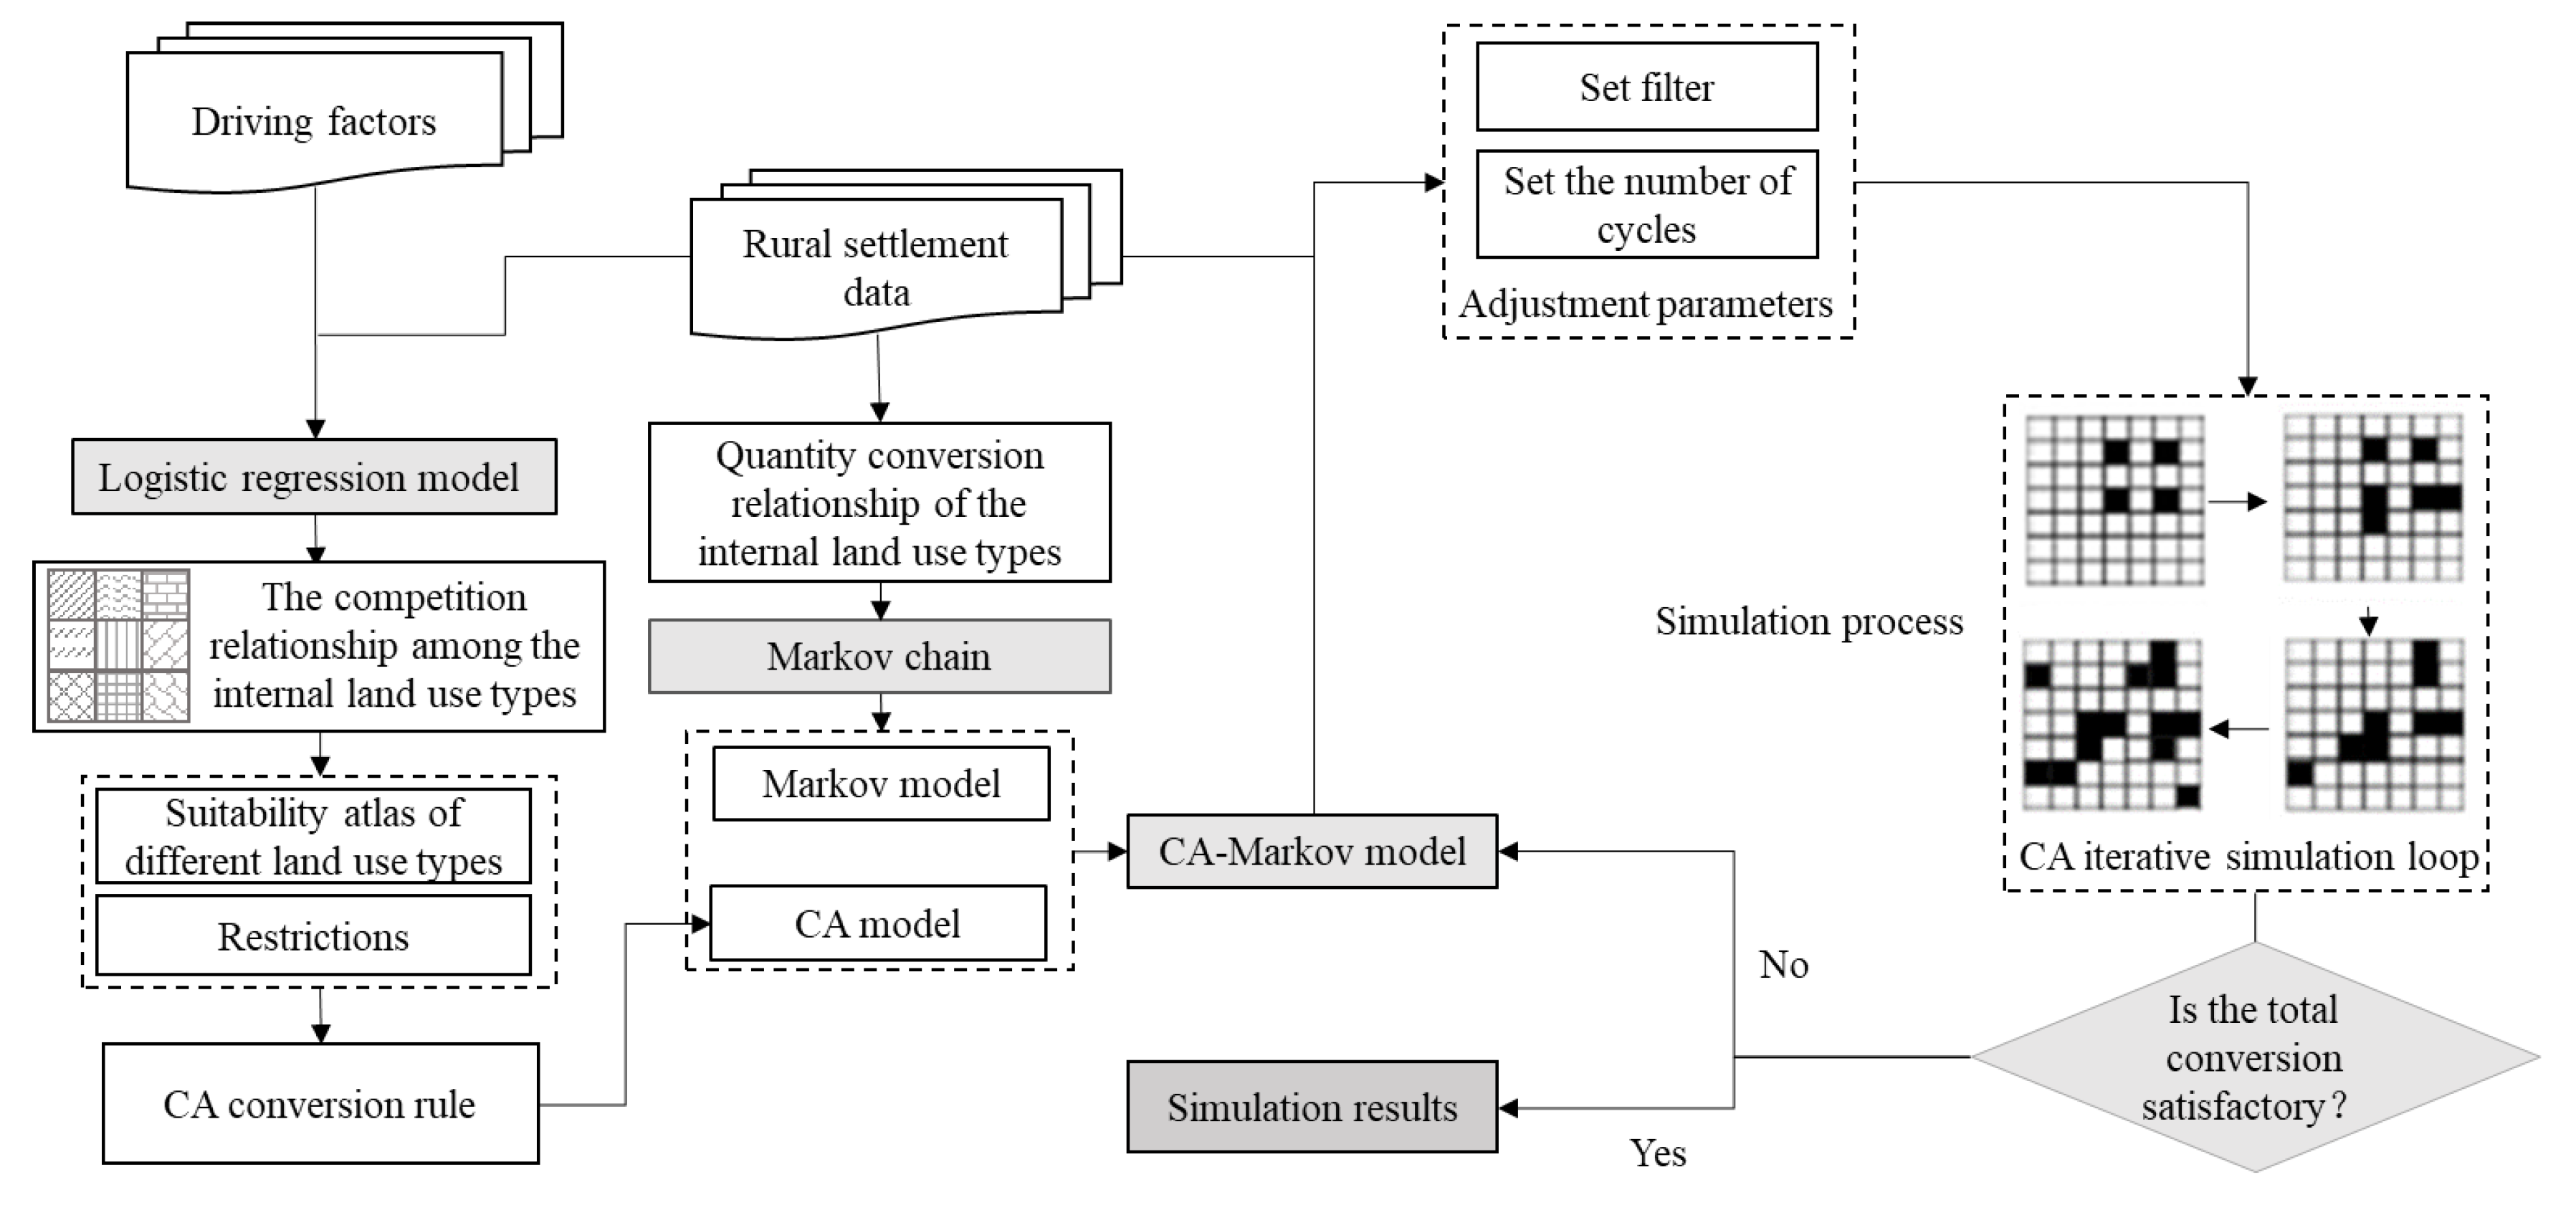
3.2. Simulation of the RSILUS

To simulate the RSILUS, we applied the CA–Markov model, which can take full advantage of both the CA model’s ability to handle spatially varying complex systems and the Markov model’s strengths in the number of land use predictions to sufficiently mine dynamic information about the evolution of land use both quantitatively and spatially [60].
CA models are composed of space, cell, neighborhood, and transformation rules; hence, they are suitable for the simulation of complex geographical phenomena [61,62]. The CA expression used herein is [63,64]:
S ( t , t + 1 ) = f ( S ( t ) , N )
where S is the state set of cells; t denotes the different times; N is the cell neighborhood; and f is the transition rule of the local space cell state, which defines the transition from the moment t state to the next moment t + 1 state.
A Markov model is a stochastic model that can quantitatively predict changes in land use, and its expression is [65]:
S ( t + 1 ) = P i j S ( t )
where S ( t ) and S ( t + 1 ) denote the state of land use at moment t and moment t + 1, respectively; and P i j mainly represents the probability of land class transition from i to j.
In this study, the CA–Markov model was realized via IDRISI software. First, based on the 2005 and 2015 data of Pinggu District, transition probability and area matrices of the RSILUS were obtained. Second, logistic stepwise regression was applied to generate spatial conversion probability distribution maps of the different LUS types, thereby creating a comprehensive database of the conversion suitability as a cell conversion rule. Third, corrected conversion rules were used to run the CA model to simulate and test the simulation accuracy of the RSILUS in 2019 in Pinggu District. The simulation accuracy was judged via the kappa coefficient, whose values range within [0, 1]; when kappa is higher than 0.6, the simulated distribution is relatively consistent with the actual distribution [61]. Finally, we chose 2015 as the simulation base period, adopted a 5 × 5 filter, and set the CA cycle count to 10 to simulate the RSILUS in 2025. The process is shown in Figure 3.

3.3. Analysis of the RSILUS Characteristics

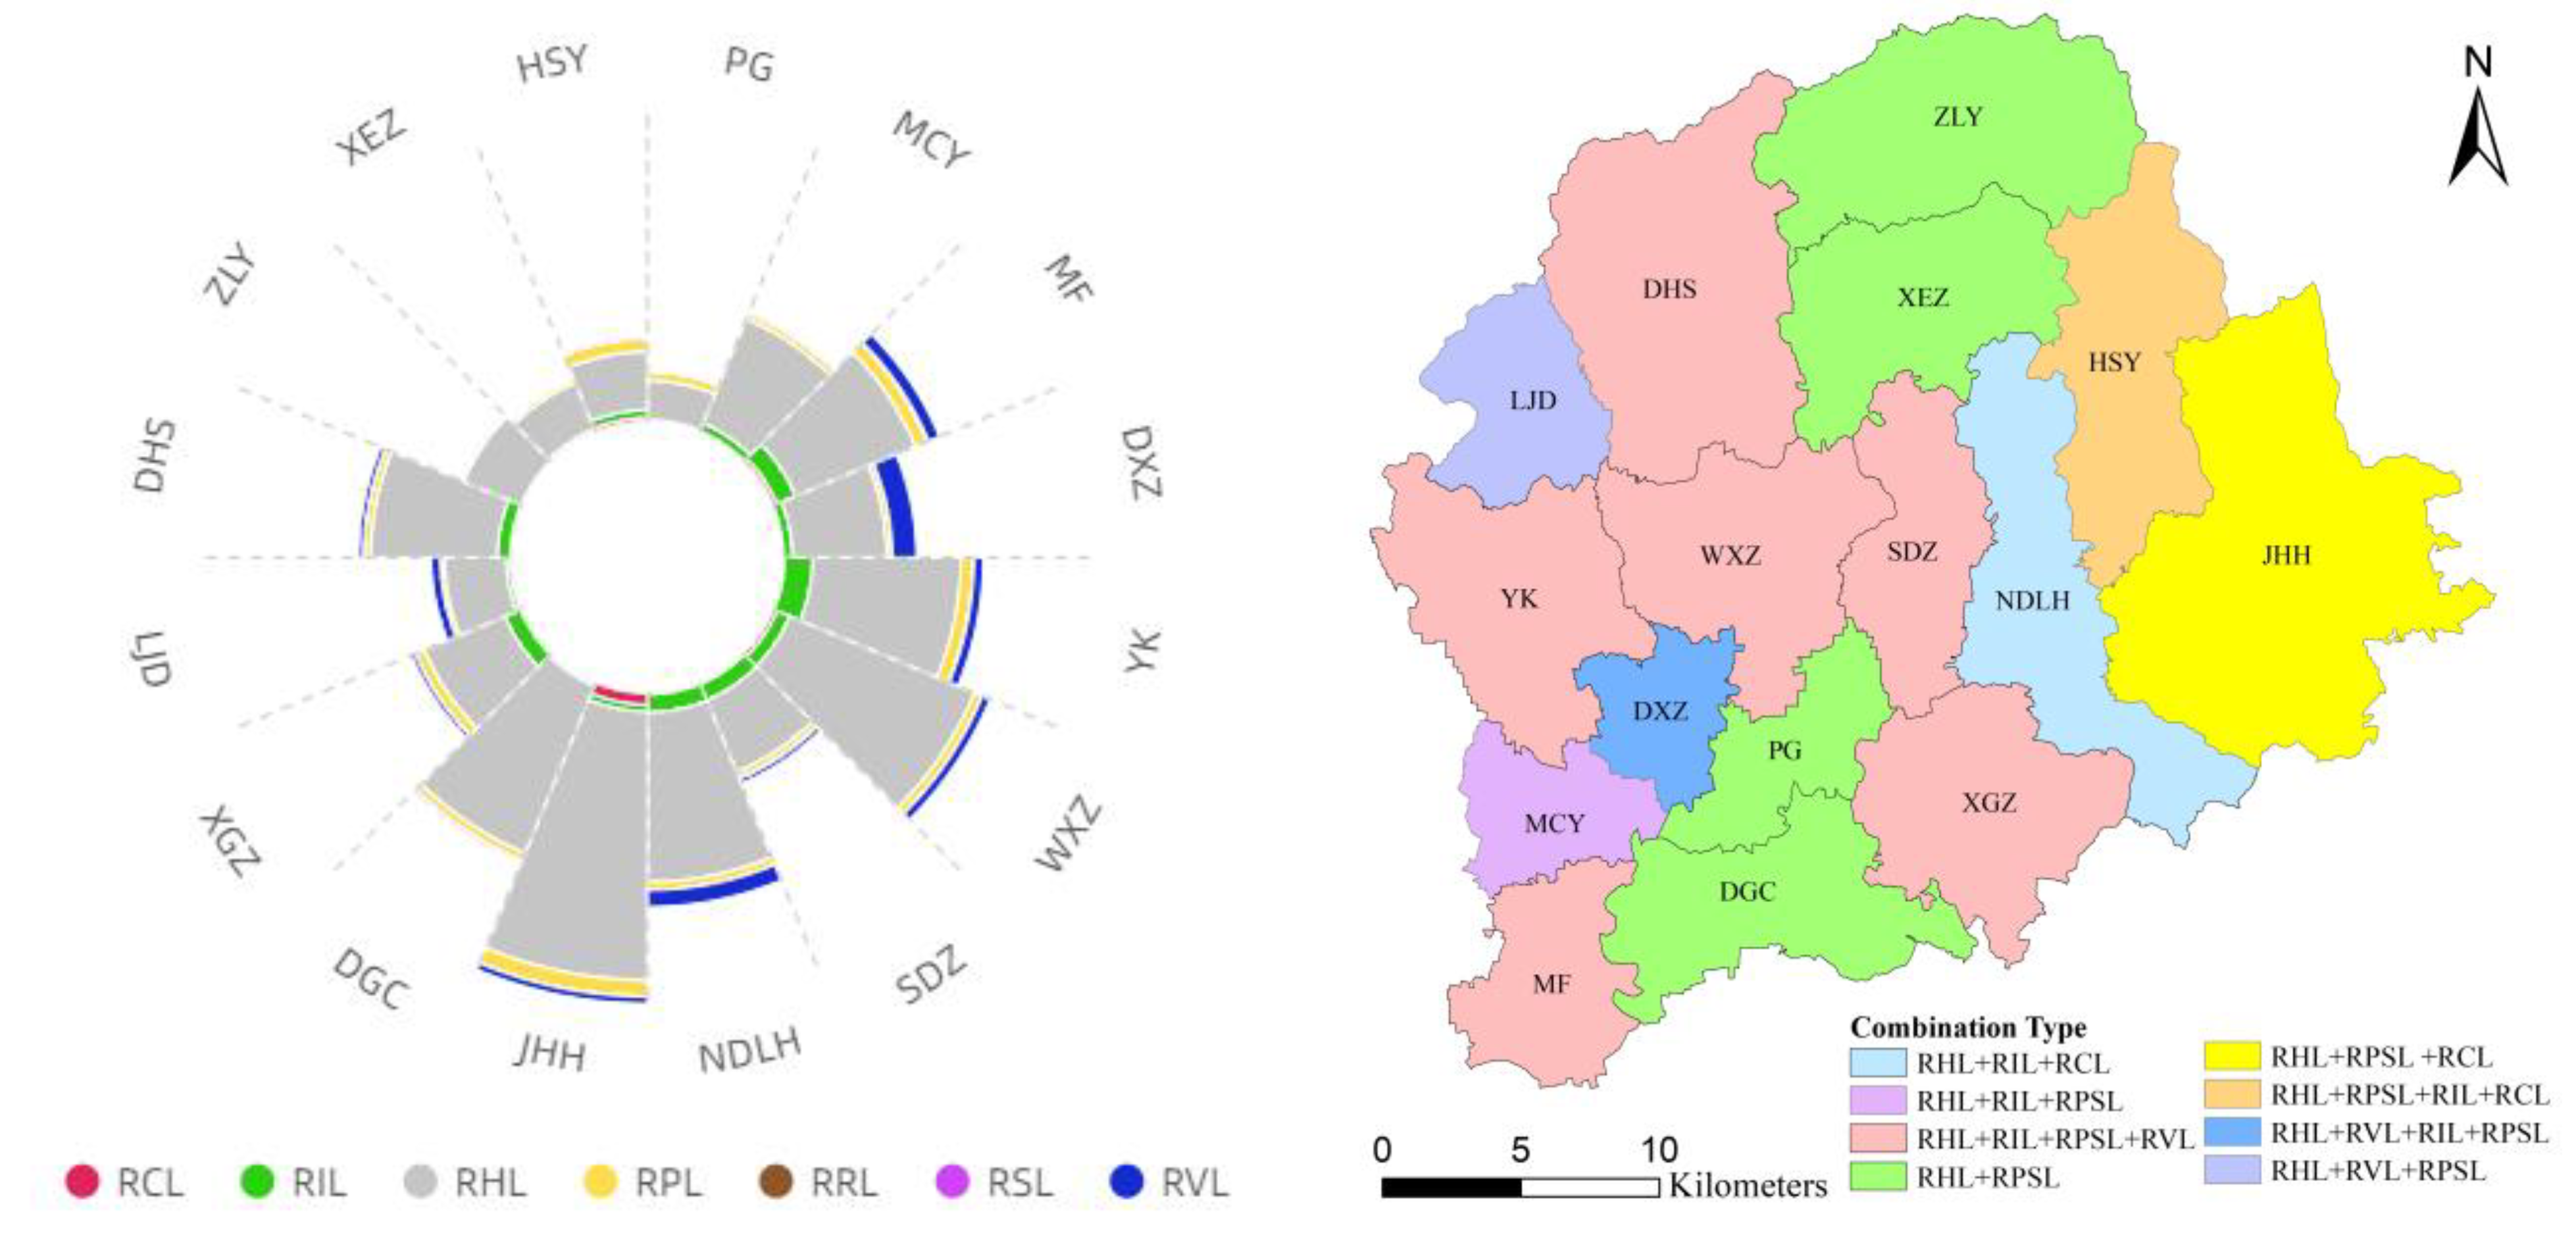
3.3.1. Land Use Combination Characteristics

We utilized the Weaver–Thomas combination coefficient to identify the combination of LUS types in rural settlements. This coefficient compares the actual distribution of different LUS types with the ideal equilibrium distribution and then selects the state closest to the actual situation as the combination of LUS types [35].
C i = m i n ( k = 1 n ( a i k a l k ) 2 ) l [ 1 , n ]
where Ci is the combination coefficient of the i-th rural settlement; n is the total number of LUS types; and a i k and a l k represent the actual proportion and assumed proportion, respectively, of the area of the k-th land type under the l-th assumed allocation (here, a l k = 1 / l when k l and a l k = 0 when k > l ).
However, it is worth mentioning that the LUS types within the rural settlements are not uniformly distributed, so we revised the calculation steps by combining the actual LUS types in Pinggu District and adjusted the assumed proportions of RHL, RIL, RPSL, RVL, and RCL to 75%, 10%, 8%, 5%, and 2%, respectively, where RPSL was created by grouping RRL and RSL together considering their small areas.

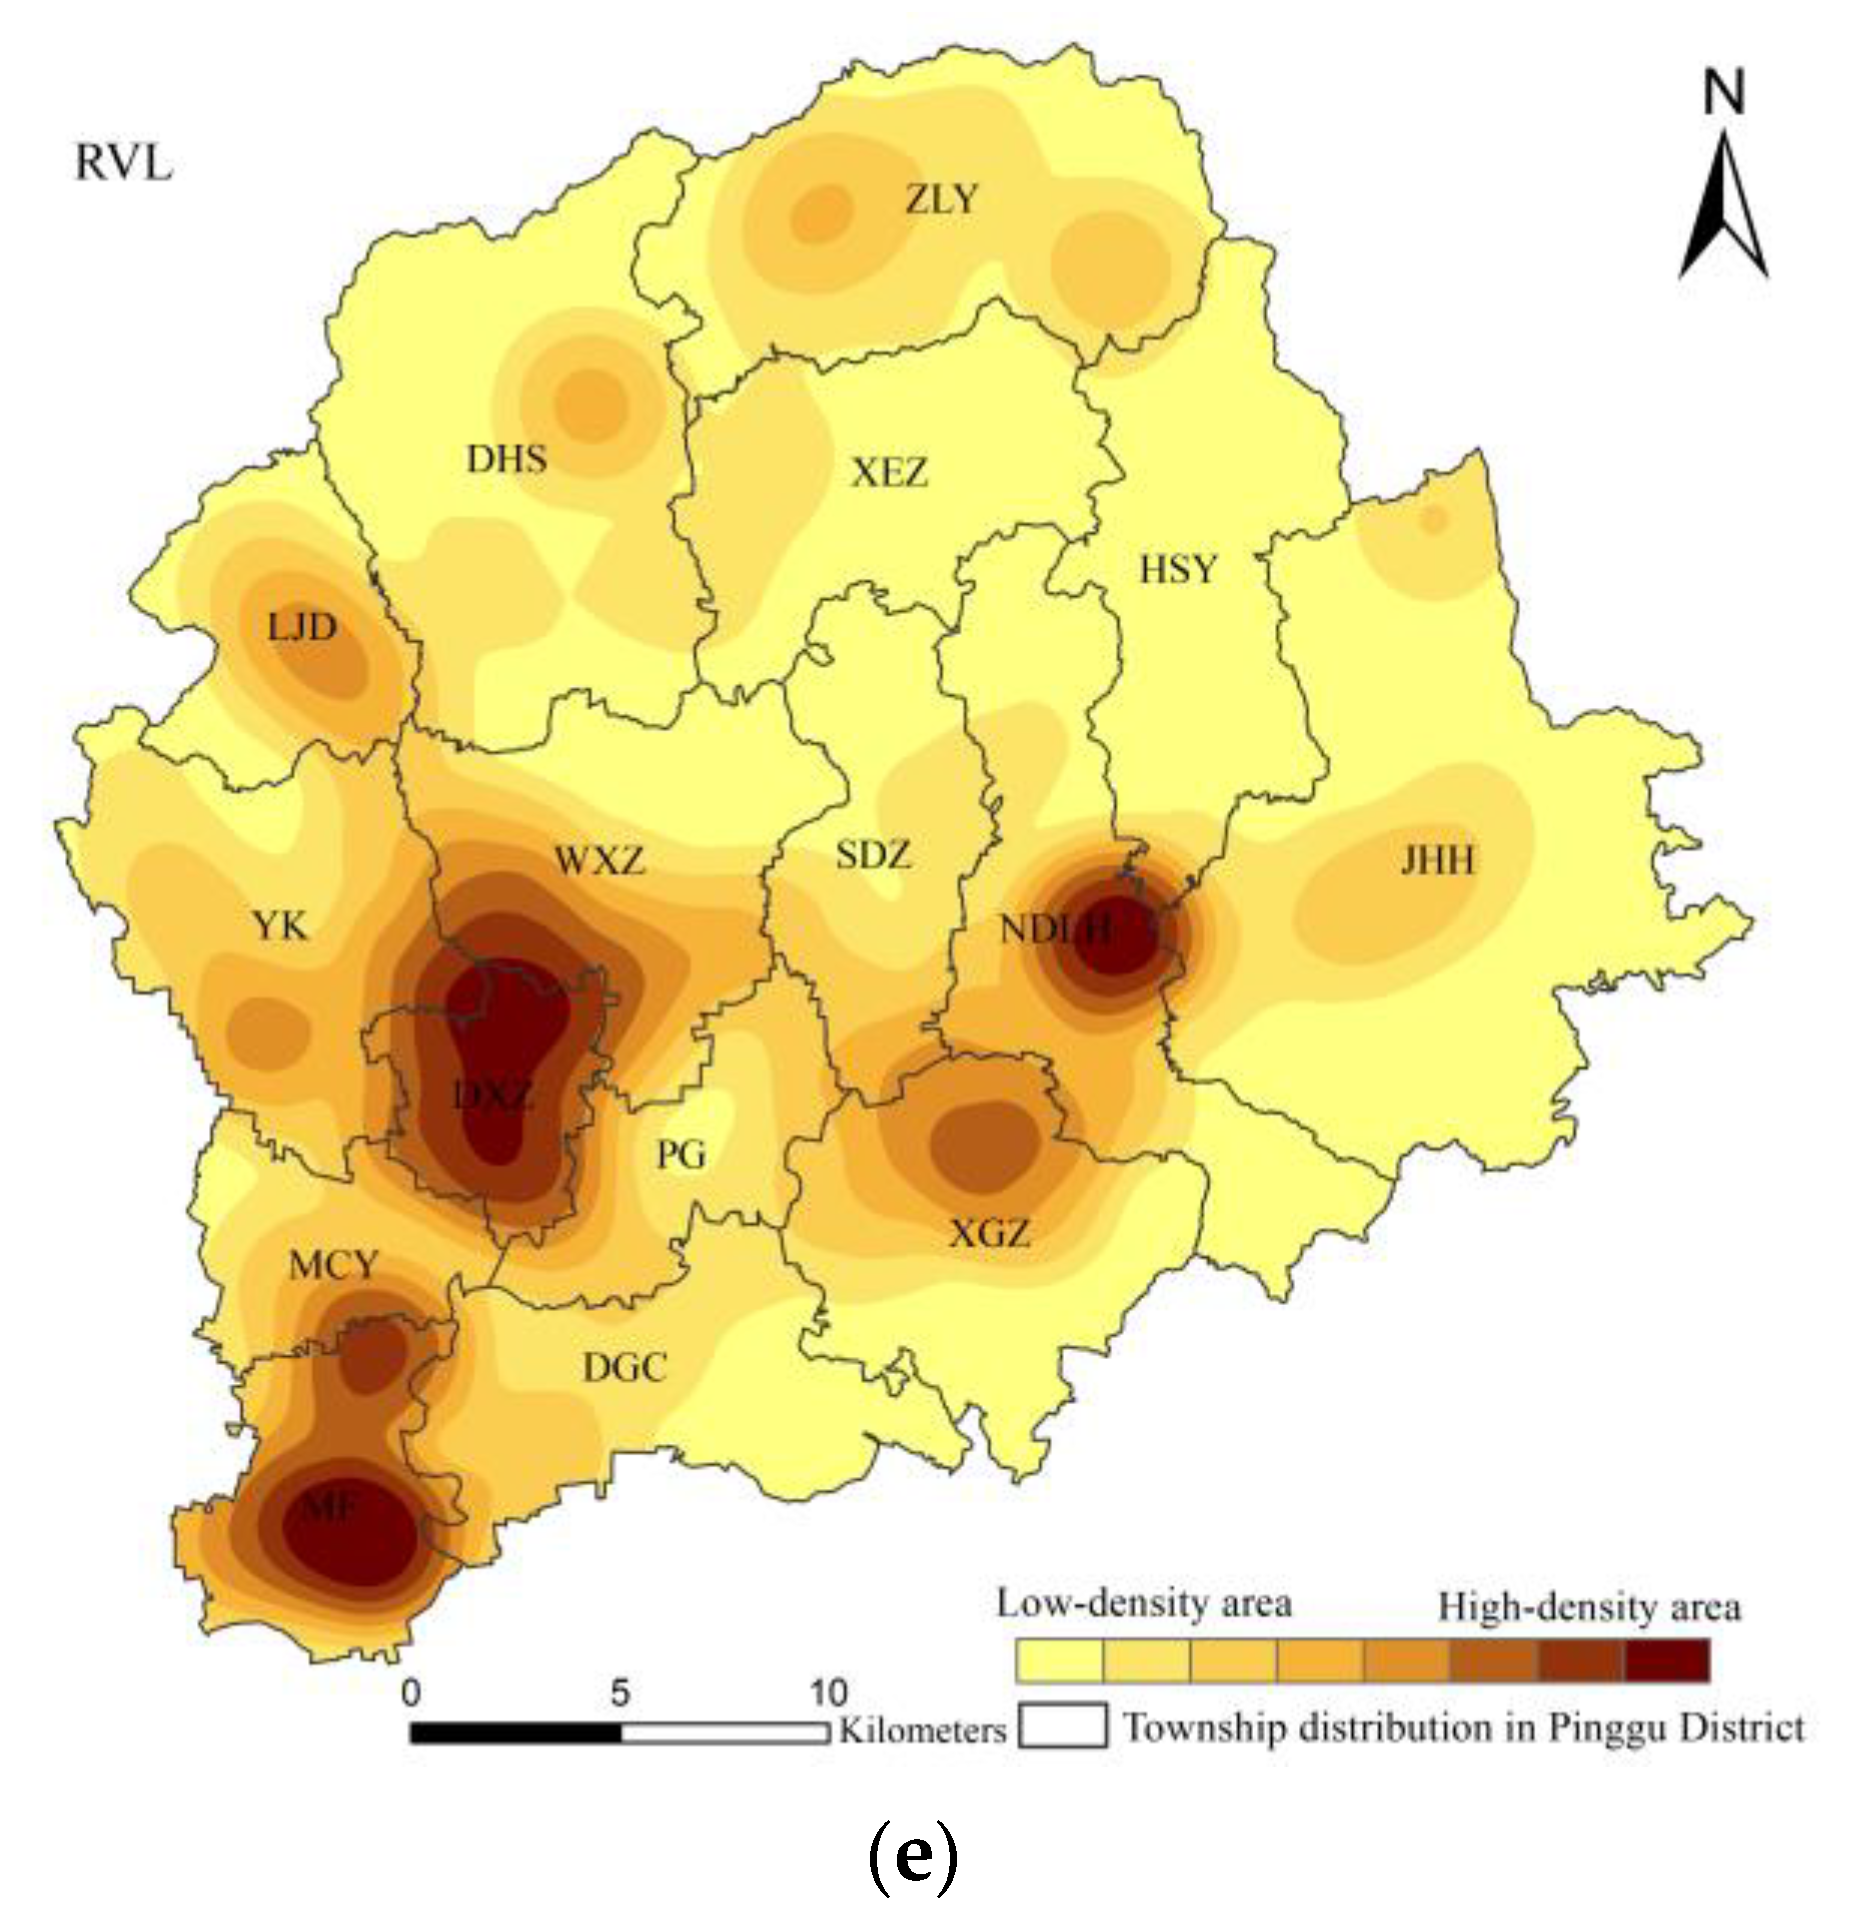
3.3.2. Spatial Agglomeration Characteristics

Kernel density analysis was performed to estimate the unknown density function with probability theory, which is a nonparametric test method. This approach establishes a smooth curved surface for each feature point, calculates the distance from each feature point to the reference position, sums all the surface values of the reference position, and builds the peaks or kernels of these points to create a smooth continuous surface; thus, the kernel density gradually decreases with increasing central radiation distance [66]. Kernel density analysis effectively measures the relationship between the location and intensity of the spatial distribution of various categories within rural settlements, and its functional expression is as follows [67]:
f ( x , y ) = 1 n h 2 i = 1 n k ( d i h )
where f ( x , y ) and d i are the kernel density value at the coordinates (x,y) and the distance from that location to the i-th observed location, respectively; h is the bandwidth; n is the observed value; and k is the kernel function.

4. Results and Analysis

4.1. Analyzing the Driving Factors of RSILUS Evolution

With the use of SPSS 21.0, logistic regression analysis was carried out for each land type and its related influencing factors of rural settlements (Table 1). The ROC values for all land classes were greater than 0.75, and the model prediction accuracy is higher than 70%, indicating that the model explains the implications of the various driving factors on the LUS change in rural settlements well.
Based on Table 1, it is observed that the variation of the various land use types within rural settlements are influenced in an integrated manner. Natural factors such as elevation and slope dominate the change in each land use type. Among them, the elevation exerts a negative influence on land use variation within rural settlements (i.e., the probability of distribution of each land use type decreases with increasing elevation), while the slope exerts a negative impact on RCL, RHL, RPSL, and RVL. These findings indicate that the lower the altitude and the smaller the slope, the more favorable the conditions are for the agglomeration, distribution, and comprehensive construction of the various land use types. The difference is that RRL and RSL are affected by the slope in the opposite direction. The reason is that RRL is reserved for rural special activities, which is governed by cultural factors and the needs of farmers. Therefore, when the slope increases, its change probability may increase. RSL mainly includes intervillage and field roads except highways, and its overall scale is limited. With the improvement of the construction capacity, areas with steep slopes and poor location conditions increasingly attach importance to street land construction, and the probability of street land change increases.
Among the socioeconomic factors, the proportion of employment in nonagricultural industries, proportion of income from nonagricultural industries, and cultivated land area per capita greatly influence the various LUS types of rural settlements. However, significant differences occur in the influence degree and mechanism of the above factors among the various LUS types. Except for RRL, all the LUS types (especially RHL) are negatively influenced by the arable land area per capita. For every increase of 1 unit in the arable land area per capita, the RHL change probability decreases by 24.7%. Moreover, the proportion of employment in secondary industry exerts a significant negative effect on all LUS types except RRL. In contrast, the proportion of employment in tertiary industry imposes a negative impact on RIL, RHL, and RVL, while it imposes a positive effect on RCL, RPSL, and RSL. Except for RRL and RSL, the proportion of those employed in tertiary industry has a significant positive impact on the other LUS types, whereas the proportion of income from secondary industry exerts a positive impact on only RCL and RVL.

4.2. Simulation Results of the RSILUS

Choosing 2015 as the base period, the RSILUS in Pinggu District was simulated in 2019 and 2025 (Figure 4). Comparing the simulation results in 2019 to the known conditions of rural settlements yielded a kappa value of 0.705, which signifies a high overall simulation accuracy.
In 2025, the total area of rural settlements in Pinggu District was predicted to be 4431.37 ha, among which the RHL area is the largest, comprising 80.02% of the total, followed by the RIL and RPSL areas, accounting for 7.37% and 5.78%, respectively, while the RVL area accounts for approximately 4.92%. In addition, the area of RCL (accounting for only 1.58%) is much smaller than that of RIL, and the areas of RRL and RSL are the smallest, collectively accounting for 0.33% of the total area.
As shown in Figure 5 and Table 2, regarding the combination of the main LUS types in rural settlements, eight combinations were simulated in Pinggu District in 2025. Among them, the two most common combinations are RHL+RIL+RPSL+RVL and RHL+RPSL; the former is concentrated mainly in DHS, XGZ, SDZ, WXZ, YK, MF, and HSY, while the latter is distributed mainly in XEZ, ZLY, DGC, and PG. In general, RHL, being absolutely dominant, represents the basic structure of the RSILUS. RIL, RPSL, and RVL are either in one of the dual structures (consisting of two dominant LUS types) or in one of the triple structures (consisting of three dominant LUS types) in the RSILUS; accordingly, they are all important and belong to the variable structures in the RSILUS. However, RCL occupies a high proportion only in JHH and HSY, and there is an obvious regional dependence.
We further examined the spatial agglomeration characteristics of the major land use types (RCL, RIL, RHL, RPSL, and RVL) in Pinggu District in 2025 via the kernel density analysis method, and the results are shown in Figure 6. Among these LUS types, the distribution of RHL is characterized mainly by small, highly scattered clusters, and its high-density area exhibits the spatial distribution characteristics of three points and two axes. Moreover, RIL, RCL, and RVL all form a multicore center of clusters: RIL multicore centers are located largely in MF, MCY, XGZ, and JHH; RCL exhibits a distribution pattern with centers in JHH, WXZ, and SDZ; and RVL is concentrated in DXZ, MF, and NDLH. In contrast, RPSL exhibits a polar core distribution pattern, forming an independent high-density core area in JHH.
Furthermore, notable differences occur in the spatial distributions of the various LUS types of the rural settlements in Pinggu District. The distribution of living functional land among the different towns is relatively balanced, while the distributions of production functional land and potential functional land are obviously imbalanced. For example, RIL exhibits significant spatial heterogeneity from the urban fringe and suburban areas to the rural hinterland, whereas RCL is influenced by the availability of regional resources and location, demonstrating an obvious regional dependence, and RVL gradually disperses from the southwest plains to the northeast mountains.

4.3. Changes in the RSILUS in Pinggu District

4.3.1. Changes in Quantity Structure of RSILUS in Pinggu District

As summarized in Table 3, the 10-year trend in the total area of rural settlements in Pinggu District exhibited a steady decline. During the period from 2005 to 2015, the overall area of rural settlements decreased by a total of 11% (approximately 615.15 ha). From 2015 to 2025, the total rural settlement land area was predicted to decrease by 10.2% (approximately 505.43 ha). In addition, we observed significant discrepancies in the area changes in the major LUS types. Among them, the change in RIL was the largest, followed by that in RCL. During the study period, RIL and RCL decreased by 16.95% and 16.37%, respectively. RHL decreased by approximately 10.14%, accounting for 79.16% of the total land decrease in rural residential areas. In addition, RPSL decreased by approximately 10.09%, while RVL slightly increased by approximately 2.01%.

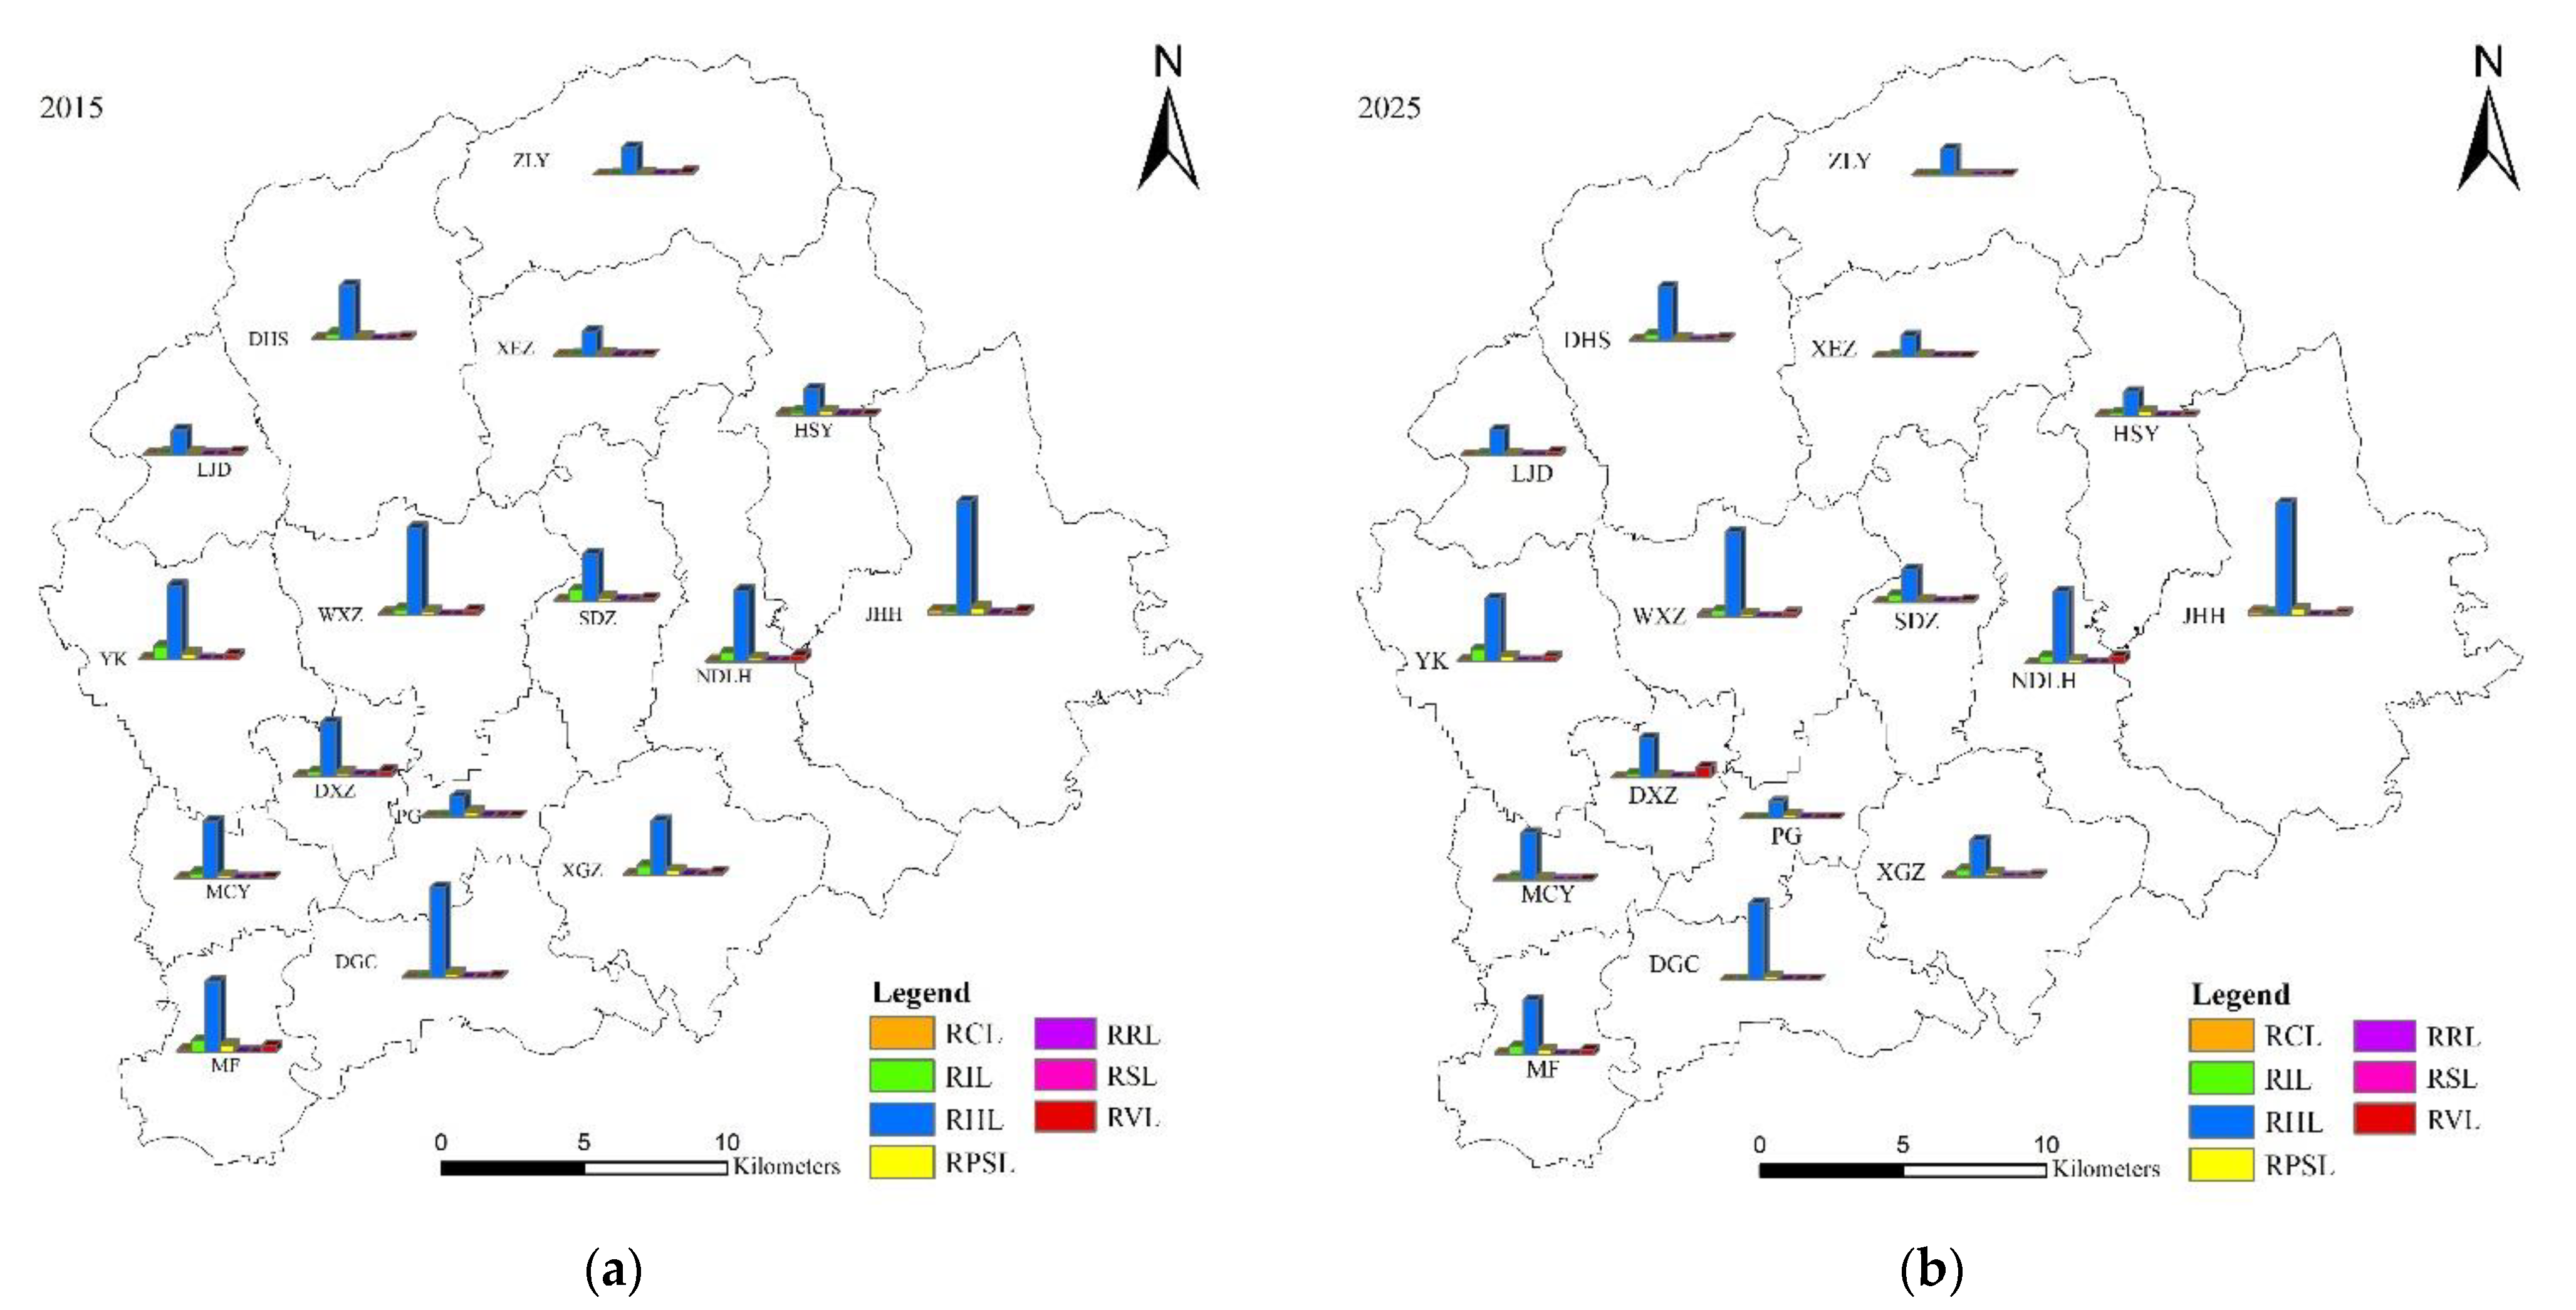
4.3.2. Spatial Changes of the RSILUS in Pinggu District

As shown in Figure 7, from the perspective of the spatial pattern, from 2015 to 2025, the change in the LUS of rural settlements in Pinggu District revealed obvious regional differences (Figure 7a,b).
During the period of 2015 to 2025, RVL, RPSL, and RCL significantly increased, while the increase in other land types was relatively little. Among them, RPSL mainly increased significantly in HSY in the northern mountainous area, and RCL greatly increased in JHH in the central mountainous area. The abovementioned areas are far from urban areas, and with the development of the rural economy, farmers increasingly pursue a higher quality of life. Moreover, in the process of new rural construction, attention is increasingly given to the allocation of public service facilities, which increases RCL and RPSL. Furthermore, RVL significantly increased in LJD and NDLH, with the largest increase occurring in DXZ.
The analysis of the various land types of rural settlements in Pinggu District from 2015 to 2025 demonstrates that RHL and RIL had the largest overall decrease in area, while the area of RPSL, RVL, and RCL are partially reduced. Among them, RHL is significantly reduced in mainly MF and DXZ in the southwest plain area and SDZ and DGC in the central mountainous area. RIL is primarily reduced in SDZ, MF, XEZ, and MCY. The reduction in RPSL in MF is relatively large, and the reduction in RVL largely includes areas such as ZLY and MF. In addition, RCL is reduced in SDZ and YK in the central mountainous area and MF in the southwest plain area. Overall, the RSILUS in Pinggu District was characterized mostly by a declining trend and the tendency of land use hollowing is obvious.

5. Discussion

5.1. A Striking Regional Difference Exists in the RSILUS Change

The predicted future changes in the RSILUS in Pinggu District will exhibit significant regional differences, which may be regarded as their varying responses to urban radiation [68]. In urban fringe areas, the living functional land area of rural settlements will shrink the most, whereas the total potential functional land area will increase, and the LUS of rural settlements will tend to remain stable. In remote suburban areas, the RSILUS will drastically change, and rural settlements will maintain diversity while declining [49,69]. In traditional rural hinterland areas, RPSL will be enhanced, living functional land will continue to increase, and the residential security function of rural settlements will dominate, whereas potential functional land (mainly RVL) will dwindle, and the development and utilization of rural land will progress towards the potential utilization of stock resources.
Considering the multiple impacts of urban radiation, economic development, social progress, and industrial structure patterns on the RSILUS, different measures for the future management of LUS types in rural areas are formulated as follows: First, the rural areas in urban fringes exhibit great potential to facilitate the transfer of labor into urban industries, and thus, the future planning of these areas should actively be integrated into urban development. In addition, it is imperative to strengthen the connections between rural settlements and the functions of construction land at the edges of cities; the focus should be to promote the concentrated distribution of production functional land, integrate production functional land with living functional land, and realize efficient and intensive rural land use. In the rural areas of the outer suburbs, the planning and management of rural settlements should be strengthened, and combinations of rural LUS types should be encouraged to strengthen their compound functionality. However, in the rural hinterland where the development of nonagricultural industries has no momentum, planning and management should focus on evaluating the utilization potential of vacant homesteads and RVL, controlling the scale of rural residential areas, and guiding the rational development and natural decline of rural areas.

5.2. The Clear Declining Trend of the RSILUS

According to the simulation results in this paper, both in the present and in the future, the area of rural settlements exhibits an overall decreasing trend, and the reduction in RHL is dominant. The role that rural settlement land plays in ensuring the lives of farmers is gradually weakening. Coupled with the lack of industrial support in rural areas, the total land area for production functions is dwindling, and the overall function of rural settlements is significantly degrading. Furthermore, with the overall increase in RVL, the RSILUS is obviously being abandoned, creating a situation characterized by inefficient rural land use. However, such a severe waste of land resources destroys rural residential habitats, further increasing the contrast between urban and rural living environments.
Therefore, strengthening the endogenous power of rural development has become the focus of rural economic development. Rural land should be consolidated, human settlements should be constructed, and a suitable rural living environment should be established. Additionally, the internal layout of LUS types in rural settlements should be optimized to avoid wasting public resource investments. Subsequently, the orderly transfer of rural land should be actively guided, and rural land resources should be reasonably allocated by innovating the land transfer mode [70], clarifying the manner of replacement, strengthening the policy support for land transfers, and improving the land transfer mechanism to ensure a balance of interests among three critical rights (land property, contract, and management rights). In addition, the reform of rural land systems should be expanded, and the vitality of land elements should be activated. On the one hand, rural land should be sold for compensation, and the potential of land consolidation should be tapped. On the other hand, the policies supporting these endeavors, such as putting rural land on the market, establishing a unified construction land market, facilitating the selling of vacant homesteads and abandoned public welfare construction land on the market, and realizing the transformation from land resources to land capital, could increase the multifunctional value of rural settlement land.

5.3. Changes in the RSILUS Epitomize the Impact of Socioeconomic Development

Section 3.1 showed that different industrial development patterns have important impacts on the LUS types of rural settlements. Moreover, the proportions of employment in and income from nonagricultural industries in rural areas exhibit complex influences on the changes in RSILUS.
Development of the secondary sector may finally lead to a low probability of land use change in rural settlements. According to the current employment conditions of the rural population, the increase in employment in the secondary industry is mainly realized through allopatric employment. Affected by the imperfect exit mechanism of rural homesteads and the urban–rural dual structure system in China, people working and living in urban areas still occupy homesteads in rural areas and retain their household registration origin, resulting in the phenomenon of people who leave their hometowns without actually leaving either the land or the household. This part of the population lives elsewhere throughout the year, but rural settlement land does not rapidly respond to population movements, which leads to a lack of motivation for changes in rural land elements.
In contrast, the development of tertiary industry more readily increases the vitality of rural settlements. This phenomenon is strongly associated with the environmental attraction of tertiary industrial development. First, the rural tertiary industry often adopts rural tourism as its foundation, which requires a good infrastructure system and environmental conditions to attract tourists. Moreover, with the development of tertiary industry and increases in income, to establish a cycle of benefit, rural areas must continue to invest in strengthening the construction of public service facilities, improving traffic conditions, and increasing the probability that rural LUS types will change. In addition, the development of the rural tertiary industry continuously absorbs the rural labor force and creates local jobs, which not only increases the income of farmers but also enhances rural vitality.
In summary, relying only on urban development to employ the rural population will lead to the outflow of rural development factors and result in a shortage of rural manpower and capital. Therefore, in the process of rural revitalization, rural development should integrate the three industries, adjust the single industrial structure mode in rural areas, and develop new industries, such as agricultural and by-product processing, rural tourism or digital agriculture, and rural e-commerce, to establish a new industrial system with the integrated development of the three industries. However, the integrated growth of the three industries in rural areas is a process of constantly optimizing the industrial structure and growing the industrial chain. Hence, the first step should be to provide the necessary transportation infrastructure for the development and integration of the three industries. Moreover, new types of industry and agriculture and urban–rural relationships should be built, rural infrastructure investments should be increased, shortcomings in rural public services should be mitigated, various resources should be shared between urban and rural areas via the reform of land and property rights, and rural development should be promoted.

5.4. Contributions, Limitations, and Prospects

A rural settlement is an overall land space formed by a combination of different land use types within it, and its internal land use structure is highly heterogeneous. This paper refines the traditional rural settlement simulation study by applying the CA–Markov model. Methodologically, we focus on the influence of natural and socioeconomic factors, selecting indicators from a variety of perspectives such as geographical conditions, hydrological conditions, regional natural resource possession, locational conditions, socioeconomic development, industrial structure, and employment structure to constrain the local conversion rules of the cells. Meanwhile, taking into account the competition relationship among different land use types within rural settlements, we subdivided the rural settlements into seven land use types, constructed seven spatial logistic regression models, and generated a conversion suitability atlas of seven types of cells to distinguish the heterogeneous characteristics of different land use types. Finally, the various suitability atlases are combined into a spatial suitability atlas for rural settlement sites, which is used as a global conversion rule for CA and incorporated into the CA–Markov simulation model. Compared with the existing rural settlement simulation studies, the innovation and contribution of this paper lies in the fact that the rural settlements are no longer considered to be a single patch in the simulation [44,45,46,47]. Instead, it considers the competition among different land use types within rural settlements and focuses on the differences of the RSILUS. This is important for refining and enriching the simulation of rural settlements and formulating strategies for optimizing the differentiation of RSILUS to promote rural development.
However, the land space of rural settlements constitutes the core of the social interactions among farmers [2,71]. It is subject to both macro policies and the influence of the rural behavioral agents (people). This will lead to a variety of possibilities for changes of RSILUS. Consequently, according to different planning directions and policy requirements, considering the needs of various actors in rural land use, the RSILUS under different scenarios will become the key content of future rural settlement simulation research.

6. Conclusions

Research on the influencing factors of RSILUS changes and the simulation of its future evolution can provide a theoretical basis for the optimization of rural areas. Taking Pinggu District as an example, this paper examined the driving factors of the RSILUS changes and performed a simulation study of the RSILUS in 2025. The conclusions are as follows:
Changes in the RSILUS are the combined result of natural conditions and socioeconomic factors. However, there are significant distinctions in the intensities and mechanisms of the influencing factors and their relationships with the RSILUS. RHL is greatly affected by the altitude, slope, and arable land area per capita, whereas RIL and RVL are subjected mainly to the proportion of employment in and income from nonagricultural industries, and the change in RPSL is dominated largely by the proportion of income from tertiary industry, the proportion of employment in tertiary industry, and slope.
The simulation results in 2025 reveal that RHL will remain the dominant and basic composition of rural settlements in Pinggu District. RPSL, RIL, and RVL will vary; they will occupy large proportions of the land areas of rural settlements in various towns and villages, and their overall distribution scales will be relatively large. In terms of its spatial distribution, RHL presents primarily as the distribution of small, highly scattered clusters, while RIL, RCL, and RVL all form multicore clustering centers, whereas RPSL exhibits a polar core distribution pattern.
From 2015 to 2025, rural land will continue to recede, and RIL and RCL in Pinggu District will decrease by approximately 16.95% and 16.37%, respectively. Similarly, RHL and RPSL will decrease by approximately 10.14% and 10.09%, respectively, while RVL will increase by approximately 2.01%. However, the changes in the various LUS types demonstrate obvious spatial heterogeneity, with RHL considerably decreasing in the southwestern urban fringe. Moreover, the living function of rural settlements will significantly deteriorate, and RVL will increase overall. The central outer suburbs will be characterized by a large-scale reduction in RIL, RHL, and RPSL, whereas the northeastern rural hinterland of Pinggu District will be dominated by increases in RCL and RPSL and a decrease in RVL.

Author Contributions

Data analysis, visualization, and writing—original draft, Y.T.; data curation, software, G.J.; conceptualization, formal analysis, D.Z. and T.Z.; methodology, writing, review and editing, G.J. and W.M. All authors have read and agreed to the published version of the manuscript.

Funding

This research was funded by the National Natural Science Foundation of China(Grant No. 42071249, 41671519, 42001199), the National Social Science Foundation of China(Grant No.20&ZD090) and the National Key Research and Development Program of China(2018YFD1100305).

Institutional Review Board Statement

Not applicable.

Informed Consent Statement

Not applicable.

Data Availability Statement

The Resource and Environment Data Cloud Platform in the Chinese Academy of Sciences provided the DEM data (http://www.resdc.cn/, accessed on 21 May 2020). The Beijing Municipal Commission of Planning and Natural Resources provided the land use data and relevant socio-economic data.

Conflicts of Interest

The authors declare no conflict of interest.

References

  1. Dadashpoor, H.; Azizi, P.; Moghadasi, M. Land use change, urbanization, and change in landscape pattern in a metropolitan area. Sci. Total Environ. 2018, 655, 707–719. [Google Scholar] [CrossRef] [PubMed]
  2. Hedlund, M.; Lundholm, E. Restructuring of rural Sweden—Employment transition and out-migration of three cohorts born 1945–1980. J. Rural Stud. 2015, 42, 123–132. [Google Scholar] [CrossRef]
  3. Liu, Y.; Liu, Y.; Zhai, R. Geographical research and optimizing practice of rural hollowing in China. Acta Geophica Sin. 2009, 64, 1193–1202. [Google Scholar] [CrossRef]
  4. Markey, S.; Halseth, G.; Manson, D. Challenging the inevitability of rural decline: Advancing the policy of place in northern British Columbia. J. Rural Stud. 2008, 24, 409–421. [Google Scholar] [CrossRef]
  5. Elshof, H.; Haartsen, T.; van Wissen, L.J.; Mulder, C.H. The influence of village attractiveness on flows of movers in a declining rural region. J. Rural Stud. 2017, 56, 39–52. [Google Scholar] [CrossRef] [Green Version]
  6. Liu, Y.S. Research on the geography of rural revitalization in the new era. Geogr. Res. 2019, 38, 461–466. [Google Scholar]
  7. Chen, Z.; Liu, Y.; Feng, W.; Li, Y.; Li, L. Study on spatial tropism distribution of rural settlements in the Loess Hilly and Gully Region based on natural factors and traffic accessibility. J. Rural Stud. 2019; in press. [Google Scholar] [CrossRef]
  8. Long, H.; Li, Y.; Liu, Y.; Woods, M.; Zou, J. Accelerated restructuring in rural China fueled by ‘increasing vs. decreasing balance’ land-use policy for dealing with hollowed villages. Land Use Policy 2012, 29, 11–22. [Google Scholar] [CrossRef]
  9. Gude, P.H.; Hansen, A.J.; Rasker, R.; Maxwell, B. Rates and drivers of rural residential development in the Greater Yellowstone. Landsc. Urban Plan. 2006, 77, 131–151. [Google Scholar] [CrossRef]
  10. Li, S.S.; Cao, G.C.; Zhao, P.F. Analysis of Spatial Distribution of Rural Settlements and Its Influential Factors in Qinba Mountain Area—A Case Study of Ningqiang County in Shaanxi Province. Res. Soil Water Conserv. 2014, 21, 186–191. [Google Scholar]
  11. Conrad, C.; Rudloff, M.; Abdullaev, I.; Thiel, M.; Löw, F.; Lamers, J. Measuring rural settlement expansion in Uzbekistan using remote sensing to support spatial planning. Appl. Geogr. 2015, 62, 29–43. [Google Scholar] [CrossRef]
  12. Zhang, T.Z.; Zhang, F.R.; Xie, Z.; Huang, J.W. Spatial pattern evolution of rural settlements in mountainous areas of ethnic minorities in Yunnan Province under background of precise poverty alleviation. Trans. Chin. Soc. Agric. Eng. 2019, 35, 246–254. [Google Scholar]
  13. Shi, M.J.; Xie, Y.W.; Cao, Q. The landscape evolution and mechanism analysis of rural settlements in the oasis of arid region. Geogr. Res. 2016, 35, 692–702. [Google Scholar]
  14. Gallo, D.; Ciminale, M.; Becker, H.; Masini, N. Remote sensing techniques for reconstructing a vast Neolithic settlement in Southern Italy. J. Archaeol. Sci. 2009, 36, 43–50. [Google Scholar] [CrossRef]
  15. Long, H.; Zou, J.; Liu, Y. Differentiation of rural development driven by industrialization and urbanization in eastern coastal China. Habitat Int. 2009, 33, 454–462. [Google Scholar] [CrossRef]
  16. Porta, J.; Parapar, J.; Doallo, R.; Barbosa, V.; Santé, I.; Crecente, R.; Díaz, C. A population-based iterated greedy algorithm for the delimitation and zoning of rural settlements. Comput. Environ. Urban Syst. 2013, 39, 12–26. [Google Scholar] [CrossRef]
  17. Kohler, F.; Marchand, G.; Negrão, M. Local history and landscape dynamics: A comparative study in rural Brazil and rural France. Land Use Policy 2015, 43, 149–160. [Google Scholar] [CrossRef]
  18. Jiang, G.H.; He, X.; Ma, W.Q.; Wang, M.Z.; Zhang, R.J. Rural settlements spatial pattern evolution and zoning district based on spatial autocorrelation. Trans. Chin. Soc. Agric. Eng. 2015, 31, 265–273. [Google Scholar]
  19. Tannier, C.; Cura, R.; Leturcq, S.; Zadora-Rio, E. An agent-based model for exploring the combined effects of social and demographic changes on the concentration and hierarchy of rural settlement patterns in North-Western Europe during the Middle Ages (800–1200 CE). J. Anthr. Archaeol. 2020, 59, 101204. [Google Scholar] [CrossRef]
  20. Siciliano, G. Urbanization strategies, rural development and land use changes in China: A multiple-level integrated assessment. Land Use Policy 2012, 29, 165–178. [Google Scholar] [CrossRef]
  21. Xu, F.; Wang, Z.Q.; Zhang, H.W.; Chai, J. Application of random forest algorithm in suitability evaluation of rural residential land. Resour. Sci. 2018, 40, 2085–2098. [Google Scholar]
  22. McDowell, R.; Snelder, T.; Harris, S.; Lilburne, L.; Larned, S.; Scarsbrook, M.; Curtis, A.; Holgate, B.; Phillips, J.; Taylor, K. The land use suitability concept: Introduction and an application of the concept to inform sustainable productivity within environmental constraints. Ecol. Indic. 2018, 91, 212–219. [Google Scholar] [CrossRef]
  23. Liu, J.; Jin, X.B.; Fan, Y.T.; Xiang, X.M.; Ran, N.; Zhou, Y.K.; Shen, C.Z. Rural residential land consolidation strategy from a perspective synthesizing towns, villages and land parcels: A case study in Xinyi city, Jiangsu province. Geogr. Res. 2018, 37, 678–694. [Google Scholar]
  24. Woods, M. Engaging the global countryside: Globalization, hybridity and the reconstitution of rural place. Prog. Hum. Geogr. 2007, 31, 485–507. [Google Scholar] [CrossRef] [Green Version]
  25. Su, R.; Wang, C. Rural settlement spatial layout optimization using network center radiation guidance for Yanba Village in Chongqing. Resour. Sci. 2018, 40, 958–966. [Google Scholar]
  26. Alcock, R. The New Rural Reconstruction Movement: A Chinese degrowth style movement? Ecol. Econ. 2019, 161, 261–269. [Google Scholar] [CrossRef]
  27. Perkins, H.C. Commodification: Re-resourcing rural areas. In Handbook of Rural Studies; Clock, P., Marsden, T., Mooney, H.P., Eds.; SAGE Publications Ltd.: London, UK, 2006; p. 496. [Google Scholar]
  28. Tian, Y.; Kong, X.; Liu, Y.; Wang, H. Restructuring rural settlements based on an analysis of inter-village social connections: A case in Hubei Province, Central China. Habitat Int. 2016, 57, 121–131. [Google Scholar] [CrossRef]
  29. Zou, Y.F.; Li, Y.J.; Ma, T.J.; Yuan, Z.H.; Liu, J. Spatial distribution optimization of rural residential areas based on town planning regulation. Trans. Chin. Soc. Agric. Eng. 2018, 34, 238–244. [Google Scholar]
  30. Mikle, G. Long-term transformation of Hungarian manors: The relevance of the rural restructuring approach and the concept of the precariat. J. Rural Stud. 2020, 77, 105–112. [Google Scholar] [CrossRef]
  31. Woods, M. Rural geography III rural futures and the future of rural geography. Prog. Hum. Geogr. 2012, 36, 125–134. [Google Scholar] [CrossRef]
  32. Jiang, G.; Ma, W.; Dingyang, Z.; Qinglei, Z.; Ruijuan, Z. Agglomeration or dispersion? Industrial land-use pattern and its impacts in rural areas from China′s township and village enterprises perspective. J. Clean. Prod. 2017, 159, 207–219. [Google Scholar] [CrossRef]
  33. Zhang, B.L.; Cai, W.M.; Zhang, F.R.; Feng, T.; Zhang, L. Progress and prospects of micro-scale research on rural residential land in China. Prog. Geogr. 2016, 35, 1049–1061. [Google Scholar]
  34. Cao, Z.J.; Zhang, F.R.; Jiang, G.H.; Meng, F.Y.; Jin, M.L. Analyzing LUS difference of rural residential areas in different regions of Pinggu District of Beijing. Prog. Geogr. 2008, 27, 121–126. [Google Scholar]
  35. Tian, Y.Y.; Jiang, G.H.; He, X.; Qu, Y.B.; Zhou, D.Y. Internal land use structure difference analysis of rural settlements in Pinggu District, Beijing. Trans. Chin. Soc. Agric. Eng. 2019, 35, 263–273. [Google Scholar]
  36. Bański, J.; Wesołowska, M. Transformations in housing construction in rural areas of Poland’s Lublin region—Influence on the spatial settlement structure and landscape aesthetics. Landsc. Urban Plan. 2010, 94, 116–126. [Google Scholar] [CrossRef]
  37. Zhu, F.; Zhang, F.; Li, C.; Zhu, T. Functional transition of the rural settlement: Analysis of land-use differentiation in a transect of Beijing, China. Habitat Int. 2014, 41, 262–271. [Google Scholar] [CrossRef]
  38. Ma, W.; Jiang, G.; Wang, D.; Li, W.; Guo, H.; Zheng, Q. Rural settlements transition (RST) in a suburban area of metropolis: Internal structure perspectives. Sci. Total Environ. 2018, 615, 672–680. [Google Scholar] [CrossRef]
  39. Kamusoko, C.; Aniya, M.; Adi, B.; Manjoro, M. Rural sustainability under threat in Zimbabwe—Simulation of future land use/cover changes in the Bindura district based on the Markov-cellular automata model. Appl. Geogr. 2009, 29, 435–447. [Google Scholar] [CrossRef]
  40. Sakieh, Y.; Amiri, B.J.; Danekar, A.; Feghhi, J.; Dezhkam, S. Simulating urban expansion and scenario prediction using a cellular automata urban growth model, SLEUTH, through a case study of Karaj City, Iran. Neth. J. Hous. Built Environ. 2015, 30, 591–611. [Google Scholar] [CrossRef]
  41. He, J.; Huang, J.; Li, C. The evaluation for the impact of land use change on habitat quality: A joint contribution of cellular automata scenario simulation and habitat quality assessment model. Ecol. Model. 2017, 366, 58–67. [Google Scholar] [CrossRef]
  42. Firozjaei, M.K.; Sedighi, A.; Argany, M.; Jelokhani-Niaraki, M.; Arsanjani, J.J. A geographical direction-based approach for capturing the local variation of urban expansion in the application of CA-Markov model. Cities 2019, 93, 120–135. [Google Scholar] [CrossRef]
  43. Mansour, S.; Al-Belushi, M.; Al-Awadhi, T. Monitoring land use and land cover changes in the mountainous cities of Oman using GIS and CA-Markov modelling techniques. Land Use Policy 2020, 91, 104414. [Google Scholar] [CrossRef]
  44. Jiang, G.H.; Zhang, F.R.; Chen, J.W.; Duan, Z.Q.; Su, Z.Y. Analysis of the driving forces of change of rural residential areas in Beijing mountainous areas based on Logistic regression model. Trans. CSAE 2007, 23, 81–87. [Google Scholar]
  45. Peng, J.J.; Kong, X.S.; Liu, Y.L.; Cui, J.X. Spatial optimum allocation of rural settlements based on agent mode. Geogr. Geo-Inf. Sci. 2016, 32, 52–58. [Google Scholar]
  46. Lu, D.B.; Mao, W.l.; Yu, Z.; Bai, B. Simulation Study on the Spatial Growth of Rural Settlements in the Mountainous Area Based on Improved MCR Model. Res. Soil Water Conserv. 2016, 23, 322–326, 349. [Google Scholar] [CrossRef]
  47. Gong, J.; Yang, J.X.; Li, Y.F. A case-based cellular automation model for simulating changes in rural residential areas. Resour. Sci. 2015, 37, 1797–1806. [Google Scholar]
  48. Sang, L.; Zhang, C.; Yang, J.; Zhu, D.; Yun, W. Simulation of land use spatial pattern of towns and villages based on CA–Markov model. Math. Comput. Model. 2011, 54, 938–943. [Google Scholar] [CrossRef]
  49. Li, H.; Yuan, Y.; Zhang, X.; Li, Z.; Wang, Y.; Hu, X. Evolution and transformation mechanism of the spatial structure of rural settlements from the perspective of long-term economic and social change: A case study of the Sunan region, China. J. Rural Stud. 2019; in press. [Google Scholar] [CrossRef]
  50. Dumreicher, H. Chinese villages and their sustainable future: The European Union-China-Research Project “SUCCESS”. J. Environ. Manag. 2008, 87, 204–215. [Google Scholar] [CrossRef]
  51. Tu, S.; Long, H.; Zhang, Y.; Ge, D.; Qu, Y. Rural restructuring at village level under rapid urbanization in metropolitan suburbs of China and its implications for innovations in land use policy. Habitat Int. 2018, 77, 143–152. [Google Scholar] [CrossRef]
  52. Li, Y.; Westlund, H.; Liu, Y. Why some rural areas decline while some others not: An overview of rural evolution in the world. J. Rural Stud. 2019, 68, 135–143. [Google Scholar] [CrossRef]
  53. Long, H.; Tu, S.; Ge, D.; Li, T.; Liu, Y. The allocation and management of critical resources in rural China under restructuring: Problems and prospects. J. Rural Stud. 2016, 47, 392–412. [Google Scholar] [CrossRef] [Green Version]
  54. Tan, M.; Li, X. The changing settlements in rural areas under urban pressure in China: Patterns, driving forces and policy implications. Landsc. Urban Plan. 2013, 120, 170–177. [Google Scholar] [CrossRef]
  55. Wang, Q.; Guan, Q.; Lin, J.; Luo, H.; Tan, Z.; Ma, Y. Simulating land use/land cover change in an arid region with the coupling models. Ecol. Indic. 2020, 122, 107231. [Google Scholar] [CrossRef]
  56. Tao, Z.; Guanghui, J.; Guangyong, L.; Dingyang, Z.; Yanbo, Q. Neglected idle rural residential land (IRRL) in metropolitan suburbs: Spatial differentiation and influencing factors. J. Rural Stud. 2020, 78, 163–175. [Google Scholar] [CrossRef]
  57. Ma, W.; Jiang, G.; Li, W.; Zhou, T. How do population decline, urban sprawl and industrial transformation impact land use change in rural residential areas? A comparative regional analysis at the peri-urban interface. J. Clean. Prod. 2018, 205, 76–85. [Google Scholar] [CrossRef]
  58. Arsanjani, J.J.; Helbich, M.; Kainz, W.; Boloorani, A.D. Integration of logistic regression, Markov chain and cellular automata models to simulate urban expansion. Int. J. Appl. Earth Obs. Geoinform. 2013, 21, 265–275. [Google Scholar] [CrossRef]
  59. Deng, H.; Shao, J.A.; Wang, J.L.; Gao, M.; Wei, C.F. Land use driving forces and its future scenario simulation in the Three Gorges Reservoir Area using CLUE-S model. Acta Geogr. Sin. 2016, 71, 1979–1997. [Google Scholar]
  60. Fu, X.; Wang, X.; Yang, Y.J. Deriving suitability factors for CA-Markov land use simulation model based on local historical data. J. Environ. Manag. 2018, 206, 10–19. [Google Scholar] [CrossRef]
  61. Clarke, K.C.; Gaydos, L.J. Loose-coupling a cellular automaton model and GIS: Long-term urban growth pre-diction for San Francisco and Washington/Baltimore. Int. J. Geogr. Inf. Sci. 1998, 12, 699–714. [Google Scholar] [CrossRef] [Green Version]
  62. Munshi, T.; Zuidgeest, M.; Brussel, M.; van Maarseveen, M. Logistic regression and cellular automata-based modelling of retail, commercial and residential development in the city of Ahmedabad, India. Cities 2014, 39, 68–86. [Google Scholar] [CrossRef]
  63. Siddiqui, A.; Siddiqui, A.; Maithani, S.; Jha, A.K.; Kumar, P.; Srivastav, S. Urban growth dynamics of an Indian metropolitan using CA Markov and Logistic Regression. Egypt. J. Remote Sens. Space Sci. 2018, 21, 229–236. [Google Scholar] [CrossRef]
  64. Ghosh, P.; Mukhopadhyay, A.; Chanda, A.; Mondal, P.; Akhand, A.; Mukherjee, S.; Nayak, S.; Ghosh, S.; Mitra, D.; Ghosh, T.; et al. Application of Cellular automata and Markov-chain model in geospatial environmental modeling—A review. Remote Sens. Appl. Soc. Environ. 2017, 5, 64–77. [Google Scholar] [CrossRef]
  65. Yang, X.; Zheng, X.-Q.; Chen, R. A land use change model: Integrating landscape pattern indexes and Markov-CA. Ecol. Model. 2014, 283, 1–7. [Google Scholar] [CrossRef]
  66. Anderson, T.K. Kernel density estimation and K-means clustering to profile road accident hotspots. Accid. Anal. Prev. 2009, 41, 359–364. [Google Scholar] [CrossRef]
  67. Sun, J.W.; Kong, X.S.; Tian, Y.S. Identifying Reconstruction Directions of Rural Settlements Based on Analysis of Spatial Combination Features. Sci. Geogr. Sin. 2017, 37, 748–755. [Google Scholar] [CrossRef]
  68. Verburg, P.H.; van de Steeg, J.; Veldkamp, A.; Willemen, L. From land cover change to land function dynamics: A major challenge to improve land characterization. J. Environ. Manag. 2009, 90, 1327–1335. [Google Scholar] [CrossRef]
  69. Westlund, H.; Kobayashi, K. Social Capital and Rural Development in the Knowledge Society; Edward Elgar Publishing: Cheltenham, UK, 2013; pp. 1–18. [Google Scholar] [CrossRef]
  70. Esparcia, J. Innovation and networks in rural areas. An analysis from European innovative projects. J. Rural Stud. 2014, 34, 1–14. [Google Scholar] [CrossRef]
  71. Tian, G.; Qiao, Z.; Gao, X. Rural settlement land dynamic modes and policy implications in Beijing metropolitan region, China. Habitat Int. 2014, 44, 237–246. [Google Scholar] [CrossRef]
Figure 1. Study area (the abbreviations of the townships are as follows: PG (Pinggu), DXZ (Daxingzhuang), DGC (Donggaocun), MCY (Machangying), WXZ (Wangxinzhuang), XGZ (Xiagezhuang), MF (Mafang), YK (Yukou), SDZ (Shandongzhuang), JHH (Jinhaihu), LJD (Liujiadian), NDLH (Nandulehe), DHS (Dahuashan), XEZ (Xiongerzhai), ZLY (Zhenluoying), and HSY (Huangsongyu)).
Land 11 00661 g001
Figure 2. Screening of the influencing factors of the RSILUS.
Land 11 00661 g002
Figure 3. CA–Markov model simulation process.
Land 11 00661 g003
Figure 4. Current situation and simulated distribution of the RSILUS in Pinggu District. (a) Present situation of the RSILUS in 2015. (b) Present situation of the RSILUS in 2019. (c) Simulation situation of the RSILUS in 2019. (d) Simulation situation of the RSILUS in 2025.
Land 11 00661 g004
Figure 5. Combination types of the RSILUS in Pinggu District in 2025.
Land 11 00661 g005
Figure 6. Distribution of the kernel density of the RSILUS in 2025. (a) Distribution of the kernel density of RCL. (b) Distribution of the kernel density of RIL. (c) Distribution of the kernel density of RHL. (d) Distribution of the kernel density of RPSL. (e) Distribution of the kernel density of RVL.
Land 11 00661 g006aLand 11 00661 g006b
Figure 7. Changes in the RSILUS in Pinggu District from 2015 to 2025. (a) The RSILUS in Pinggu District in 2015. (b) The RSILUS in Pinggu District in 2025.
Land 11 00661 g007
Table 1. Analyzing the driving factors of the RSILUS change.
Driving FactorsLand Use Types
RCLRILRHLRPSLRRLRSLRVL
β OR β OR β OR β OR β OR β OR β OR
Elevation −0.004 ***0.996−0.017 ***0.984−0.018 ***0.981−0.005 ***0.995−0.012 ***0.988−0.013 ***0.987−0.001 ***0.999
GDP per km20.007 ***1.0070.003 ***1.0030.0001.000−0.006 ***0.994−0.004 ***0.996
Primary industry income per km20.001 ***1.001
Share of employment in secondary industry−0.902 ***0.406−9.157 ***0.000−31.77 ***0.000−9.050 ***0.000−3.127 ***0.044−1.598 ***0.202
Share of income from secondary industry0.741 ***2.098−0.7010.4960.689 *1.9921.505 *4.5023.177 ***23.977
Area of arable land0.0001.0000.001 ***1.001−0.002 ***0.9990.0001.0000.0001.0000.0001.0000.0001.000
Distance to rivers0.0001.0000.0001.0000.001 ***1.0010.0001.0000.0001.0000.0011.001−0.001 ***0.999
Net income per capita0.0001.0000.0001.0000.001 ***1.0010.0001.0000.0001.0000.0001.0000.0001.000
Area of cultivated land per capita−0.025 **0.976−0.120 ***0.887−0.293 ***0.753−0.019 *0.9810.090 **1.094−0.0930.9110.050 ***1.051
Population density−0.001 ***0.999−0.005 ***0.995−0.009 ***0.993−0.002 **0.9980.001 ***1.0010.001 *1.0010.0001.000
Distance to main roads−0.001 ***0.999−0.006 ***0.994−0.001 ***0.999−0.004 **0.9960.0001.000−0.001 ***0.999−0.002 ***0.998
Share of tertiary industry employment1.977 ***7.219−0.766 **0.465−1.876 ***0.5321.170 ***3.2223.085 ***21.860−1.400 ***0.247
Share of income from tertiary industry2.927 ***18.6703.431 ***30.9071.223 ***4.2582.368 ***10.6740.6441.9050.435 ***1.544
Slope−0.018 ***0.9820.0021.002−0.209 ***0.807−0.016 ***0.9840.049 ***1.0500.048 **1.050−0.032 ***0.969
Distance to towns0.0001.0000.0001.0000.001 ***1.0010.0001.0000.0001.000.0001.0000.0001.000
Constant0.3841.4686.260522.9610.2681.8202.0938.1060.9072.477−2.0050.1350.3751.454
ROC value0.8020.9620.9370.9250.7660.8300.896
Prediction accuracy73.6%92.8%88.5%83.2%71.4%79.2%83.2%
Note: β is a regression coefficient, and its numerical value indicates the influence degree of the various driving factors on each land type. OR is the increase degree of the land use change probability, and its value indicates the increase or decrease in the land use change probability for every increase of 1 unit in the influencing factor. *, **, and *** indicate significance at the 10%, 5%, and 1% levels, respectively.
Table 2. Combination Type of the RSILUS in Pinggu District in 2025.
TownCombination CoefficientType NumbersCombination Type
MF204RHL + RIL + RPSL + RVL
SDZ504RHL + RIL + RPSL + RVL
WXZ1434RHL + RIL + RPSL + RVL
YK204RHL + RIL + RPSL + RVL
XGZ274RHL + RIL + RPSL + RVL
DHS794RHL + RIL + RPSL + RVL
PG1242RHL + RPSL
DGC3382RHL + RPSL
XEZ1292RHL + RPSL
ZLY3442RHL + RPSL
HSY1084RHL + RPSL + RIL + RCL
LJD783RHL + RVL + RPSL
JHH1523RHL + RPSL + RCL
DXZ2224RHL + RVL + RIL + RPSL
MCY1693RHL + RIL + RPSL
NDLH443RHL + RIL + RCL
Table 3. Changes in the RSILUS in Pinggu District (ha).
Type2005201520252015–20052025–2015
RCL105.0083.6969.99−21.31−13.70
RIL481.83393.41326.71−88.42−66.70
RSL4411.4839463545.9−465.48−400.10
RPSL330.40284.7255.97−45.7−28.73
RRL6.877.688.380.810.70
RSL8.957.316.11−1.64−1.20
RVL207.42214.01218.316.594.30
Total5551.954936.804431.37−615.15−505.43
Publisher’s Note: MDPI stays neutral with regard to jurisdictional claims in published maps and institutional affiliations.

