
Understanding the Driving Factors for Urban Human Settlement Vitality at Street Level: A Case Study of Dalian, China


Abstract
:1. Introduction
2. The Vitality of Urban Human Settlements
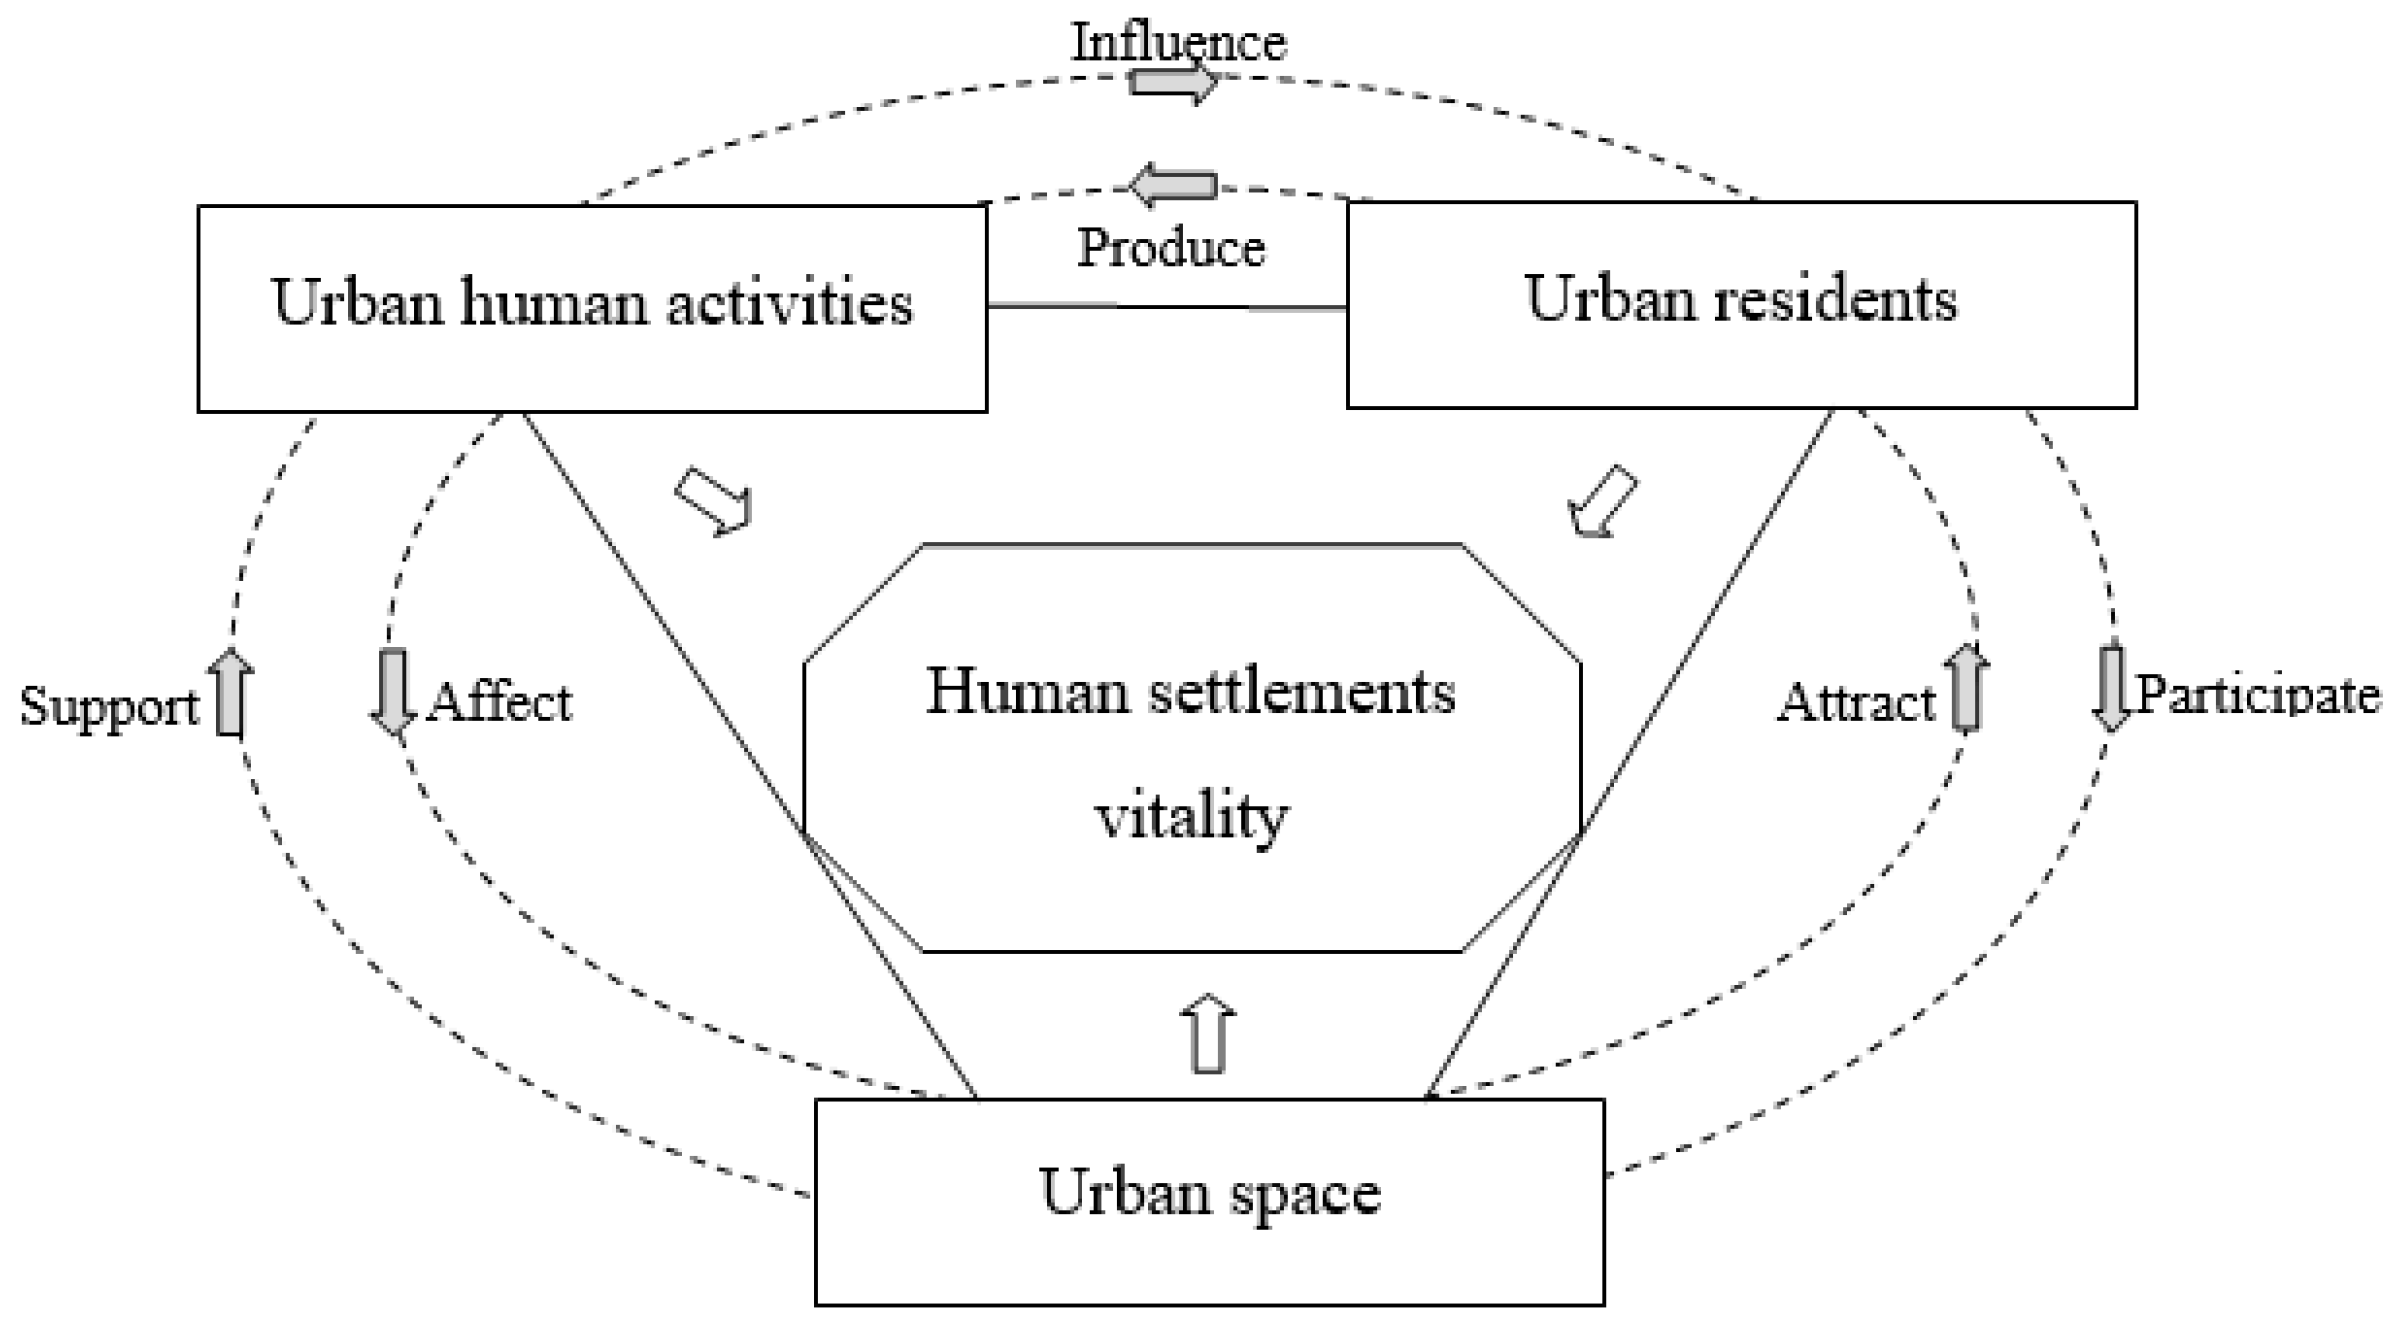
2.1. The Concept of Urban Human Settlements Vitality
2.2. Basic Conditions
3. Data and Methods
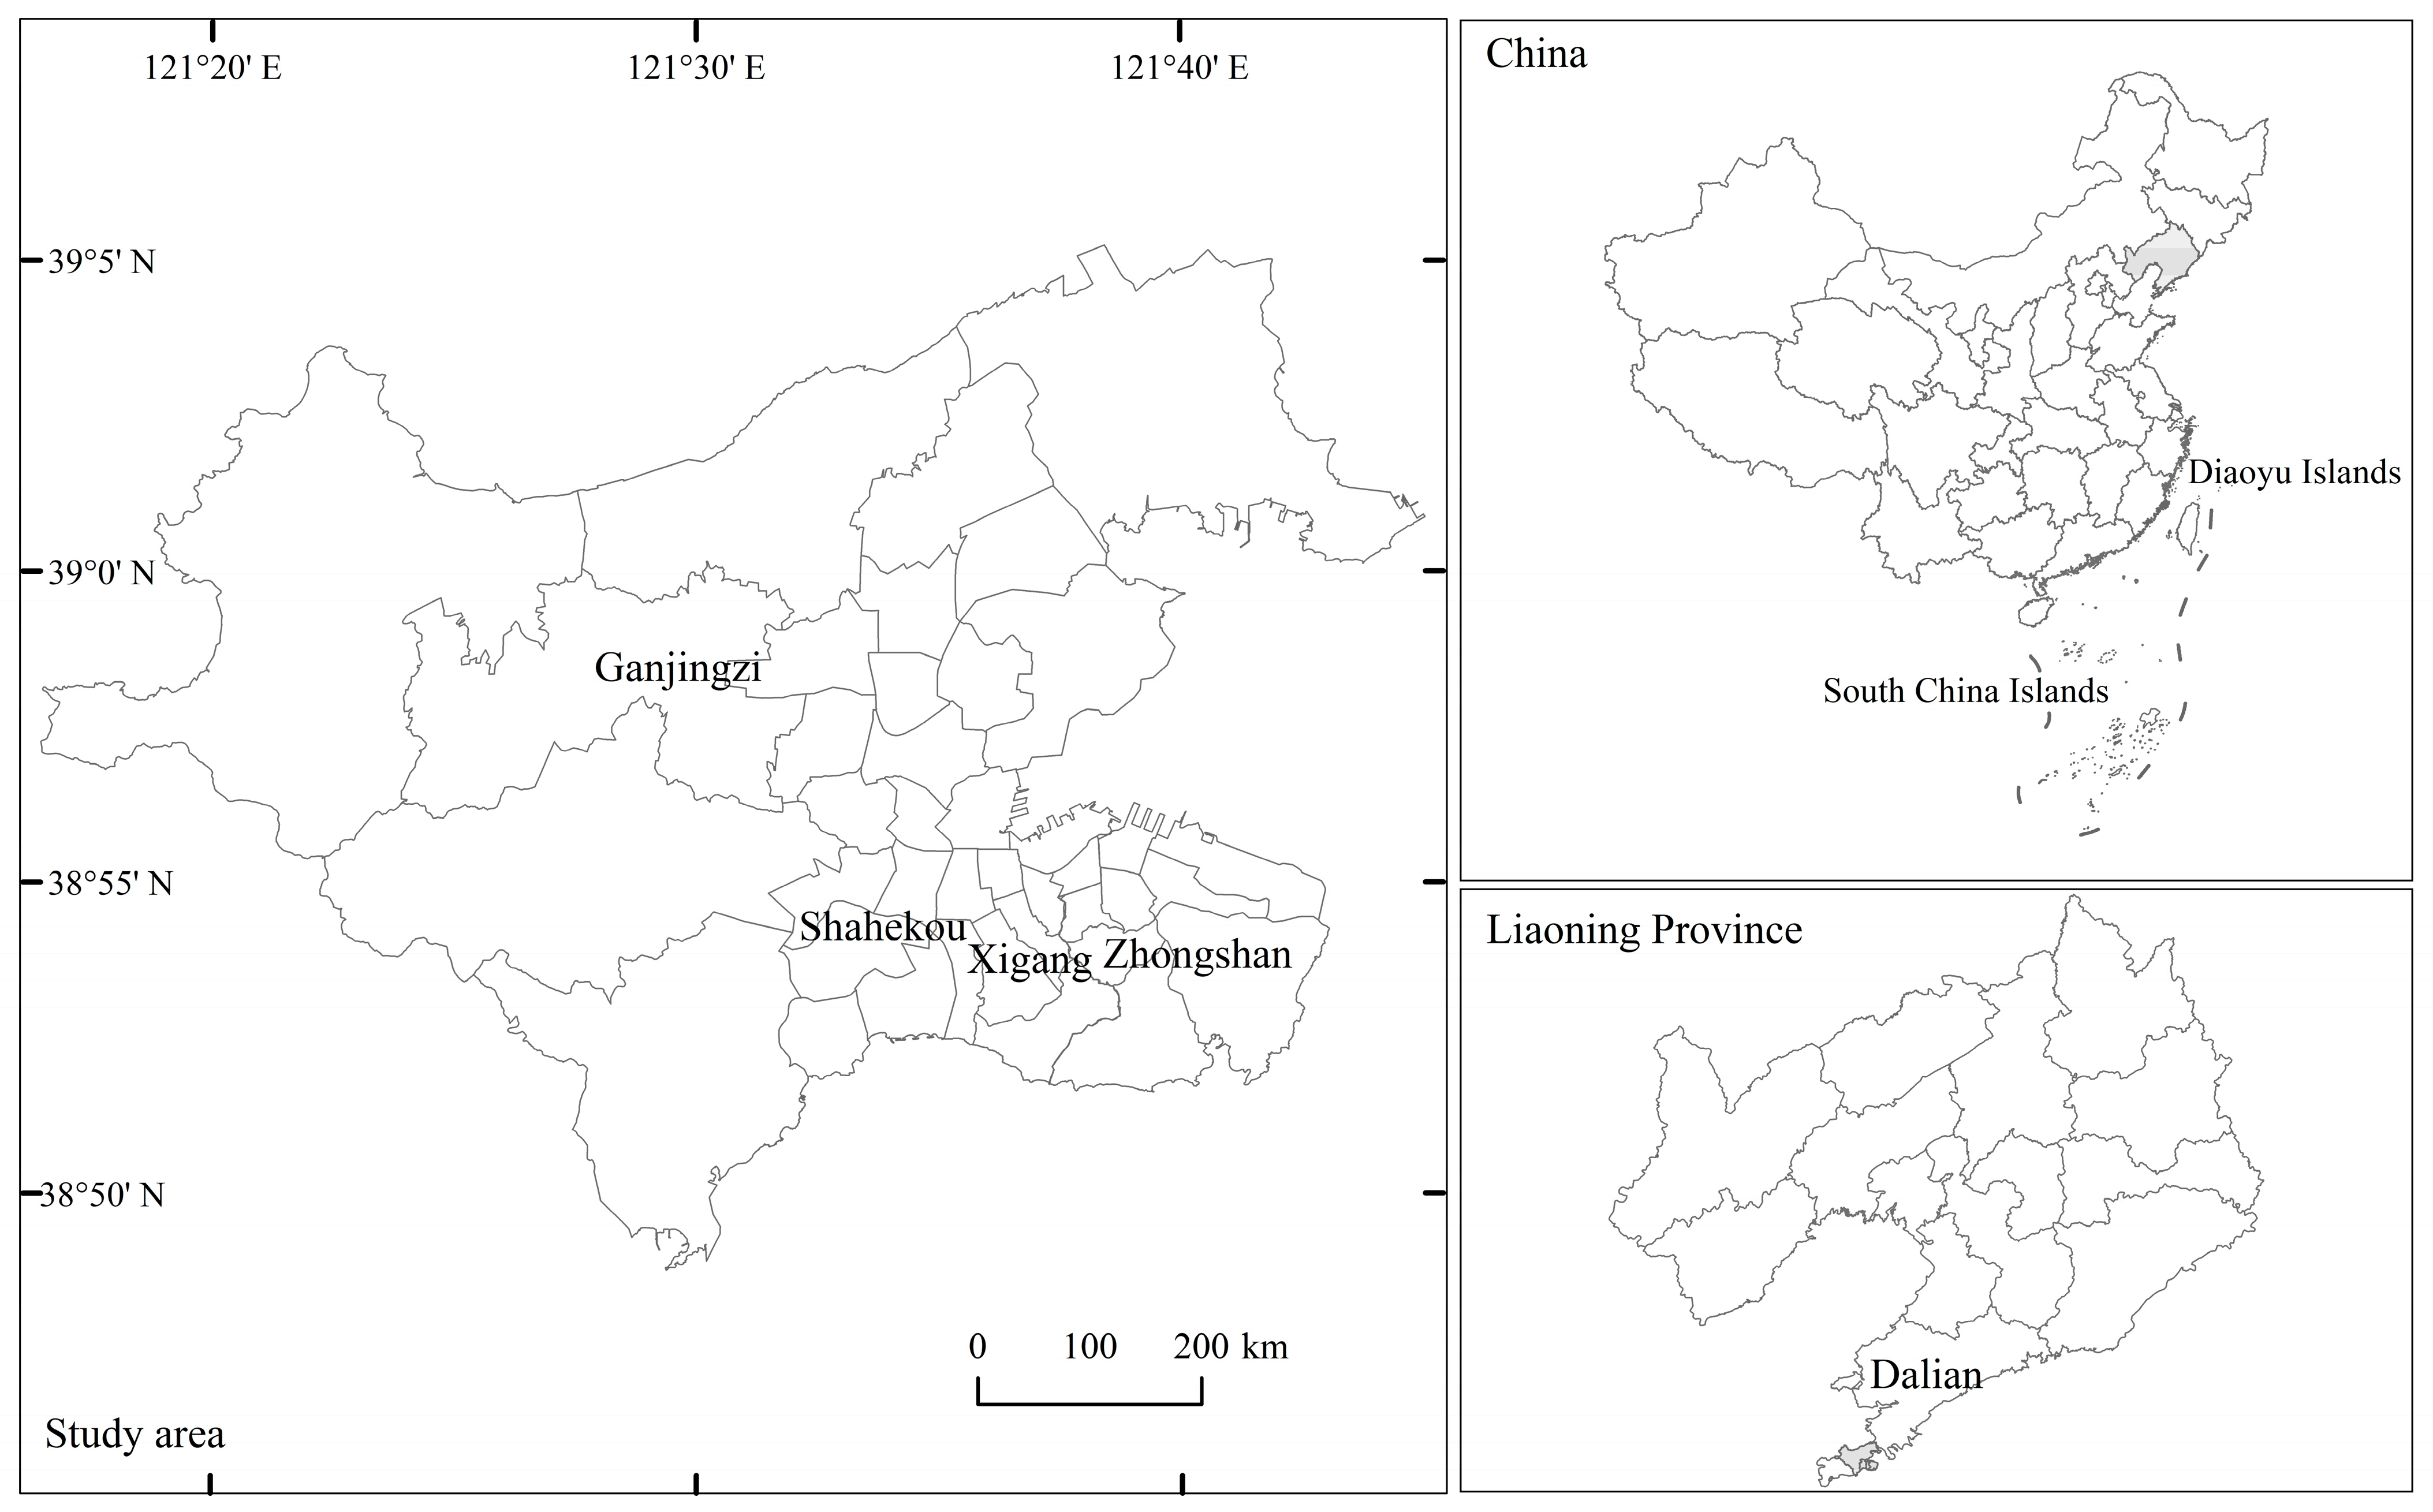
3.1. Study Area
3.2. Index System
3.3. Impact Factor Selection
3.4. Research Method
3.4.1. Projection Pursuit Model
3.4.2. Spatial Autocorrelation Analysis
3.4.3. Spatial Measurement Model
4. Result Analysis
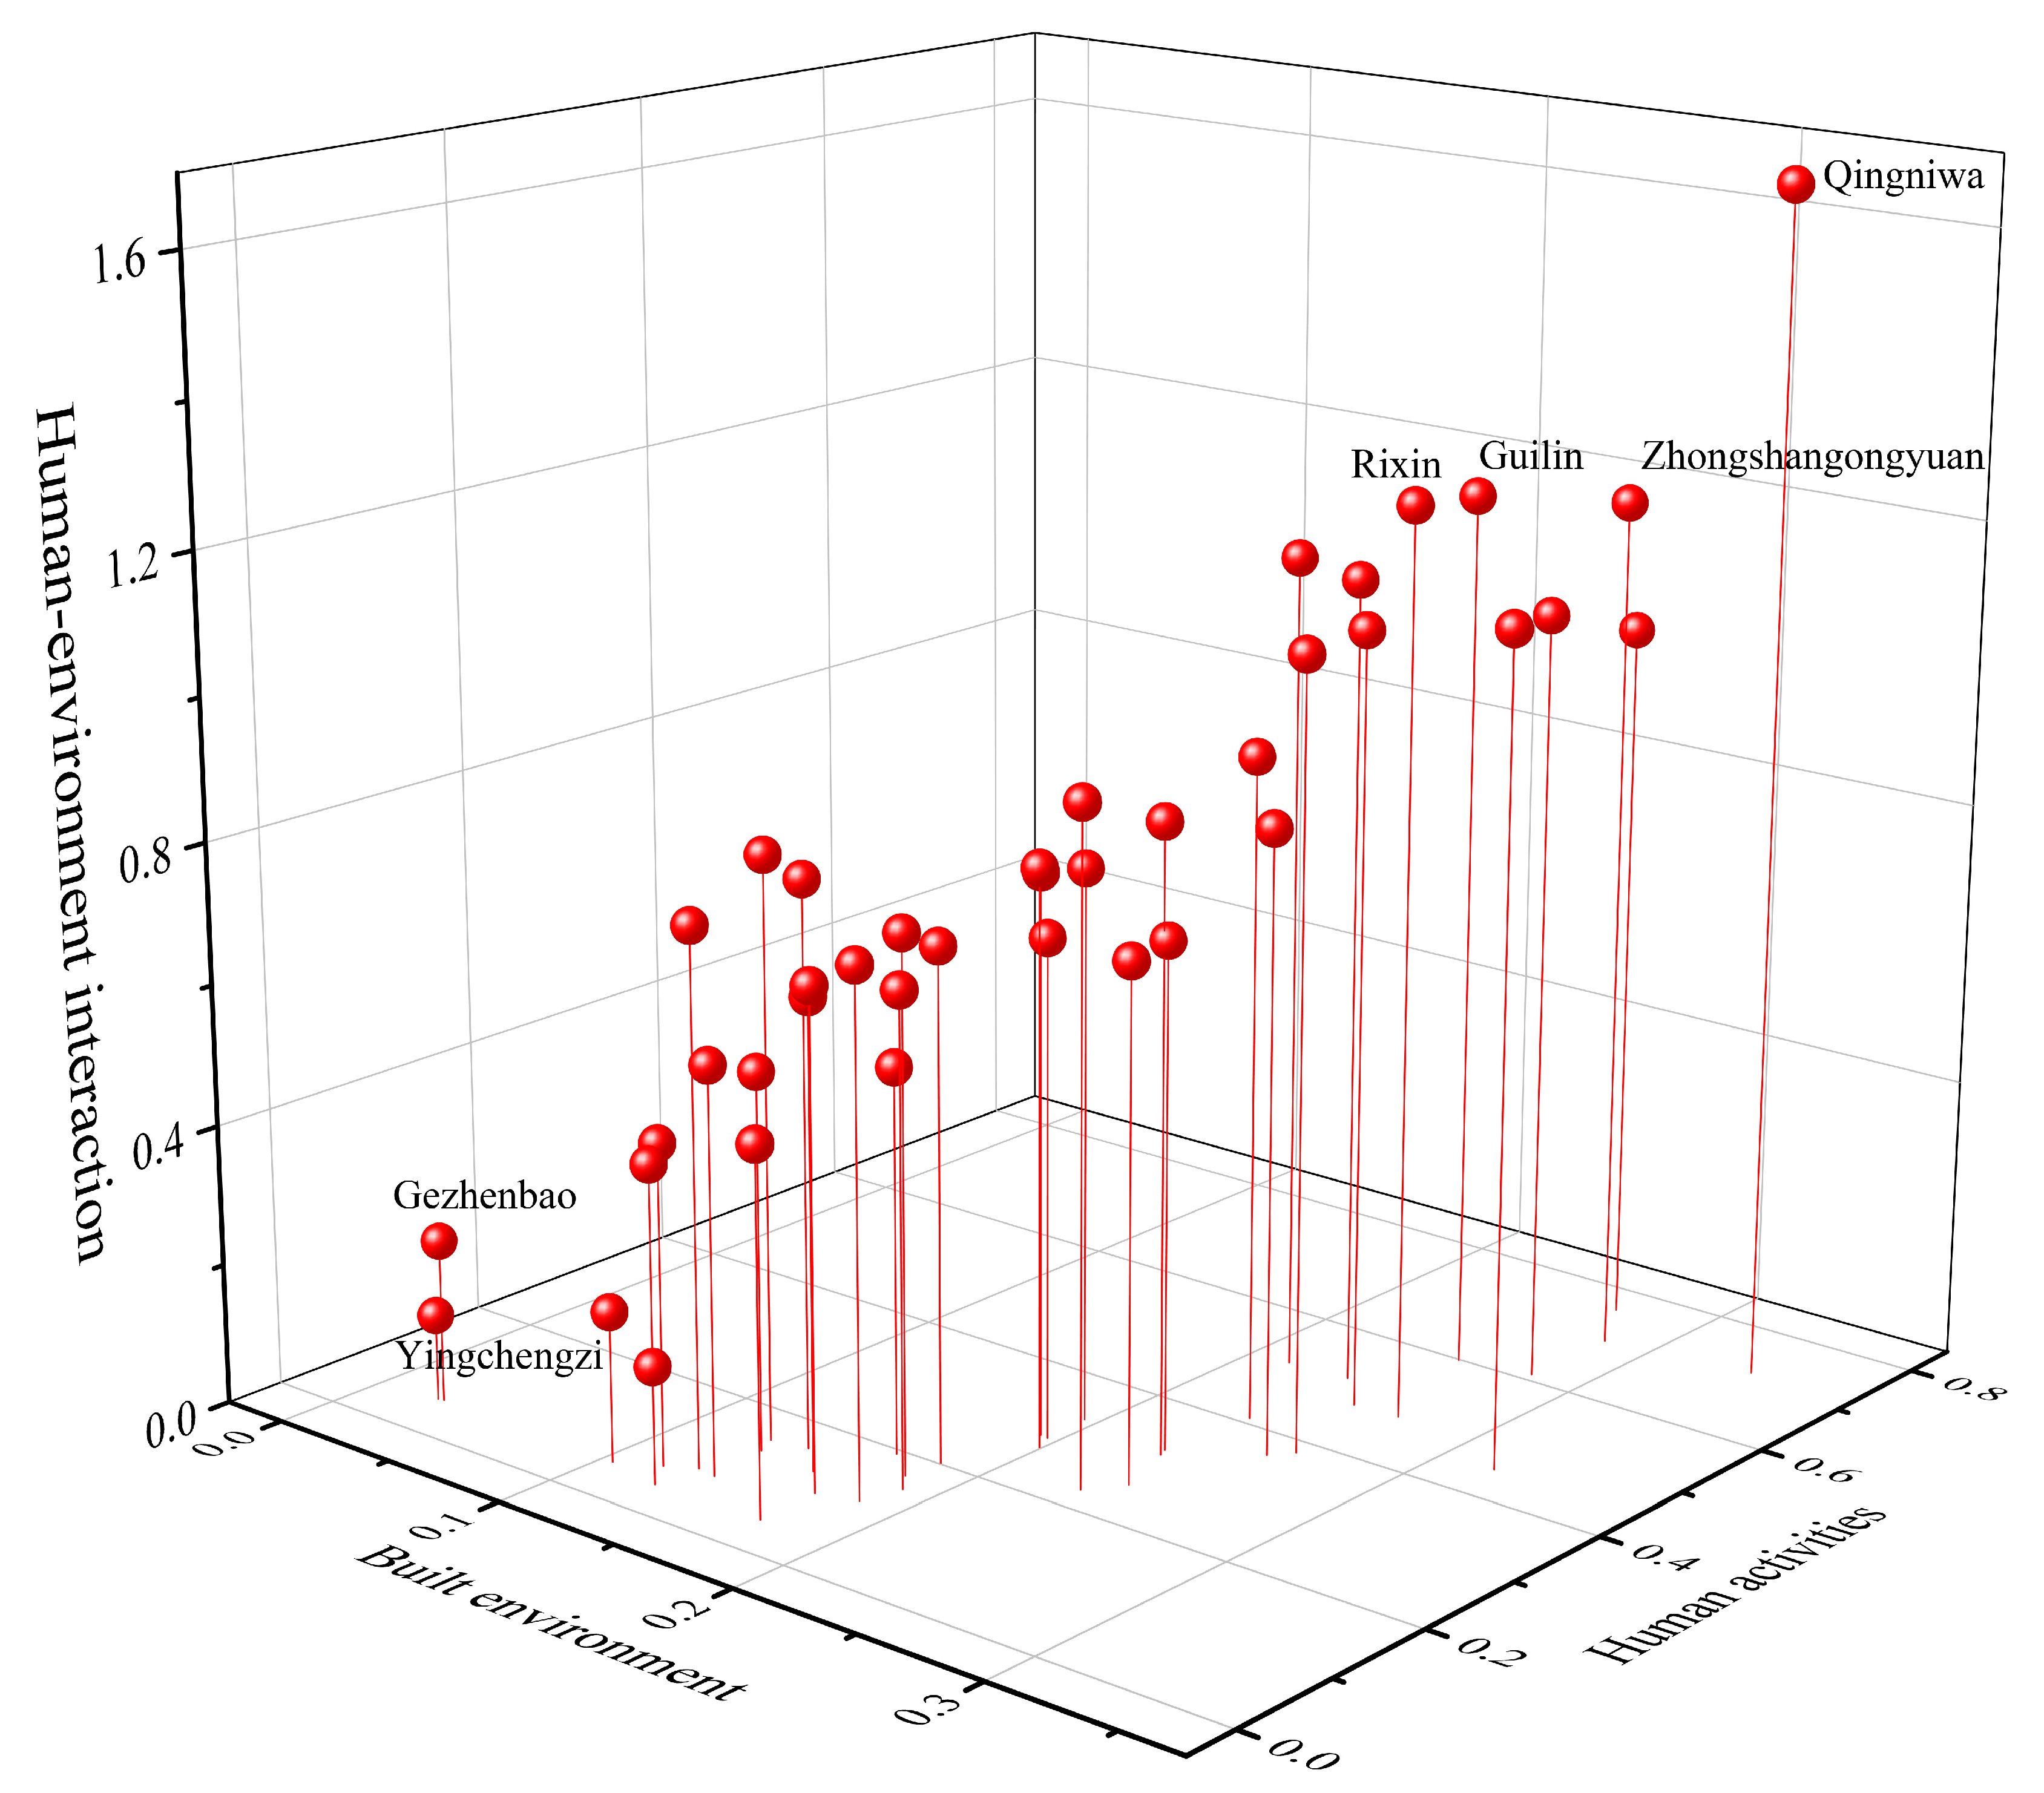
4.1. Spatial Distribution Characteristics of Vitality of Urban Human Settlements
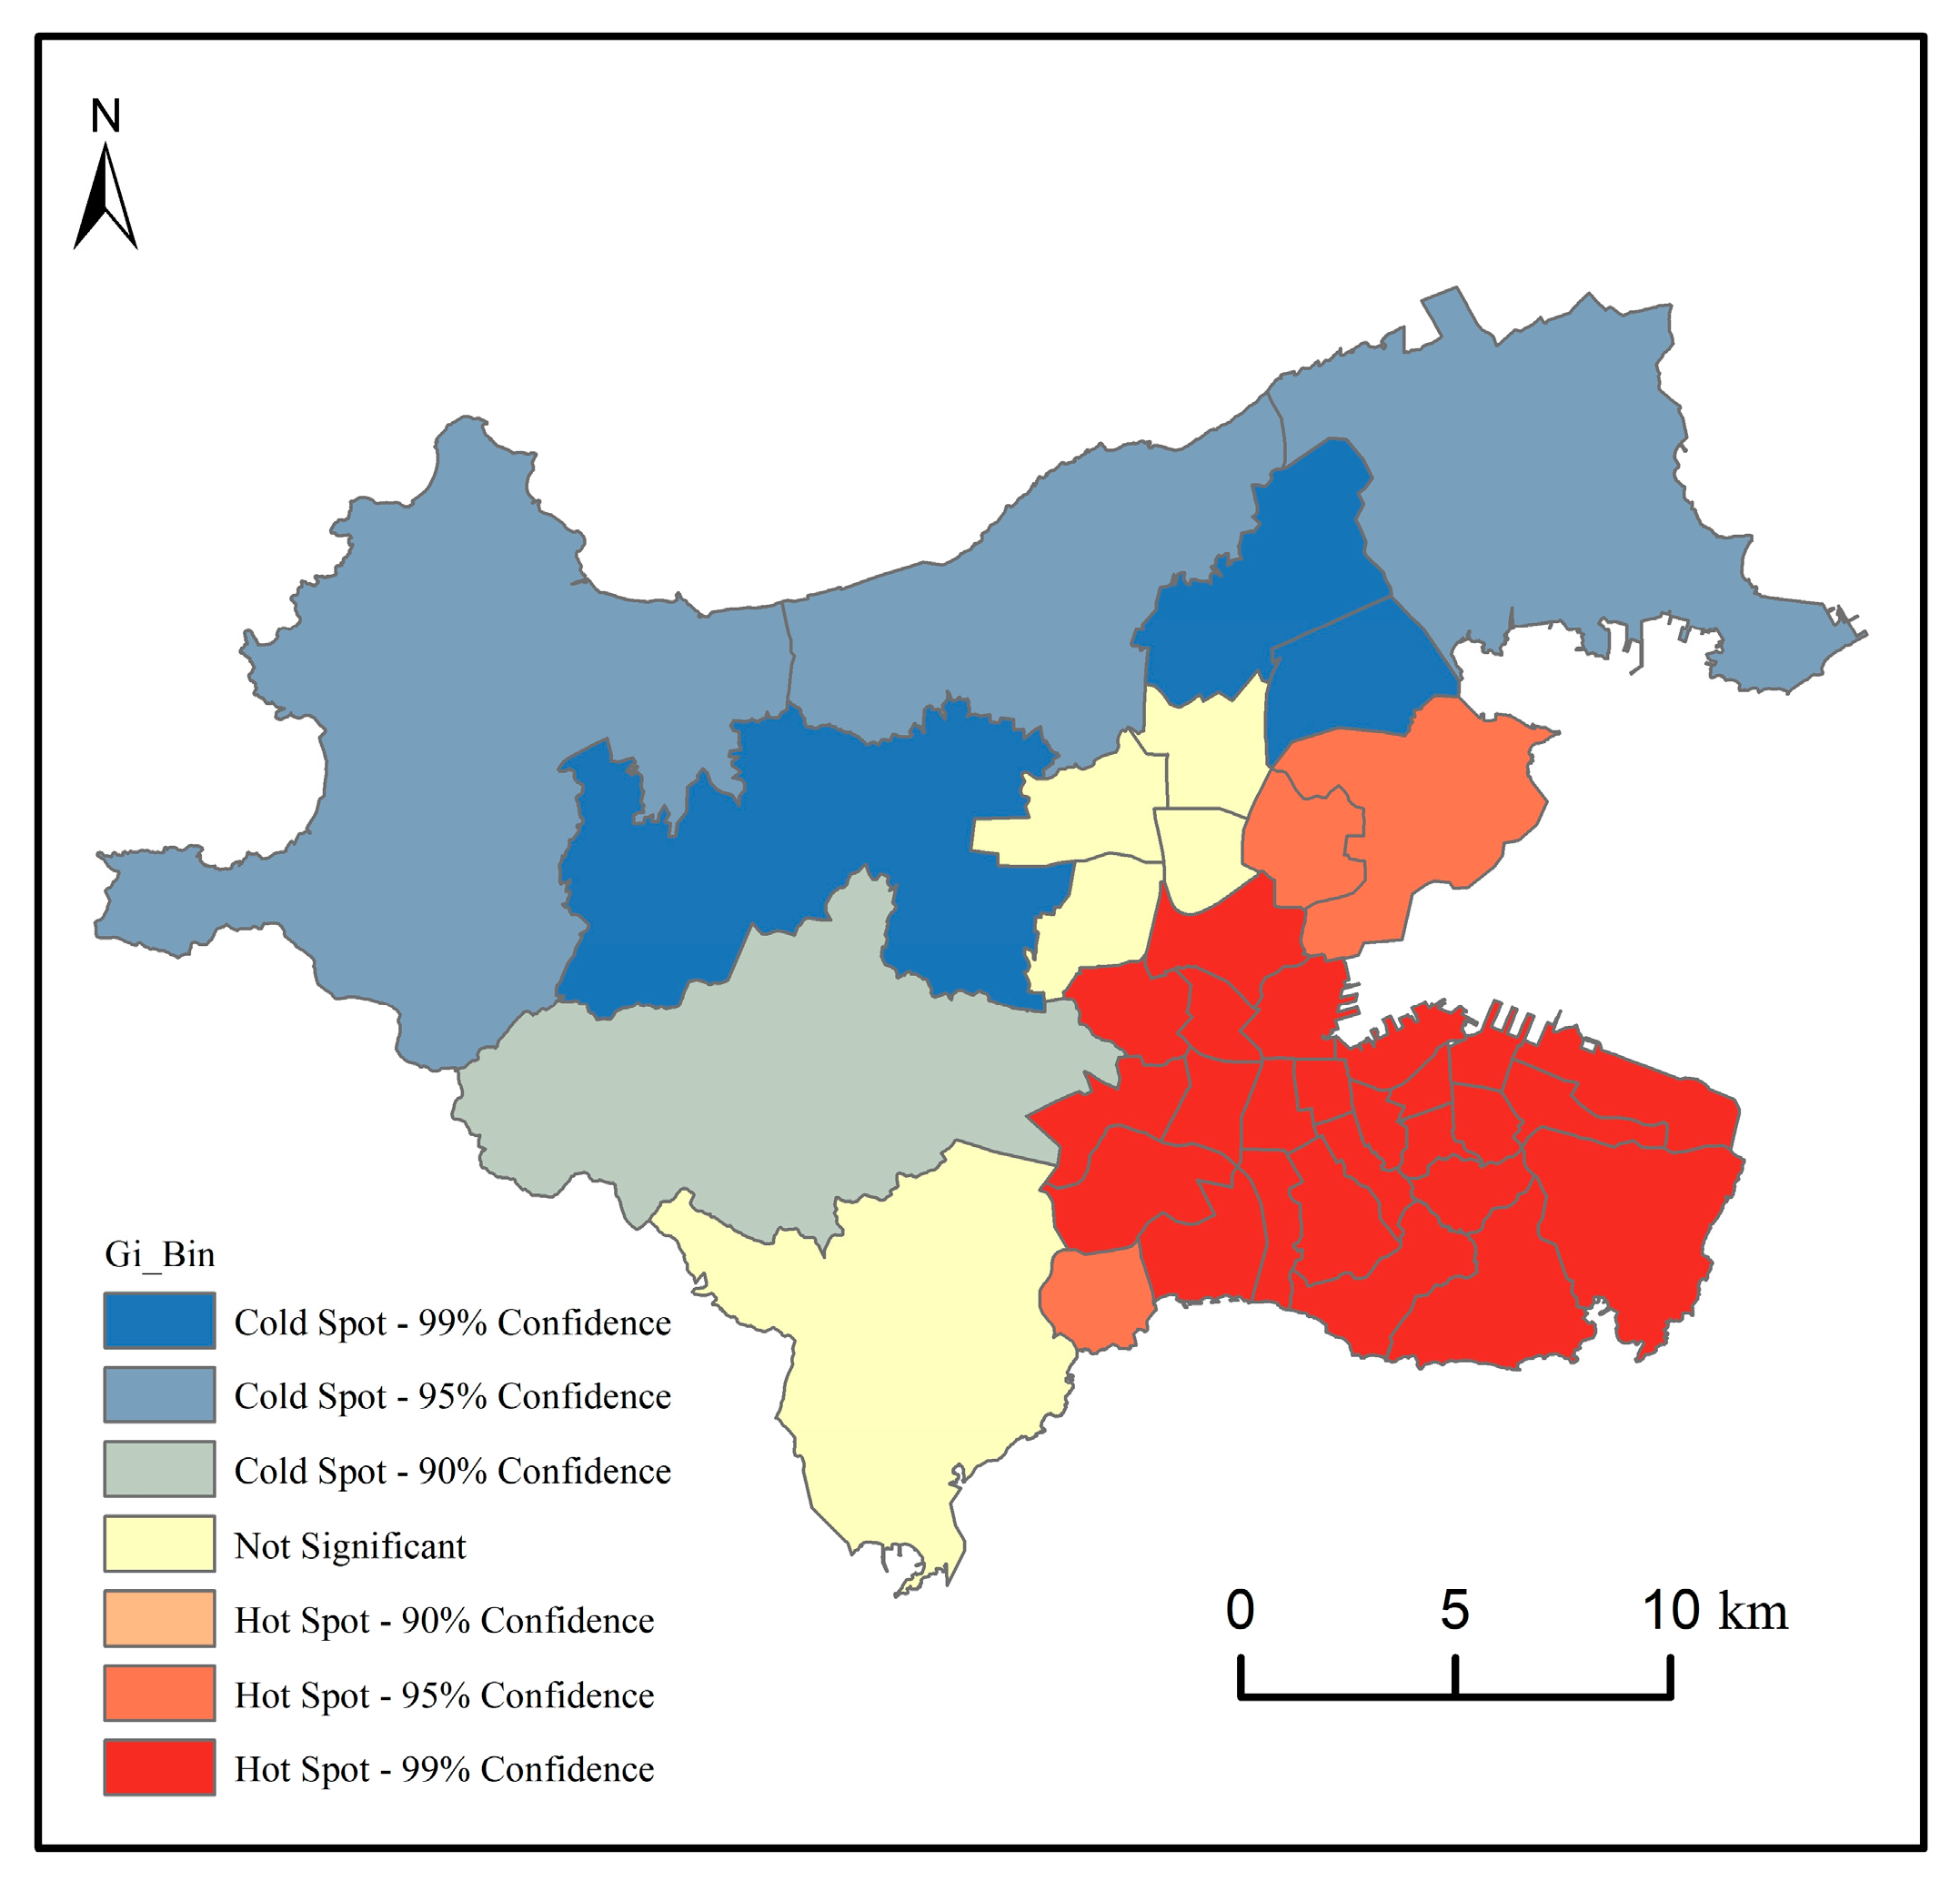
4.2. Cluster Characteristics of Vitality Space of Urban Human Settlements
4.3. A Probe into the Factors Affecting the Vitality of Urban Human Settlements
5. Discussion
5.1. Findings and Contributions
5.2. Optimization Measures
5.3. Limitations
6. Conclusions
Author Contributions
Funding
Data Availability Statement
Conflicts of Interest
References
- Li, X.; Liu, H. The Influence of Subjective and Objective Characteristics of Urban Human Settlements on Residents’ Life Satisfaction in China. Land 2021, 10, 1400. [Google Scholar] [CrossRef]
- Wang, L.; Fan, H.; Wang, Y. An estimation of housing vacancy rate using NPP-VIIRS night-time light data and OpenStreetMap data. Int. J. Remote Sens. 2019, 40, 8566–8588. [Google Scholar] [CrossRef]
- Huang, Z.; He, C.; Zhu, S. Do China’s economic development zones improve land use efficiency? The effects of selection, factor accumulation and agglomeration. Landsc. Urban Plan. 2017, 162, 145–156. [Google Scholar] [CrossRef]
- Jiang, Y.; Mohabir, N.; Ma, R.; Zhu, P. Sorting through Neoliberal Variations of Ghost Cities in China. Land Use Policy 2017, 69, 445–453. [Google Scholar] [CrossRef]
- Deng, C.; Ma, J. Viewing urban decay from the sky: A multi-scale analysis of residential vacancy in a shrinking U.S. city. Landsc. Urban Plan. 2015, 141, 88–99. [Google Scholar] [CrossRef]
- Shi, J.; Miao, W.; Si, H.; Liu, T. Urban Vitality Evaluation and Spatial Correlation Research: A Case Study from Shanghai, China. Land 2021, 10, 1195. [Google Scholar] [CrossRef]
- Pan, H.; Yang, C.; Quan, L.; Liao, L. A New Insight into Understanding Urban Vitality: A Case Study in the Chengdu-Chongqing Area Twin-City Economic Circle, China. Sustainability 2021, 13, 10068. [Google Scholar] [CrossRef]
- Luo, S.; Zhen, F. How to evaluate public space vitality based on mobile phone data: An empirical analysis of Nanjing’s parks. Geogr. Res. 2019, 38, 1594–1608. [Google Scholar] [CrossRef]
- Jacobs, J. The Death and Life of Great American Cities; Random House: New York, NY, USA, 1961. [Google Scholar]
- Montgomery, J. Editorial Urban Vitality and the Culture of Cities. Plan. Pract. Res. 1995, 10, 101–110. [Google Scholar] [CrossRef]
- Chion, M. Producing Urban Vitality: The Case of Dance in San Francisco. Urban Geogr. 2009, 30, 416–439. [Google Scholar] [CrossRef]
- Yue, W.; Chen, Y.; Zhang, Q.; Liu, Y. Spatial Explicit Assessment of Urban Vitality Using Multi-Source Data: A Case of Shanghai, China. Sustainability 2019, 11, 638. [Google Scholar] [CrossRef] [Green Version]
- Palmer, J.S.; Lynn, L.E. A Theory of Urbanity: The Economic and Civic Culture of Cities. J. Policy Anal. Manag. 1999, 18, 528–532. [Google Scholar] [CrossRef]
- Lopes, M.N.; Camanho, A.S. Public Green Space Use and Consequences on Urban Vitality: An Assessment of European Cities. Soc. Indic. Res. Int. Interdiscip. J. Qual. Life Meas. 2013 113, 751–767. [CrossRef]
- Delclòs-Alió, X.; Gutiérrez, A.; Miralles-Guasch, C. The urban vitality conditions of Jane Jacobs in Barcelona: Residential and smartphone-based tracking measurements of the built environment in a Mediterranean metropolis. Cities 2019, 86, 220–228. [Google Scholar] [CrossRef]
- Dong, Y.H.; Peng, F.L.; Guo, T.F. Quantitative assessment method on urban vitality of metro-led underground space based on multi-source data: A case study of Shanghai Inner Ring area. Tunn. Undergr. Space Tech. 2021, 116, 104108. [Google Scholar] [CrossRef]
- Yue, Y.; Zhuang, Y.; Yeh, A.G.O.; Xie, J.Y.; Ma, C.L.; Li, Q.Q. Measurements of POI-based mixed use and their relationships with neighbourhood vibrancy. Int. J. Geogr. Inf. Sci. 2016, 31, 658–675. [Google Scholar] [CrossRef] [Green Version]
- Jin, X.; Long, Y.; Sun, W.; Lu, Y.; Yang, X.; Tang, J. Evaluating cities’ vitality and identifying ghost cities in China with emerging geographical data. Cities 2017, 63, 98–109. [Google Scholar] [CrossRef]
- Long, Y.; Huang, C. Does block size matter? The impact of urban design on economic vitality for Chinese cities. Environ. Plan. B Urban Anal. City Sci. 2017, 46, 406–422. [Google Scholar] [CrossRef] [Green Version]
- Chao, W.; Ye, X.; Fu, R.; Du, Q. Check-in behaviour and spatio-temporal vibrancy: An exploratory analysis in Shenzhen, China. Cities 2018, 77, 104–116. [Google Scholar] [CrossRef]
- Wang, B.; Feng, Z.; Wei, Z.; Guo, S.; Chen, T. A theoretical framework and methodology for urban activity spatial structure in e-society: Empirical evidence for Nanjing City, China. Chin. Geogr. Sci. 2015, 25, 672–683. [Google Scholar] [CrossRef]
- Liu, S.; Zhang, L.; Long, Y. Urban Vitality Area Identification and Pattern Analysis from the Perspective of Time and Space Fusion. Sustainability 2019, 11, 4032. [Google Scholar] [CrossRef] [Green Version]
- Xia, C.; Yeh, A.G.O.; Zhang, A.Q. Analyzing spatial relationships between urban land use intensity and urban vitality at street block level: A case study of five Chinese megacities. Landsc. Urban Plan. 2020, 193, 103669. [Google Scholar] [CrossRef]
- Lu, S.; Shi, C.; Yang, X. Impacts of Built Environment on Urban Vitality: Regression Analyses of Beijing and Chengdu, China. Int. J. Environ. Res. Public Health 2019, 16, 4592. [Google Scholar] [CrossRef] [PubMed] [Green Version]
- Sung, H.G.; Go, D.H.; Chang, G.C. Evidence of Jacobs’s street life in the great Seoul city: Identifying the association of physical environment with walking activity on streets. Cities 2013, 35, 164–173. [Google Scholar] [CrossRef]
- Sung, H.; Lee, S. Residential built environment and walking activity: Empirical evidence of Jane Jacobs’ urban vitality. Transp. Res. Part D Transp. Environ. 2015, 41, 318–329. [Google Scholar] [CrossRef]
- Zeng, C.; Song, Y.; He, Q.; Shen, F. Spatially explicit assessment on urban vitality: Case studies in Chicago and Wuhan. Sustain. Cities Soc. 2018, 40, 296–306. [Google Scholar] [CrossRef]
- Ravenscroft, N. The Vitality and Viability of Town Centres. Urban Stud. 2000, 37, 2533–2549. [Google Scholar] [CrossRef]
- Zarin, S.Z.; Niroomand, M.; Heidari, A.A. Physical and Social Aspects of Vitality Case Study: Traditional Street and Modern Street in Tehran. Procedia-Soc. Behav. Sci. 2015, 170, 659–668. [Google Scholar] [CrossRef] [Green Version]
- Qi, W.; Wang, K. City administrative area and physical area in China: Spatial differences and integration strategies. Geogr. Res. 2019, 38, 207–220. [Google Scholar] [CrossRef]
- Wang, N.; Wu, J.; Li, S.; Wang, H.; Peng, Z. Spatial Features of Urban Vitality and the Impact of Built Environment on Them Based on Multi-Source Data: A Case Study of Shenzhen. Trop. Geogr. 2022, 41, 1280–1291. [Google Scholar] [CrossRef]
- King, K. Jane Jacobs and ‘The Need for Aged Buildings’: Neighbourhood Historical Development Pace and Community Social Relations. Urban Stud. 2013, 50, 2407–2424. [Google Scholar] [CrossRef] [PubMed] [Green Version]
- Hess, P.M.; Moudon, A.V.; Snyder, M.C.; Stanilov, K. Site design and pedestrian trave. Transp. Res. Rec. J. Transp. Res. Board 1999, 1674, 9–19. [Google Scholar] [CrossRef] [Green Version]
- Ye, Y.; Li, D.; Liu, X. How block density and typology affect urban vitality: An exploratory analysis in Shenzhen, China. Urban Geogr. 2018, 39, 631–652. [Google Scholar] [CrossRef]
- Zheng, Q.; Zeng, Y.; Deng, J.; Wang, K.; Jiang, R.; Ye, Z. “Ghost cities” identification using multi-source remote sensing datasets: A case study in Yangtze River Delta. Appl. Geogr. 2017, 80, 112–121. [Google Scholar] [CrossRef]
- Wu, W.; Niu, X. Influence of Built Environment on Urban Vitality: Case Study of Shanghai Using Mobile Phone Location Data. J. Urban Plan. Dev. 2019, 145, 4019007. [Google Scholar] [CrossRef]
- Xin, L.; Yuan, L.; Tao, J.; Lin, Z.; Hamzi, L.H. The six dimensions of built environment on urban vitality: Fusion evidence from multi-source data. Cities 2022, 121, 103482. [Google Scholar] [CrossRef]
- Mao, W.; Zhong, Y. Spatial pattern and influencing factors of urban vitality in the middle reaches of the Yangtze River. World Reg. Stud. 2020, 29, 86–95. [Google Scholar] [CrossRef]
- Zhu, Y.; Li, Q.; Chen, L. Spatial vitality analysis and planning application of famous historical and cultural cities based on multi-source data—Taking the old city of Enshi as an example. Dev. Small Cities Towns 2019, 37, 89–97. [Google Scholar] [CrossRef]
- He, Q.; He, W.; Yan, S.; Wu, J.; Yin, C.; Mou, Y. The impact of urban growth patterns on urban vitality in newly built-up areas based on an association rules analysis using geographical ‘big data’. Land Use Policy 2018, 78, 726–738. [Google Scholar] [CrossRef]
- Deng, M.; Chen, J.; Tso, F.; Zhu, J.; Wang, M. On the Coupling and Coordination Development between Environment and Economy: A Case Study in the Yangtze River Delta of China. Int. J. Environ. Res. Public Health 2022, 19, 586. [Google Scholar] [CrossRef]
- Hou, C.; Chen, H.; Long, R. Coupling and coordination of China’s economy, ecological environment and health from a green production perspective. Int. J. Environ. Sci. Technol. 2022, 19, 4087–4106. [Google Scholar] [CrossRef]
- Bradford, E.; Schweidtmann, A.M.; Lapkin, A. Efficient multiobjective optimization employing Gaussian processes, spectral sampling and a genetic algorithm. J. Glob. Optim. 2018, 71, 407–438. [Google Scholar] [CrossRef] [Green Version]
- Gong, D.W.; Jing, S.; Miao, Z. A Set-Based Genetic Algorithm for Interval Many-Objective Optimization Problems. IEEE Trans. Evol. Comput. 2018, 22, 47–60. [Google Scholar] [CrossRef]
- Guo, H.; Xu, S.; Pan, C. Measurement of the Spatial Complexity and Its Influencing Factors of Agricultural Green Development in China. Sustainability 2020, 12, 9259. [Google Scholar] [CrossRef]
- Li, G.; Fang, C.; Wang, S. Exploring spatiotemporal changes in ecosystem-service values and hotspots in China. Sci. Total Environ. 2016, 545–546, 609–620. [Google Scholar] [CrossRef]
- Xiang, Q.; Yu, H.; Xu, X.; Huang, H. Temporal and Spatial Differentiation of Cultivated Land and Its Response to Climatic Factors in Complex Geomorphic Areas—A Case Study of Sichuan Province of China. Land 2022, 11, 271. [Google Scholar] [CrossRef]
- Feng, C.; Zhang, H.; Xiao, L.; Guo, Y. Land Use Change and Its Driving Factors in the Rural–Urban Fringe of Beijing: A Production–Living–Ecological Perspective. Land 2022, 11, 314. [Google Scholar] [CrossRef]
- Wang, S.; Ding, L.; Ye, X.; Qiang, C.; Xiaorong, J. Fuzzy comprehensive evaluation on the urban vitality—A case of the main cities in Hubei Province. J. Cent. China Norm. Univ. (Nat. Sci.) 2013, 47, 440–445. [Google Scholar] [CrossRef]
- Lv, M. The Construction and Evaluation for the City Vigor Index System. Master’s Thesis, Dongbei University of Finance and Economics, Dalian, China, 2011. [Google Scholar]
- Yang, Y.; Ma, Y.; Jiao, H. Exploring the Correlation between Block Vitality and Block Environment Based on Multisource Big Data: Taking Wuhan City as an Example. Land 2021, 10, 984. [Google Scholar] [CrossRef]
- Lan, F.; Gong, X.; Da, H.; Wen, H. How do population inflow and social infrastructure affect urban vitality? Evidence from 35 large- and medium-sized cities in China. Cities 2020, 100, 102454. [Google Scholar] [CrossRef]
- Kim, Y. Data-driven approach to characterize urban vitality: How spatiotemporal context dynamically defines Seoul’s nighttime. Int. J. Geogr. Inf. Sci. IJGIS 2020, 34, 34–1235. [Google Scholar] [CrossRef]
- Zikirya, B.; He, X.; Li, M.; Zhou, C. Urban Food Takeaway Vitality: A New Technique to Assess Urban Vitality. Int. J. Environ. Res. Public Health 2021, 18, 3578. [Google Scholar] [CrossRef] [PubMed]
- Zhang, W.; Zhuo, H.; Dong, Z. Labor shortage during the COVID-19 pandemic: Revisiting China’s labor migration and work resumption policies. China Popul. Resour. Environ. 2020, 30, 29–39. [Google Scholar] [CrossRef]
- Paköz, M.; Işık, M. Rethinking urban density, vitality and healthy environment in the post-pandemic city: The case of Istanbul. Cities 2022, 124, 103598. [Google Scholar] [CrossRef]


| Target Layer | Comprehensive Layer | Index Layer | The Data Shows | Calculation Method | Data Sources | Indicator Attriutes |
|---|---|---|---|---|---|---|
| The vitality of urban human settlements | Urban built environment | Number of cultural relics protection units | Number of cultural relics protection units in the area | Overlay analysis | a | Positive |
| Road length | Average road length between two intersections in the area | Topological method | b | Negative | ||
| Number of intersections | Number of four-way intersections in the area | Topological method | b | Positive | ||
| Building density | The ratio of the area of buildings in the area to the total area of the area | Building area/area area | b | Positive | ||
| Urban Habitat Activities | The population density | Population per unit area of land | Total population/area | c | Positive | |
| POI density | POI point density in the area | Total POI/Regional Area | d | Positive | ||
| POI Mix Index | A total of eight categories of POI mixed index | Entropy index | d | Positive | ||
| Night light index | Average light brightness in the area | Average light brightness index | e | Positive | ||
| Human and environmental interaction | Road network density | The ratio of the total mileage of the road network to the area of the area | Road length/area area | b | Positive | |
| Metro station density | Density of subway stations in the area | Number of subway stations/area area | d | Positive | ||
| Bus station density | Density of bus stops in the area | Number of bus stops/area area | d | Positive | ||
| Road vacuum | Set 50 m and 30 m buffer zones for railways and highways, respectively | Buffer area/regional area | b | Negative | ||
| River vacuum | Establish a 20 m buffer zone for rivers in the area | Buffer area/regional area | b | Negative |
| Factor | VIF | 1/VIF |
|---|---|---|
| Average altitude | 4.76 | 0.21 |
| Terrain relief | 7.72 | 0.13 |
| Vegetation coverage | 1.71 | 0.58 |
| Average house price | 1.37 | 0.73 |
| Density of commercial facilities | 1.70 | 0.59 |
| Compactness | 6.37 | 0.16 |
| Fractal dimension | 3.36 | 0.30 |
| Regional population | 1.21 | 0.83 |
| Variable Name | Variable Symbol | Variable Description | |
|---|---|---|---|
| Explained variable | Human settlements vitality | V | Projection pursuit model calculation results |
| Explain variable | Topography | X1 | Average altitude |
| Ecological environment | X2 | Topographic undulation | |
| Social economy | X3 | Average housing price | |
| Business development | X4 | Density of commercial facilities | |
| Spatial structure | X5 | Compactness | |
| Space form | X6 | Fractal dimension | |
| Human capital | X7 | Regional population |
| Variable | OLS | SLM | SEM |
|---|---|---|---|
| X1 | −0.0004 | −0.0006 | −0.0004 |
| X2 | −0.3033 | −0.3990 ** | −0.3088 |
| X3 | 0.0032 ** | 0.0054 ** | 0.0049 ** |
| X4 | 0.0403 *** | 0.0628 *** | 0.0399 *** |
| X5 | 4.2607 *** | 3.1152 *** | 4.3145 *** |
| X6 | 2.4138 *** | 1.6011 *** | 2.4412 *** |
| X7 | 0.0051 *** | 0.0073 *** | 0.0023 *** |
| R2 | 0.9107 | 0.9294 | 0.9107 |
| Adjust R2/ρ/λ | 0.8911 | 0.3011 | −0.0377 |
| LogL | 13.7332 | 17.9762 | 13.7375 |
| AIC | −11.4663 | −17.9524 | −11.4751 |
| SC | 2.0447 | −2.7525 | 2.0360 |
| Test Statistics | Statistics | p-Value |
|---|---|---|
| Breusch-Pagan | 6.0641 | 0.532 |
| Koenker-Bassett | 9.4137 | 0.224 |
| LMLAG | 7.7274 | 0.005 |
| R-LMLAG | 10.3172 | 0.001 |
| LMERR | 0.0028 | 0.958 |
| R-LMERR | 2.5926 | 0.109 |
Publisher’s Note: MDPI stays neutral with regard to jurisdictional claims in published maps and institutional affiliations. |
© 2022 by the authors. Licensee MDPI, Basel, Switzerland. This article is an open access article distributed under the terms and conditions of the Creative Commons Attribution (CC BY) license (https://creativecommons.org/licenses/by/4.0/).
Share and Cite
Liu, H.; Li, X. Understanding the Driving Factors for Urban Human Settlement Vitality at Street Level: A Case Study of Dalian, China. Land 2022, 11, 646. https://doi.org/10.3390/land11050646
Liu H, Li X. Understanding the Driving Factors for Urban Human Settlement Vitality at Street Level: A Case Study of Dalian, China. Land. 2022; 11(5):646. https://doi.org/10.3390/land11050646
Chicago/Turabian StyleLiu, He, and Xueming Li. 2022. "Understanding the Driving Factors for Urban Human Settlement Vitality at Street Level: A Case Study of Dalian, China" Land 11, no. 5: 646. https://doi.org/10.3390/land11050646
APA StyleLiu, H., & Li, X. (2022). Understanding the Driving Factors for Urban Human Settlement Vitality at Street Level: A Case Study of Dalian, China. Land, 11(5), 646. https://doi.org/10.3390/land11050646