


Modeling the Future Tree Distribution in a South African Savanna Ecosystem: An Agent-Based Model Approach

 ,
,  , ,
, , 
Abstract
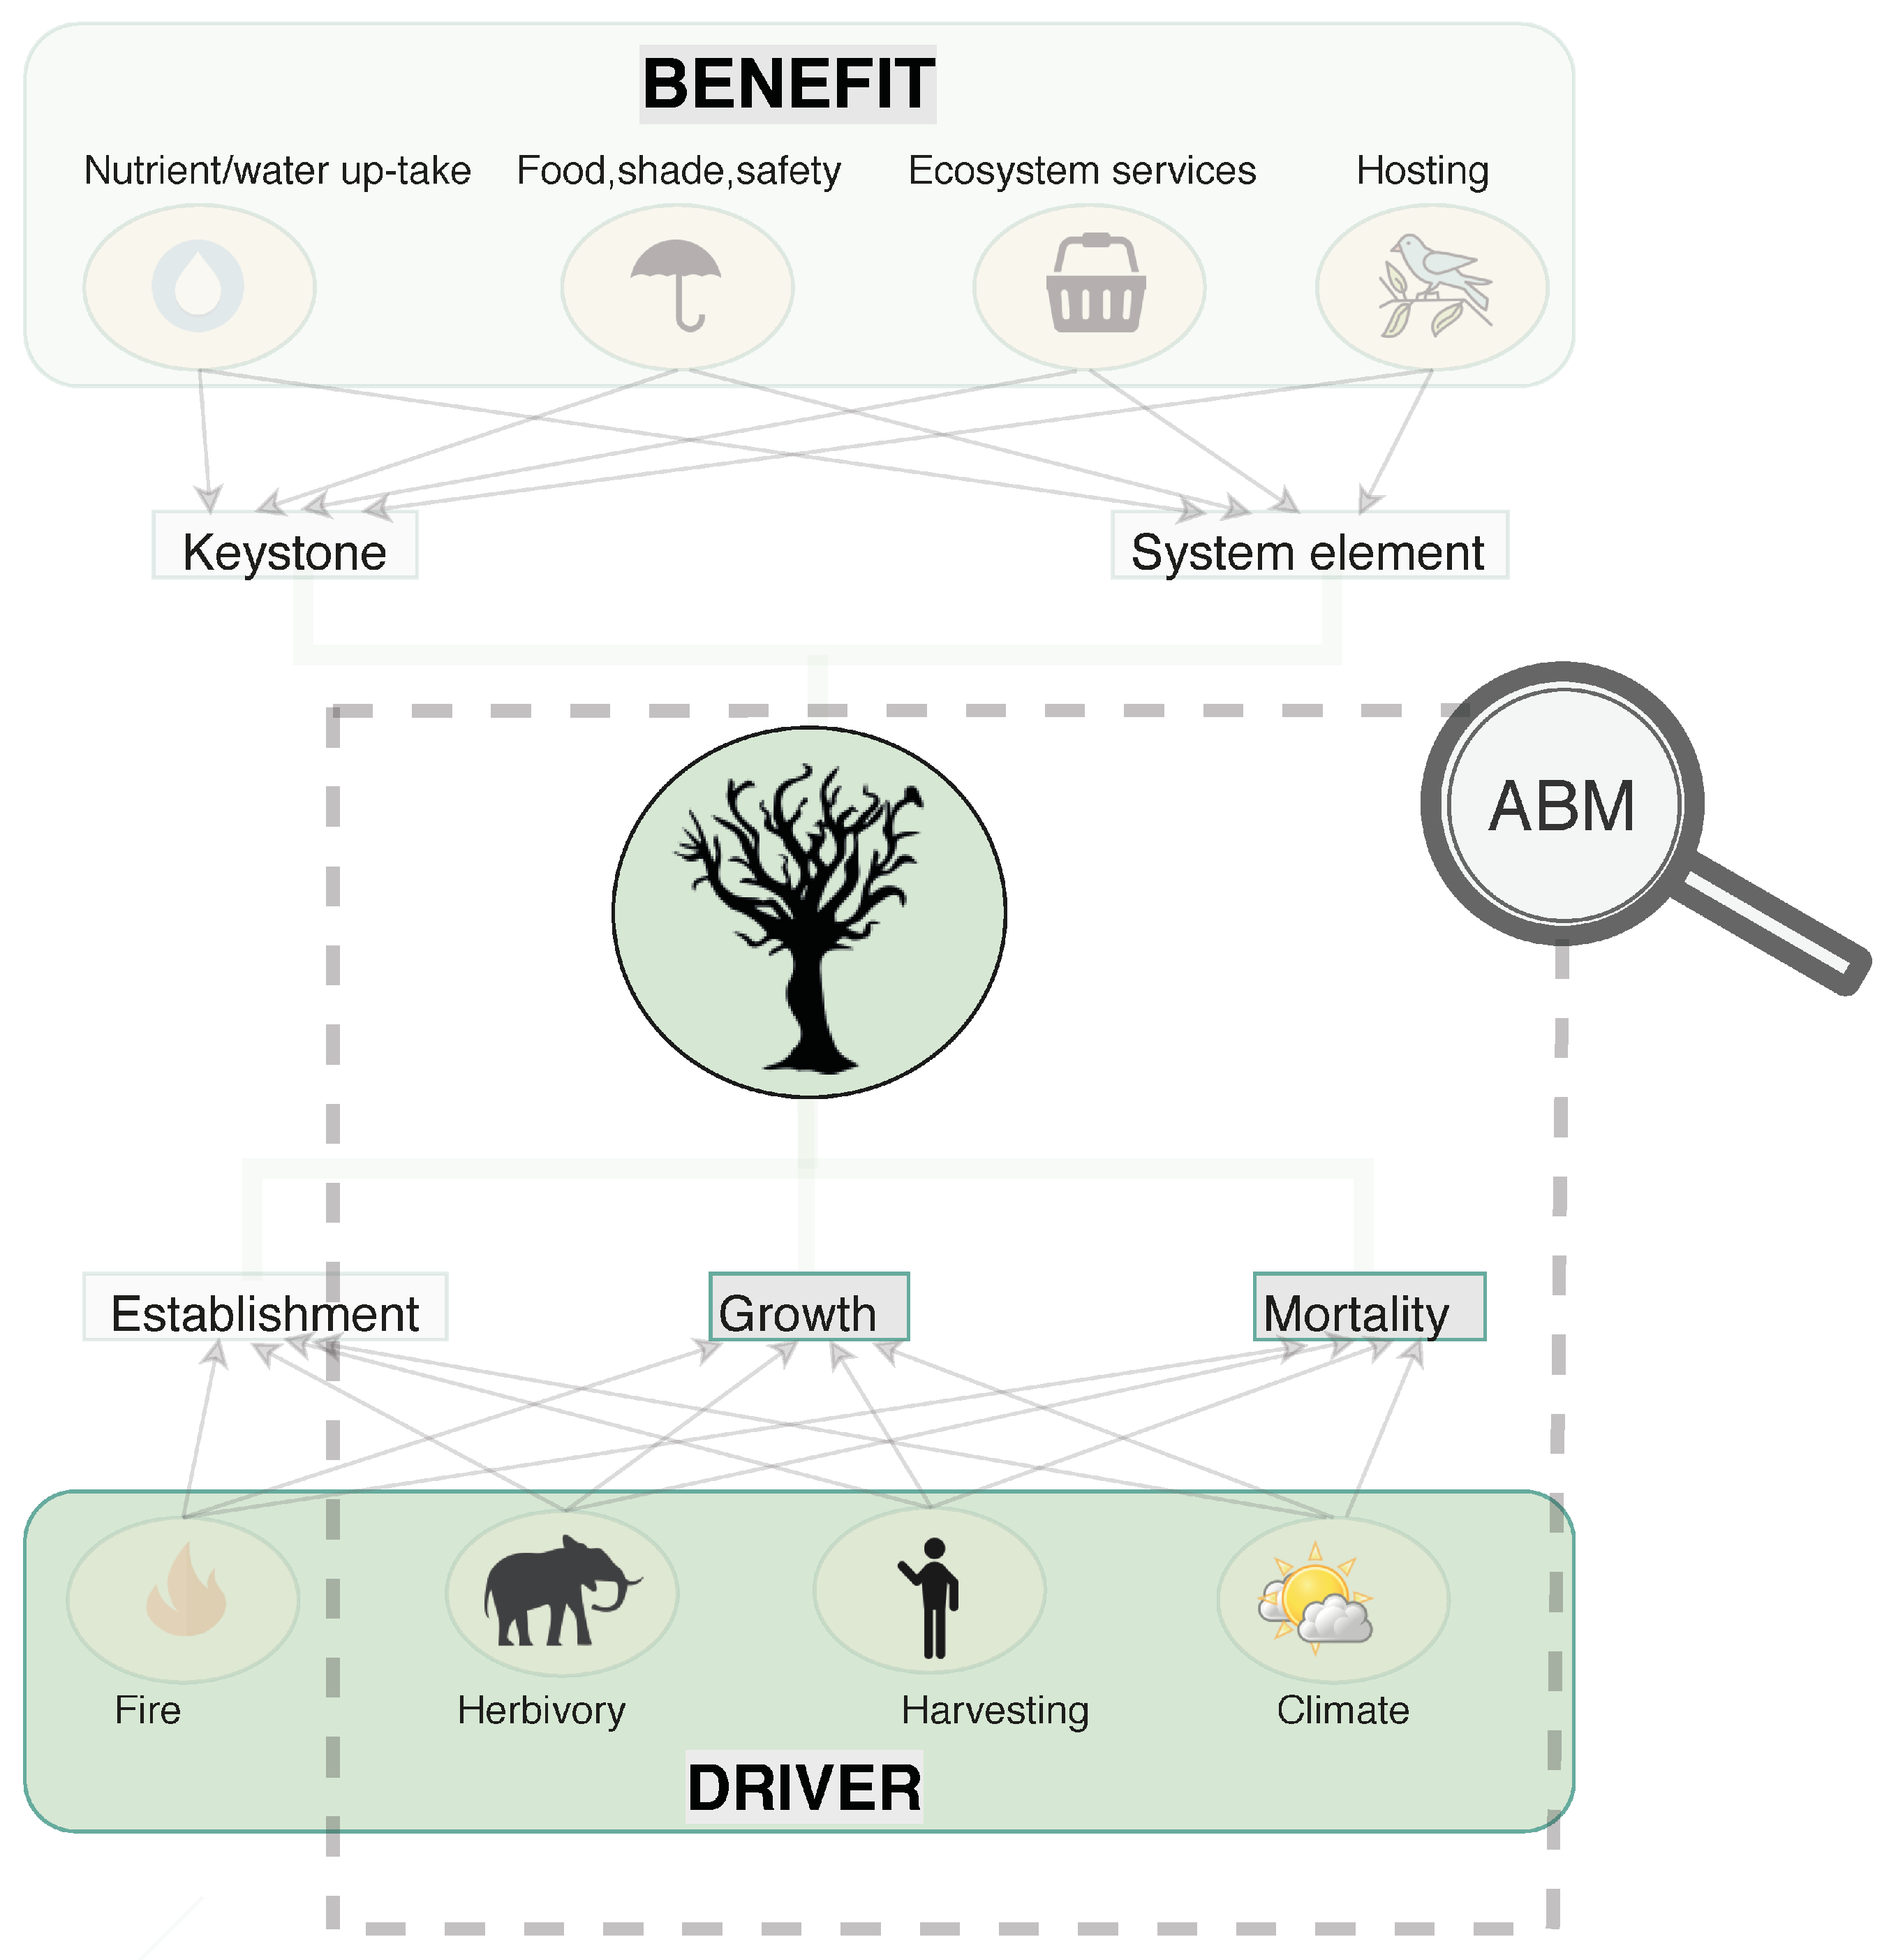
1. Introduction
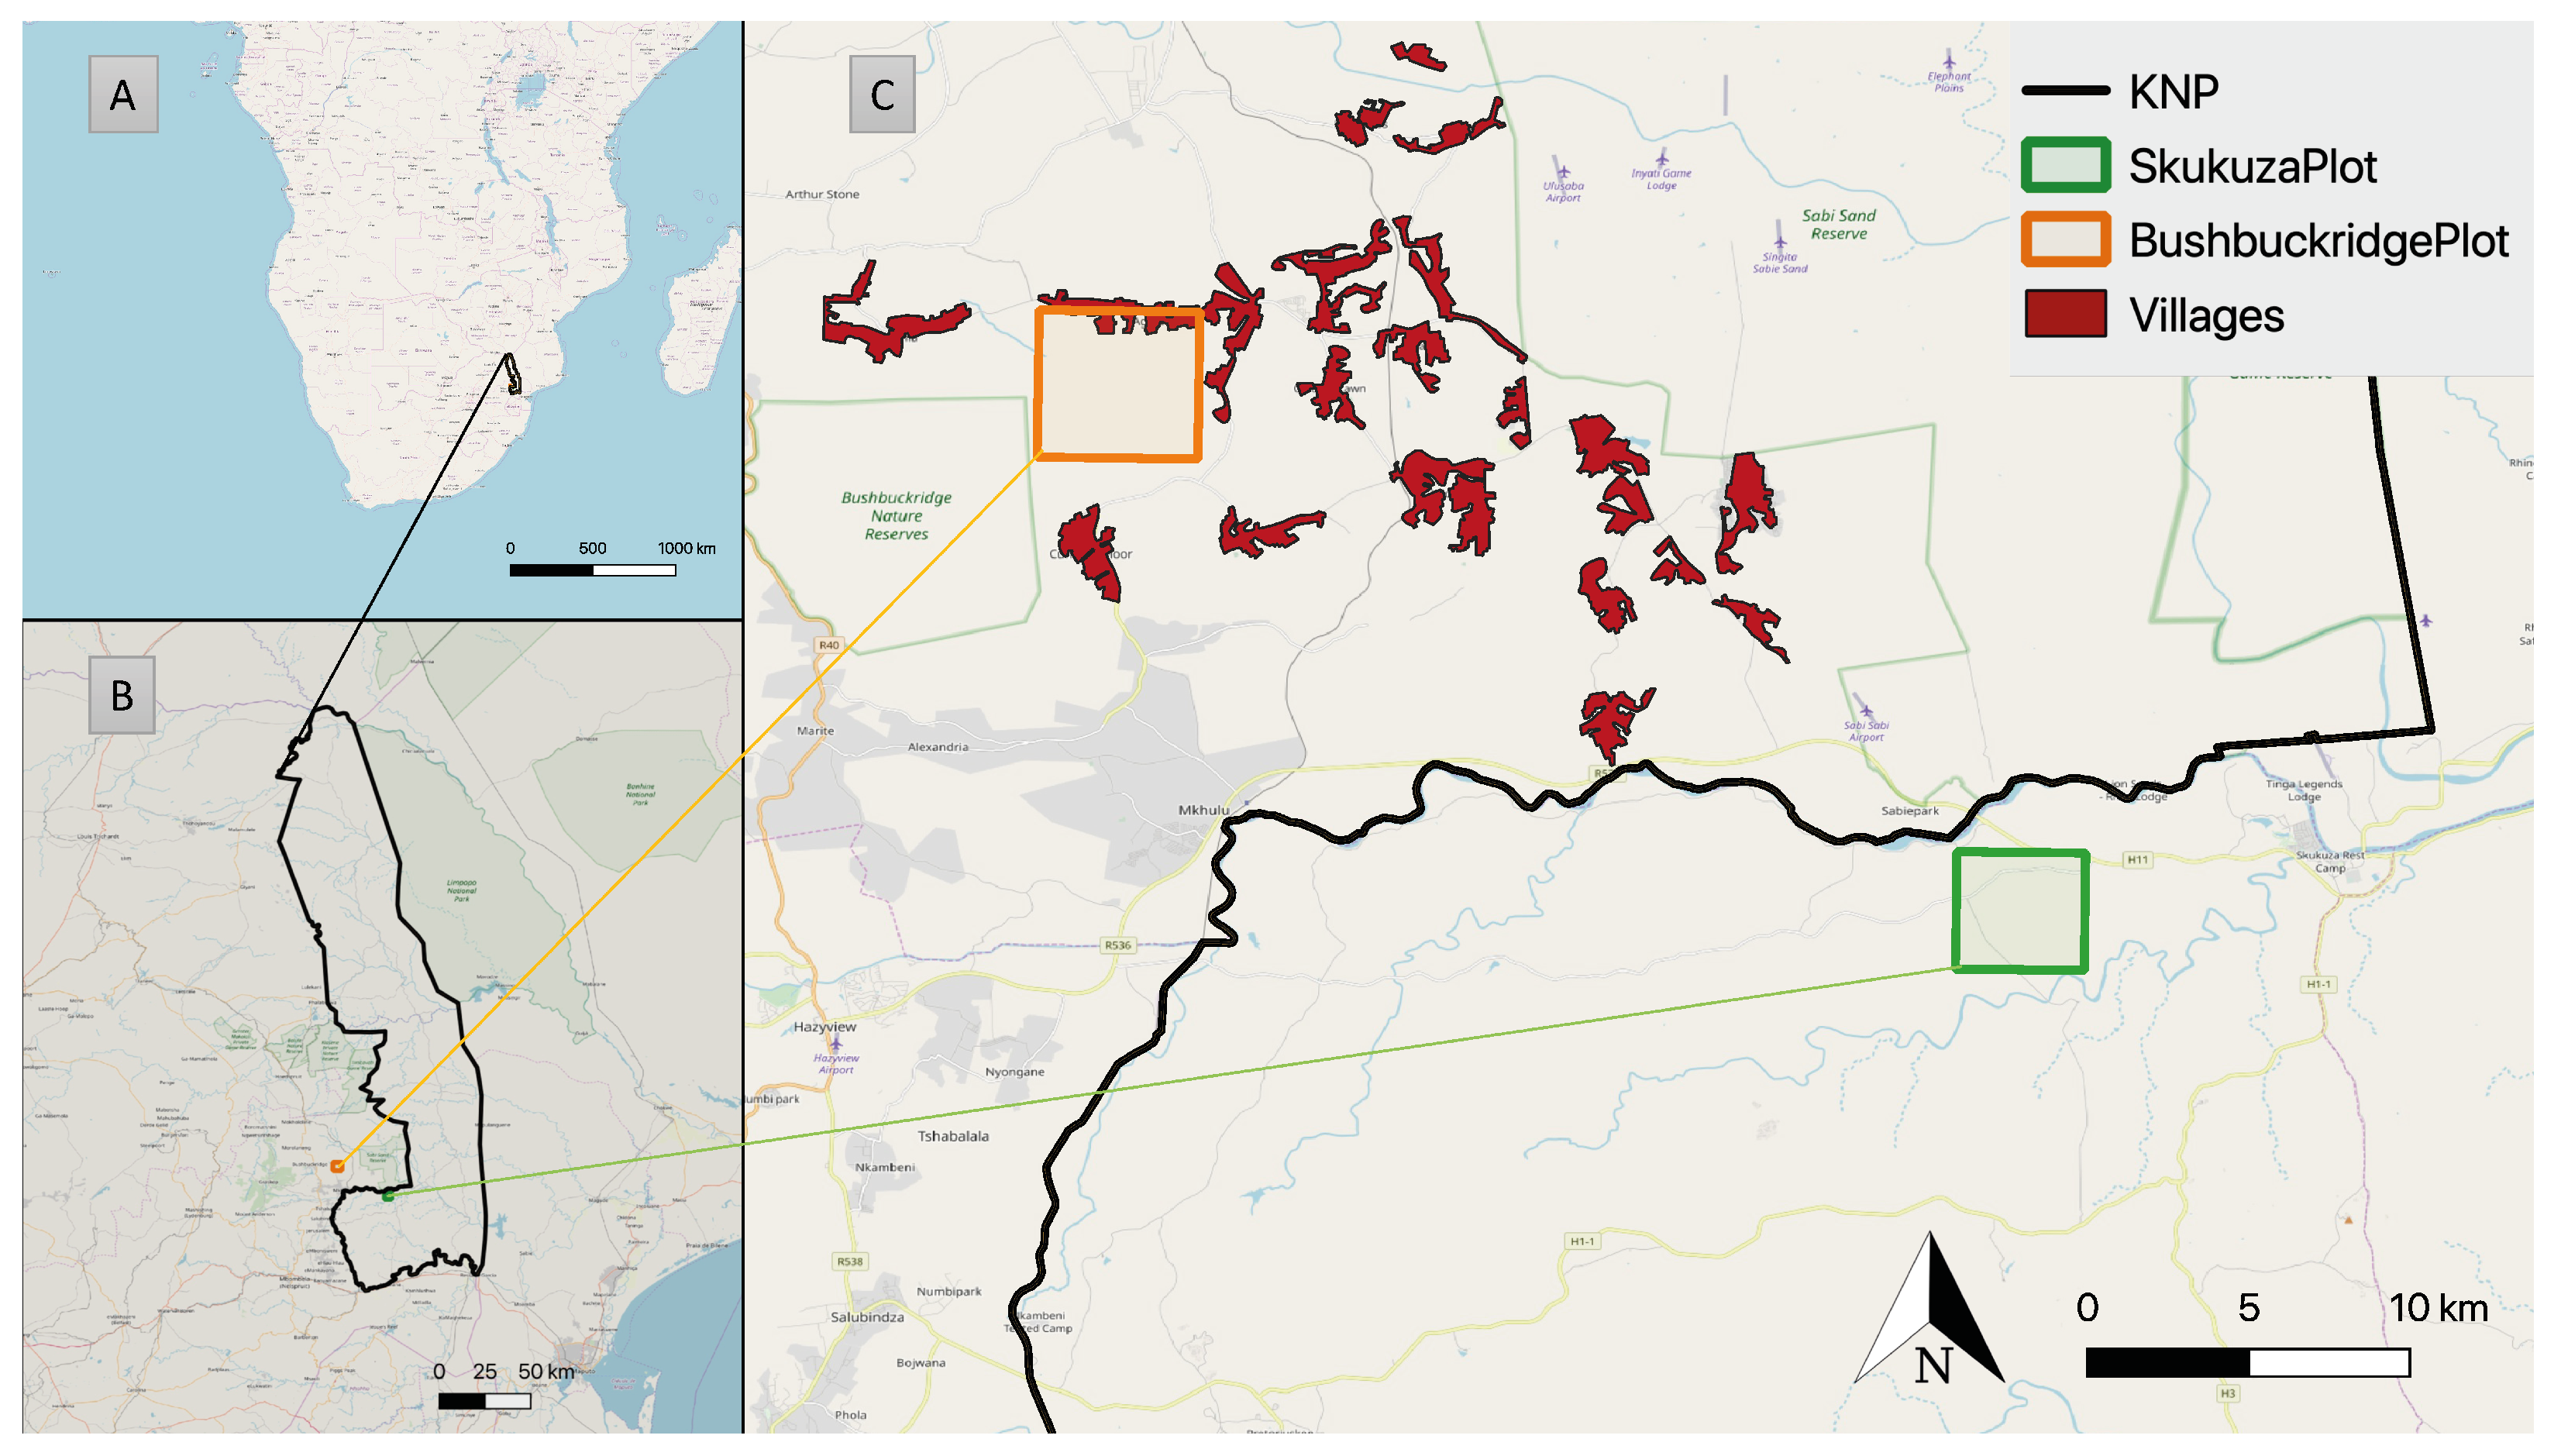
2. Study Area
2.1. BushbuckridgePlot/BBR Model
2.2. SkukuzaPlot/SKU Model
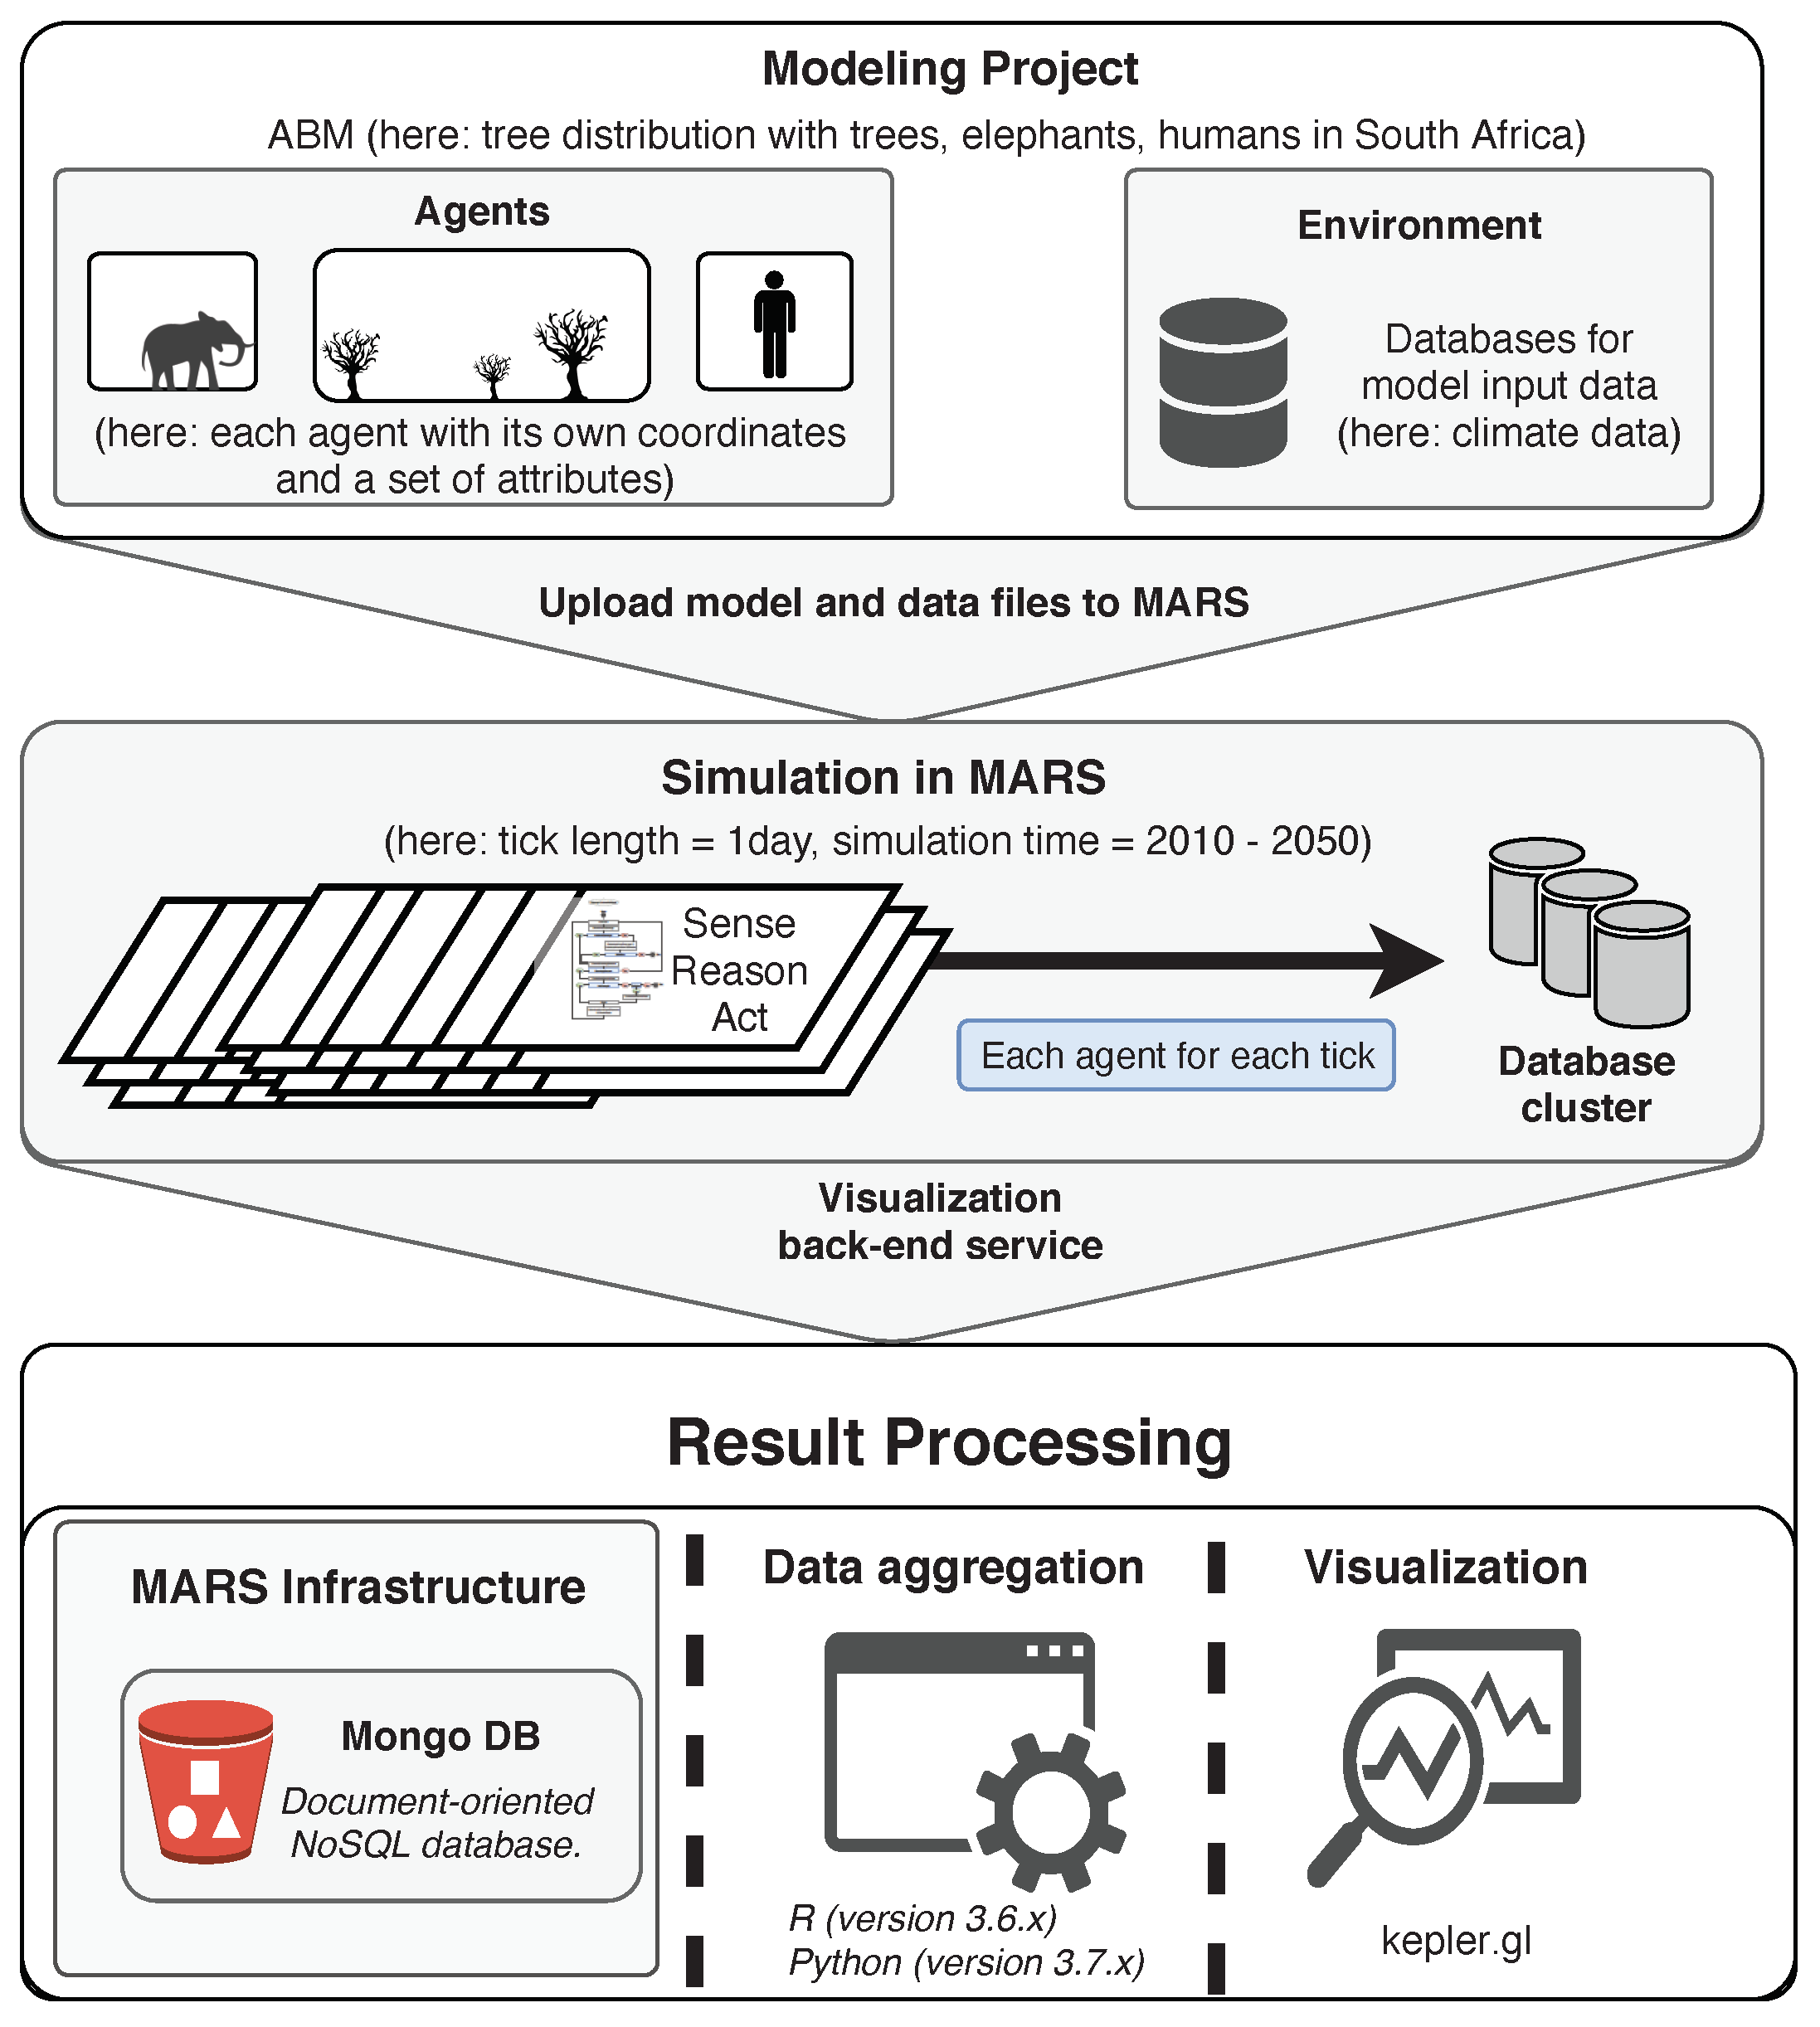
3. Method
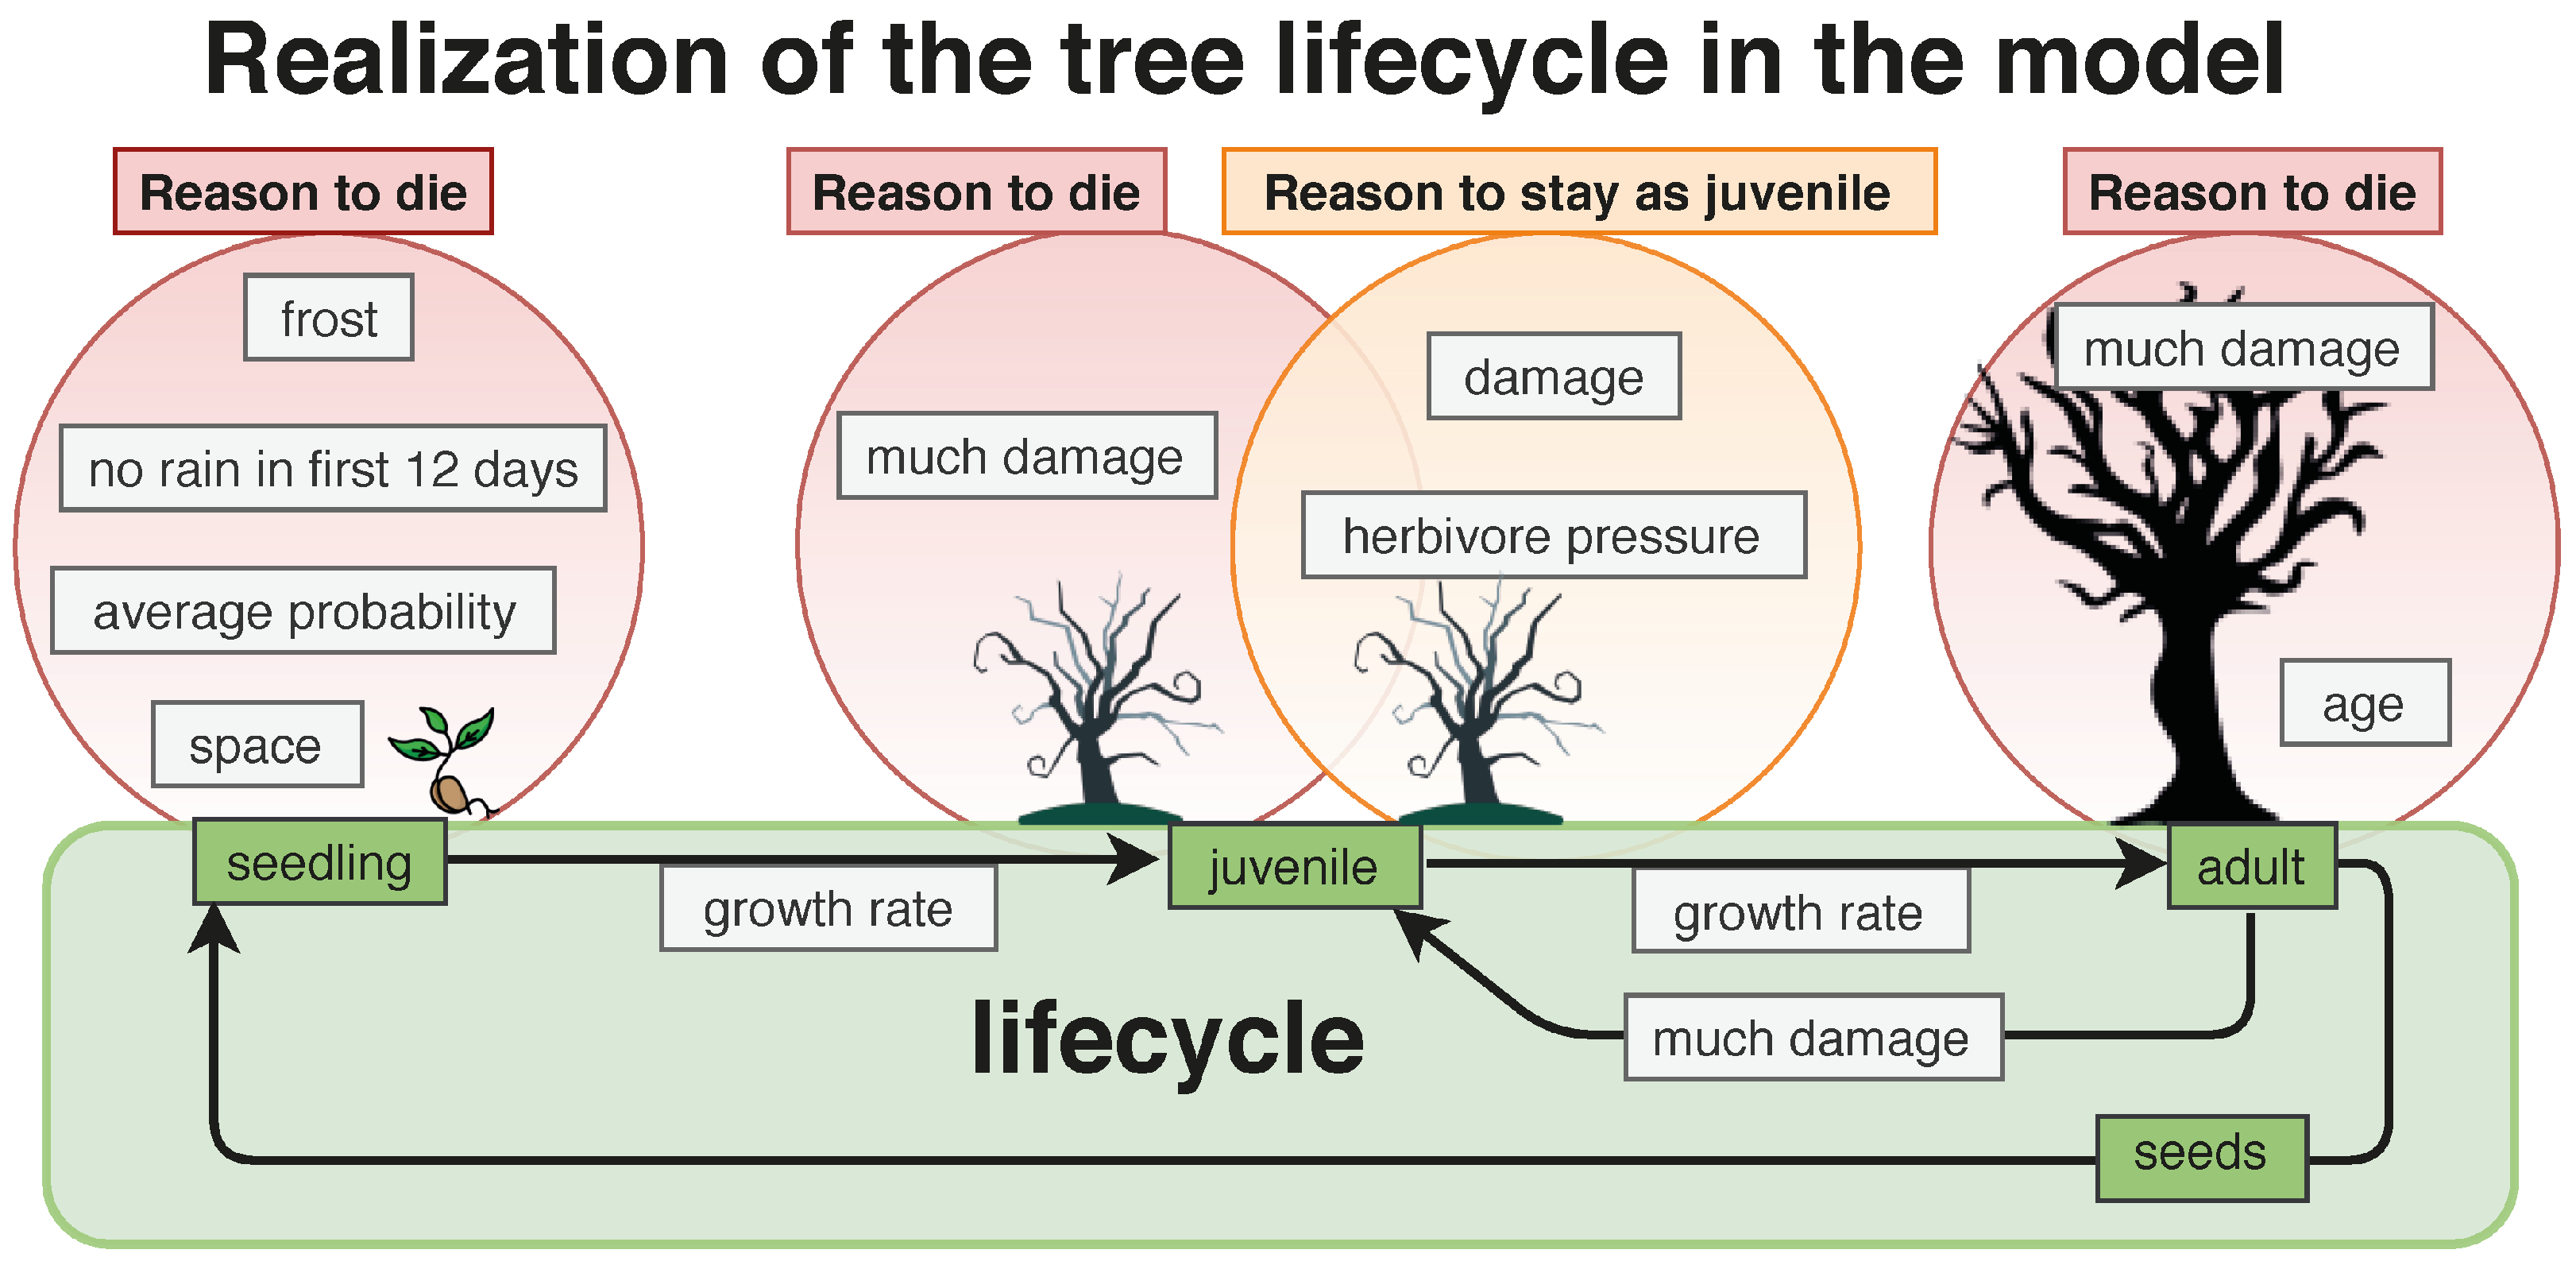
3.1. Agents
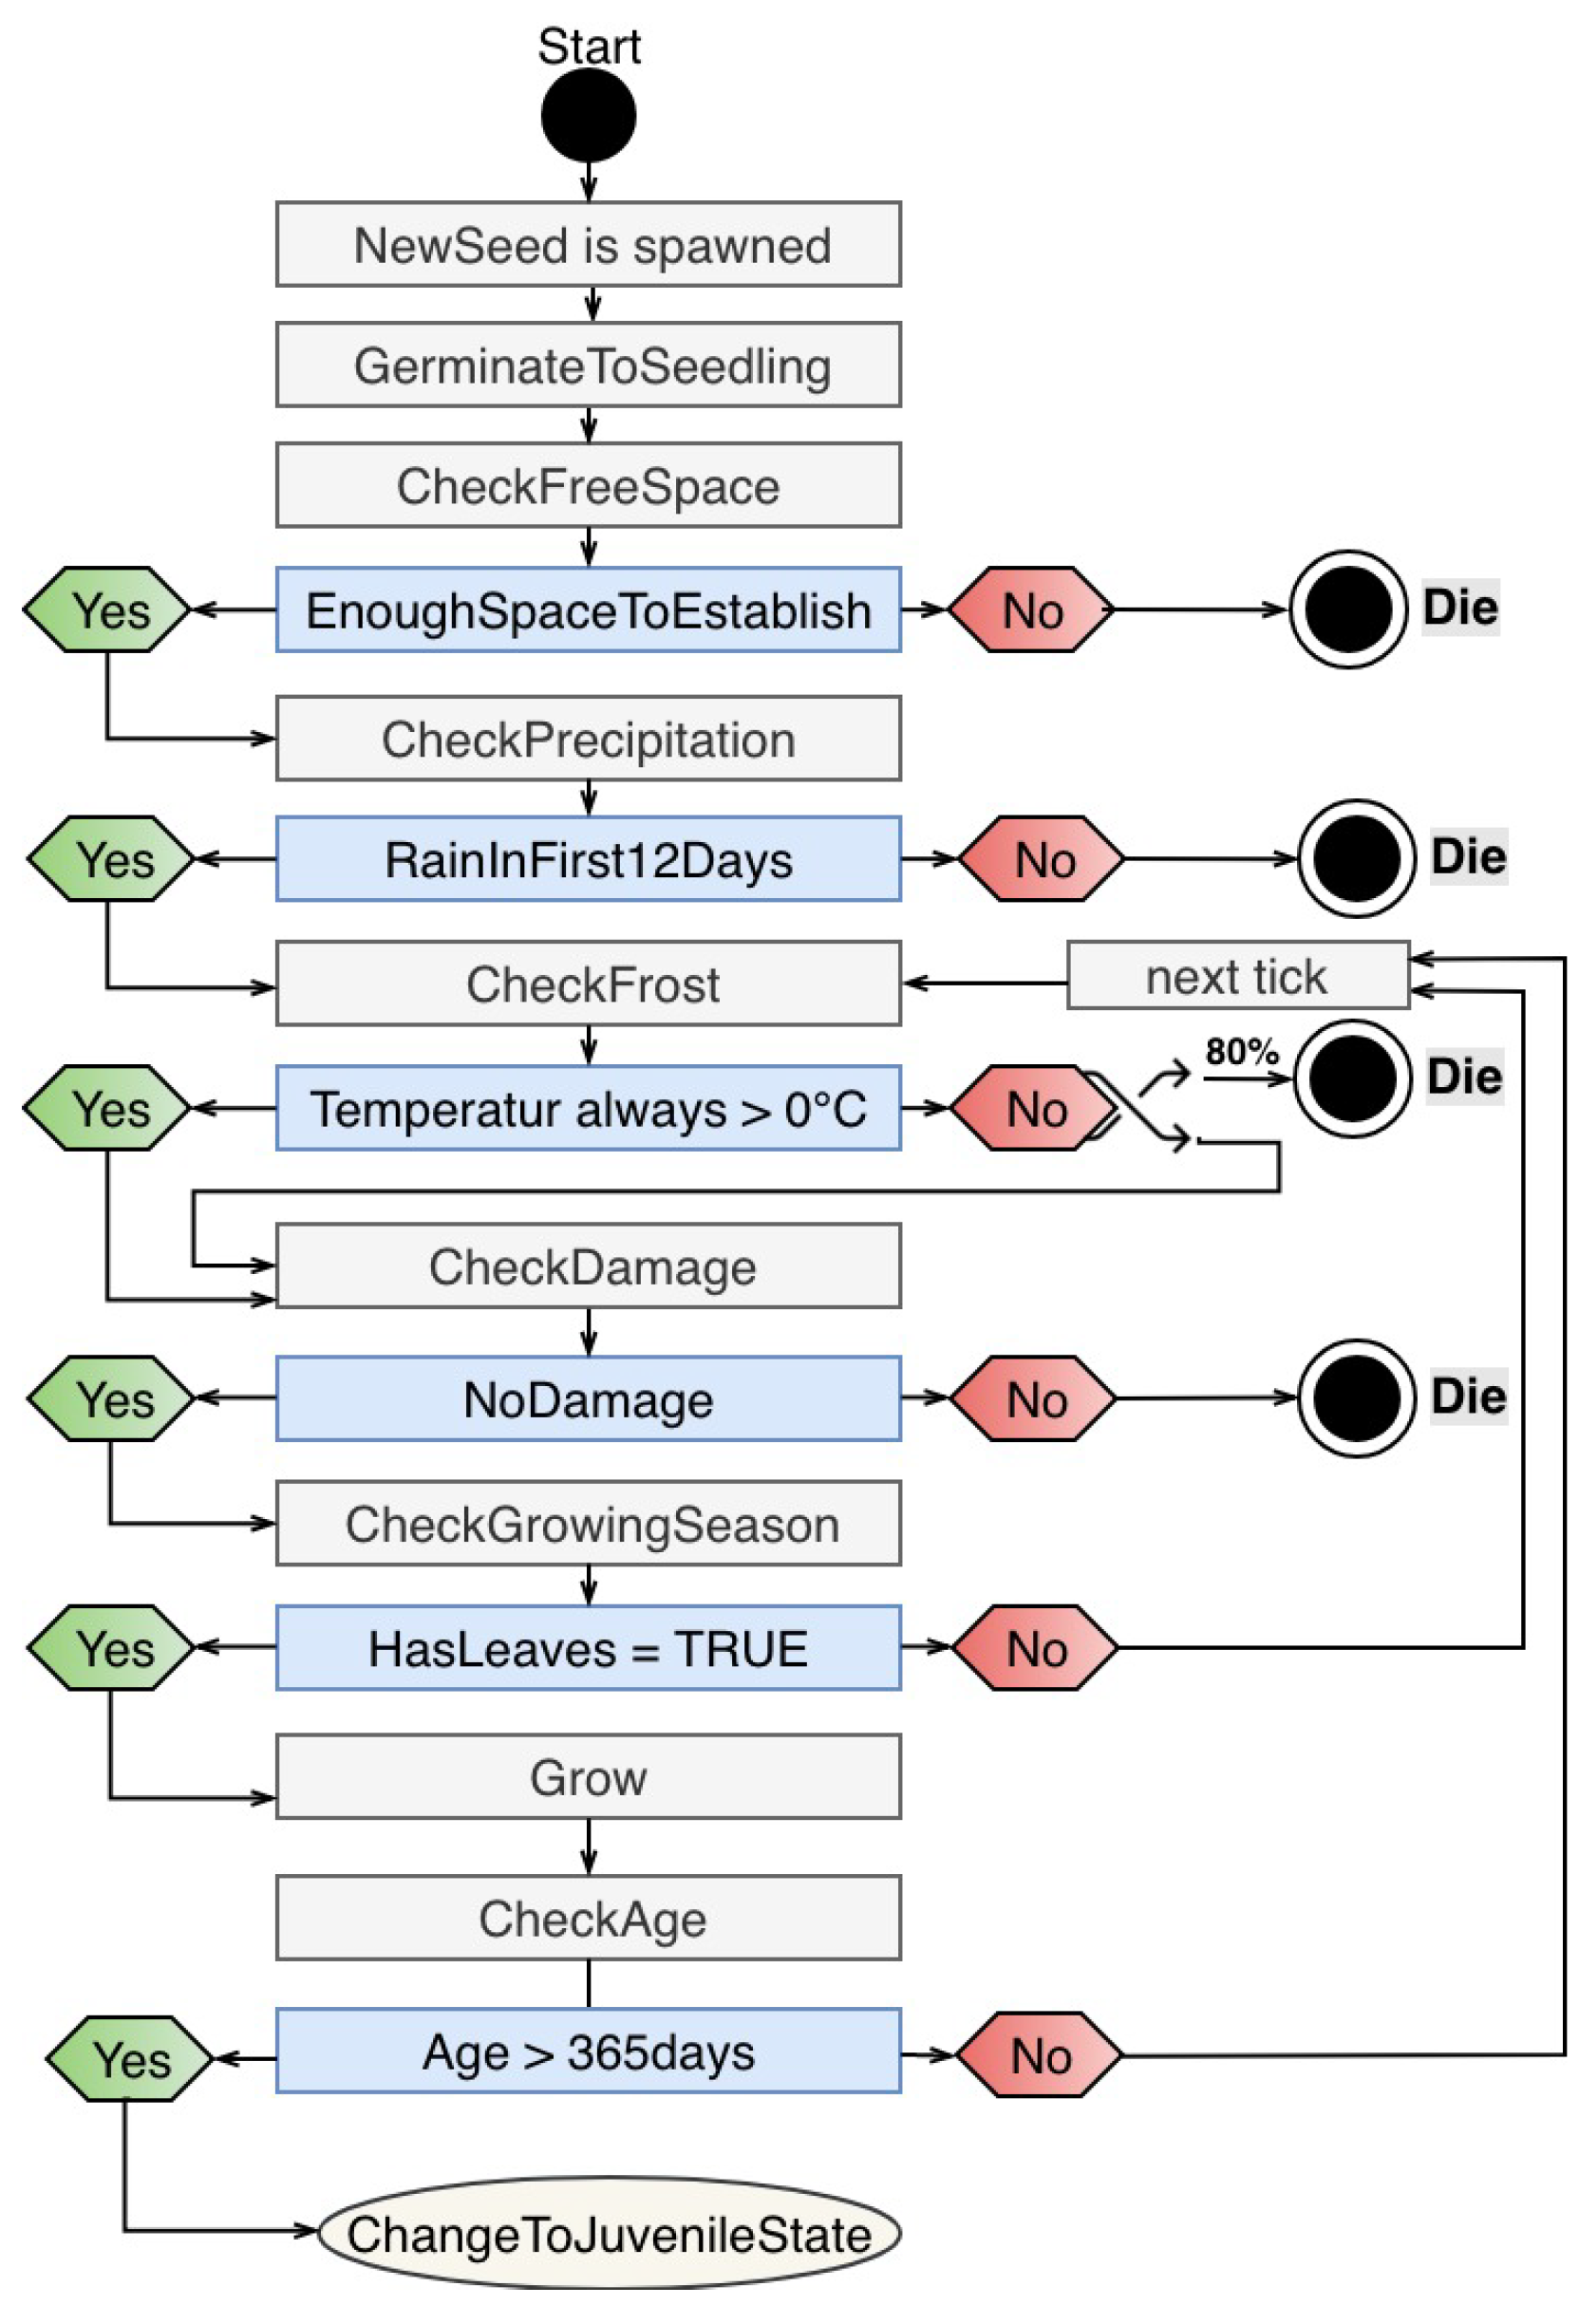
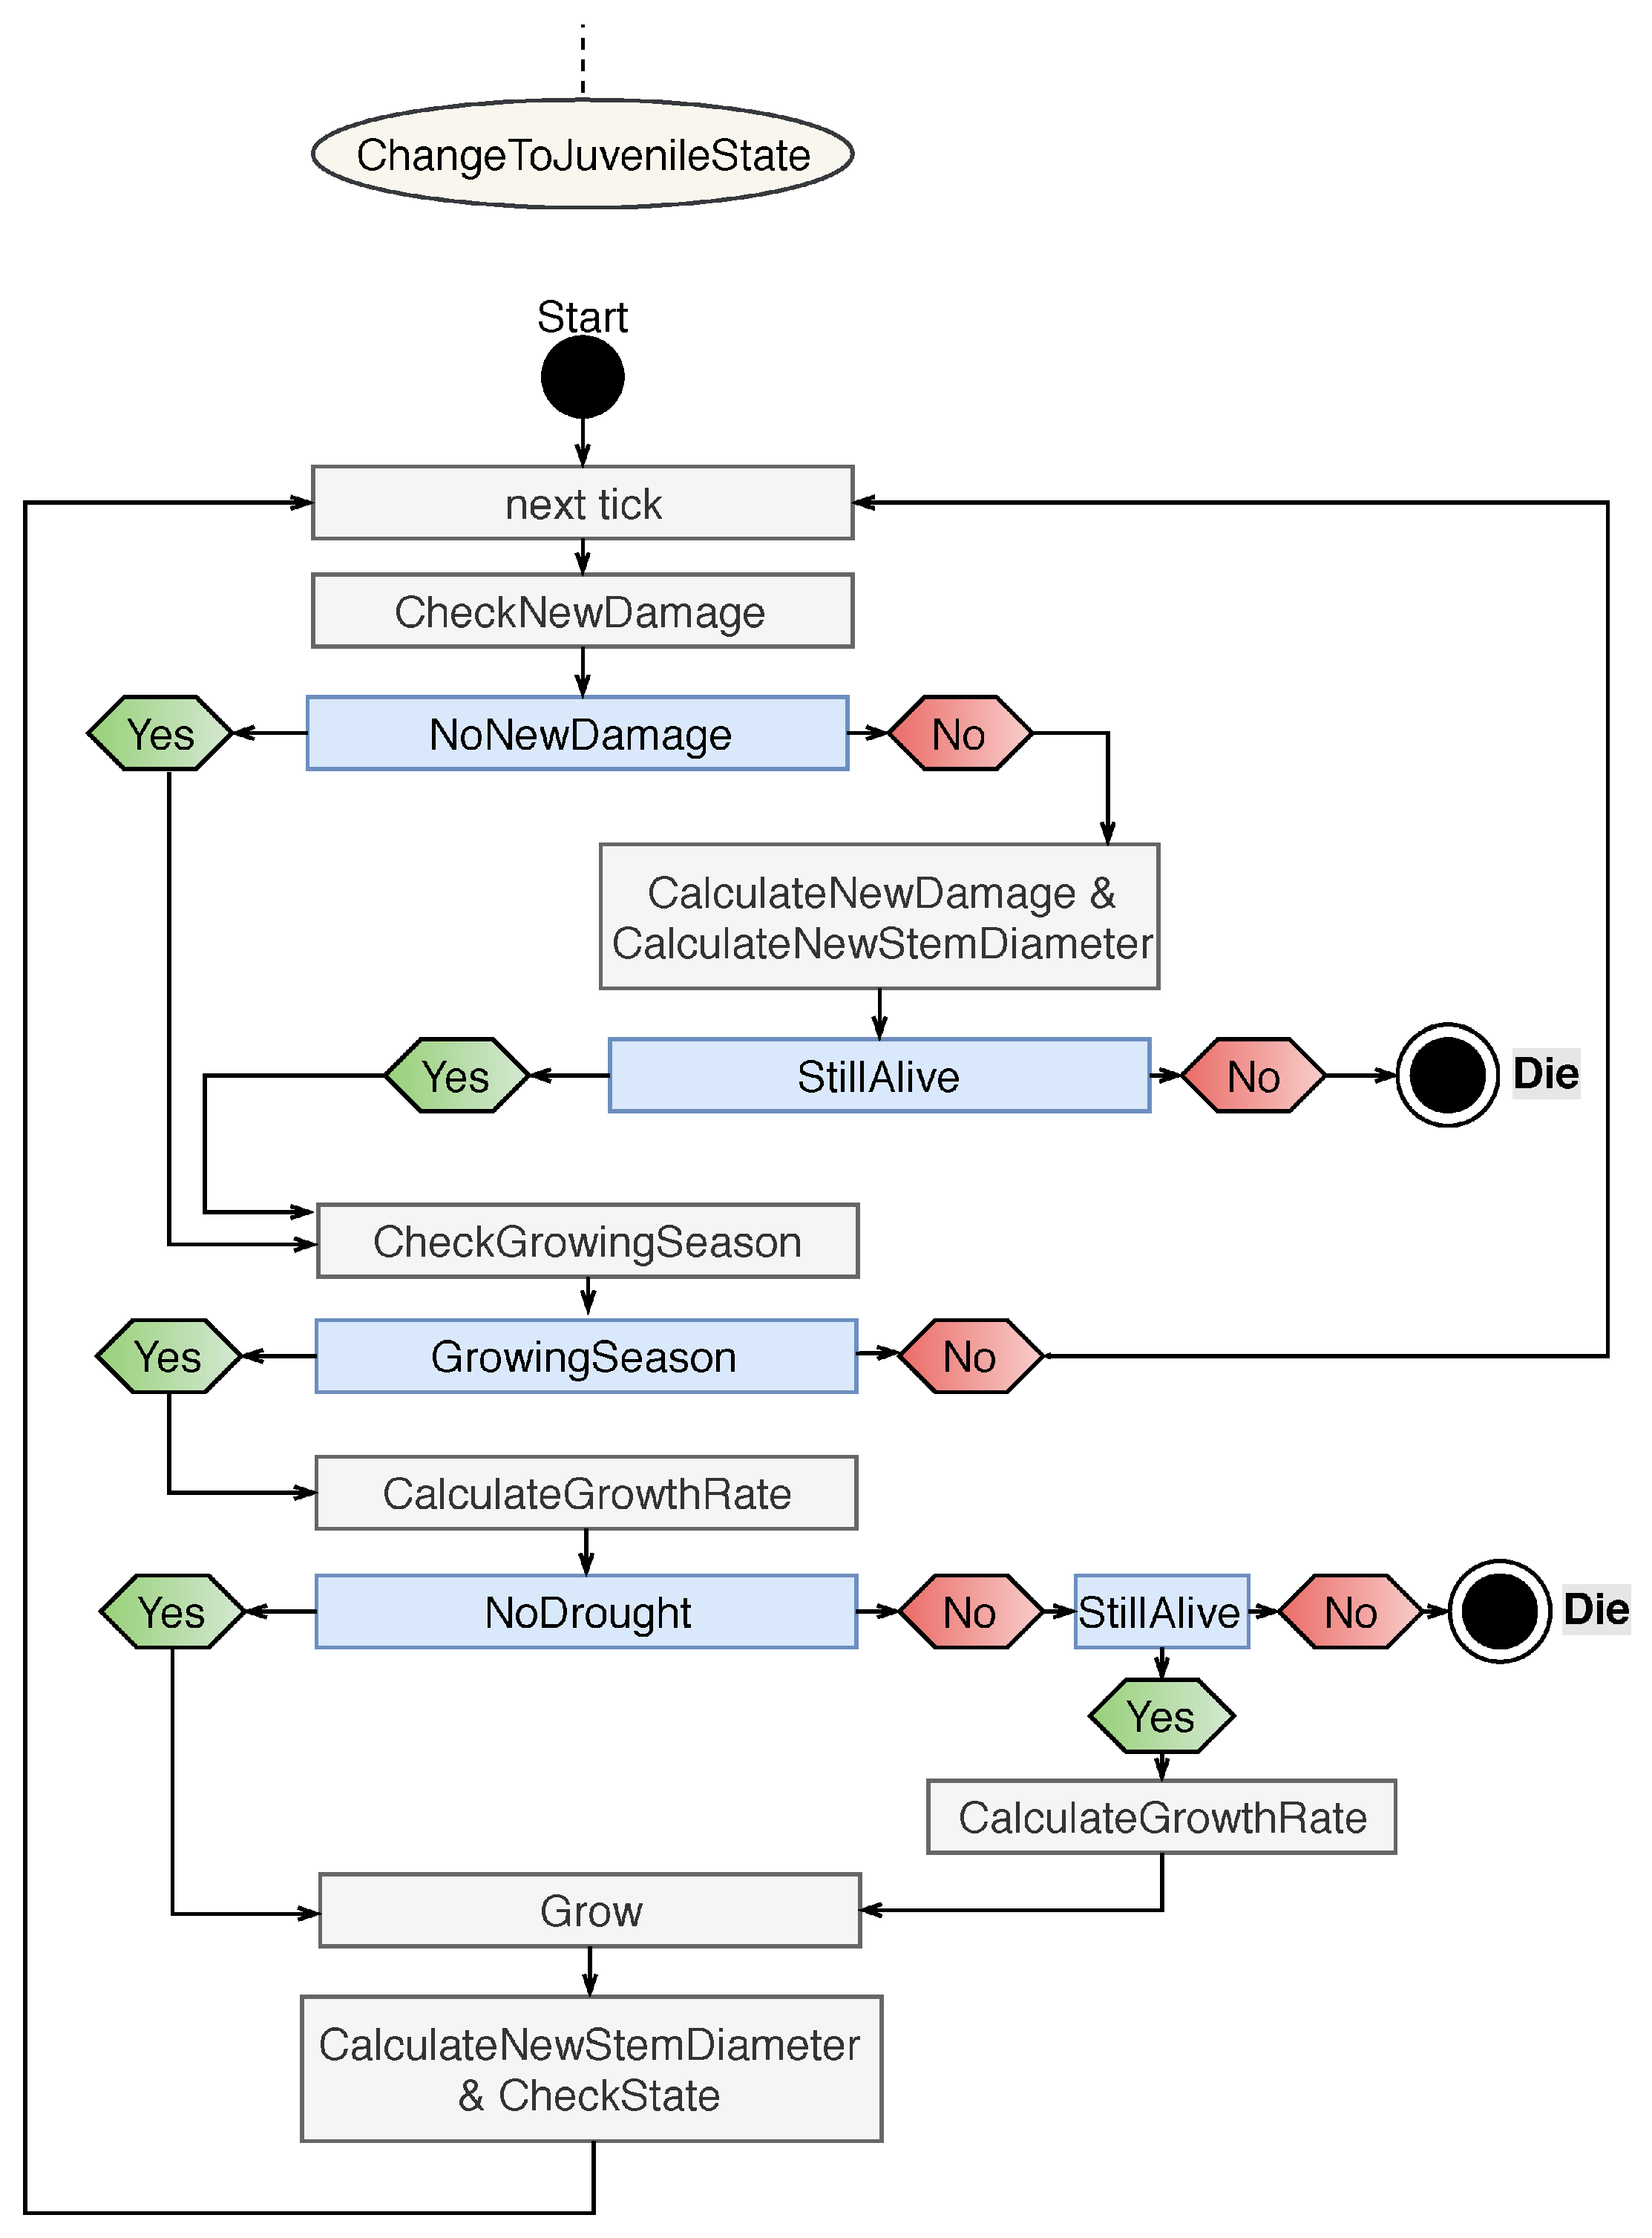
3.1.1. Tree
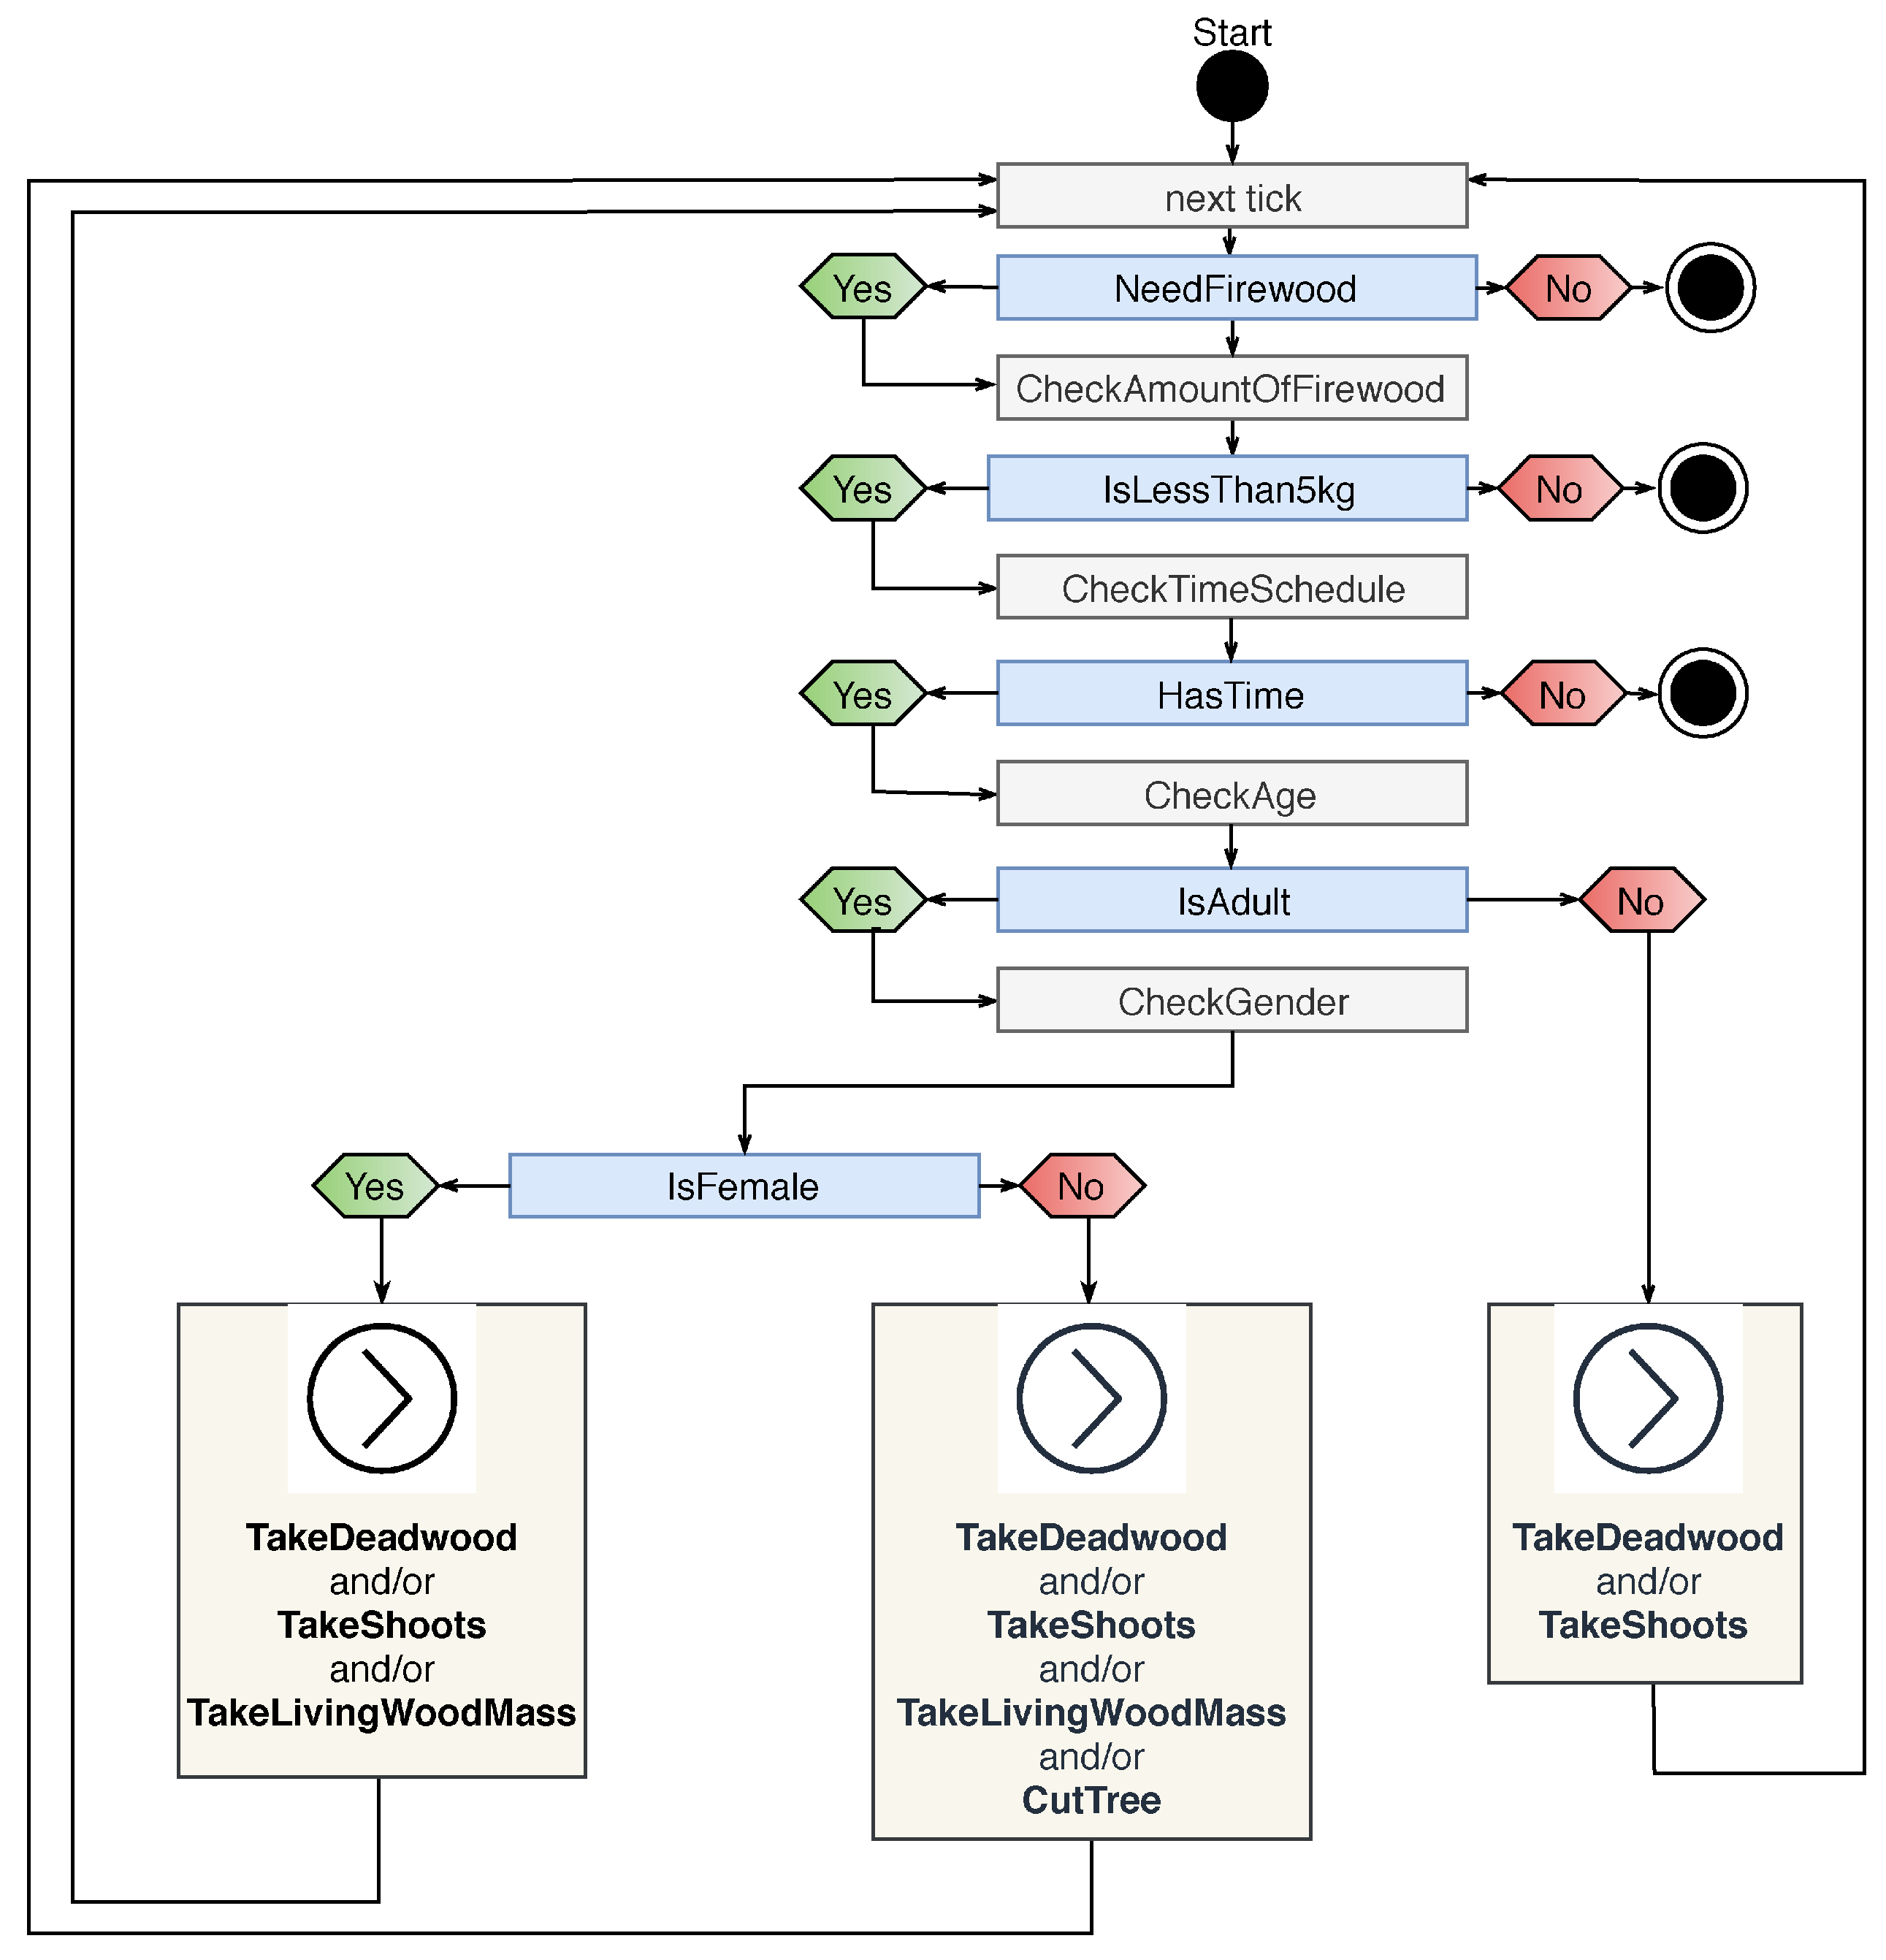
3.1.2. Firewood Collector
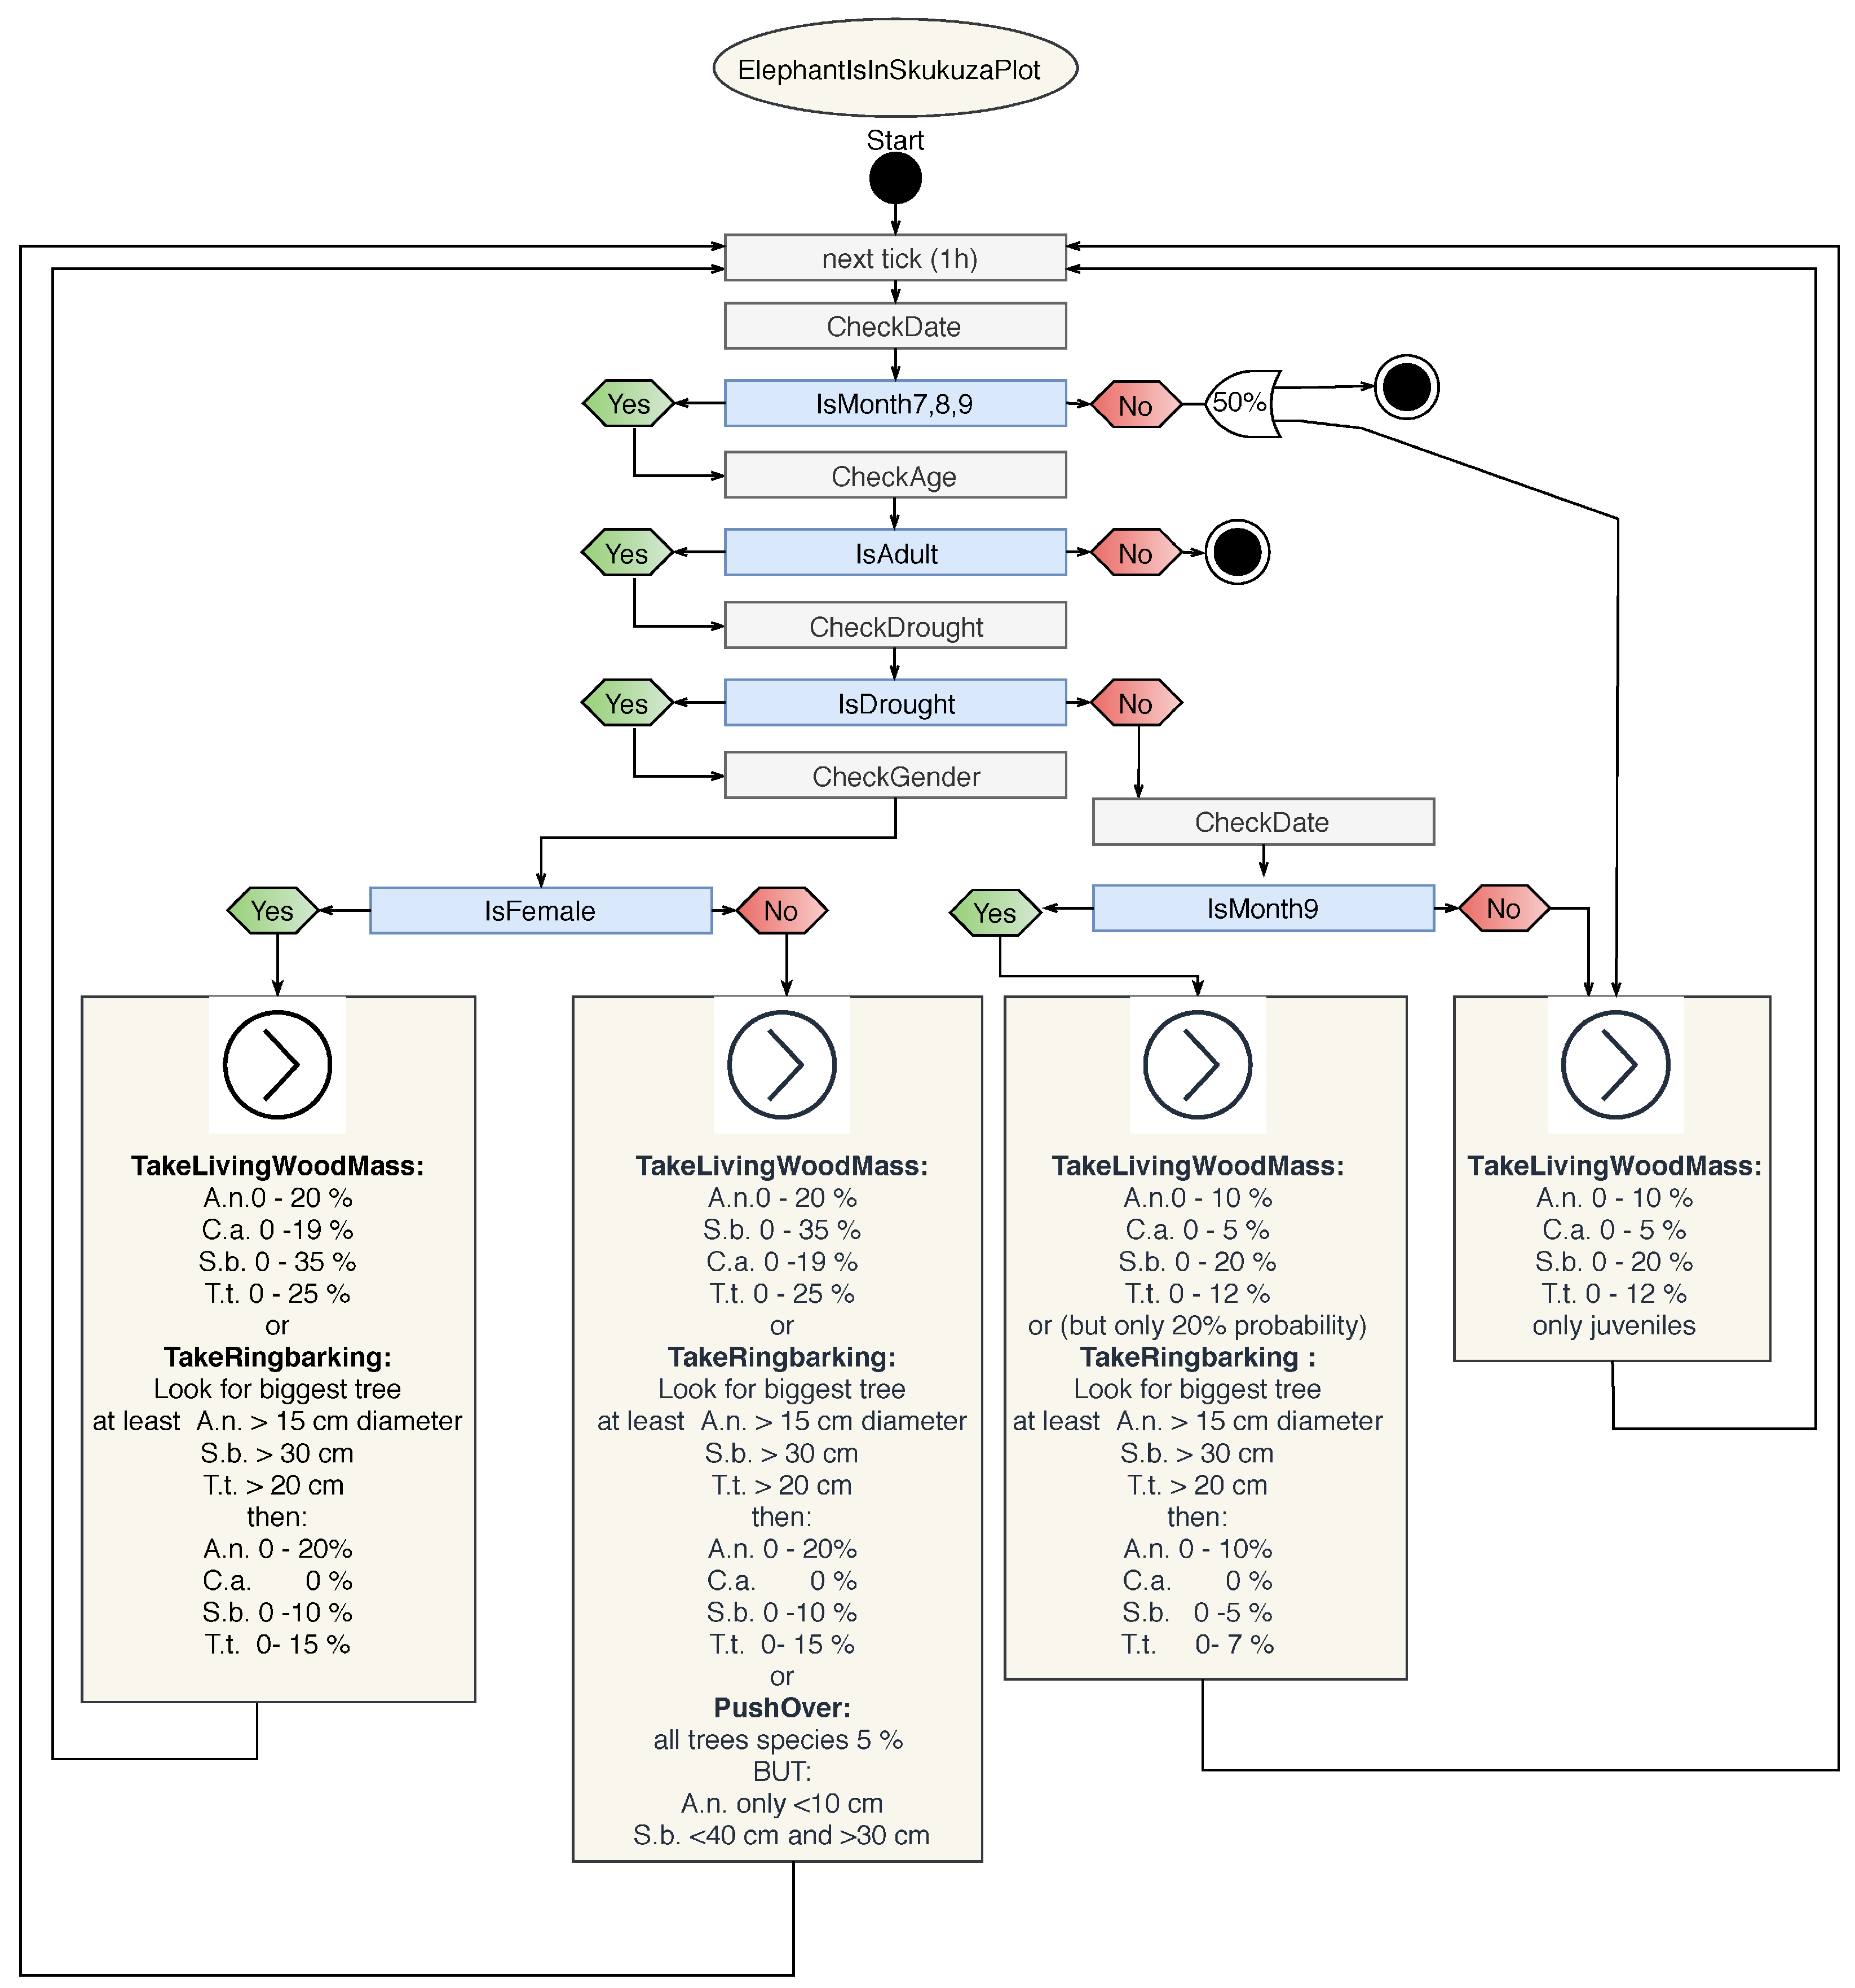
3.1.3. Elephant
3.2. Layers
3.3. Parameterization
3.4. Initialization
3.5. Scenarios
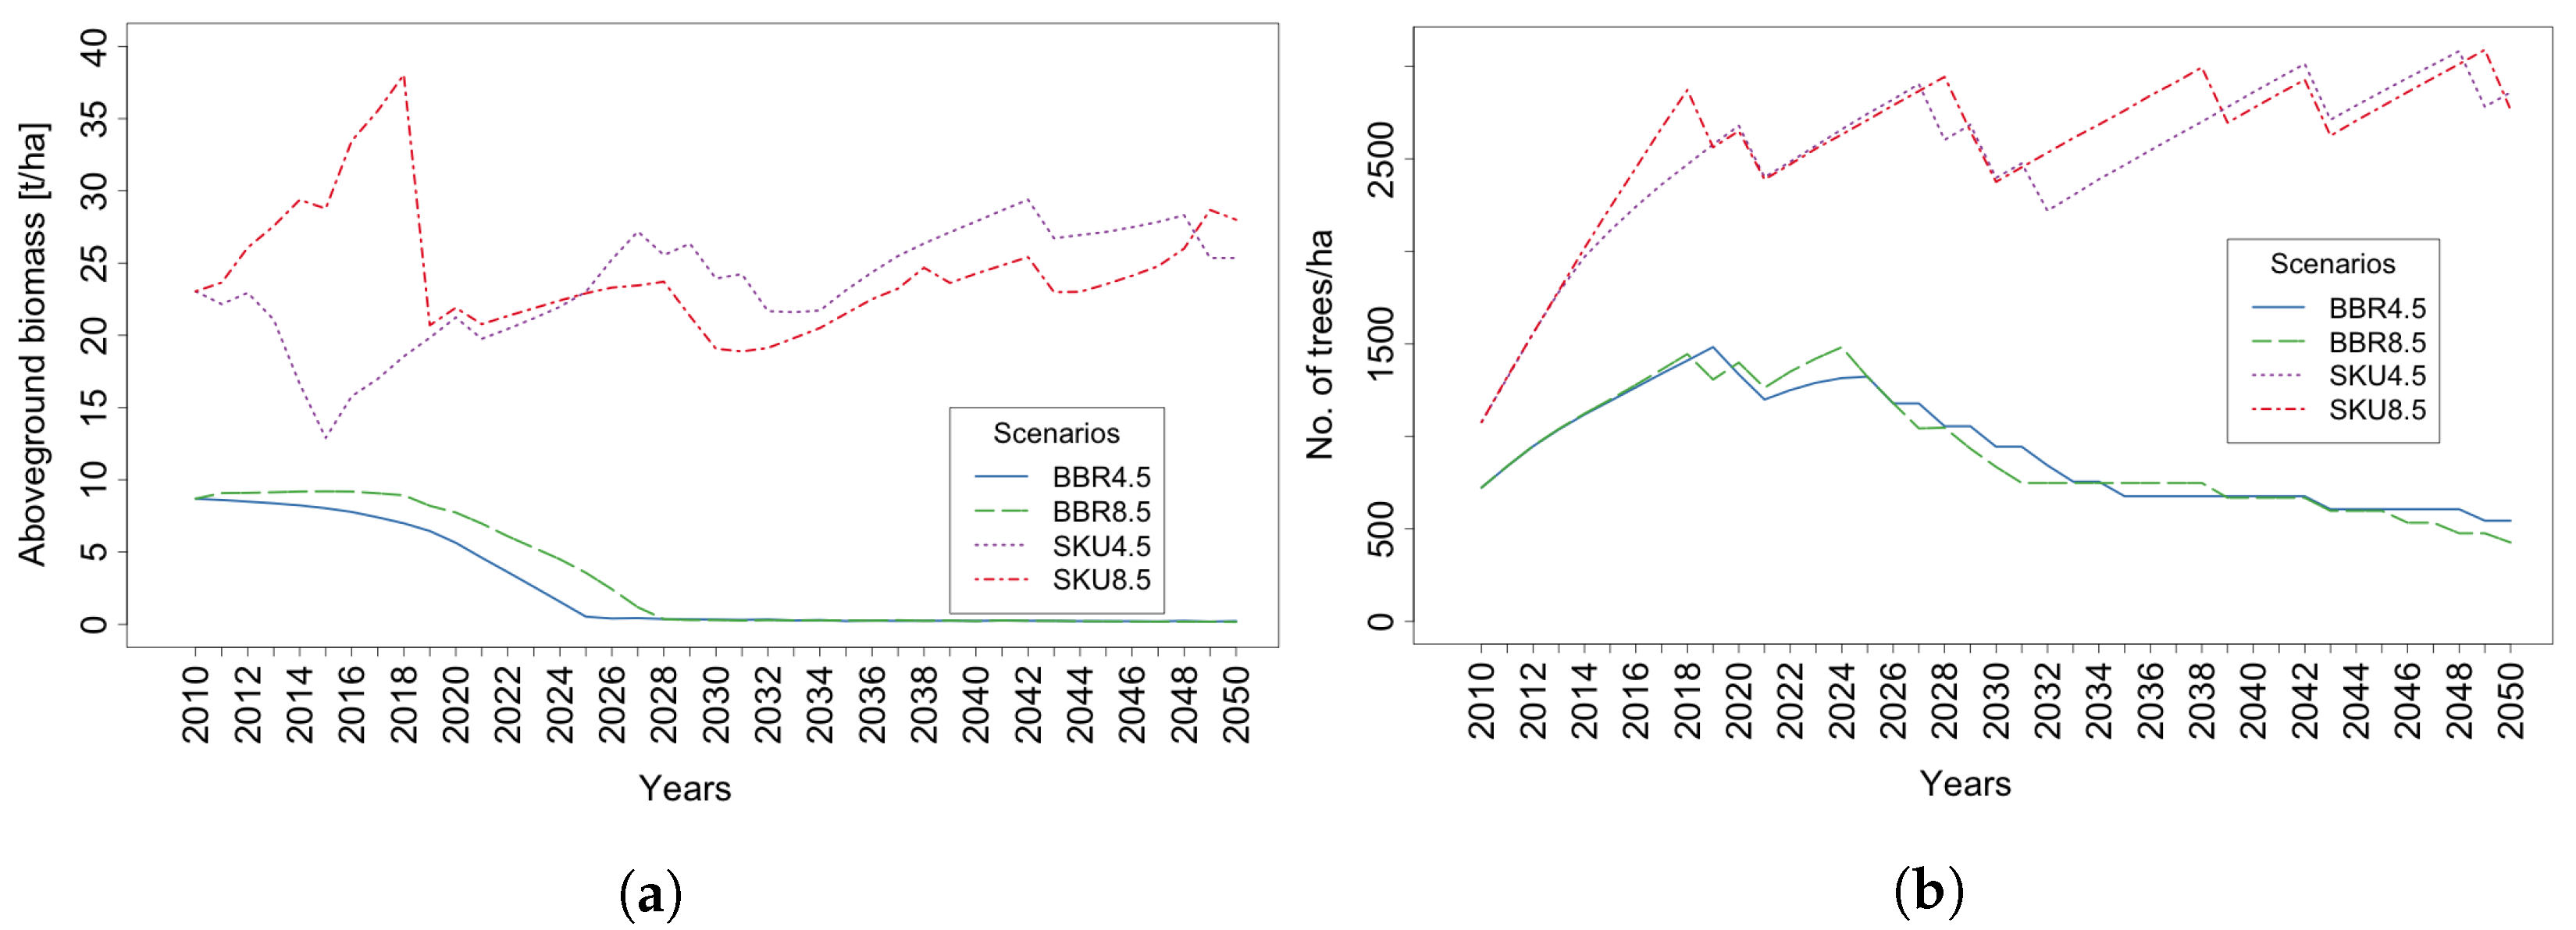
4. Results
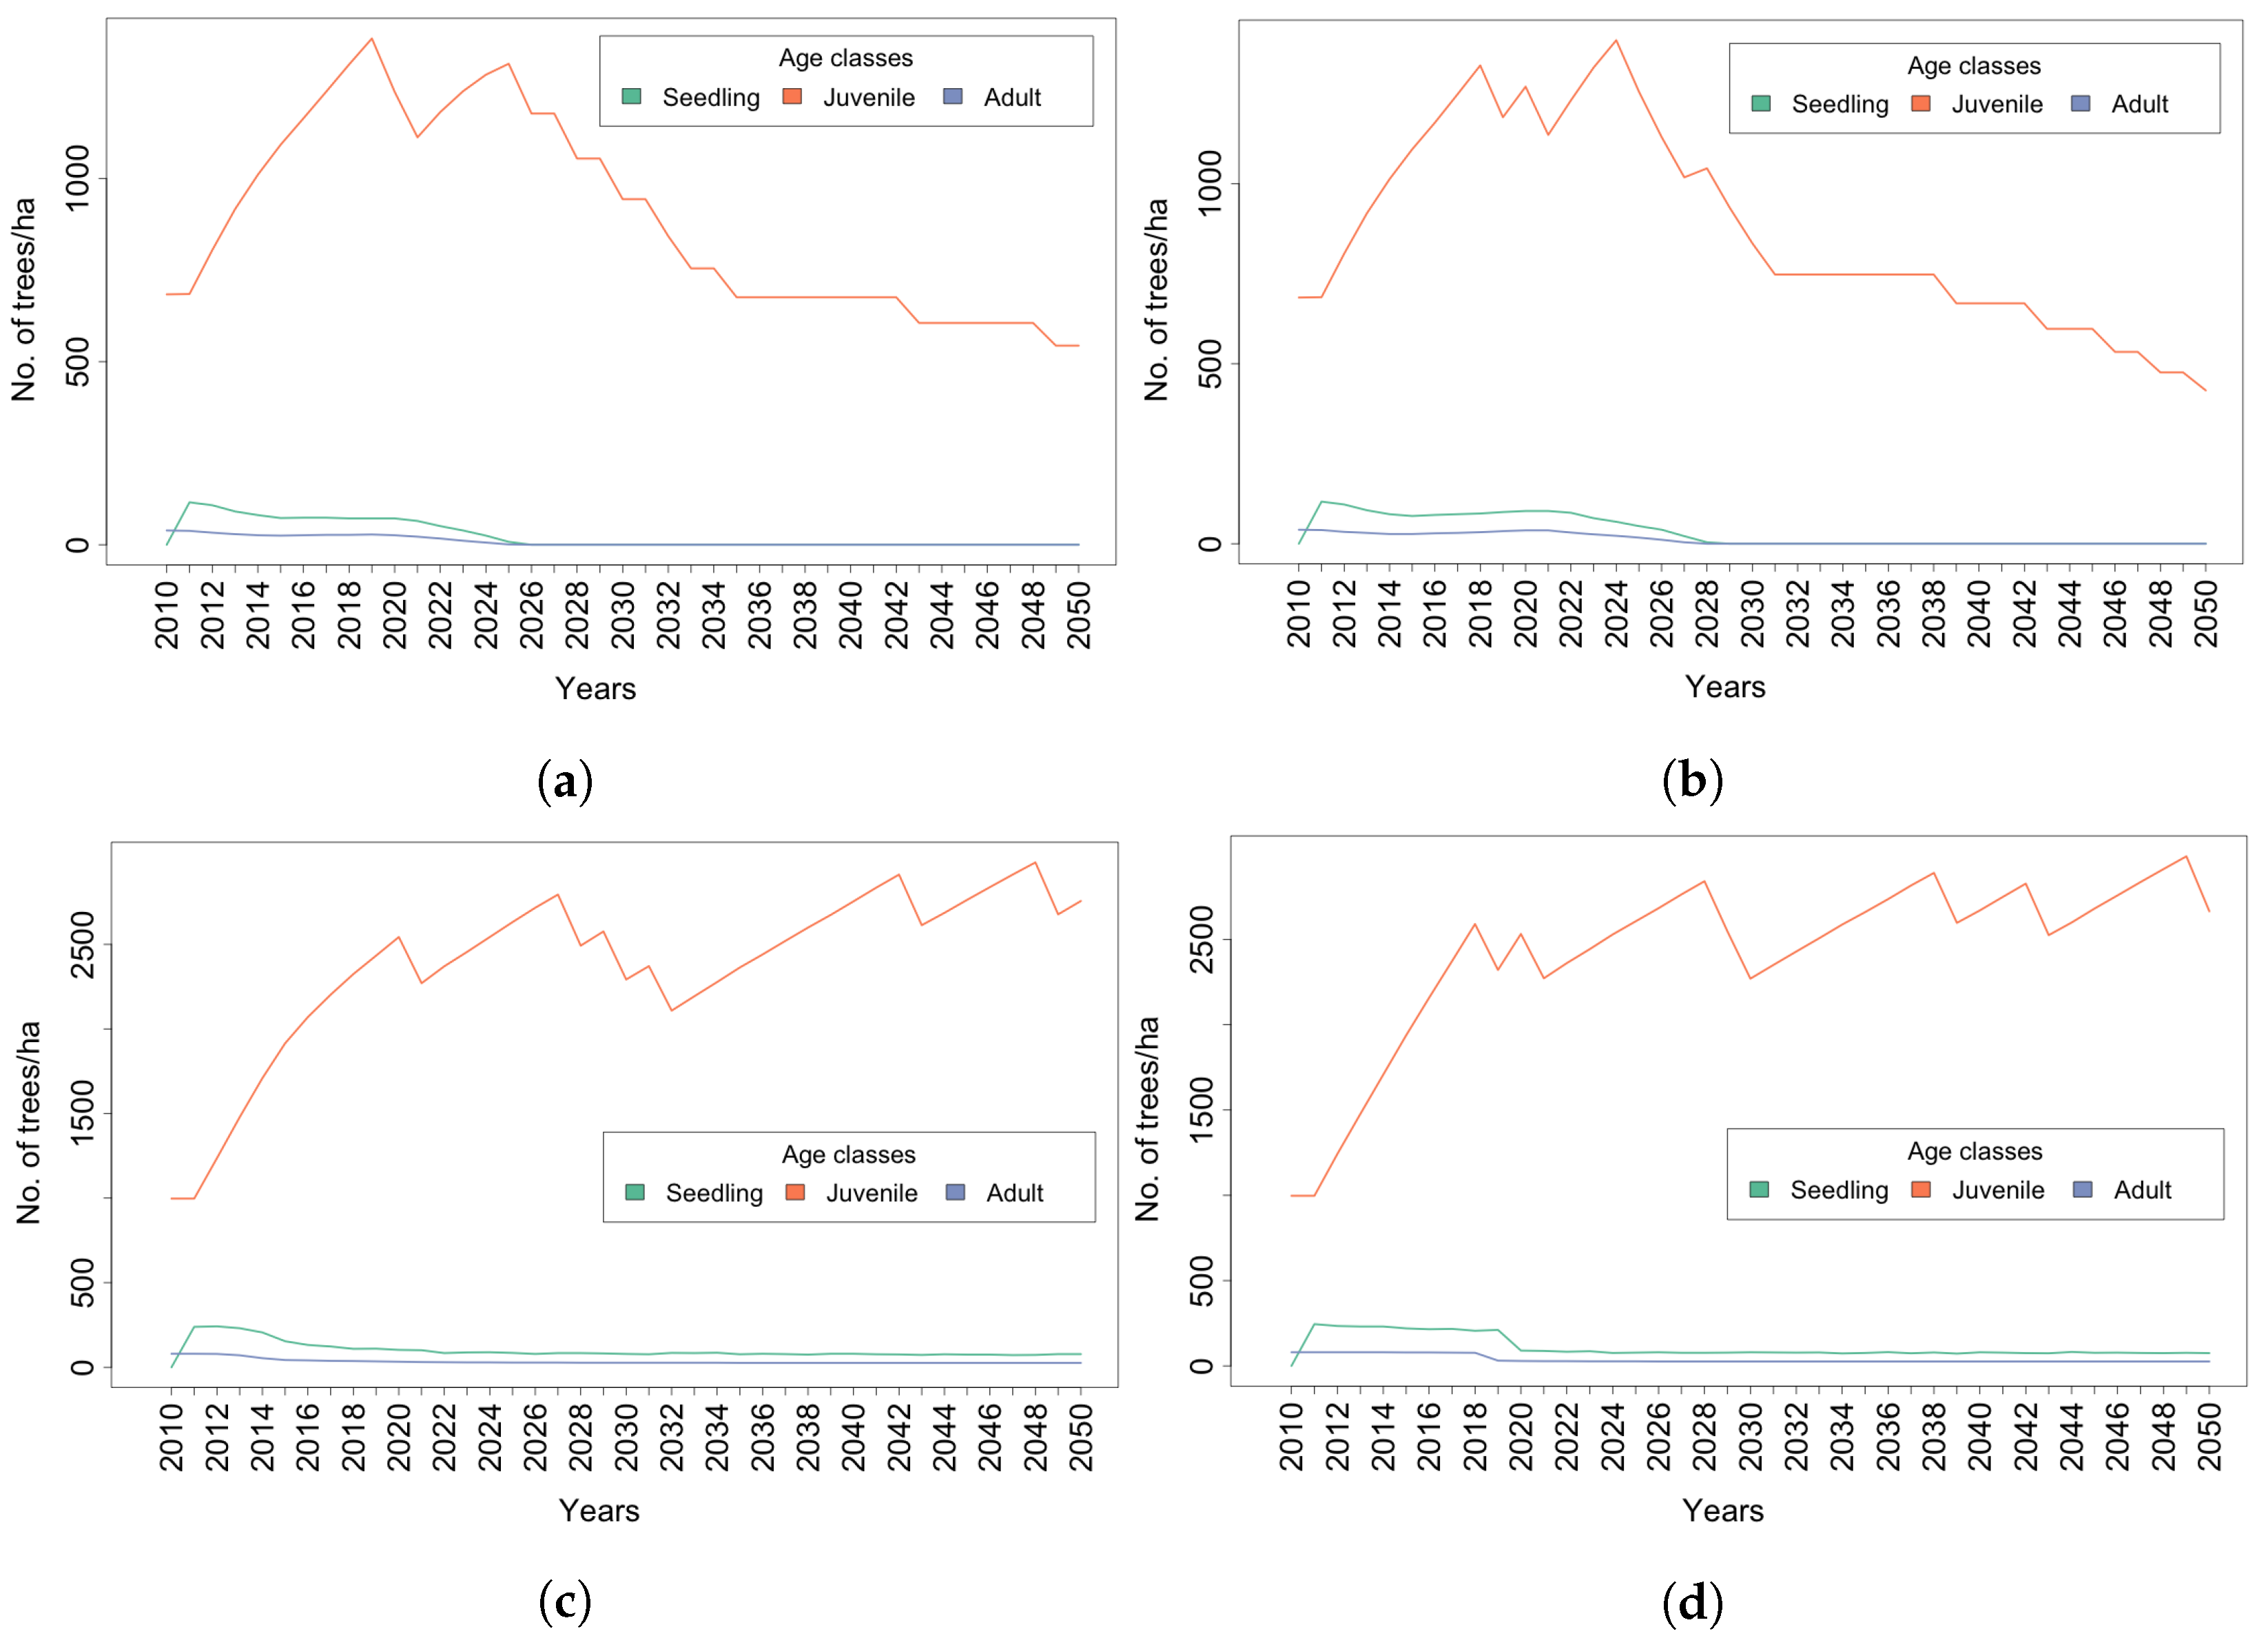
4.1. Trees
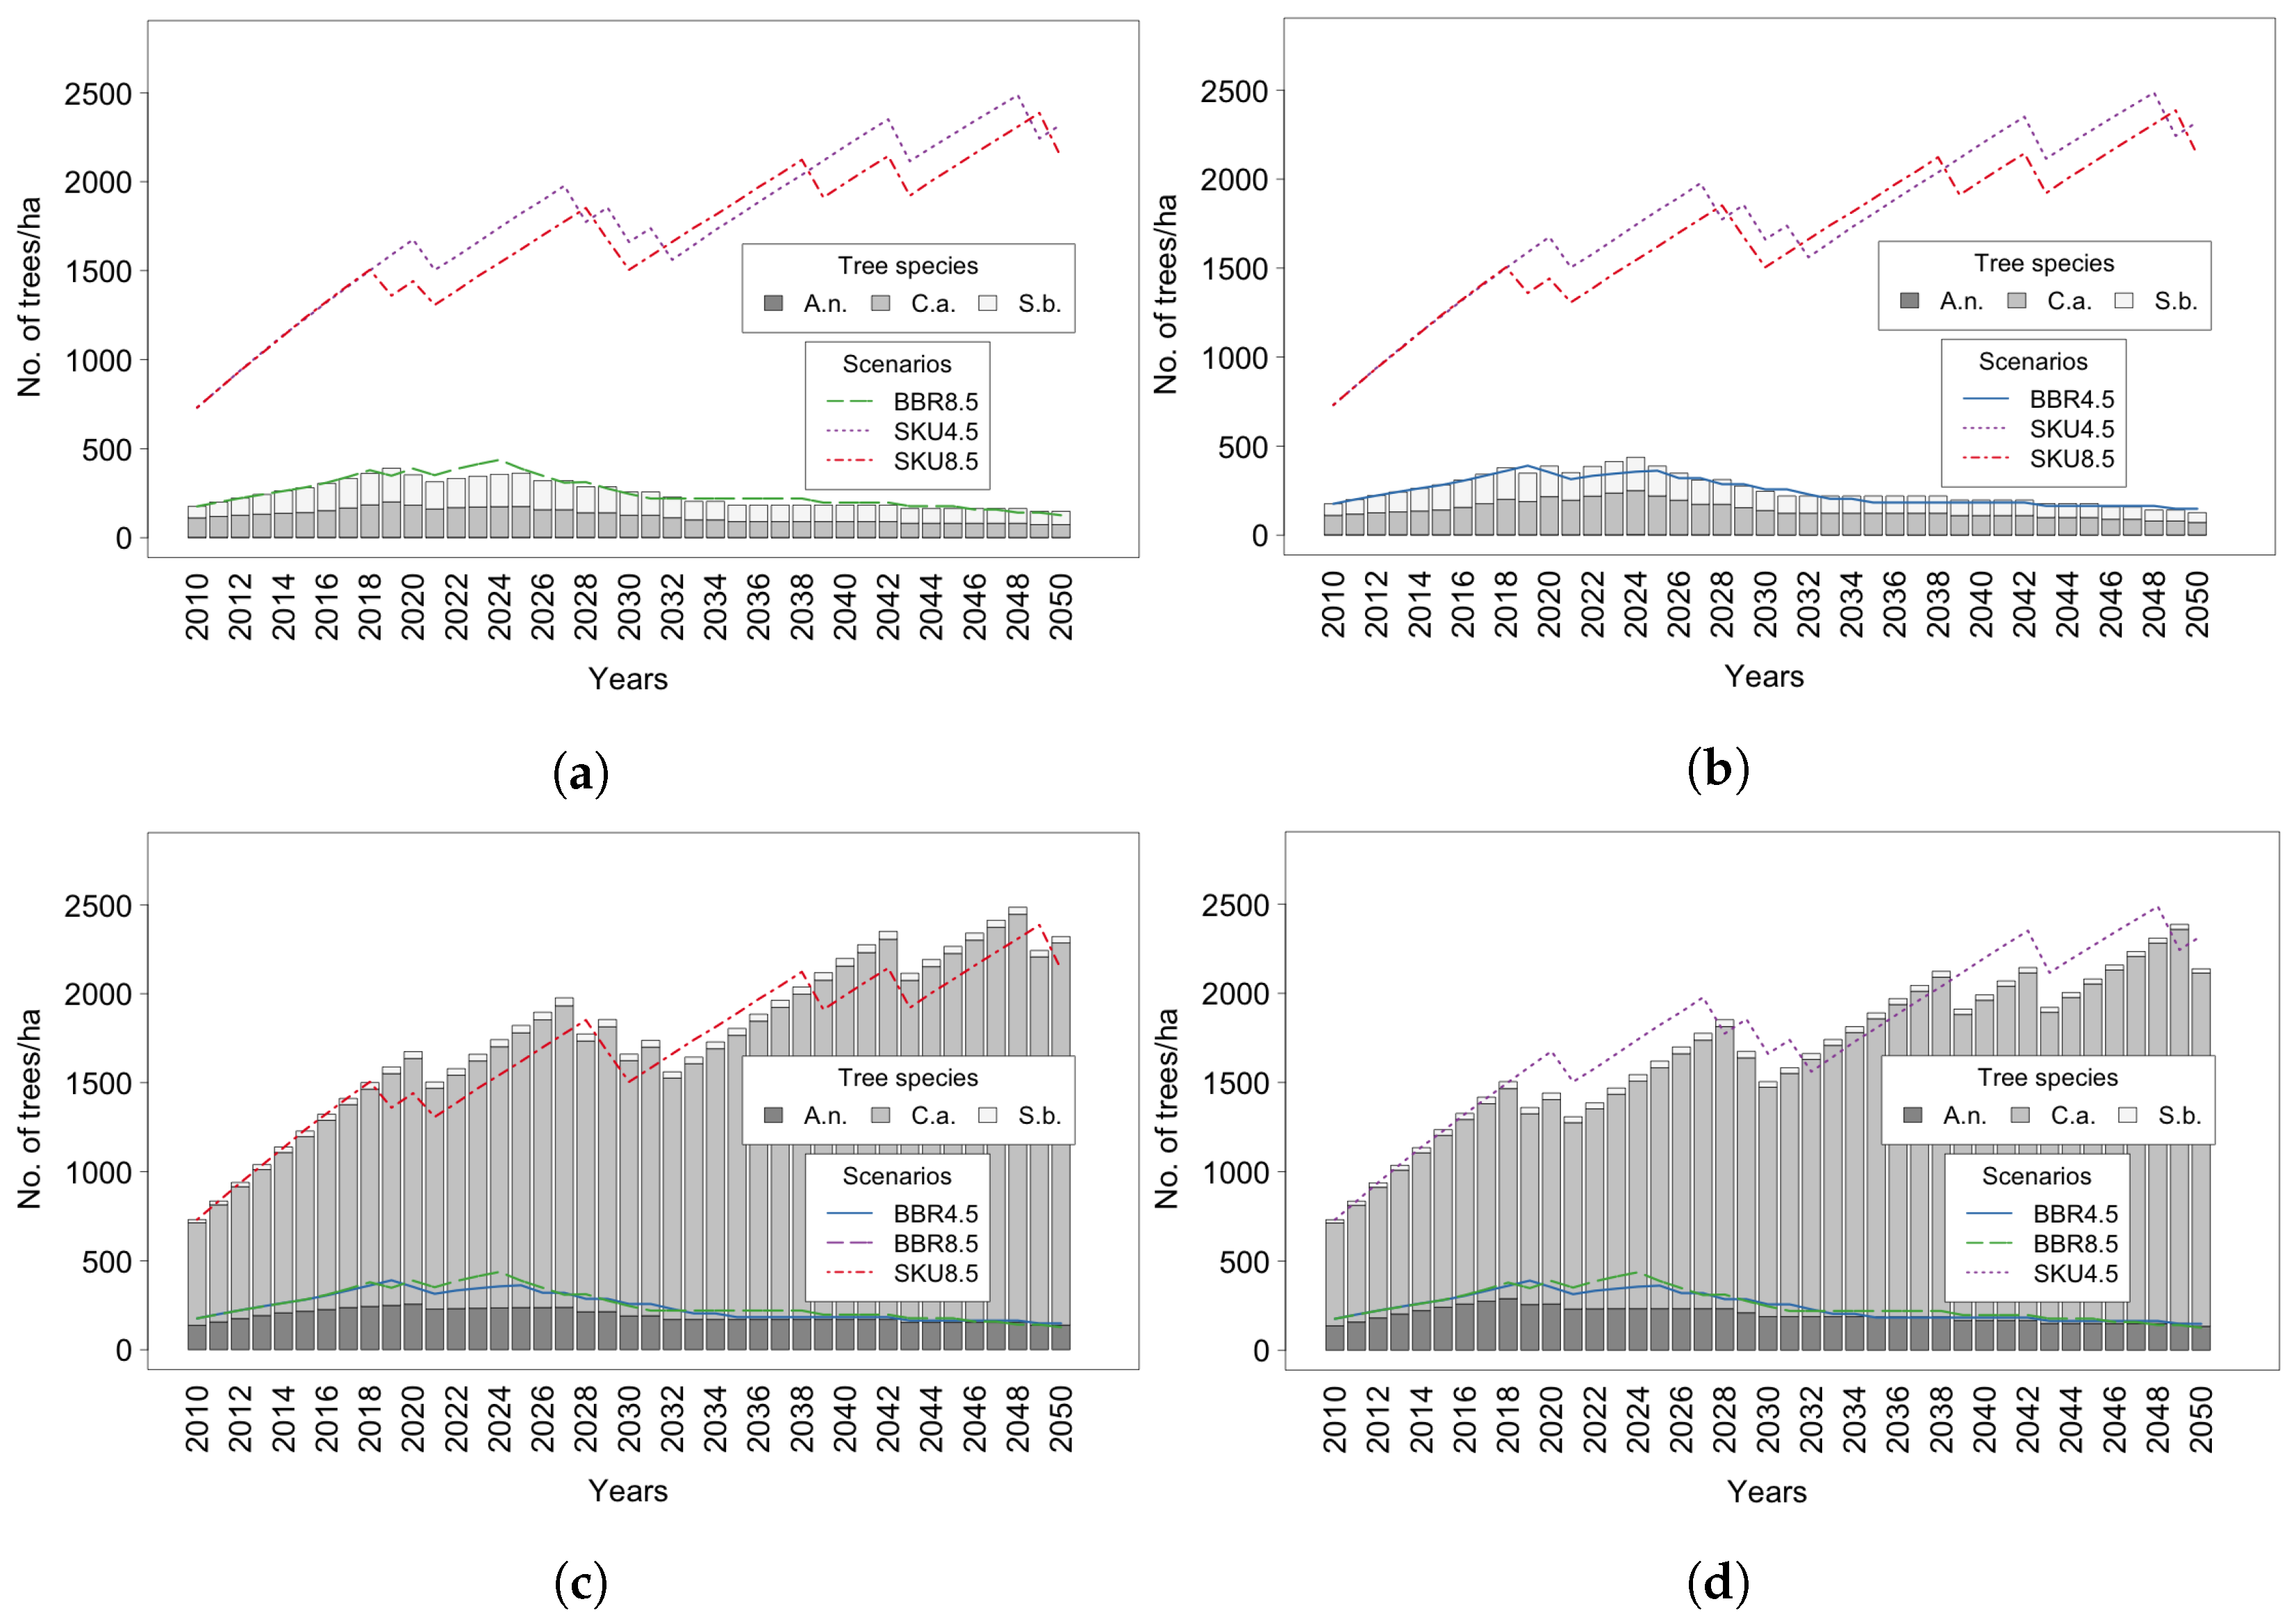
4.2. Tree Species
5. Discussion
6. Conclusions
Author Contributions
Funding
Data Availability Statement
Acknowledgments
Conflicts of Interest
Abbreviations
| A.n. | Acacia nigrescens |
| ABM | Agent-based modeling |
| AGB | Aboveground biomass |
| AI | Artificial Intelligence |
| BBR | Bushbuckridge |
| C.a. | Combretum apiculatum |
| C.m. | Colophospermum mopane |
| EMSAfrica | Ecosystem Management Support for Climate Change in Southern Africa |
| GIS | Geographic Information System |
| GOAP | Goal-oriented action planning |
| H | Damage class high, 60–80% |
| IPCC | Intergovernmental Panel on Climate Change |
| KNP | Kruger National Park |
| L | Damage class light, 10–30% |
| M | Damage class moderate, 30–60% |
| MARS | Multi-Agent Research and Simulation |
| N | Damage class nil, <10% |
| ODD | Overview, Design concepts, Details |
| RCP | Representative Concentration Pathways |
| S.b. | Sclerocarya birrea, Marula |
| SKU | Skukuza, inside the KNP |
| T.s. | Terminalia sericea |
| T.t. | Tree tree, a generic tree species |
| X | Damage class extreme, <80% |
Appendix A. ODD Protocol
Appendix A.1. Basic Principles
Appendix A.2. Emergence
Appendix A.3. Adaptation
Appendix A.4. Objectives
Appendix A.5. Fitness
Appendix A.6. Learning
Appendix A.7. Prediction
Appendix A.8. Sensing
Appendix A.9. Interaction
Appendix A.10. Stochasticity
Appendix A.11. Collectives
Appendix A.12. Observation
Appendix B. Supplementary Information on Agent Types

Appendix B.1. Agent Type: Tree

| Radius (cm) of No Establishment When Neighbored by | Seedling | Juvenile | Adult |
|---|---|---|---|
| A.n. | 4 | 32 | 80 |
| C.a. | 4 | 40 | 80 |
| S.b. | 4 | 80 | 500 |
| T.t. | 4 | 52 | 220 |


| A.n. | C.a. | S.b. | T.t. | |
|---|---|---|---|---|
| Seedling | <1 | <1 | <1 | <1 |
| Juvenile | 1–8 | 1–10 | 1–20 | 1–13 |
| Adult | >8 | >10 | >20 | >13 |
| Max. | 20 | 20 | 50 | 30 |
- Definition reduceFactor: The growth rate is reduced by damage. For damage type N, the growth rate is maximized; damage type L reduces the growth rate randomly between 0–10%; damage type M reduces the growth rate randomly between 10–30%; and damage type H reduce the growth rate randomly between 30–60%. By damage type X, the tree falls back into the juvenile state or dies.
- Definition growthRate: Because Combretum apiculatum grows more slowly than Acacia nigescens and Sclerocarya birrea, a growthRate value was integrated. The value for Acadia is 0.5, and 1 for all species.
- Definition MaxStemDiameter (): The maximum stem diameter differs by species. It is 20 cm for A.n.; 20 cm for C.a.; 50 cm for S.b., and 30 cm for T.t.
Appendix B.2. Agent Type: FirewoodCollector
| Action | Cost |
|---|---|
| CutBranchAn | 50 |
| CutBranchCa | 50 |
| CutBranchSb | 90 |
| CutBranchTt | 50 |
| CutShoot | 30 |
| CollectDeadWood | 10 |
| CarryWoodHome | 0 |
| AbortAndGoHome | 0 |
| EvaluateAndPackWoodForTransport | 0 |

Appendix B.3. Agent Type: Elephant
| Elephant Interactions | |
|---|---|
| Food preferences | Fresh grass > fresh leaves > twig, bark, and roots |
| Ringbarking (by food/water stress) | A.n. > S.b. ≫ C.a. |
| Pushover (by food/water stress) | Juvenile A.n. > S.b. |
| No damage | Stem diameter cm |

References
- Blanco, C.C.; Scheiter, S.; Sosinski, E.; Fidelis, A.; Anand, M.; Pillar, V.D. Feedbacks between vegetation and disturbance processes promote long-term persistence of forest-grassland mosaics in south Brazil. Ecol. Model. 2014, 291, 224–232. [Google Scholar] [CrossRef]
- Helm, C.V.; Scott, S.L.; Witkowski, E.T.F. Reproductive potential and seed fate of Sclerocarya birrea subsp. caffra (marula) in the low altitude savannas of South Africa. S. Afr. J. Bot. 2011, 77, 650–664. [Google Scholar] [CrossRef]
- Jacobs, O.S.; Biggs, R. The status and population structure of the marula in the Kruger National Park. S. Afr. J. Wildl. Res. 2002, 32, 1–12. [Google Scholar]
- Manning, A.D.; Fischer, J.; Lindenmayer, D.B. Scattered trees are keystone structures—Implications for conservation. Biol. Conserv. 2006, 132, 311–321. [Google Scholar] [CrossRef]
- Stevens, N.; Swemmer, A.M.; Ezzy, L.; Erasmus, B.F.N. Investigating potential determinants of the distribution limits of a savanna woody plant: Colophospermum mopane. J. Veg. Sci. 2014, 25, 363–373. [Google Scholar] [CrossRef]
- Accatino, F.; Wiegand, K.; Ward, D.; De Michele, C. Trees, grass, and fire in humid savannas-The importance of life history traits and spatial processes. Ecol. Model. 2016, 320, 135–144. [Google Scholar] [CrossRef]
- Colgan, M.S.; Martin, R.E.; Baldeck, C.A.; Asner, G.P. Tree foliar chemistry in an African savanna and its relation to life history strategies and environmental filters. PLoS ONE 2015, 10, e0124078. [Google Scholar] [CrossRef]
- Higgins, S.I.; Bond, W.J.; Combrink, H.; Craine, J.M.; February, E.C.; Govender, N.; Lannas, K.; Moncreiff, G.; Trollope, W.S.W. Which traits determine shifts in the abundance of tree species in a fire-prone savanna? J. Ecol. 2012, 100, 1400–1410. [Google Scholar] [CrossRef]
- Lenfers, U.A.; Brüggemann, R.; Clemen, T. Exploring survival strategies of African Savanna trees by partial ordering techniques. Ecol. Inform. 2017, 42, 14–23. [Google Scholar] [CrossRef]
- Tomlinson, K.W.; Poorter, L.; Sterck, F.J.; Borghetti, F.; Ward, D.; de Bie, S.; van Langevelde, F. Leaf adaptations of evergreen and deciduous trees of semi-arid and humid savannas on three continents. J. Ecol. 2013, 101, 430–440. [Google Scholar] [CrossRef]
- Coates-Palgrave, K. Trees of Southern Africa, 3rd ed.; Struik Nature, Penguin Random House (Pty) Ltd.: Century City, South Africa, 2002; p. 1212. [Google Scholar]
- Fisher, J.T.; Witkowski, E.T.; Erasmus, B.F.; Van Aardt, J.; Asner, G.P.; Wessels, K.J.; Mathieu, R. Human-modified landscapes: Patterns of fine-scale woody vegetation structure in communal savannah rangelands. Environ. Conserv. 2012, 39, 72–82. [Google Scholar] [CrossRef]
- Kaschula, S.A.; Twine, W.E.; Scholes, M.C. Coppice harvesting of fuelwood species on a South African common: Utilizing scientific and indigenous knowledge in Community Based Natural Resource Management. Hum. Ecol. 2005, 33, 387–418. [Google Scholar] [CrossRef]
- Lenfers, U.A.; Weyl, J.; Clemen, T. Firewood Collection in South Africa: Adaptive Behavior in Social-Ecological Models. Land 2018, 7, 97. [Google Scholar] [CrossRef]
- Madubansi, M.; Shackleton, C.M. Changes in fuelwood use and selection following electrification in the Bushbuckridge lowveld, South Africa. J. Environ. Manag. 2007, 83, 416–426. [Google Scholar] [CrossRef] [PubMed]
- Mograbi, P.J.; Witkowski, E.T.; Erasmus, B.F.; Asner, G.P.; Fisher, J.T.; Mathieu, R.; Wessels, K.J. Fuelwood extraction intensity drives compensatory regrowth in African savanna communal lands. Land Degrad. Dev. 2019, 30, 190–201. [Google Scholar] [CrossRef]
- Nickless, A.; Scholes, R.J.; Archibald, S. A method for calculating the variance and confidence intervals for tree biomass estimates obtained from allometric equations. S. Afr. J. Sci. 2011, 107, 1–10. [Google Scholar] [CrossRef]
- Odipo, V.; Nickless, A.; Berger, C.; Baade, J.; Urbazaev, M.; Walther, C.; Schmullius, C. Assessment of Aboveground Woody Biomass Dynamics Using Terrestrial Laser Scanner and L-Band ALOS PALSAR Data in South African Savanna. Forests 2016, 7, 294. [Google Scholar] [CrossRef]
- Scholes, R.J.; Gureja, N.; Giannecchinni, M.; Dovie, D.; Wilson, B.; Davidson, N.; Piggott, K.; McLoughlin, C.; Van der Velde, K.; Freeman, A.; et al. The environment and vegetation of the flux measurement site near Skukuza, Kruger National Park. Koedoe 2001, 44, 73–84. [Google Scholar] [CrossRef]
- Statistics South Africa. South African Community Survey 2016. Available online: https://www.statssa.gov.za (accessed on 30 March 2022).
- Banks, D.I.; Griffin, N.J.; Shackleton, C.M.; Shackleton, S.E.; Mavrandonis, J.M. Wood supply and demand around two rural settlements in a semi-arid Savanna, South Africa. Biomass Bioenergy 1996, 11, 319–331. [Google Scholar] [CrossRef]
- Emanuel, P.L.; Shackleton, C.M.; Baxter, J.S. Modelling the sustainable harvest of Sclerocarya birrea subsp. caffra fruits in the South African lowveld. For. Ecol. Manag. 2005, 214, 91–103. [Google Scholar] [CrossRef]
- Munalula, F.; Meincken, M. An evaluation of South African fuelwood with regards to calorific value and environmental impact. Biomass Bioenergy 2009, 33, 415–420. [Google Scholar] [CrossRef]
- Scheiter, S.; Schulte, J.; Pfeiffer, M.; Martens, C.; Erasmus, B.F.; Twine, W.C. How Does Climate Change Influence the Economic Value of Ecosystem Services in Savanna Rangelands? Ecol. Econ. 2019, 157, 342–356. [Google Scholar] [CrossRef]
- Twine, W.C.; Holdo, R.M. Fuelwood sustainability revisited: Integrating size structure and resprouting into a spatially realistic fuelshed model. J. Appl. Ecol. 2016, 53, 1766–1776. [Google Scholar] [CrossRef]
- Wessels, K.J.; Colgan, M.S.; Erasmus, B.F.; Asner, G.P.; Twine, W.C.; Mathieu, R.; Van Aardt, J.A.; Fisher, J.T.; Smit, I.P. Unsustainable fuelwood extraction from South African savannas. Environ. Res. Lett. 2013, 8, 014007. [Google Scholar] [CrossRef]
- Baxter, P.W.J. Modeling the Impact of the African Elephant, Loxodonta africana, on Woody Vegetation in Semi-Arid Savannas. Ph.D. Thesis, University of California, Berkeley, CA, USA, 2003. [Google Scholar]
- Bonan, G.; Levis, S.; Sitch, S. A dynamic global vegetation model for use with climate models: Concepts and description of simulated vegetation dynamics. Glob. Chang. Biol. 2003, 9, 1543–1566. [Google Scholar] [CrossRef]
- Jeltsch, F.; Milton, S.J.; Dean, W.R.; Van Rooyen, N.; Moloney, K.A. Modelling the impact of small-scale heterogeneities on tree-grass coexistence in semi-arid savannas. J. Ecol. 1998, 86, 780–793. [Google Scholar] [CrossRef]
- Liedloff, A.C.; Cook, G.D. Modelling the effects of rainfall variability and fire on tree populations in an Australian tropical savanna with the Flames simulation model. Ecol. Model. 2007, 201, 269–282. [Google Scholar] [CrossRef]
- Moncrieff, G.R.; Scheiter, S.; Slingsby, J.A.; Higgins, S.I. Understanding global change impacts on South African biomes using Dynamic Vegetation Models. S. Afr. J. Bot. 2015, 101, 16–23. [Google Scholar] [CrossRef]
- Scholtz, R.; Kiker, G.A.; Smit, I.P.; Venter, F.J. Identifying drivers that influence the spatial distribution of woody vegetation in Kruger National Park, South Africa. Ecosphere 2014, 5, 71. [Google Scholar] [CrossRef]
- Mograbi, P.; Erasmus, B.; Witkowski, E.; Asner, G.; Wessels, K.; Mathieu, R.; Knapp, D.; Martin, R.; Main, R. Biomass increases go under cover: Woody vegetation dynamics in a communally utilized semi-arid savanna in Bushbuckridge, South Africa. S. Afr. J. Bot. 2015, 98, 191–192. [Google Scholar] [CrossRef]
- Gaylard, A. Adopting a Heterogeneity Paradigm for Understanding and Managing Elephants for Biodiversity: A Case Study in Riparian Woodlands in Kruger National Park. Ph.D. Thesis, University of the Witwatersrand, Johannesburg, South Africa, 2015. [Google Scholar]
- Clemen, T.; Lenfers, U.A.; Dybulla, J.; Ferreira, S.M.; Kiker, G.A.; Martens, C.; Scheiter, S. A cross-scale modeling framework for decision support on elephant management in Kruger National Park, South Africa. Ecol. Inform. 2021, 62, 101266. [Google Scholar] [CrossRef]
- Smit, I.P.J.; Asner, G.P.; Govender, N.; Vaughn, N.R.; van Wilgen, B.W. An examination of the potential efficacy of high-intensity fires for reversing woody encroachment in savannas. J. Appl. Ecol. 2016, 53, 1623–1633. [Google Scholar] [CrossRef]
- Bond, W.J.; Midgley, G.F.; Woodward, F.I. What controls South African vegetation—Climate or fire? S. Afr. J. Bot. 2003, 69, 79–91. [Google Scholar] [CrossRef]
- Trollope, W.; Trollope, L.; Biggs, H.; Pienaar, D.; Potgieter, A. Long-term changes in the woody vegetation of the Kruger National Park, with special reference to the effects of elephants and fire. Koedoe 1998, 41, 103–112. [Google Scholar] [CrossRef]
- SANparks. Kruger National Park, Kruger Management Plan, for the Period 2018–2028. 2018. Available online: https://www.sanparks.org/assets/docs/conservation/park_man/knp/knp-approved-plan.pdf (accessed on 19 April 2022).
- Engelbrecht, F.; Adegoke, J.; Bopape, M.J.; Naidoo, M.; Garland, R.; Thatcher, M.; McGregor, J.; Katzfey, J.; Werner, M.; Ichoku, C.; et al. Projections of rapidly rising surface temperatures over Africa under low mitigation. Environ. Res. Lett. 2015, 10. [Google Scholar] [CrossRef]
- Grimm, V.; Berger, U.; Bastiansen, F.; Eliassen, S.; Ginot, V.; Giske, J.; Goss-Custard, J.; Grand, T.; Heinz, S.K.; Huse, G.; et al. A standard protocol for describing individual-based and agent-based models. Ecol. Model. 2006, 198, 115–126. [Google Scholar] [CrossRef]
- Grimm, V.; Berger, U.; DeAngelis, D.L.; Polhill, J.G.; Giske, J.; Railsback, S.F. The ODD protocol: A review and first update. Ecol. Model. 2010, 221, 2760–2768. [Google Scholar] [CrossRef]
- Rutherford, M.C.; Mucina, L.; Lötter, C.; Bredenkamp, G.J.; Jacobus, H.L.; Scott-shaw, C.R.; Hoare, D.B.; Goodman, S.; Bezuidenhout, H.; Scott, L.; et al. Savanna Biome. Vegetation of South Africa, Lesotho & Swaziland. arXiv 2006, arXiv:1011.1669v3, 439–539. [Google Scholar]
- Shackleton, C.M.; Griffin, N.J.; Banks, D.I.; Mavrandonis, J.M.; Shackleton, S.E. Community structure and species composition along a disturbance gradient in a communally managed South African savanna. Vegetatio 1994, 115, 157–167. [Google Scholar] [CrossRef]
- Berger, C.; Bieri, M.; Bradshaw, K.; Brümmer, C.; Clemen, T.; Hickler, T.; Kutsch, W.L.; Lenfers, U.A.; Martens, C.; Midgley, G.F.; et al. Linking scales and disciplines: An interdisciplinary cross-scale approach to supporting climate-relevant ecosystem management. Clim. Chang. 2019, 156, 139–150. [Google Scholar] [CrossRef]
- Matsika, R.; Erasmus, B.F.; Twine, W.C. Double jeopardy: The dichotomy of fuelwood use in rural South Africa. Energy Policy 2013, 52, 716–725. [Google Scholar] [CrossRef]
- Mograbi, P.; Asner, G.; Witkowski, E.; Erasmus, B.; Wessels, K.; Mathieu, R.; Vaughn, N. Humans and elephants as treefall drivers in African savannas. Ecography 2016, 40, 1–11. [Google Scholar] [CrossRef]
- Twine, W.C. Personal Comment, 2019. Made during EMSAfrica Stakeholder Meeting at Wits Rural Facility on 8 March 2019.
- Kelly, R.A.; Jakeman, A.J.; Barreteau, O.; Borsuk, M.E.; ElSawah, S.; Hamilton, S.H.; Henriksen, H.J.; Kuikka, S.; Maier, H.R.; Rizzoli, A.E.; et al. Selecting among five common modelling approaches for integrated environmental assessment and management. Environ. Model. Softw. 2013, 47, 159–181. [Google Scholar] [CrossRef]
- Bonabeau, E. Agent-based modeling: Methods and techniques for simulating human systems. Proc. Natl. Acad. Sci. USA 2002, 99, 7280–7287. [Google Scholar] [CrossRef]
- Glake, D.; Weyl, J.; Dohmen, C.; Hüning, C.; Clemen, T. Modeling through model transformation with MARS 2.0. In Proceedings of the ADS’17: Proceedings of the Agent-Directed Simulation Symposium, Virginia Beach, VA, USA, 23–26 April 2017; Volume 49, pp. 13–24. [CrossRef]
- Hüning, C.; Dalski, J.; Adebahr, M.; Lenfers, U.; Thiel-Clemen, T.; Grundmann, L. Modeling & simulation as a service with the massive multi-agent system MARS. Simulation Series. In Proceedings of the Society for Computer Simulation International (ADS ’16), Pasadena, CA, USA, 3–6 April 2016; Volume 48, pp. 1–8. [Google Scholar] [CrossRef]
- Weyl, J.; Glake, D.; Clemen, T. Agent-based Traffic Simulation at City Scale with MARS. In Proceedings of the 2018 Spring Simulation Multiconference, Baltimore, MD, USA, 15–18 April 2018; p. 9. [Google Scholar]
- Charles-Dominique, T.; Midgley, G.F.; Tomlinson, K.W.; Bond, W.J. Steal the light: Shade vs fire adapted vegetation in forest–savanna mosaics. New Phytol. 2018, 218, 1419–1429. [Google Scholar] [CrossRef]
- Stevens, N.; Lehmann, C.E.R.; Murphy, B.P.; Durigan, G. Savanna woody encroachment is widespread across three continents. Glob. Chang. Biol. 2017, 23, 235–244. [Google Scholar] [CrossRef]
- Wigley, B.J.; Slingsby, J.A.; Díaz, S.; Bond, W.J.; Fritz, H.; Coetsee, C. Leaf traits of African woody savanna species across climate and soil fertility gradients: Evidence for conservative versus acquisitive resource-use strategies. J. Ecol. 2016, 104, 1357–1369. [Google Scholar] [CrossRef]
- Wright, I.J.; Westoby, M.; Reich, P.B.; Oleksyn, J.; Ackerly, D.D.; Baruch, Z.; Bongers, F.; Cavender-Bares, J.; Chapin, T.; Cornellissen, J.H.C.; et al. The worldwide leaf economics spectrum. Nature 2004, 428, 821–827. [Google Scholar] [CrossRef]
- Wright, I.J.; Reich, P.B.; Cornelissen, J.H.C.; Falster, D.S.; Groom, P.K.; Hikosaka, K.; Lee, W.; Lusk, C.H.; Niinemets, Ü.; Oleksyn, J.; et al. Modulation of leaf economic traits and trait relationships by climate. Glob. Ecol. Biogeogr. 2005, 14, 411–421. [Google Scholar] [CrossRef]
- Jacobs, O.S.; Biggs, R. The impact of the African elephant on marula trees in the Kruger National Park. S. Afr. J. Wildl. Res. 2002, 32, 13–22. [Google Scholar]
- Cook, R.M.; Witkowski, E.T.; Helm, C.V.; Henley, M.D.; Parrini, F. Recent exposure to African elephants after a century of exclusion: Rapid accumulation of marula tree impact and mortality, and poor regeneration. For. Ecol. Manag. 2017, 401, 107–116. [Google Scholar] [CrossRef]
- Moncrieff, G.R.; Kruger, L.M.; Midgley, J.J. Stem mortality of Acacia nigrescens induced by the synergistic effects of elephants and fire in Kruger National Park, South Africa. J. Trop. Ecol. 2008, 24, 655–662. [Google Scholar] [CrossRef]
- Shannon, G.; Druce, D.J.; Page, B.R.; Eckhardt, H.C.; Grant, R.; Slotow, R. The utilization of large savanna trees by elephant in southern Kruger National Park. J. Trop. Ecol. 2008, 24, 281–289. [Google Scholar] [CrossRef]
- Case, M.F.; Wigley-Coetsee, C.; Nzima, N.; Scogings, P.F.; Staver, A.C. Severe drought limits trees in a semi-arid savanna. Ecology 2019, 100, e02842. [Google Scholar] [CrossRef] [PubMed]
- Shackleton, C.M. Annual production of harvestable deadwood in semi-arid savannas, South Africa. For. Ecol. Manag. 1998, 112, 139–144. [Google Scholar] [CrossRef]
- Fornara, D.A. Ungulate Browsing and Plant Defensive Traits: Modelling Changes in Plant Productivity and Soil Nutrient Availability in Savanna. Ph.D. Thesis, University of Pretoria, Pretoria, South Africa, 2005. [Google Scholar]
- Allen, C.D.; Macalady, A.K.; Chenchouni, H.; Bachelet, D.; McDowell, N.; Vennetier, M.; Kitzberger, T.; Rigling, A.; Breshears, D.D.; Hogg, E.H.; et al. A global overview of drought and heat-induced tree mortality reveals emerging climate change risks for forests. For. Ecol. Manag. 2010, 259, 660–684. [Google Scholar] [CrossRef]
- Baxter, P.W.; Getz, W.M. Development and parameterization of a rain- and fire-driven model for exploring elephant effects in African savannas. Environ. Model. Assess. 2008, 13, 221–242. [Google Scholar] [CrossRef]
- Campbell, B.M. The Miombo in Transition: Woodlands and Welfare in Africa; Center for International Forestry Research (CIFOR): Bogor, Indonesia, 1996; p. 273. [Google Scholar] [CrossRef]
- Dube, P.; Musara, C.; Chitamba, J. Extinction Threat to Tree Species from Firewood Use in the Wake of Electric Power Cuts: A Case Study of Bulawayo, Zimbabwe. Resour. Environ. 2014, 4, 260–267. [Google Scholar] [CrossRef]
- Holdo, R. Tree growth in an African woodland savanna affected by disturbance. J. Veg. Sci. 2006, 17, 369–378. [Google Scholar] [CrossRef]
- Shackleton, C.M.; Scholes, R.J. Above ground woody community attributes, biomass and carbon stocks along a rainfall gradient in the savannas of the central lowveld, South Africa. S. Afr. J. Bot. 2011, 77, 184–192. [Google Scholar] [CrossRef]
- Archer, E.; Engelbrecht, F.; Haensler, A.; Landman, W.; Tadross, M.; Helmschrot, J. Seasonal prediction and regional climate projections for southern Africa. In Climate Change and Adaptive Land Management in Southern Africa—Assessments, Changes, Challenges, and Solutions; Revermann, R., Krewenka, K., Schmiedel, U., Olwoch, J., Helmschrot, J., Juergens, N., Eds.; Klaus Hess Publishers: Goettingen, Germany; Windhoek, Namibia, 2018; Volume 6, pp. 14–21. [Google Scholar] [CrossRef]
- Meinshausen, M.; Smith, S.J.; Calvin, K.; Daniel, J.S.; Kainuma, M.L.; Lamarque, J.; Matsumoto, K.; Montzka, S.A.; Raper, S.C.; Riahi, K.; et al. The RCP greenhouse gas concentrations and their extensions from 1765 to 2300. Clim. Chang. 2011, 109, 213–241. [Google Scholar] [CrossRef]
- Possell, M.; Nicholas Hewitt, C. Gas exchange and photosynthetic performance of the tropical tree Acacia nigrescens when grown in different CO2 concentrations. Planta 2009, 229, 837–846. [Google Scholar] [CrossRef] [PubMed]
- Díaz, S.; Purvis, A.; Cornelissen, J.H.C.; Mace, G.M.; Donoghue, M.J.; Ewers, R.M.; Jordano, P.; Pearse, W.D. Functional traits, the phylogeny of function, and ecosystem service vulnerability. Ecol. Evol. 2013, 3, 2958–2975. [Google Scholar] [CrossRef] [PubMed]
- Stevens, N.; Erasmus, B.F.N.; Archibald, S.; Bond, W.J. Woody encroachment over 70 years in South African savannahs: Overgrazing, global change or extinction aftershock? Philos. Trans. R. Soc. B Biol. Sci. 2016, 371, 20150437. [Google Scholar] [CrossRef]
- Scholes, R.J.; Walker, B.H. An African Savanna: Synthesis of the Nylsvley Study; Cambridge University Press: Cambridge, UK, 1993. [Google Scholar] [CrossRef]
- Cook, G.D.; Liedloff, A.C.; Eager, R.W.; Chen, X.; Williams, R.J.; O’Grady, A.P.; Hutley, L.B. The estimation of carbon budgets of frequently burnt tree stands in savannas of northern Australia, using allometric analysis and isotopic discrimination. Aust. J. Bot. 2005, 53, 621–630. [Google Scholar] [CrossRef]
- Gillson, L. Evidence of a tipping point in a southern African savanna? Ecol. Complex. 2015, 21, 78–86. [Google Scholar] [CrossRef]


| Acacia nigrescens | |
|---|---|
| Seedling | <1 cm stem diameter, frost-tolerant |
| Juvenile | <8 cm stem diameter |
| Growth rate juvenile | StemDiameter = StemDiameter + ( StemDiameter DaysWithLeaves |
| First-time seed production | After 12 years |
| Adult | >8 cm stem diameter |
| Max stem diameter | 20 cm |
| Combretum apiculatum | |
| Seedling | <1 cm stem diameter, frost-sensitive |
| Juvenile | 1–10 cm stem diameter |
| Growth rate juvenile | StemDiameter = StemDiameter + ( StemDiameter DaysWithLeaves |
| First-time seed production | After 10 years |
| Adult | >10 cm stem diameter |
| Max stem diameter | 20 cm |
| Sclerocarya birrea | |
| Seedling | <1 cm stem diameter, frost-sensitive |
| Juvenile | <20 cm stem diameter |
| Growth rate juvenile | StemDiameter = StemDiameter + ( StemDiameter DaysWithLeaves |
| First-time seed production | After 18 years |
| Adult | ≥ cm stem diameter |
| Max stem diameter | 50 cm |
| FirewoodCollector | |
|---|---|
| Households | 684 (4100 persons) |
| Firewood demand per Household | 10 kg per day |
| Household members | 6 |
| Hours per collection | 3 |
| Per hour collection time | 5 km distance; 20 km dead wood; 15 kg shoots; 10 kg living wood |
| Demand per collection (kg) | 15–40 |
| Most stem cut | 4–10 cm must cm |
| Weekly collection frequency | 3 |
| Species preferences | C.a > A.n. > S.b. |
| Wood collecting preferences | dead wood > coppicing > cutting branches > cutting down living trees |
| BBR Model | A.n. | C.a. | S.b. | T.t. (98%) | Total | ||||||||
|---|---|---|---|---|---|---|---|---|---|---|---|---|---|
| State | Seedling | Juvenile | Adult | Seedling | Juvenile | Adult | Seedling | Juvenile | Adult | Seedling | Juvenile | Adult | |
| Individuals | 8 | 2 | 0 | 31 | 131 | 3 | 31 | 73 | 7 | 3546 | 638 | 38 | 4508 |
| AGB t/ha | 0 | 0 | 0 | 0 | 10 | ||||||||
| SKU Model | A.n. | C.a. | S.b. | T.t. (33%) | Total | ||||||||
|---|---|---|---|---|---|---|---|---|---|---|---|---|---|
| State | Seedling | Juvenile | Adult | Seedling | Juvenile | Adult | Seedling | Juvenile | Adult | Seedling | Juvenile | Adult | |
| Individuals | 683 | 130 | 7 | 2888 | 550 | 26 | 89 | 17 | 1 | 1817 | 300 | 46 | 6554 |
| AGB t/ha | 0 | 0 | 0 | 0 | 23 | ||||||||
| RCP 4.5 | |
|---|---|
| Seedling mortality | 88–100% |
| Growth rate | Max. growth ratespecies = 100% |
| Drought years BBR (<435 mm) | 2019, 2020, 2025, 2027, 2029, 2031, 2032, 2034, 2042, 2048, 2050 |
| Drought years SKU (<370 mm) | 2020, 2027, 2029, 2031, 2042, 2048, 2050 |
| RCP 8.5 | |
| Seedling mortality | 85–100% |
| Growth rate | Max. growth ratespecies = 130% |
| Drought years BBR (<435 mm) | 2020, 2027, 2029, 2031, 2042, 2048, 2050 |
| Drought years SKU (<370 mm) | 2018, 2020, 2028, 2029, 2038, 2042, 2049 |
Publisher’s Note: MDPI stays neutral with regard to jurisdictional claims in published maps and institutional affiliations. |
© 2022 by the authors. Licensee MDPI, Basel, Switzerland. This article is an open access article distributed under the terms and conditions of the Creative Commons Attribution (CC BY) license (https://creativecommons.org/licenses/by/4.0/).
Share and Cite
Lenfers, U.A.; Ahmady-Moghaddam, N.; Glake, D.; Ocker, F.; Weyl, J.; Clemen, T. Modeling the Future Tree Distribution in a South African Savanna Ecosystem: An Agent-Based Model Approach. Land 2022, 11, 619. https://doi.org/10.3390/land11050619
Lenfers UA, Ahmady-Moghaddam N, Glake D, Ocker F, Weyl J, Clemen T. Modeling the Future Tree Distribution in a South African Savanna Ecosystem: An Agent-Based Model Approach. Land. 2022; 11(5):619. https://doi.org/10.3390/land11050619
Chicago/Turabian StyleLenfers, Ulfia A., Nima Ahmady-Moghaddam, Daniel Glake, Florian Ocker, Julius Weyl, and Thomas Clemen. 2022. "Modeling the Future Tree Distribution in a South African Savanna Ecosystem: An Agent-Based Model Approach" Land 11, no. 5: 619. https://doi.org/10.3390/land11050619
APA StyleLenfers, U. A., Ahmady-Moghaddam, N., Glake, D., Ocker, F., Weyl, J., & Clemen, T. (2022). Modeling the Future Tree Distribution in a South African Savanna Ecosystem: An Agent-Based Model Approach. Land, 11(5), 619. https://doi.org/10.3390/land11050619