Article

Derivation Method of Architectural Asset Value Enhancement Zones in South Korea

1
Department of Architecture, Chungbuk National University, Cheongju 28644, Korea
2
Research Institute, VWL Inc., Seoul 04113, Korea
*
Author to whom correspondence should be addressed.
Land 2022, 11(4), 584; https://doi.org/10.3390/land11040584
Submission received: 6 March 2022 / Revised: 10 April 2022 / Accepted: 14 April 2022 / Published: 16 April 2022

Abstract

:
In June 2014, South Korea enacted a law to systematically preserve and utilize architectural assets to strengthen national competitiveness through the enhancement of architectural culture. An architectural asset value enhancement zone (AAVE) can be designated for an area in which a unique spatial environment has been created, centered on excellent architectural assets or in which architectural assets are densely concentrated. However, five years after the law was promulgated, while 14 local governments had completed basic investigations of architectural assets, only three had been designated as AAVE zones (as of March 2020). This is because the criteria for non-Hanok architectural assets are unclear, making it difficult to specify the scope of designation. This study aims to present and verify a methodology for deriving more effective AAVE zones. After establishing the criteria for architectural asset candidates, densely populated areas across the country were identified using GIS. Subsequently, a methodology was derived to classify candidate areas for the enhancement zone, based on the locations of these densely populated areas and designated/registered cultural heritage sites. The effectiveness of the methodology was reviewed through an actual area analysis, which indicated that the methodology is highly applicable to AAVE zones.

1. Introduction

In June 2014, South Korea enacted laws to systematically manage buildings as assets to promote national architectural culture and strengthen national competitiveness. The enactment of the Act on Value Enhancement of Hanok and Other Architectural Assets (VEHAA) has improved the limitations of existing laws, enabling more diverse buildings to be supported [1]. A Hanok is an architectural structure with a traditional Korean style. Based on the Act on VEHAA, the Hanok is referred to as a wooden structure with columns, beams, and a Korean-style roof (Figure 1) [1]. Because the Hanok took the shape of the eaves projecting out of the outer wall, it has been applied unfavorably to building areas, building lines, administrative procedures, etc., compared to modern buildings (non-Hanok) under the Building Act until now (Figure 1). However, by the Act on VEHAA, the problems associated with Hanok have been dealt with, providing a better legal basis for local government ordinances to support buildings with such various values as architectural assets, including buildings with traditional or regional characteristics that are not legally recognized as Hanok (Figure 1) [2,3]. In particular, the Act is characterized by not limiting architectural assets to individual buildings, but extending the physical scope to include spatial environments and the infrastructure to support them (Law Article 2, Definition) [1].
Areas that have a unique spatial environment centered on excellent building assets or areas where building assets are concentrated, can be designated as architectural asset value enhancement (AAVE) zones and receive legal support. Generally, there is no difficulty in designating areas with clear historical and cultural characteristics, such as the Hanok village, where traditional buildings are concentrated, or the traditional temple preservation area (Figure 1a,b). However, classifying spatial environments unique to a region based on non-Hanok architecture can be difficult, as the legal standards are ambiguous and the value of architectural assets is evaluated qualitatively (Figure 1c–e). Consequently, there are few designated AAVE zones in South Korea, based on the number of policy applications. As of October 2020, among 17 metropolitan governments, 14 had completed (or were in the process of) a basic architectural asset investigation. However, only three governments have designated AAVE zones: Gunsan Wolmyeong-dong, Daegu Hyangchon-dong, and Daejeon Isa-dong. Many local governments are unable to designate an AAVE zone from their basic architectural asset investigation, as there is no objective guidance regarding the range and location of such designations.
Especially, if a non-Hanok architectural asset candidates cluster is reviewed based on the basic survey information, it is highly likely to be an old building cluster area. Therefore, for more efficient AAVE zone selection, a methodology for deriving a region linked to cultural heritage should be applied to consider the site’s social, cultural, and historical characteristics. Cultural assets are recognized for their national importance and are managed by the Act on Cultural Heritage Protection [10], and their value is relatively higher than that of architectural assets managed by the Act on VEHAA. Cultural heritage bears traces of a long history, and in general, the surrounding areas have maintained their historical, social, and cultural contexts to the present day. Therefore, if the area adjacent to cultural heritage is considered for deriving the VEHAA zone, it is highly likely to derive a dense area with a relatively high value of architectural assets.
This study aims to present a methodology for deriving candidate sites for AAVE zones based on geographic information system (GIS), and to verify the methodology’s effectiveness. It is intended to derive AAVE zones with historical and cultural characteristics throughout South Korea, rather than simply extract regions as areas with a high density of architectural assets. The methodology for deriving architectural asset candidates is based on a GIS. First, five criteria for architectural asset candidates were established, and a list was prepared by collecting and categorizing buildings. Next, using a 500 m grid map, the architectural asset candidates and the designated and registered cultural heritage sites were spatialized in a GIS. Then, an area 10 min away from each designated and registered cultural heritage site was created based on the road network. The top 30 areas, with numerous architectural asset candidates, were extracted and presented as candidate areas for AAVE zones. Finally, by examining the extracted candidate areas in detail, we verified the effectiveness of the methodology by comparing the regional characteristics with the previously designated enhancement areas.
In the architectural asset candidate, Hanoks, with clear legal definition standards, were excluded, and based on the standards stipulated by the ministry, private buildings over 30 years old, public buildings over 20 years old, architectural award-winners, modern cultural heritage sites, and non-designated architectural heritage sites were selected. Since the standards for judging the value of candidate areas are different for each local government, centered on non-Hanok buildings, the standards for judging the value of each local government are inevitably different. Whereas the candidate sites derived through the research methodology cannot serve as an absolute standard, they can nevertheless be used as the basis for an objective judgment. It is expected that the cost, time, and labor required for the designation of an area as an AAVE zone can be reduced if the candidate areas are compressed based on the same standards.

2. The Concept of Architectural Asset, AAE, AAVE

2.1. Architectural Asset Enhancement (AAE) Policy

Before the enactment of the VEHAA Act, there were two primary limitations of architectural asset management. First, it was not possible to protect architectural assets that did not meet the legal standards for Hanok architecture. Although the scope of Hanoks is diverse, it is legally limited to buildings with a Korean-style roof, wooden columns, and beams. The number of Hanoks of the same type has increased, whereas buildings not meeting the standards have decreased rapidly. Second, it was difficult to provide legal support for modern cultural heritage sites. In some cases, modern buildings have been protected under the Cultural Heritage Protection Act. However, as with Hanoks, it has been applied only when there has been a need to protect the building because of its cultural value. Particularly, the buildings protected by law have been difficult to use because of strict legal protection. By contrast, most modern cultural heritage sites not protected by law are of relatively poor quality but are used in real life. To overcome these problems and establish a regional and national identity by expanding the scope of support offered to sustainable architectural assets, the Act on VEHAA was implemented.
The law lays the foundation for the enhancement of architectural assets, the registration and support system for excellent architectural assets, the designation and support of AAVE zones, the promotion of Hanoks, the support and nurturing of professional labor and related industries, and the promotion of architectural assets and local architectural culture. The scope of architectural assets has expanded not only for individual buildings, but also for spatial environments and infrastructure. The spatial environment includes the spatial structure of buildings and public spaces, such as streets, parks, plazas, and landscapes. Infrastructure includes railroads, ports, and parking lots, which, by law, can be designated and included in an architectural asset registration or AAVE zone. If registered as an excellent architectural asset, the benefits, such as tax reduction or exemption, management cost support, and building coverage, can be availed. If an AAVE zone is designated through the establishment of a management plan, then special laws and regulations related to building management, infrastructure maintenance, construction costs, and support for councils can be applied.
However, despite the Act’s purpose of promoting architectural assets, the standards for architectural assets are still ambiguous. In the law, architectural assets represent architecture that has social, economic, landscape, historical, and cultural values or contributes to the promotion of the national architectural culture and the formation of local identity. Although a comprehensive concept is defined to consider the locality and diversity of building assets according to local standards, it is necessary to present more specific standards (Law Article 2, Definition) [1].
The target of the architectural asset candidate was based on the five criteria presented as guidelines by the Ministry of Land, Infrastructure and Transport (MLIT). The guidelines provide criteria for the target group of building assets candidates for the survey, and the architectural assets are finally selected by surveying the potential candidates. First, public buildings over 20 years and private buildings over 30 years were presented in the guideline. Second, according to social, cultural, and landscape value standards, the architectural award winners of major competitions can be included in the architectural asset candidates. Last, architectural assets based on local government value standards are presented as a target for investigation. The guidelines recommend including a list of assets that have been investigated and managed by each local government prior to the enactment of the Act on VEHAA. Although it is not specified in the guidelines, modern cultural heritage and non-designated architectural heritage, which were surveyed nationwide in the 2000s, can be included here. In particular, since they are not managed under the Act on Cultural Heritage Protection, they can be included as candidates.
The criteria for the architectural asset candidates are also controversial. However, after many social and expert discussions, the government prepared the criteria. This standard cannot be absolute either, and there is room for additions or changes at any time according to the standards stipulated by laws and regulations.

2.2. Procedures and Limitations of AAE Policy

According to laws and regulations, the central government (Ministry of Land, Infrastructure, and Transport) establishes and implements comprehensive plans every five years to enhance the value of architectural assets, and to measure the basic policy direction (Article 4) [1]. Accordingly, each city and provincial government is obliged to establish and realize an implementation plan every five years, based on the comprehensive plans for the value enhancement of architectural assets (Article 5) [1]. In the process of establishing implementation plans, local governments must put in place an information system that can conduct basic architectural asset investigation within administrative districts, and make public the survey information (Articles 6 and 7) [1]. Based on the architectural asset information, it is possible to designate AAVE zones and establish a management plan (Articles 17–20) [1]. In the case of an excellent architectural asset, its value can be assigned through a basic architectural asset survey.
The Act suggests that the designation of AAVE zones can be made using a unique spatial environment centered on excellent architectural assets through deliberation (Article 17) [1]. As of October 2020, as noted above, only three local governments had designated AAVE zones or established management plans, namely Wolmyeong-dong Gunsan-si, Hyangchon-dong Daegu-si, and Isa-dong Daejeon-si. The Seoul-si plans to designate nine areas as AAVE zones, and these areas are densely populated with Hanok. In the case of Hanok Village, the architectural form and density are relatively clear. Conversely, the designation of AAVE zones is not straightforward when a unique spatial environment is built around excellent architectural assets (non-Hanok). Therefore, not many local governments have designated AAVE zones except for areas with relatively clear traditional characteristics, such as Hanok. This is because the qualitative evaluation criteria in the architectural asset selection process are different. Moreover, even if local governments establish architectural asset standards and identify densely populated areas through surveys, it is difficult to determine the objective scope.
The purposed of the basic investigation of architectural assets being conducted by the individual province is to understand the locality more fully. However, if it is conducted based on different standards for each local government and if an architectural assets information resource is established, there is a possibility that the standards for excellent architectural assets or AAVE zones may be biased or difficult to derive by region. Consequently, it is necessary to first present a common standard for designating a basic investigation target and AAVE zone on a nationwide basis before conducting basic investigations. Once the outlines of architectural assets and AAVE districts are established according to common standards, it is expected that local governments will be able to establish detailed architectural asset promotion policies considering regional characteristics in the next step.

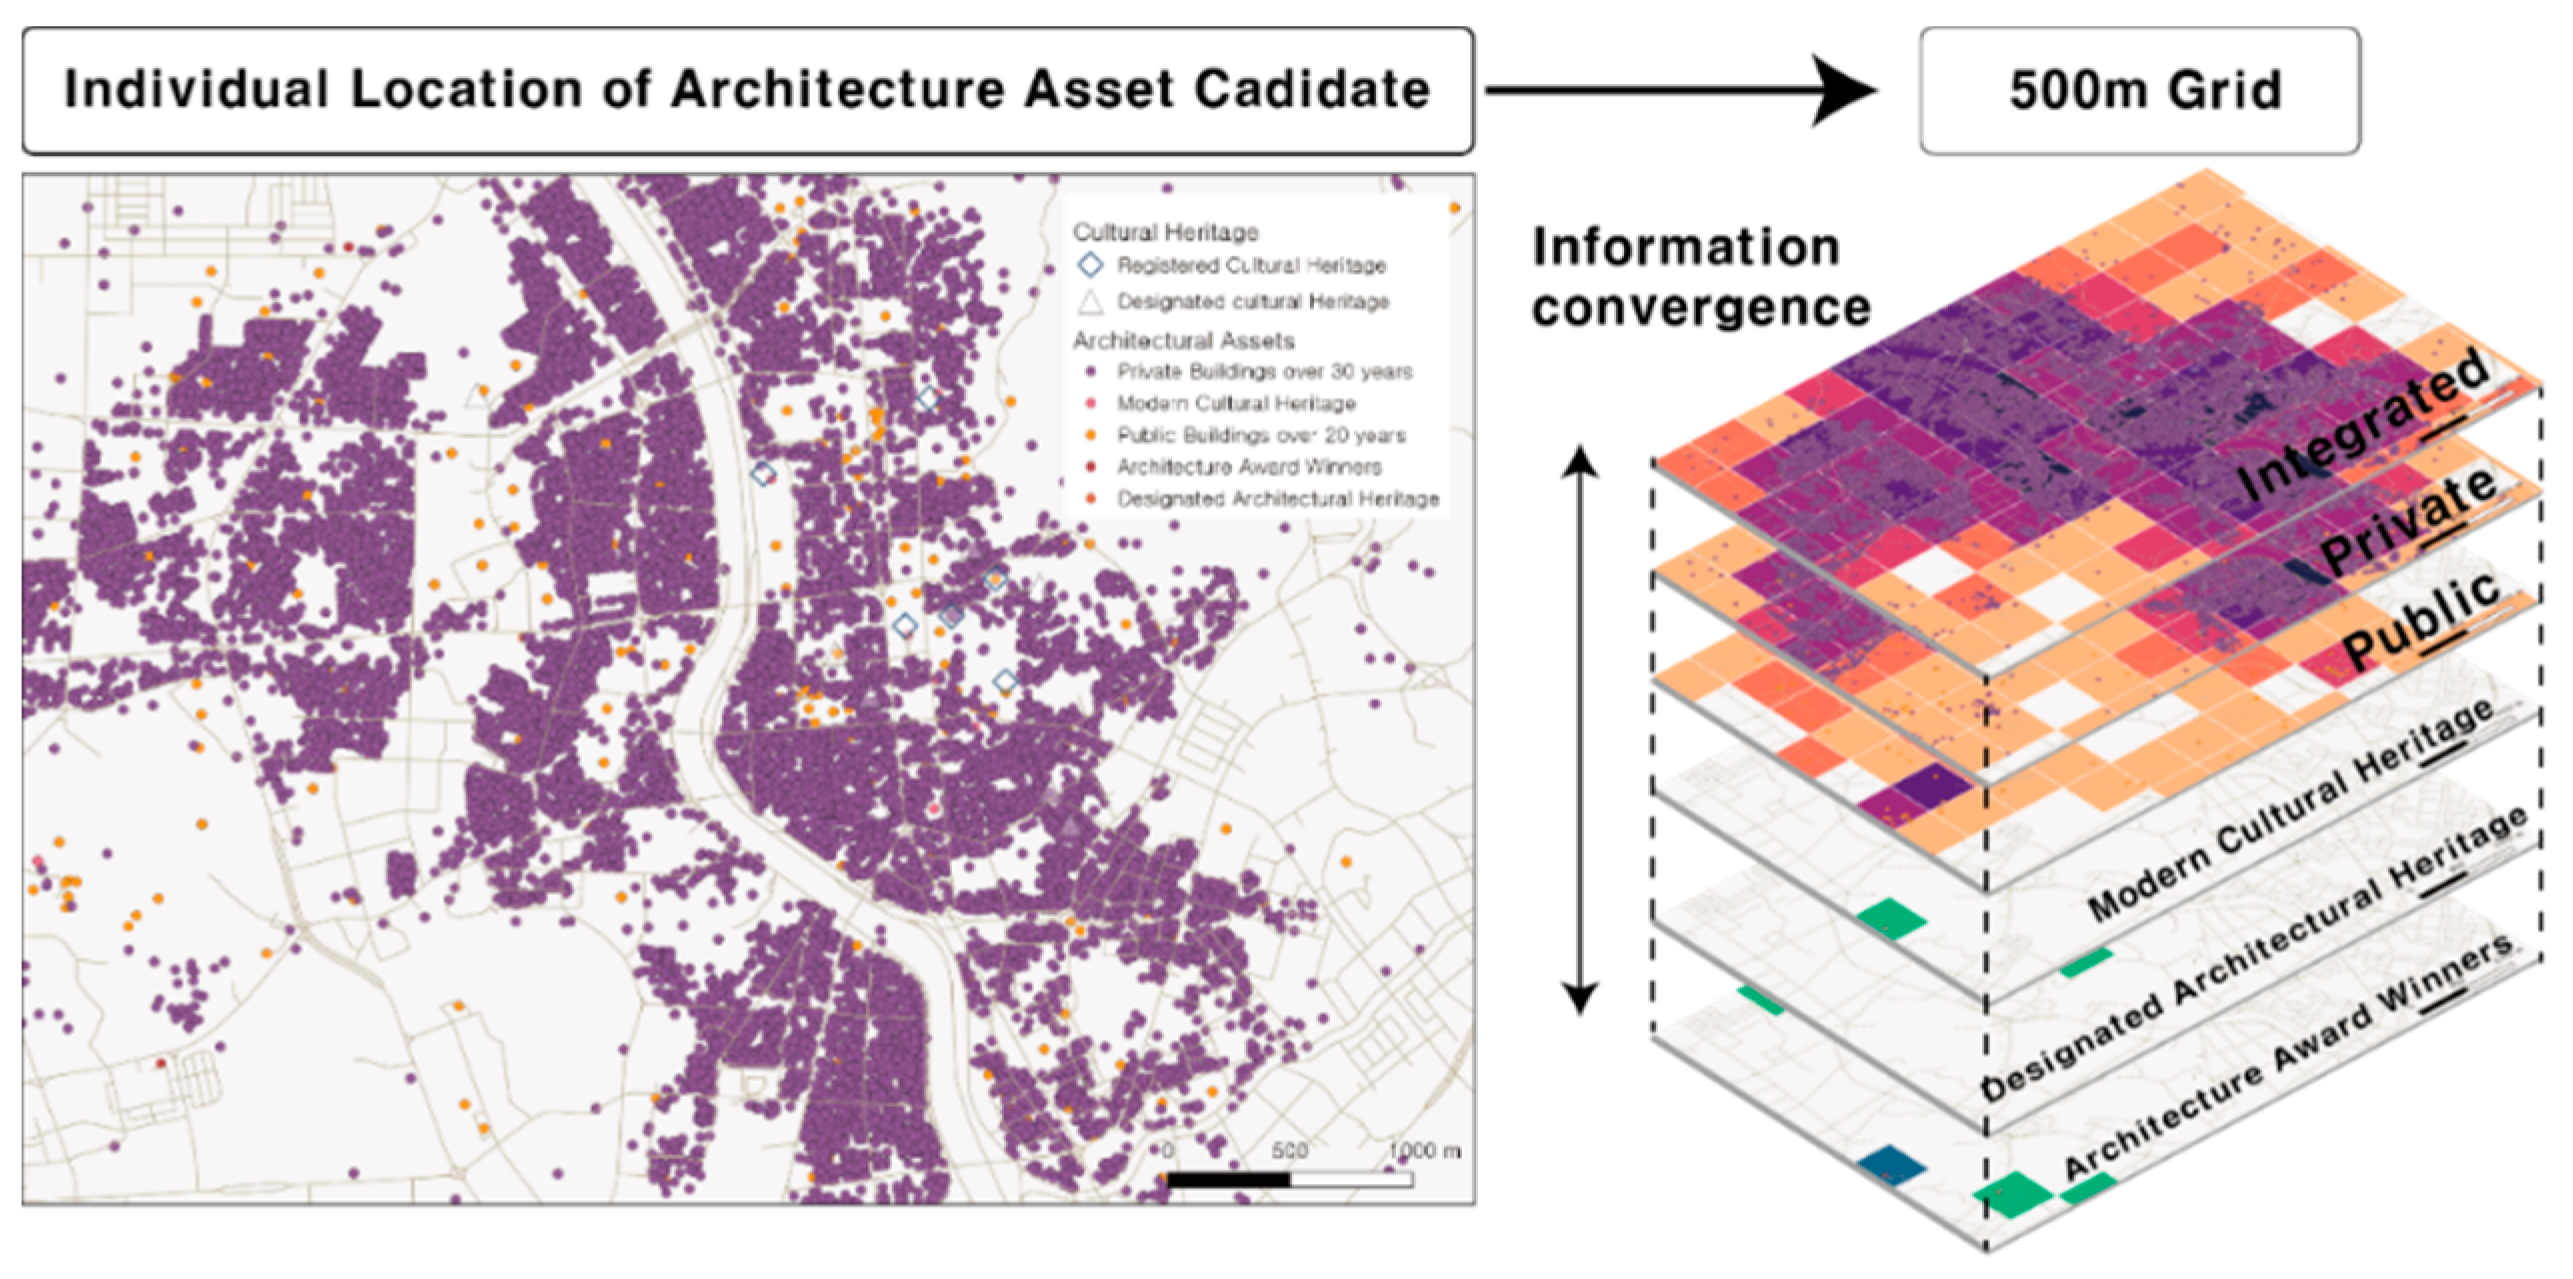
2.3. Spatial Informatization of Architectural Assets Using GIS

The distribution of architectural assets was visually confirmed using the GIS methodology, and the spatial autocorrelation concept was dealt with to extract the AAVE zone linked to cultural heritage and architectural assets [11,12,13,14]. Based on the locational characteristics of the place where the cultural heritage is located, it was used to extract the area adjacent to the architectural asset candidate group [15]. After visualizing the location of the architectural asset candidate group and cultural heritage location on the spatial information (grid map), the area where these two locations are concentrated was identified. In order to reflect more realistically, rather than simply deriving an area with a short straight distance between the two elements’ locations, the range setting and the number of architectural asset candidates were calculated through the road network. It was attempted to extract the ten-minute distance from the cultural heritage point on the road network as an area and to suggest the area with the largest number of architectural asset candidates in this area as a candidate area for the AAVE zone. Although the network analysis methodology covered in this study is simple, it is novel in that it presents a cluster of architectural asset candidates centered on cultural heritage at a national level.
As a national policy, Korea provides data to the public through the Public Data Portal [16] or the National Spatial Information Portal [17]. Using GIS, public data from various fields can be visualized and analyzed. Furthermore, the scope of data use is expanding from real-time information using sensor technology to big data analysis. The scope of application is particularly wide in fields related to geography, climate, disaster, and transportation, ranging from quantitative analysis to the prediction of data using GIS. GIS data related to architecture and urban areas are being utilized in the private and public sectors for, among other aspects, basic planning and design, policy tools, and commercial area analysis. To express geographic information on a national level, there were many instances where visual information was divided into administrative districts. However, depending on the size or shape of the administrative district, there were cases in which the data were distorted or the accuracy was reduced. The EU’s GEOSTAT Project has been using a grid map system of 1 km2 to produce information-integrated spatial statistical data since 2010 [18]. Additionally, Sweden provides various grid map systems ranging from 100 m to 100 km2 for statistical information [19]. Other countries, such as Japan and Australia, have similarly introduced and operated grid map systems. South Korea provided national statistical information by introducing a grid system ranging from 100 m2 to 1 km2 in 2017 [20].
GIS tools, as research methodologies, are being used in various fields from various perspectives. The main GIS methodologies used are related to network analysis, to analyze facility accessibility, area settings based on travel time, optimal routes, location allocations, origins, and destination networks [21]. For the most part, the methodology for deriving the accessible distance and area by allocating a specific time to a network of roads has been applied. In particular, it has been useful for locating weak points in terms of the location, transportation, welfare, and safety of major base facilities. Pearce et al. attempted to measure transportation costs by calculating the distance from a facility [22]. Lotfi et al. conducted a study to extract vulnerable spaces by analyzing the accessibility of nearby facilities in the city [23]. Paez et al. used smart card data to analyze the location distribution of facilities used in the vicinity of stations [24]. Salarvandian et al. extracted a network analysis of pedestrian accessibility to sporting facilities in urban spaces [25]. Anderson (2007) presented network, area, and density analyses to extract hot spots on roads where traffic accidents frequently occurred [26]. VWLAB (2021) is currently working on visualizing public data quantitatively and dynamically by using, e.g., population movement, public bicycle use, and mobile phone location data [27]. An et al. analyzed pedestrian paths and bicycle networks centered on the history of Seoul to create areas based on access times, highlighting areas with weak access [28].

3. Derivation Method of Candidate Areas for AAVE Zones

3.1. Procedures of Derivation Method

The following procedures were followed to extract candidate sites that can be designated as AAVE zones on a national basis. First, data collection based on the establishment of criteria for architectural asset candidates was carried out. Second, the collected data were converted into x- and y-coordinate values, with the nationwide distribution of each architectural asset candidate confirmed through a national map comprising a 500 m2 grid map (Figure 2). Third, the scope was set for deriving the densely populated area of the candidate for architectural assets linked to cultural heritage, the area then being derived. Finally, the top 30 regions were extracted based on the number of architectural assets included in the range.

3.2. Data Collection and Pre-Processing

Data were collected on the five types of buildings mentioned in the criteria for architectural asset candidates (see Section 2.1. Architectural Asset Enhancement (AAE) Policy). First, a list was collected through the Architecture Administration System (SEUMTEO), which manages building ledger information, to extract private buildings that are more than 30 years old (built before October 1989) and public buildings that are more than 20 years old (built before October 1999) [29]. The building ledger contains administrative information, such as building area, the number of floors, and the building’s use. It also provides the address for 2,595,599 private buildings and 85,613 public buildings. Then, a list of 2122 award-winning works was collected from the Architecture and Urban Policy Information Center [30]. Finally, the list of modern cultural heritage sites (3743 cases) and non-designated architectural heritage sites (4043 cases), which were surveyed across the country in the early 2000s based on a concept similar to architectural assets, was obtained through the results of the research project [31,32,33] (Table 1).
In addition to 5 building assets, 3419 cases of cultural heritage address data were collected. Cultural heritage is divided into the designated cultural heritage and registered cultural heritage and these act as a reference point for analysis with architectural asset candidates (Table 1).
The data regarding private and public buildings, over 30 and 20 years old, respectively, were collected as of October 2019. In addition, five architectural asset candidates and cultural heritages were collected through redundancy and building loss reviews. In the case of redundancy reviews, each criterion was reviewed through PNU (19-digit) numbers, unique Korean parcel numbers. Since non-designated architectural heritage, modern cultural heritage, and architectural award-winning sites were candidates that were considered to have some value compared to private and public buildings, overlapping cases were excluded. Moreover, non-designated architectural heritage and modern cultural heritage sites were investigated in the 2000s, and refining work was carried out to exclude buildings that did not exist as of October 2019.
As a result, data of 2,691,320 architectural asset candidates and 3419 cultural heritage sites were collected. In the collected data, the information constructed from the previously used dong (neighborhood) unit address information was converted into a modern street name address system. It was converted into UTM-K coordinate system reference coordinates, together with address information constructed using PNU information.
For the national map, a nationwide electronic map from the geospatial information portal was used. The 500 m2 standard grid system of the National Geographical Information Service was applied. The range of the grid could be set from 100 m2 to 1 km2, but the size of the grid was unified to 500 m2 by checking the architectural asset candidate data and the national map. Using the QGIS tool, a map of South Korea was constructed in units of city, county, and gu (district), based on the converted coordinate information.

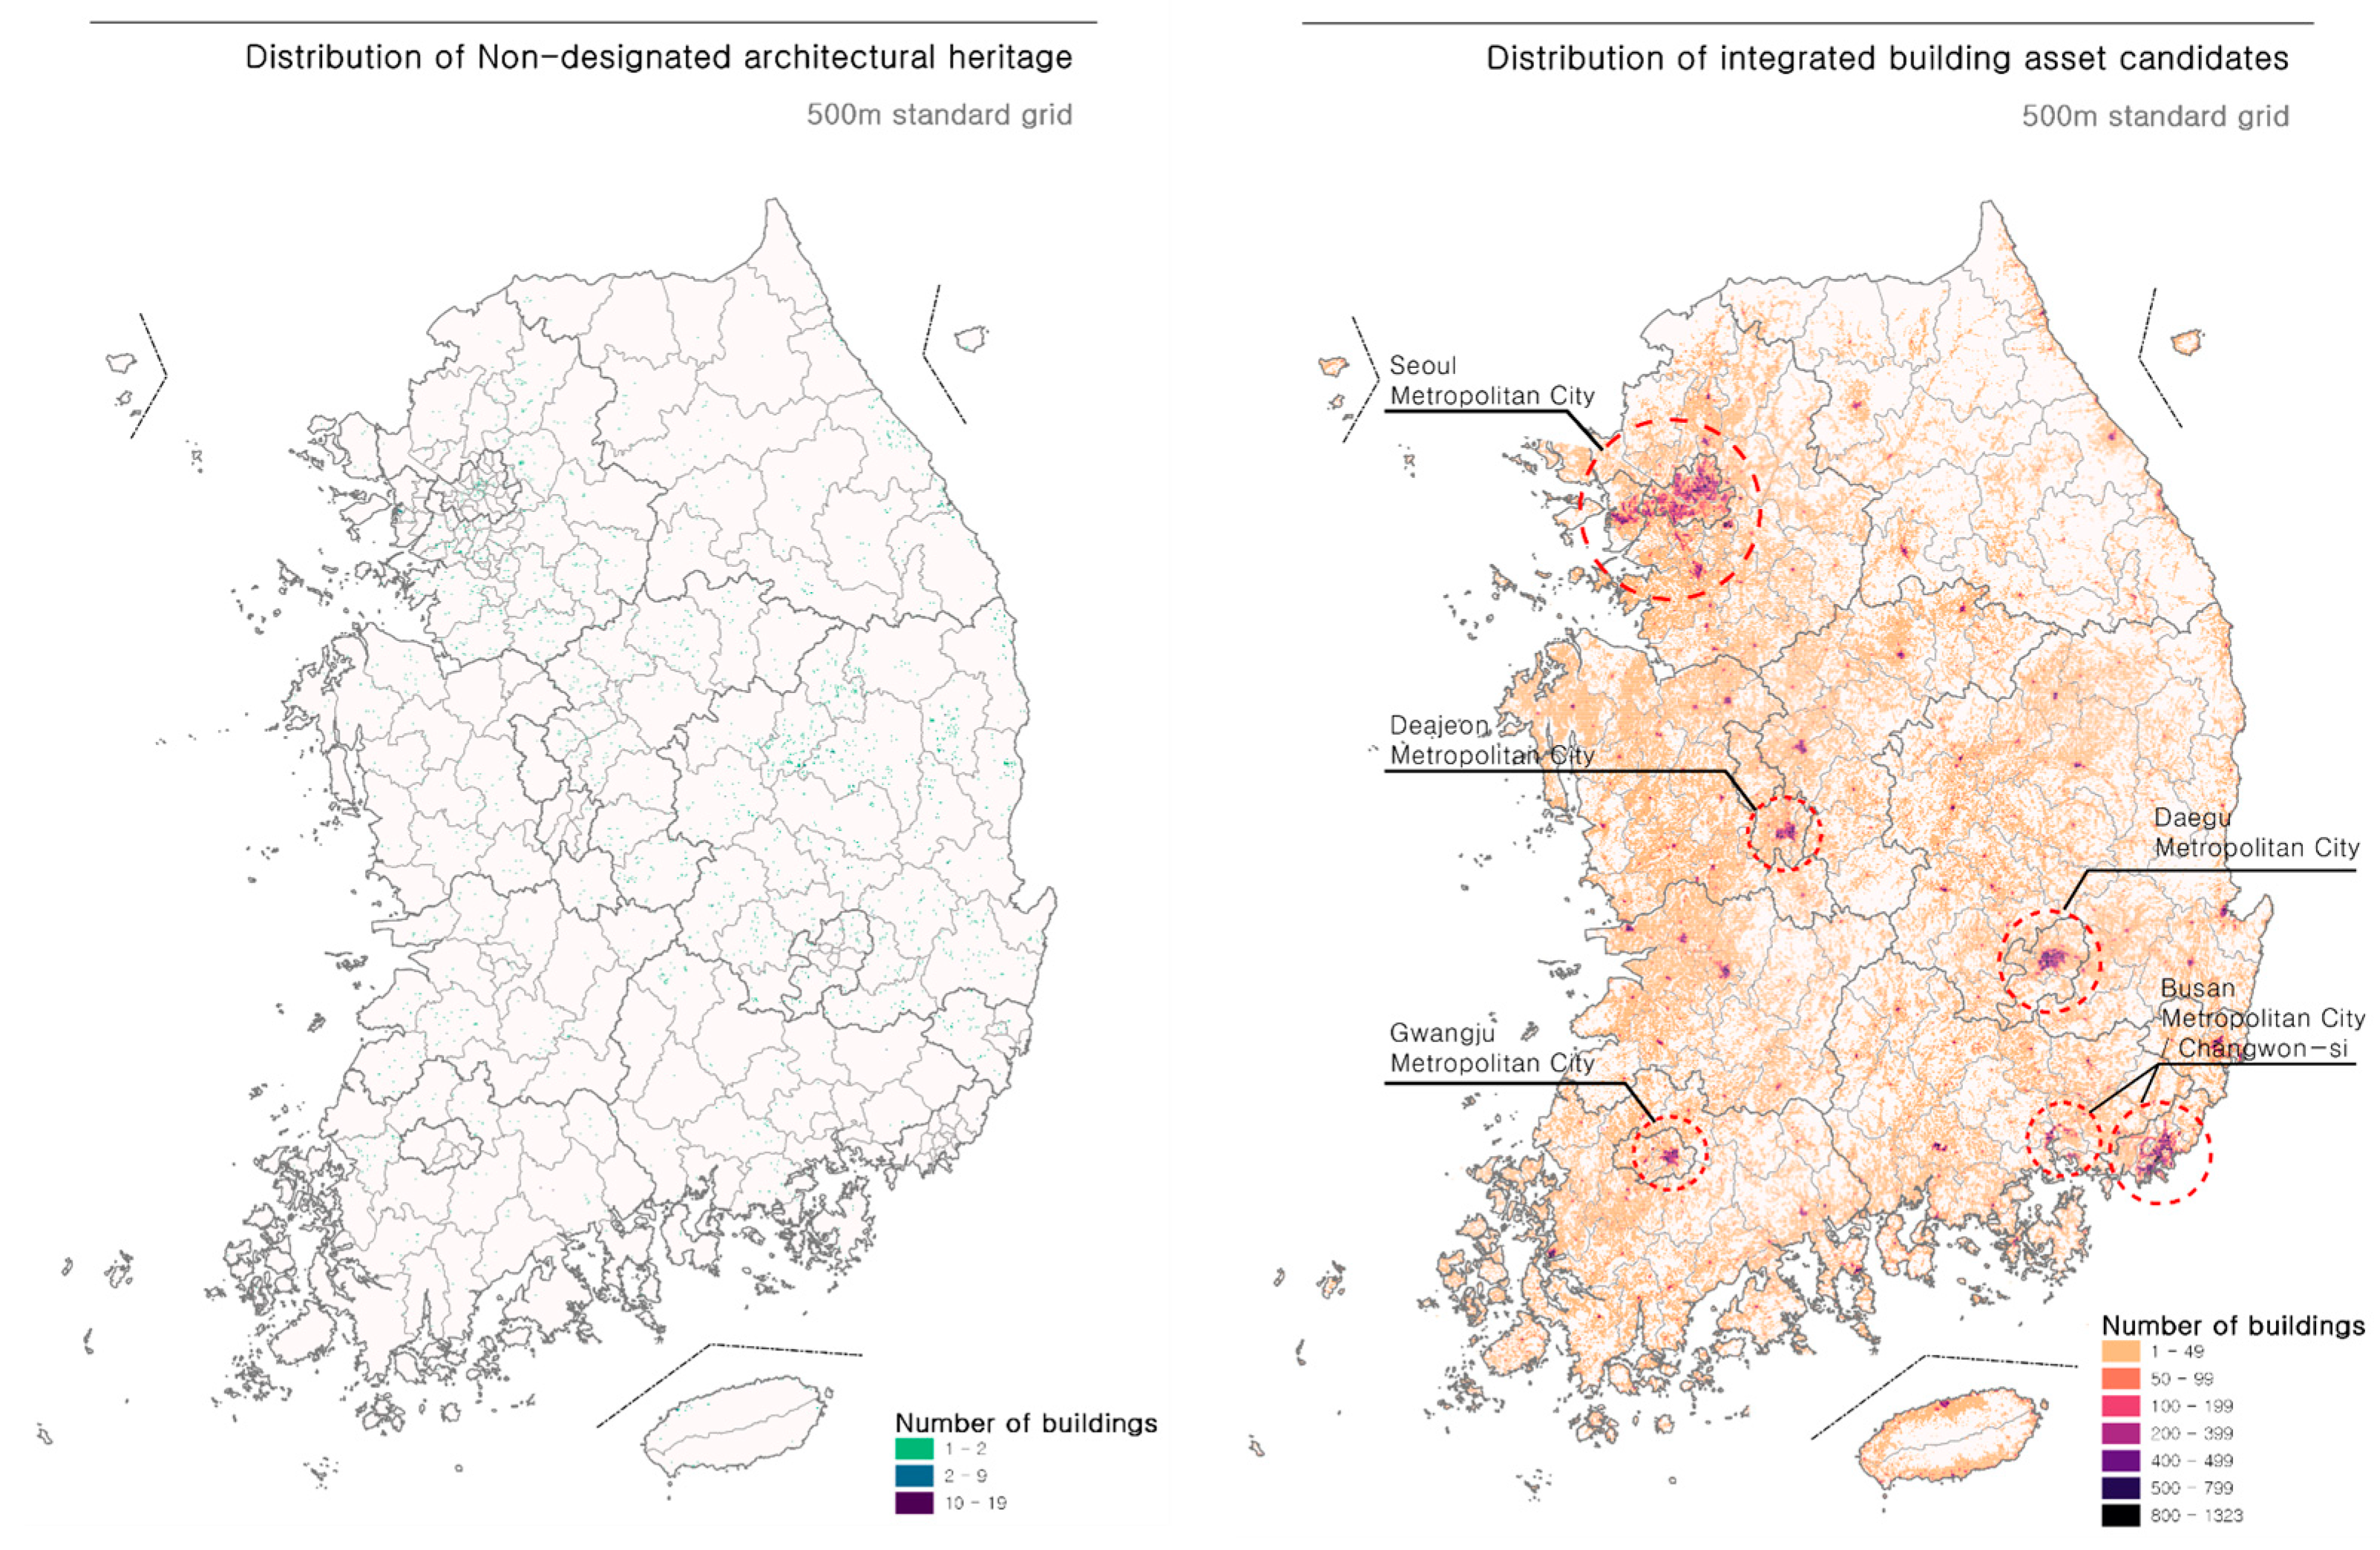
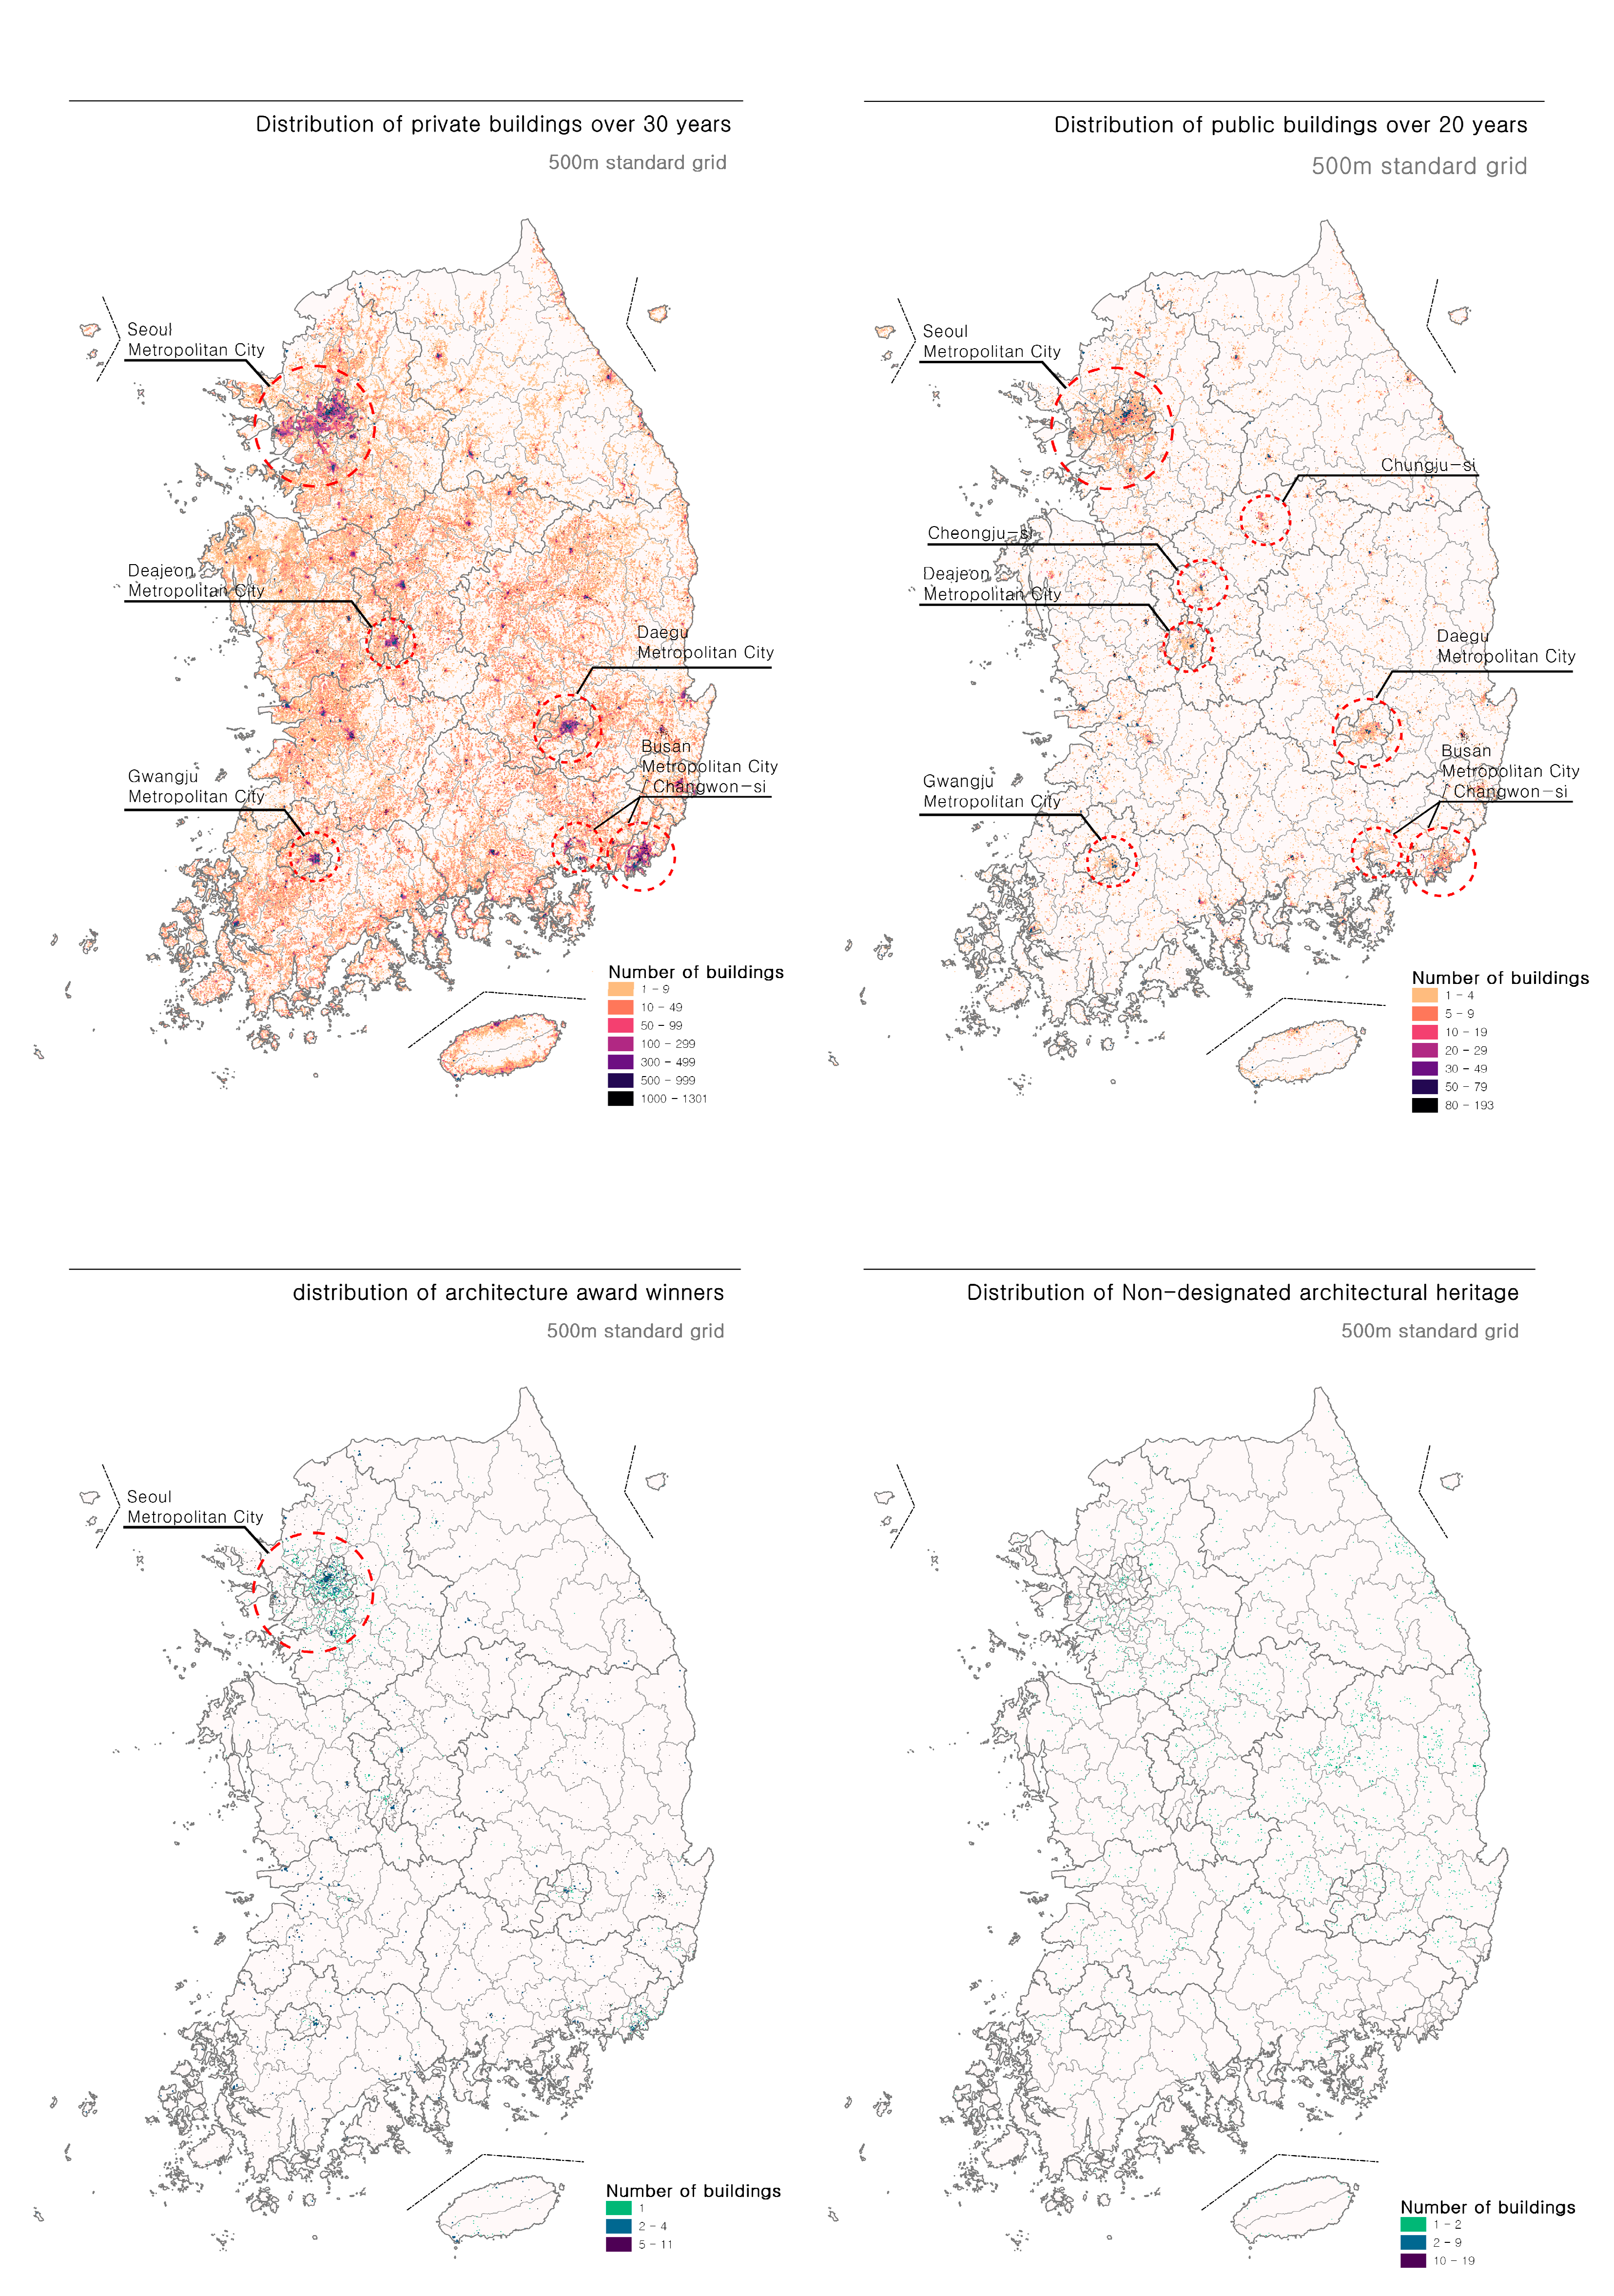
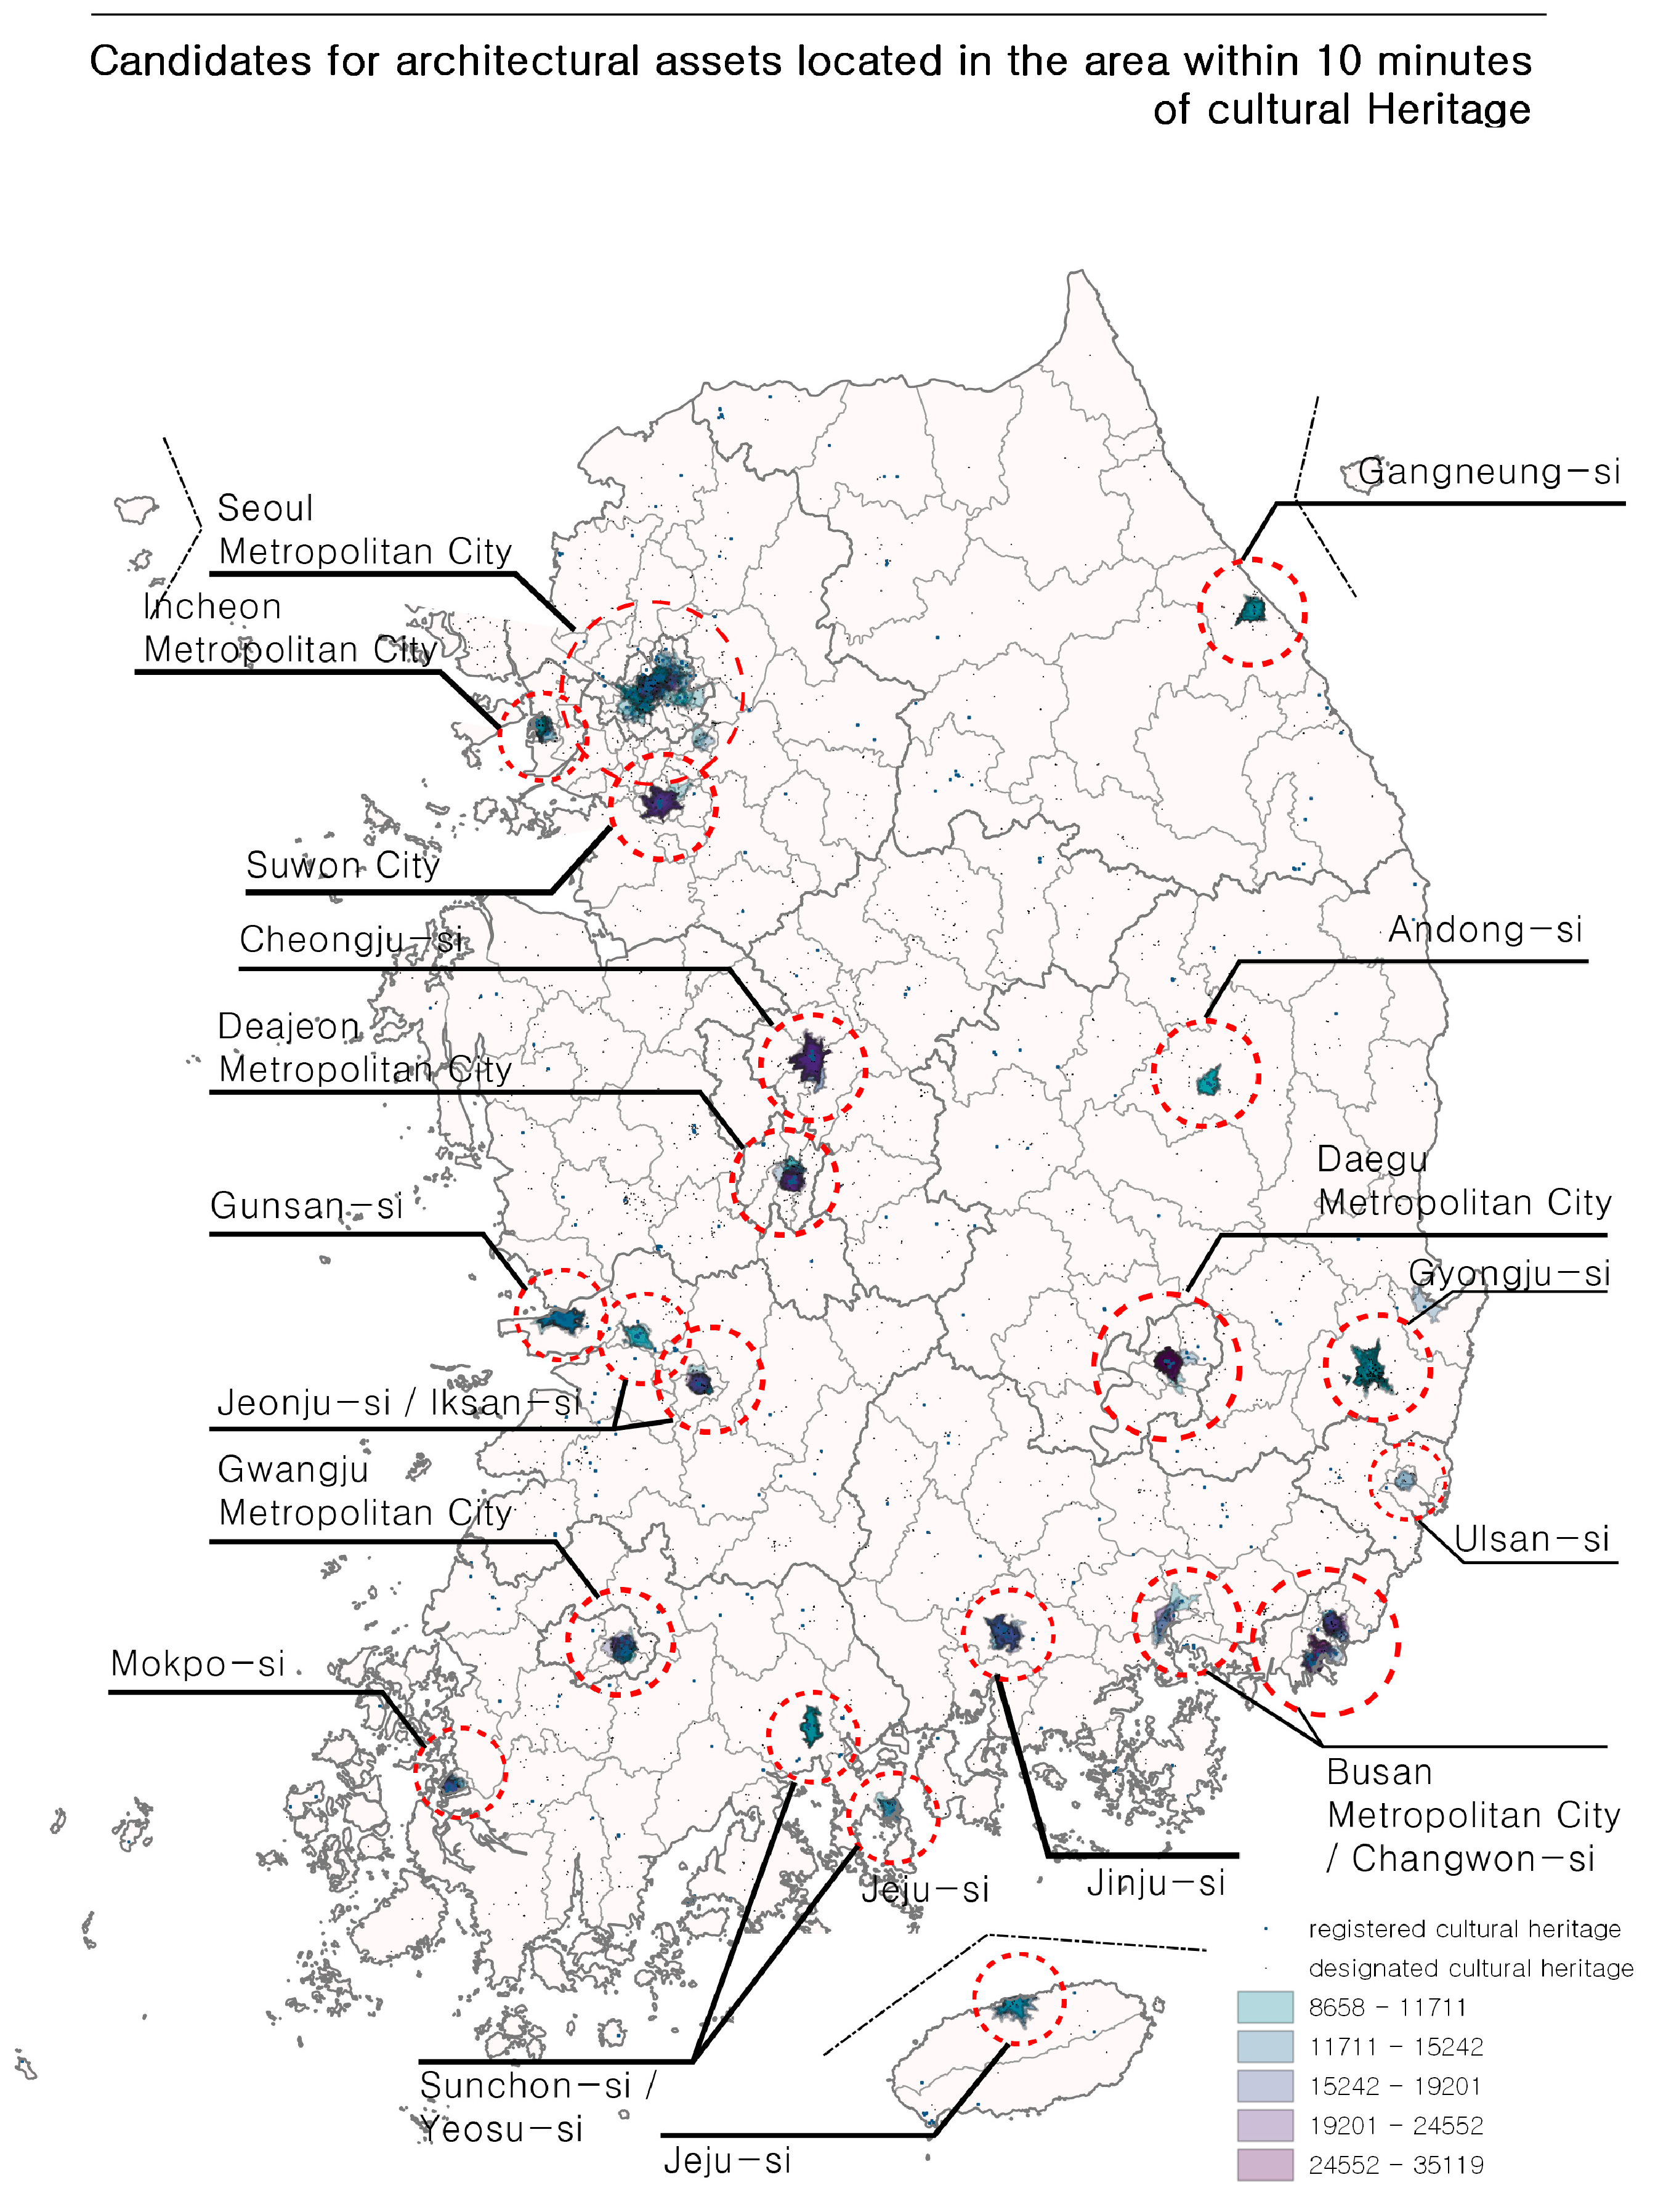
3.3. Distribution of Architectural Asset Candidates

The coordinates of the candidate for architectural assets were distributed on the national map, with the number of coordinates being aggregated within a 500 m2 grid. As a result of understanding the distribution of the aggregated architectural asset candidates using a color scale on the map, the following results were obtained (see Figure 3).
Private buildings over 30 years old were concentrated in major metropolitan cities, including Seoul. Although the number of public buildings over 20 years old was smaller than that of private buildings, they showed a similar trend. This is because there were many buildings in areas with large populations, such as metropolitan cities, with the density being high in the old downtown areas. Similarly, architectural award-winning buildings were concentrated in metropolitan areas, such as Seoul and Gyeonggi-do. It could be inferred that the tendency of buildings that could be recognized for their architectural workmanship was concentrated in the metropolitan areas, proportionate to the size of the population and the economy. Consequently, the distribution of most of the architectural award-winning works targeting new buildings were somewhat different from the distribution of private and public buildings located in the old city center.
The modern cultural heritage and non-designated architectural heritage sites showed somewhat different trends. Modern cultural heritage sites were concentrated in a narrow area in Seoul, Daejeon, Daegu, Ulsan, and Busan, in contrast to non-designated architectural heritage sites, which were widely dispersed throughout the metropolitan area and Gyeongsangbuk-do. Since modern cultural heritage represents buildings constructed in the modern era, its distribution was similar to that of private and public buildings. However, the non-designated architectural heritage sites were distributed throughout the country, and their density was low because the period of construction was long and they were relatively few in number. Nevertheless, it can be confirmed that they were widely distributed throughout Gyeongsangbuk-do.
The distribution map of private buildings over 30 years old was the most similar to the grid map incorporating architectural asset candidates. This is an expected result, considering the number of private buildings over 30 years old numbered over 2.5 million. However, it was difficult to designate AAVE zones based solely on density. If an area with high density was selected by integrating the five criteria, it was highly likely to appear simply as an old building area. If an area of high density was selected based on criteria excluding private or public buildings, it would be difficult to designate the scope as a spatial environment because of the strong characteristics of individual buildings. Therefore, it was necessary to reselect the space by additionally reflecting the cultural heritage criteria for these five architectural asset candidate criteria.

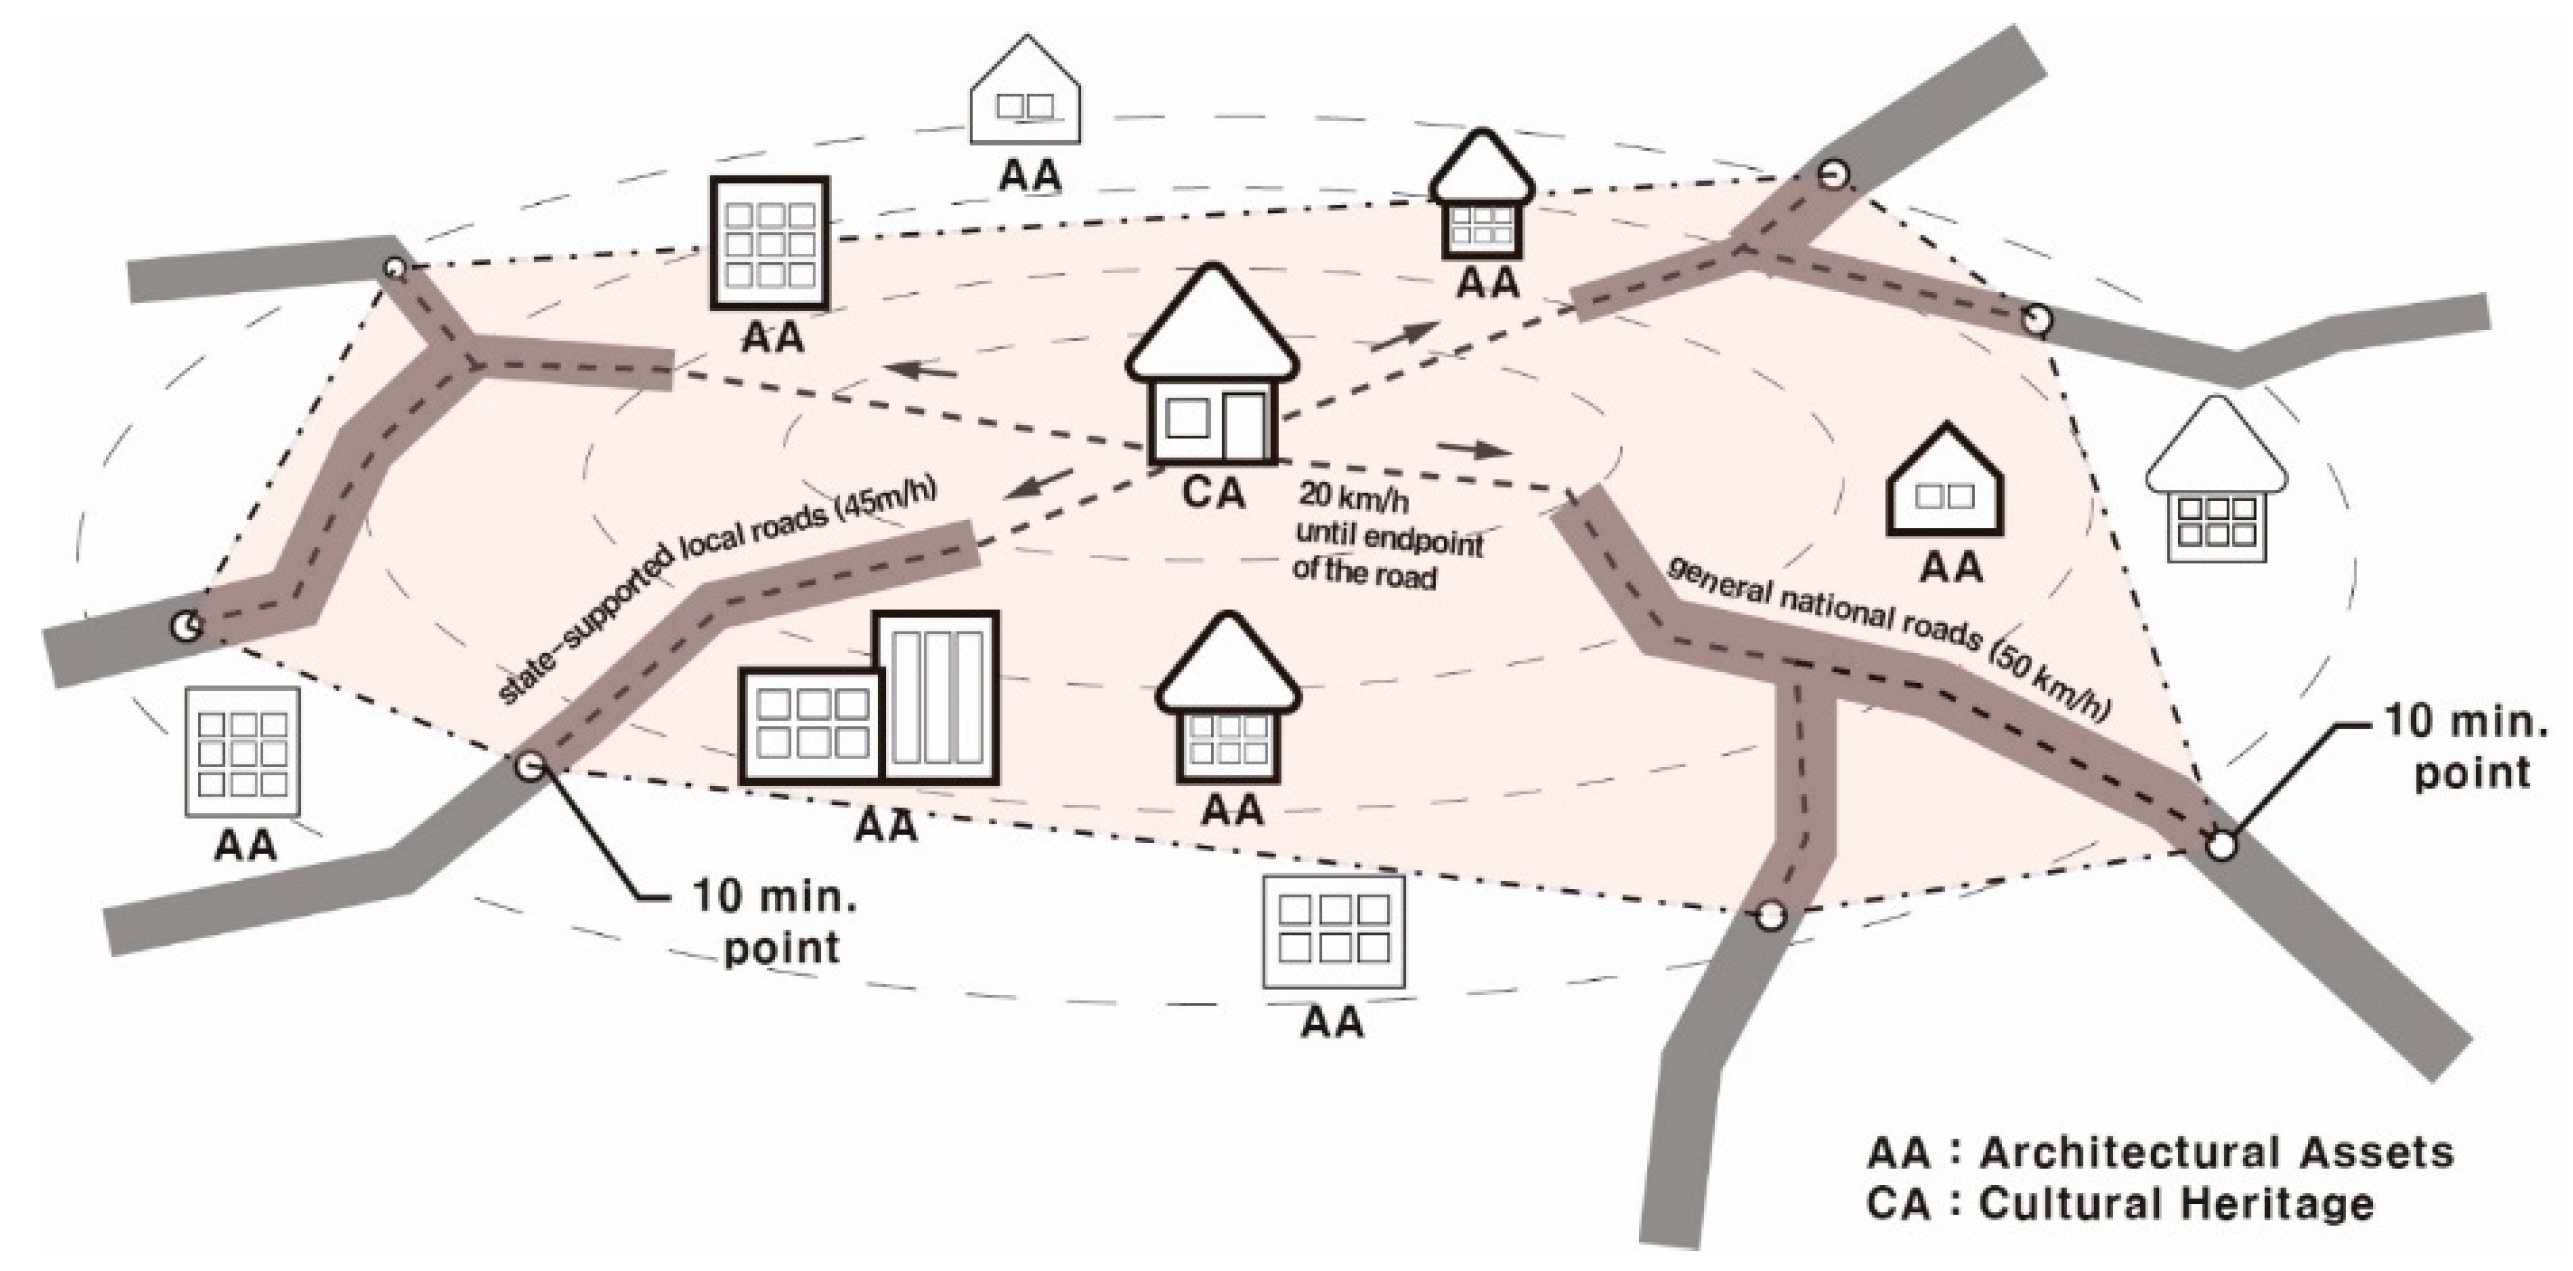
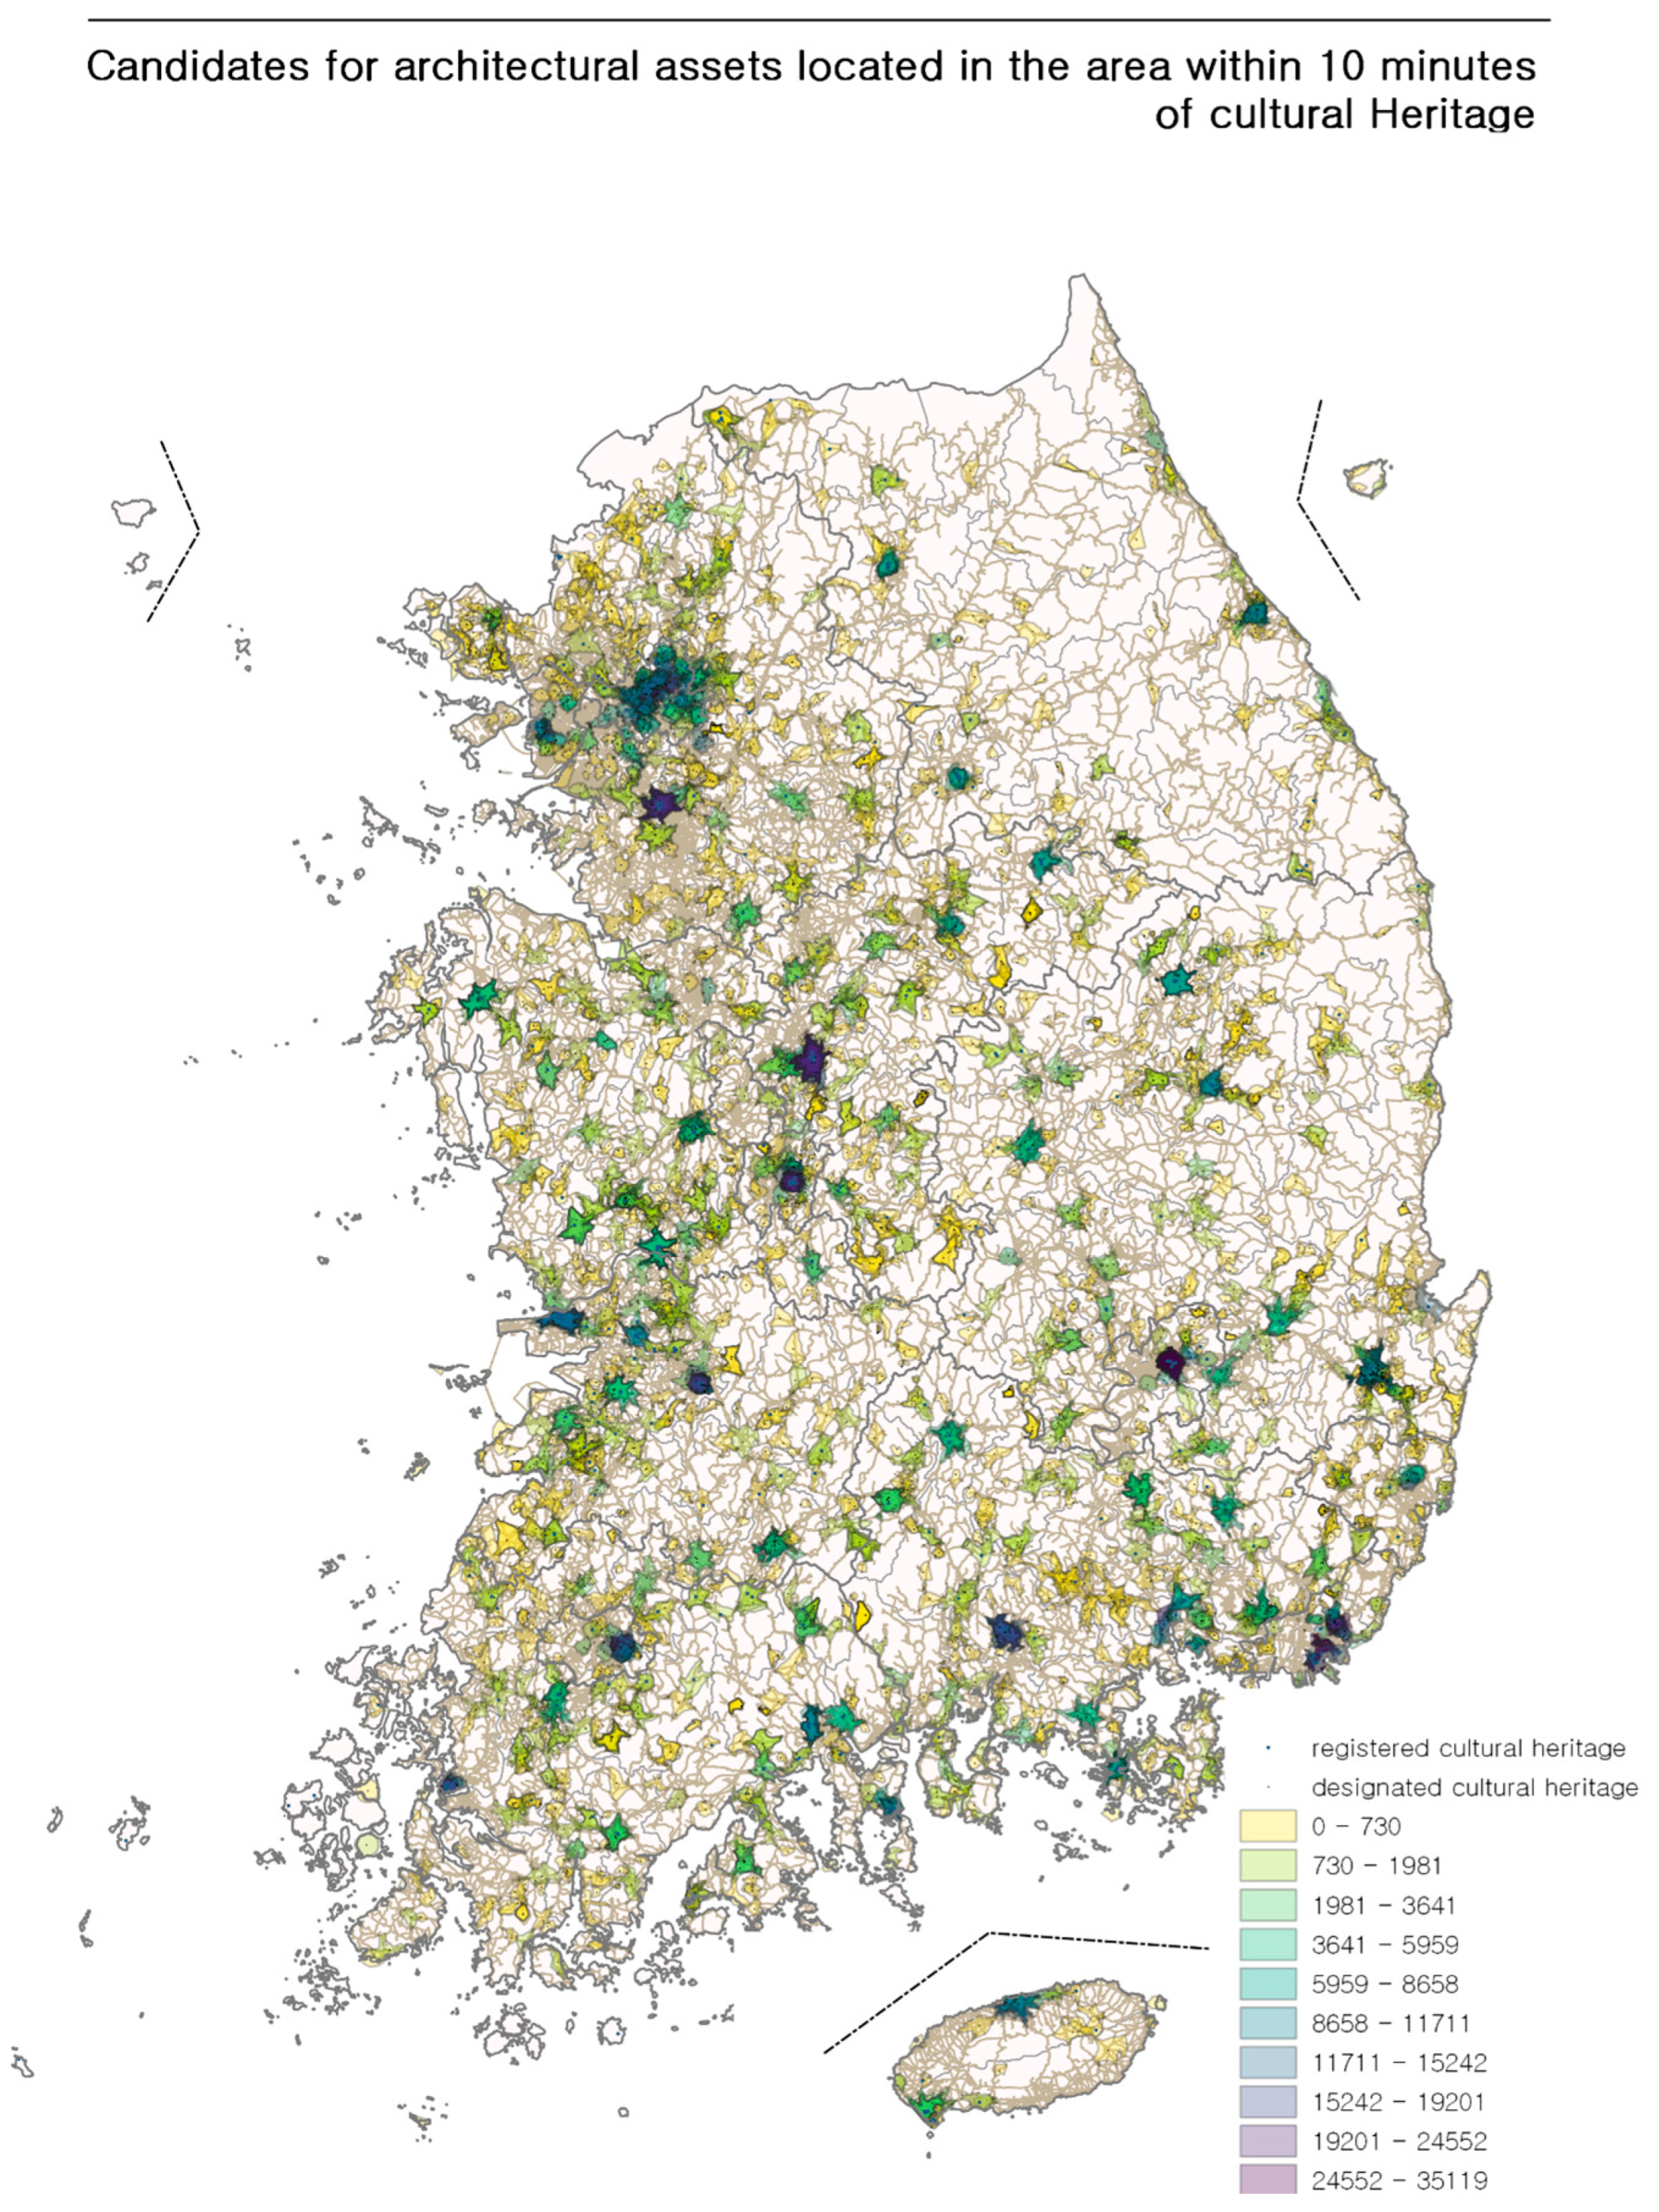
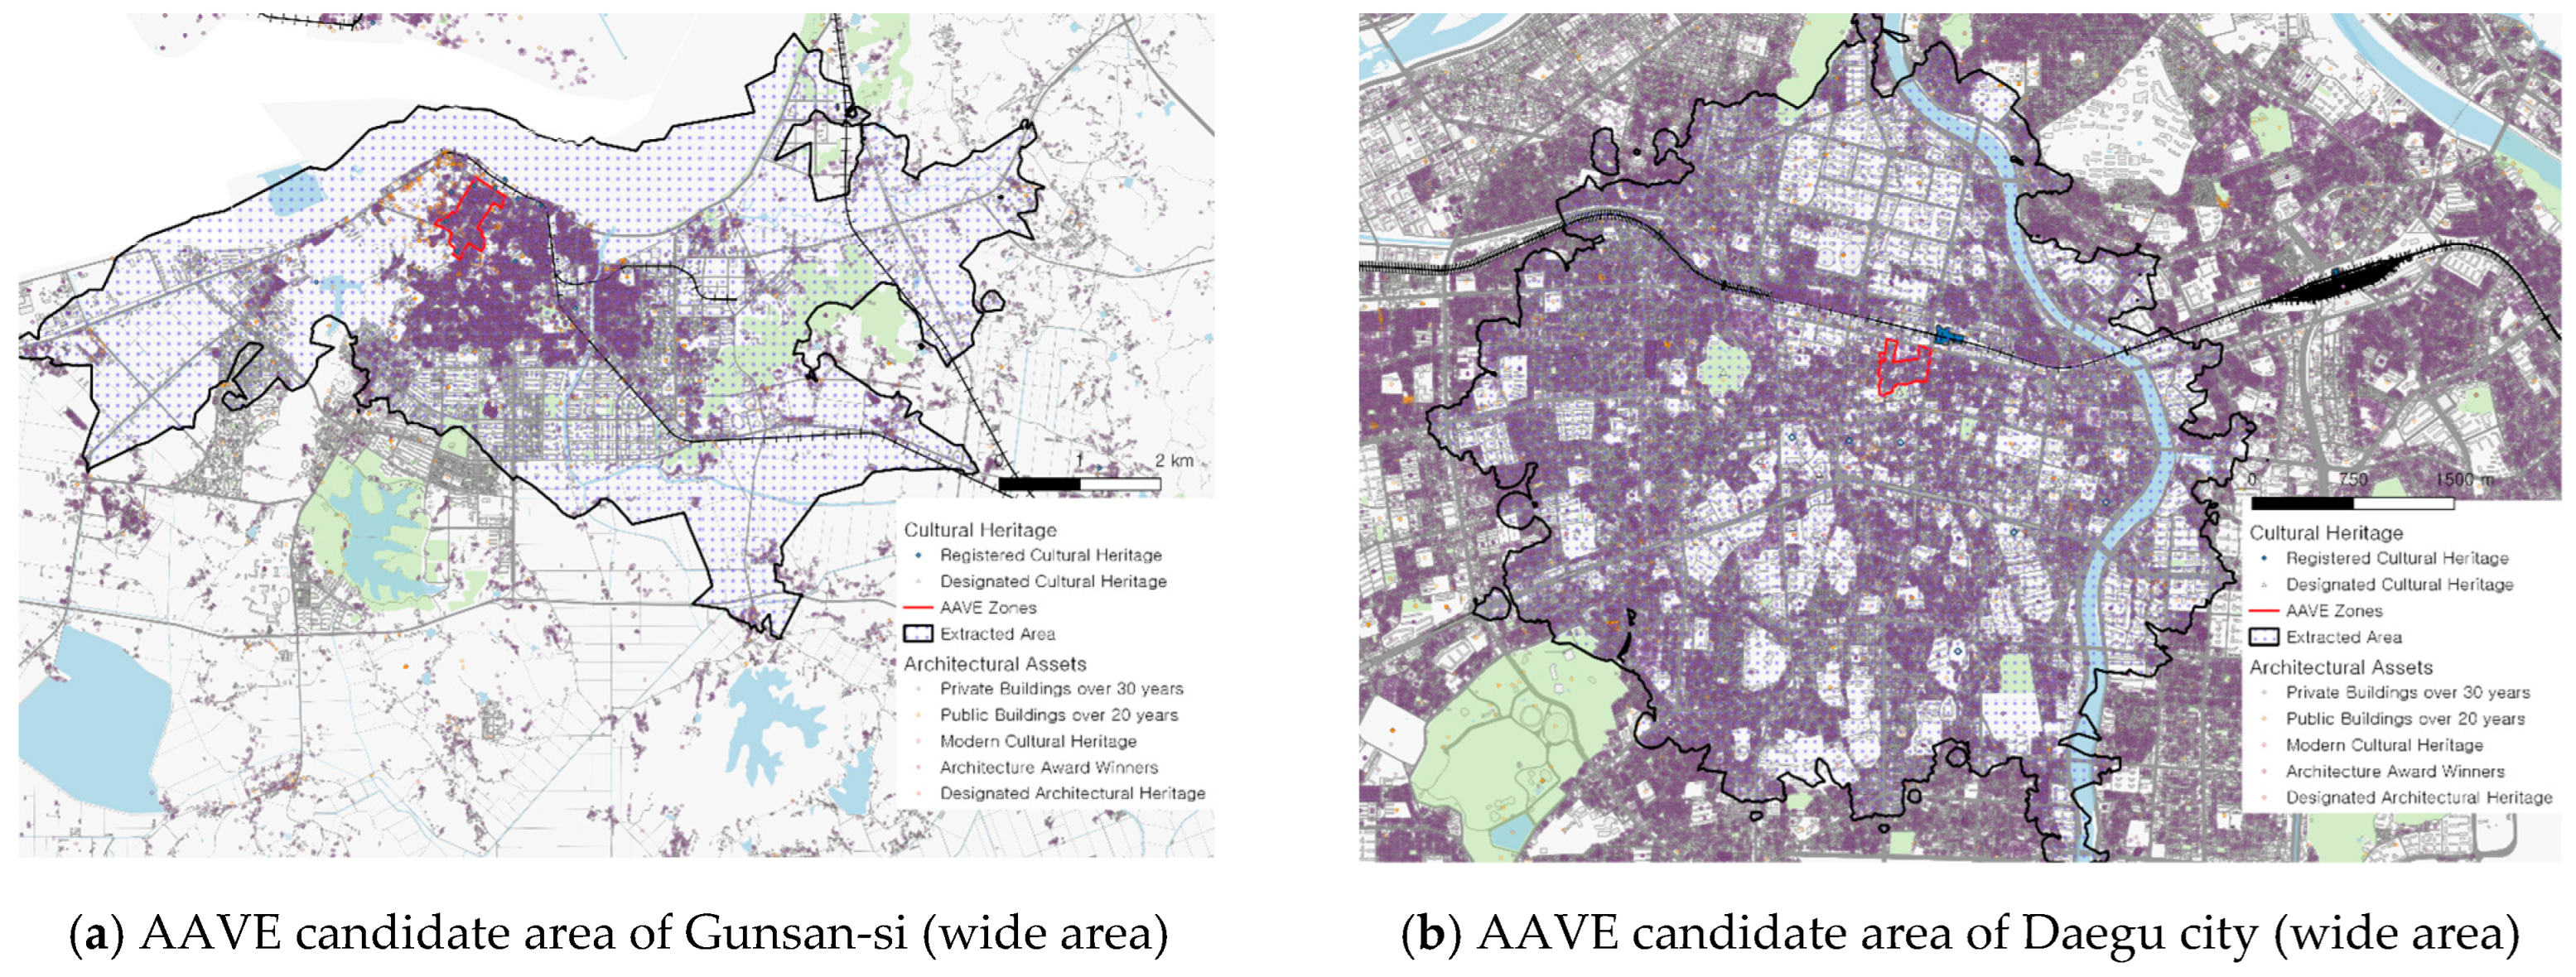
3.4. Extraction of the Range of Candidates for Architectural Assets Linked to Cultural Heritage

Spaces exhibiting autocorrelation—that is, areas where cultural heritage sites are located—are highly likely to comprise historical and cultural environments with a long history. Consequently, it is likely that areas with clusters of architectural asset candidates adjacent to cultural heritage sites would be designated as AAVE zones. Deriving a cluster of architectural assets in connection with cultural heritage sites was intended to exclude clustered areas centered on simple old buildings and present them as candidate areas for the enhancement of architectural assets.
To examine the relationship between cultural heritage sites and architectural asset candidates, a coordinated transformation of designated and registered cultural heritage sites nationwide, as well as information on national road networks, was collected. Designated and registered cultural heritage sites were placed on the map as coordinate information, and the road network was placed on the map in the National Transportation database [34].
Road network information comprises road intersection points, line shapes containing road information, and intersection connection details. With this information, it is possible to obtain the connection details of actual roads, such as one-way streets and no-left-turns. Road speeds were then assigned based on the speed classified according to the road network grade. Roads were assumed to be unblocked, with the average speed decrease due to traffic lights being reflected in roads within metropolitan cities or cities and provinces. Based on the road grade, speeds were set for expressways (100 km/h), urban high-speed roads (70 km/h), general national roads within a metropolitan city (20 km/h), other general national roads (50 km/h), special city metropolitan roads (20 km/h), state-supported local roads (45 km/h), city and county roads (20 km/h), and highway connection ramps (20 km/h) (Figure 4).
Next, the road network to which the speed values were assigned was connected to the cultural heritage sites. Each coordinate of the designated and registered cultural heritage sites was located as a point, and the distance between the coordinate point and the national road was noted. The speed was set at 20 km/h until the endpoint of the road closest to the coordinate point, after which the speed based on the road grade was assigned from the time it was connected to the road (Figure 4).
After establishing the criteria for the road network centered on cultural heritage sites, a location that could be reached within 10 min from the cultural heritage site was extracted, the area being established by connecting these points with a straight line. In the case of the National Geographic Information Institute, a standard of 20 min (10 km) of vehicle movement was used. However, 10 min was established in consideration of walking and vehicle movement due to the relationship between cultural heritage sites and architectural asset candidates. The number of architectural asset candidates belonging to the area located 10 min from cultural properties were counted (Figure 4).

3.5. Candidate Areas for AAVE Zones

Figure 5 shows the architectural asset candidates in an area located 10 min away from the center of a cultural heritage site. It has the advantage of being able to grasp at a glance the areas of high architectural asset concentration linked to the cultural heritage site through national maps. Areas in dark colors indicate a large number of architectural asset candidates. The maximum number of cases was 35,119, with the small section ranging from 0 to 730 cases. Areas were created around one cultural heritage site, and when other cultural heritage sites were located nearby, the areas overlapped. The fact that the marked area appears darker than the actual color legend is because the cultural heritage site is concentrated.
These results were different from the distribution of the architectural asset candidates in which the five criteria were integrated. Dense areas appeared not only in Seoul, Busan, and Daegu Metropolitan City, but also in Chungcheong-do and Jeolla-do. Cities rich in Hanok resources, such as Suwon-si, Jeonju-si, Iksan-si, Gyeongju-si, Andong-si, Mokpo-si, and Gunsan-si (which are also rich in modern and modern building resources), were included.

3.6. Architectural Asset and Candidate Criteria Concepts

To conduct a basic survey of architectural assets common across the country, it was necessary to establish criteria for such candidates in advance. Based on the established standards, a nationwide survey target list was prepared, and buildings representing regional characteristics were added for each local government. A basic investigation was conducted on the list of candidate architectural assets created in this way to classify whether the target building was worthwhile before it was assigned a grade.
To establish the criteria for architectural asset candidates, it was necessary to review the definition and the concept of architectural assets under the law. Architectural assets are defined as having effective social, economic, and scenic value in the present and for the future. They include architecture, spatial environments, and infrastructure that have historical and cultural value, such as Hanoks, or contribute to the enhancement of national architectural culture and the formation of regional identity (Article 2) [1]. The concept of architectural assets is comprehensive, in that it includes cultural heritage. However, since it overlaps with the scope covered by the “Cultural Heritage Protection Act,” designated and registered cultural heritage sites may be excluded from the ambit of architectural assets. Cultural heritage sites are recognized for their high value and are usually preserved in their original form. By contrast, architectural assets are preserved in a more practical and usable manner because architectural functions are maintained using appropriate interventions that reflect modern values. Whereas the law notes the values of society, economy, landscape, history, and culture among buildings (excluding cultural heritage sites), there is no clear standard for architectural assets. The legal definition of a Hanok is “a building, the main structure of which consists of wooden columns, beams, and Korean-style roof frames, reflecting the traditional style of Korea, and any building annexed thereto.” While the definition of Hanok buildings suggests a specific scope, the architectural assets of non-Hanok buildings mention various values. Therefore, based on the value mentioned in the Act on VEHAA, the basic investigation of non-Hanok architectural assets tends to rely heavily on qualitative evaluation, from the selection of candidate to the grade.
To overcome these problems, the central government (Ministry of Land, Infrastructure, and Transport) continues to discuss the establishment of criteria for non-Hanok architectural asset candidates [35]. The relevant criteria presented in the architectural asset basic investigation implementation guideline (March 2016) include private buildings over 30 years old, public buildings over 20 years old, and architectural award-winners [35]. Non-Hanok architectural asset candidates date from the beginning of the 20th century—the dawn of modern architecture in Korea. The social value of public buildings is reflected in the fact that the buildings have a faster construction period than private ones. Award-winning architecture describes buildings whose value has been recognized nationally or at a municipal level, and whose social, cultural, and scenic value has been recognized despite their relatively few years of use.
The guidelines suggest that architectural assets or buildings with various values in other areas may be included, though the discussion remains ongoing. The building types likely to be included in the criteria currently being discussed include non-designated architectural heritage and modern cultural heritage sites. This was in recognition of their social and cultural value, two categories of buildings with architectural value in the early 2000s, before the concept of architectural assets was established. Non-designated architectural heritage refers to buildings with preservation value among cultural heritage sites not designated by the Cultural Heritage Protection Act and which were researched through a nationwide survey in 2005. Modern cultural heritage sites were investigated through a cataloging project from 2002 to 2005. A total of five criteria can be established by examining the list that had been previously investigated as a criterion for architectural asset candidates.

3.7. Overview of the Top 30

Table 2 presents the 30 regions with the largest number of architectural asset candidates extracted from the derived map. The list includes all major metropolitan cities, including Seoul, Busan, Daegu, Incheon, Gwangju, Daejeon, and Ulsan. Due to the characteristics of the criteria for architectural asset candidates, areas with population and historicity were included. New towns, such as the second new town or Sejong Metropolitan Autonomous City built in the early 2000s, are not currently included in the list of candidate sites for enhancement (Figure 6).
As of October 2020, there were only three areas designated as AAVE zones. However, the extracted list included all of Gunsan Wolmyeong-dong (fifteenth), Daegu Hyangchon-dong (first), and Daejeon Isa-dong (fourth). It also included the Jongno-gu and Jung-gu areas of Seoul (seventh), which are scheduled to be designated as AAVE zones (Table 2). Among them, 19 cases (63%) of local governments have established (or proposed) implementation plans, and 21 cases (70%) have conducted (or proposed) basic investigations. Compared to the implementation plans for architectural asset enhancement and basic investigation, only three cases (10%) of local governments have been designated as AAVE zones (Table 2).
The fact that three out of 30 areas were included indicates the possibility that the other 27 areas could also be designated as AAVE zones. However, it would be necessary to examine in detail whether the derived map is effective for the designation of actual AAVE zones. To this end, we intend to conduct a comparative review between the areas previously designated as AAVE zones and the derived maps, and to conduct a detailed review of areas with a high potential for designation in the future.

4. Review of Candidate Areas for AAVE Zones

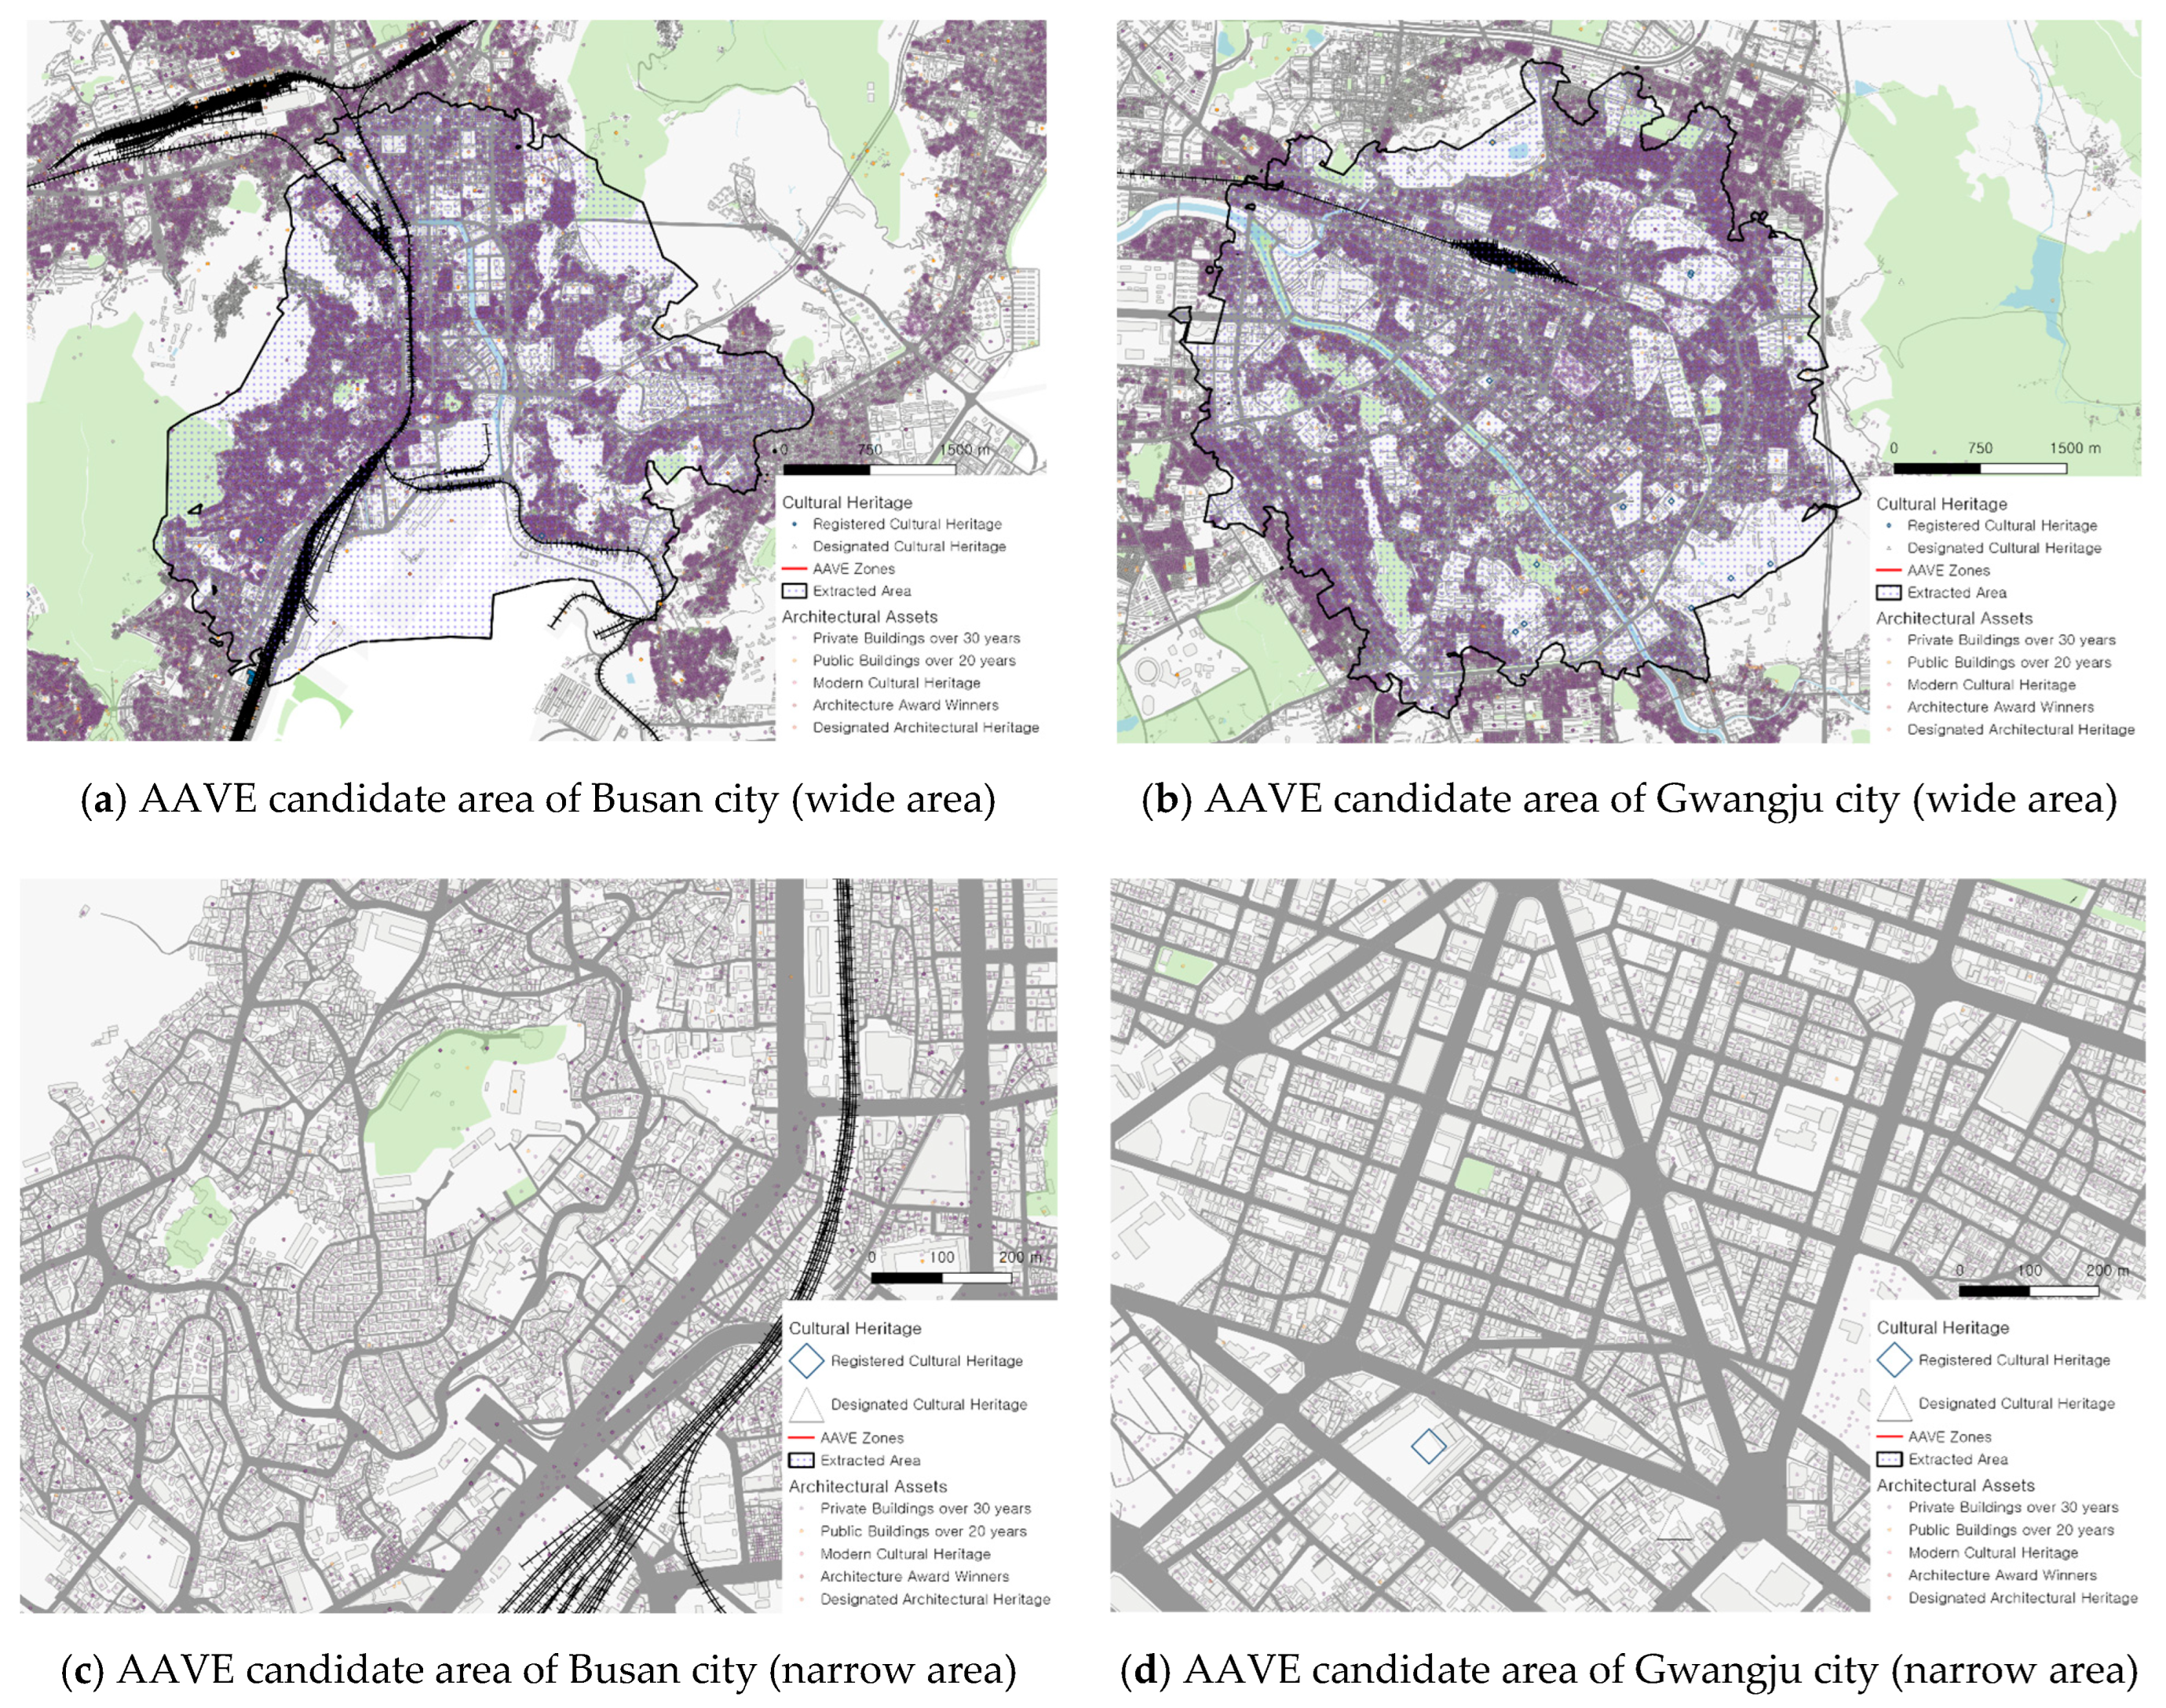
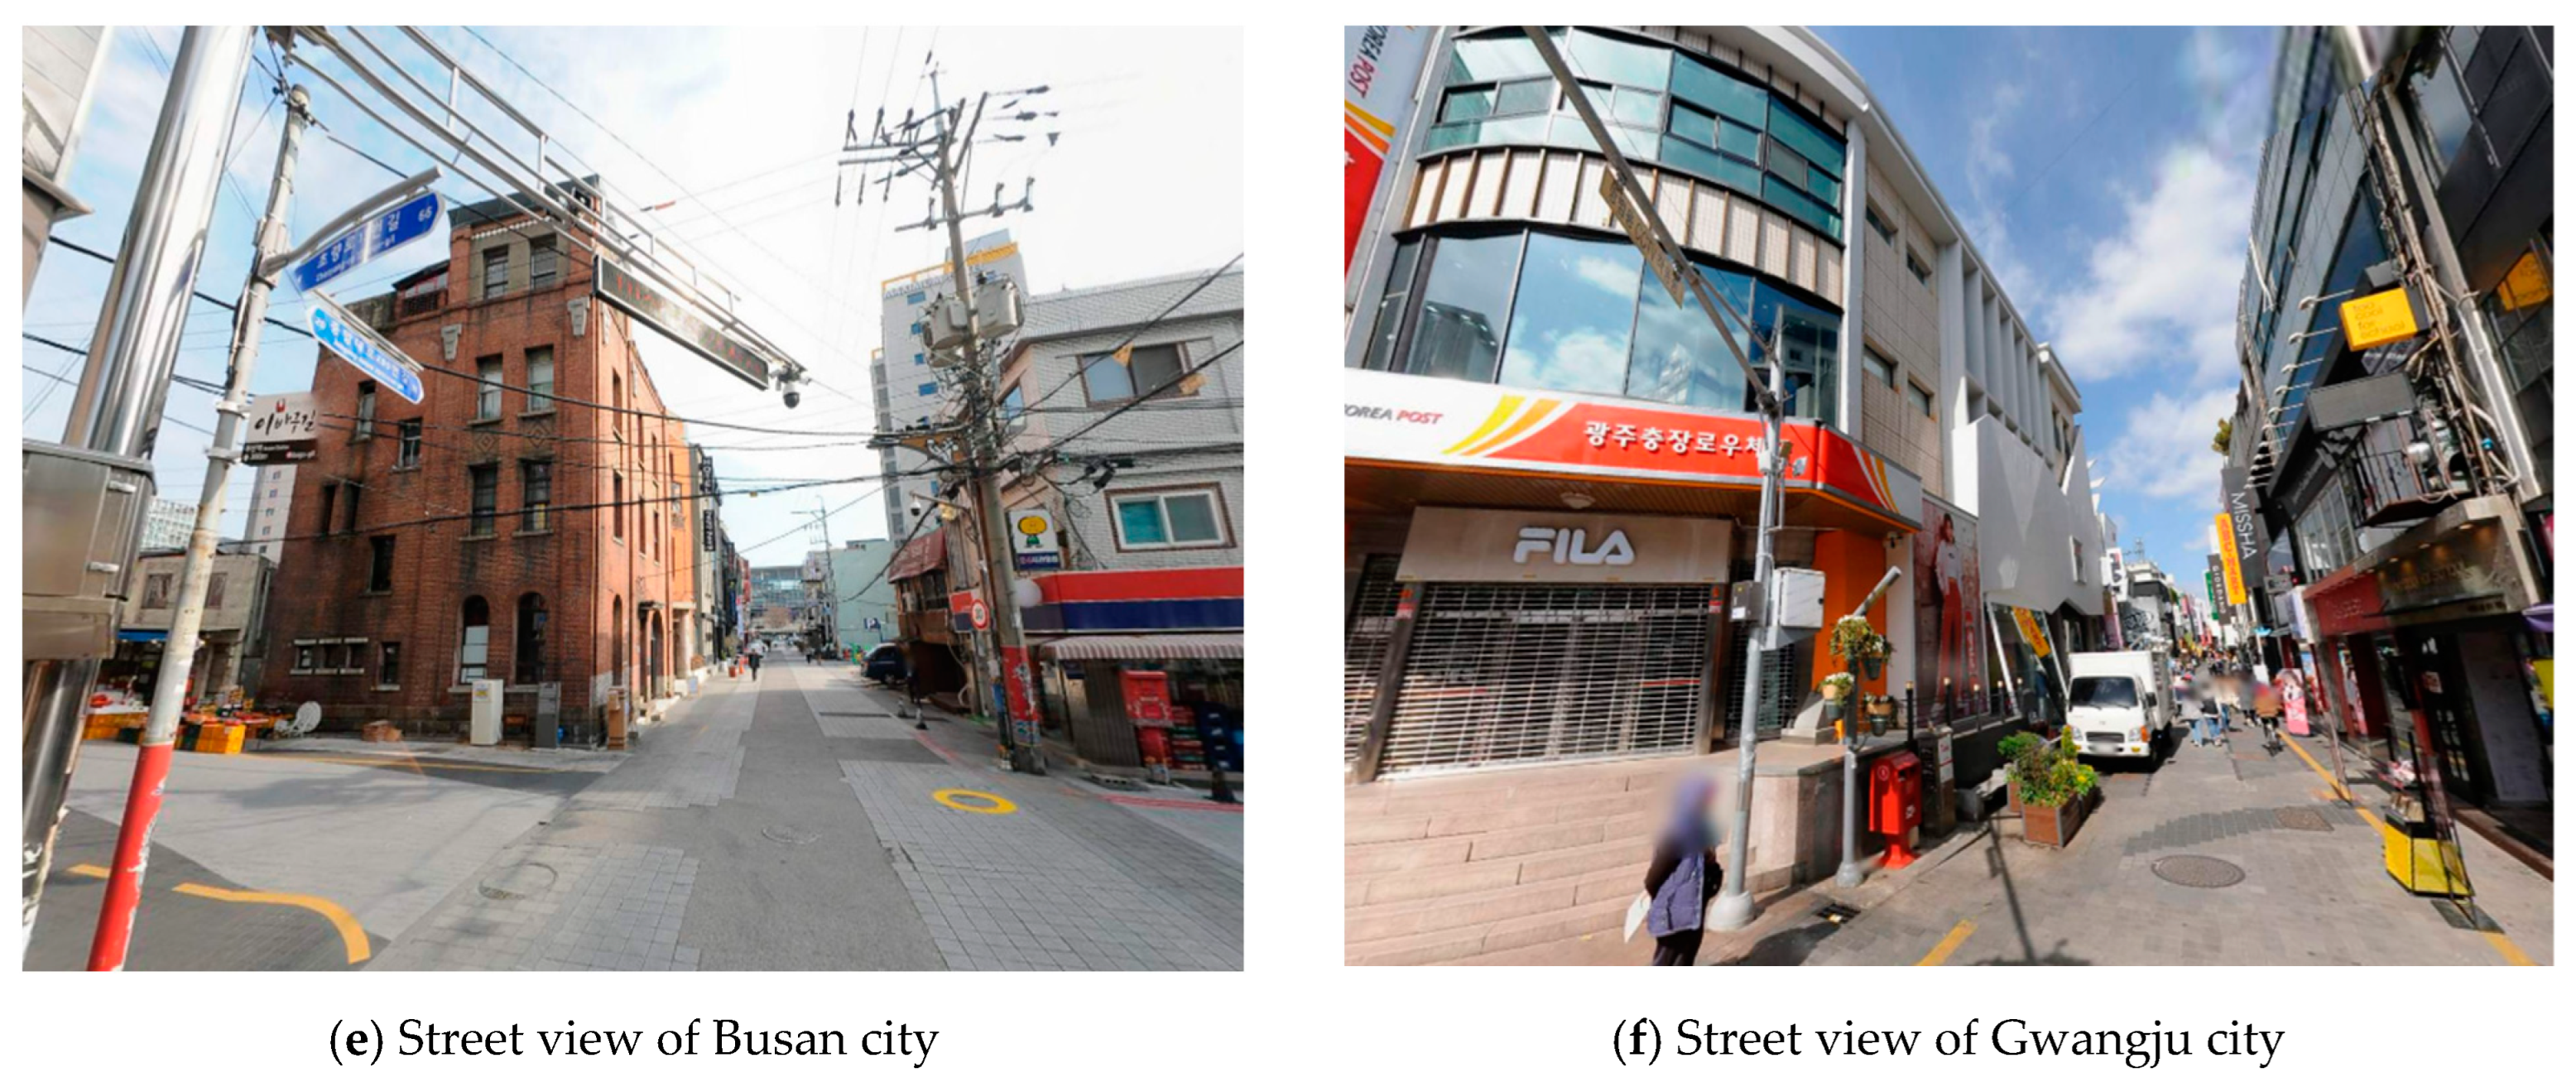
4.1. Review Method of AAVE Zones

The candidate AAVE zone obtained through GIS analysis coincided with the previously designated or planned AAVE zone. However, it is difficult to confirm the applicability of the AAVE zone only with this result. Therefore, the methodology for extracting the AAVE zone candidate areas was verified by confirming the characteristics of the relevant area in more detail.
Areas that have already been designated as AAVE zones and areas likely to be designated were identified with maps and street view images of various scales.

4.2. Comparison of Derived Results with Existing AAVE Zones

As of March 2020, three local governments were designated as AAVE zones, namely Hyangchon-dong Daegu Metropolitan City; Isa-dong Folk Village Daejeon Metropolitan City; and the zones of Yeonghwa-dong and Wolmyeong-dong Gunsan-si. Additionally, Seoul is pursuing the AAVE zone designations in nine areas. However, Daejeon and Seoul were excluded from comparison with the derived areas because they were designated as AAVE zones for areas with high concentrations of Hanoks.
Gunsan-si and Daegu Metropolitan City’s AAVE zones were the earliest designated in South Korea. Gunsan-si was designated in July 2017, and Daegu Metropolitan City in January 2018. These two areas boast of a modern history as old city centers. Furthermore, with the creation of new city centers, both encountered issues of regional regeneration. The area around the Hyangchon-dong Daegu Metropolitan City was the busiest in the 1980s, though the central city has now been relocated to Dongseong-ro (Figure 7f). Wolmyeong-dong Gunsan-si was the old city center with many Japanese architectural style buildings in the 1930s (Figure 7e). However, the central city area has been relocated to the Jigok-dong area. To counter the decline of the old downtown area and to revitalize it, regeneration projects were carried out. Consequently, both areas were designated as AAVE zones in the original downtown areas.
The areas derived from Gunsan-si and Daegu Metropolitan City as candidate sites included all of the currently designated AAVE zones. Although the scope of the area was rather wide, as it was designated as a 10 min drive by car, it was characterized by the fact that the currently designated AAVE zones are located in the center of each area. The area derived from Gunsan-si was approximately 42,000 km2; with the Geumgang River located to the north of the city, it had an elongated shape (Figure 7a,c). The area derived from Daegu Metropolitan City was 21 km2, and its shape was circular (Figure 7b,d).
Since the purpose of extracting candidate sites for AAVE zones is to present primary information from South Korea, the fact that the area is wide is not a problem. Rather, presenting too much information is problematic, because local governments have little room to reflect regional characteristics. In local government, more detailed adjustments are possible by adding buildings that take regional characteristics into consideration, and by assigning weights to the derived information.

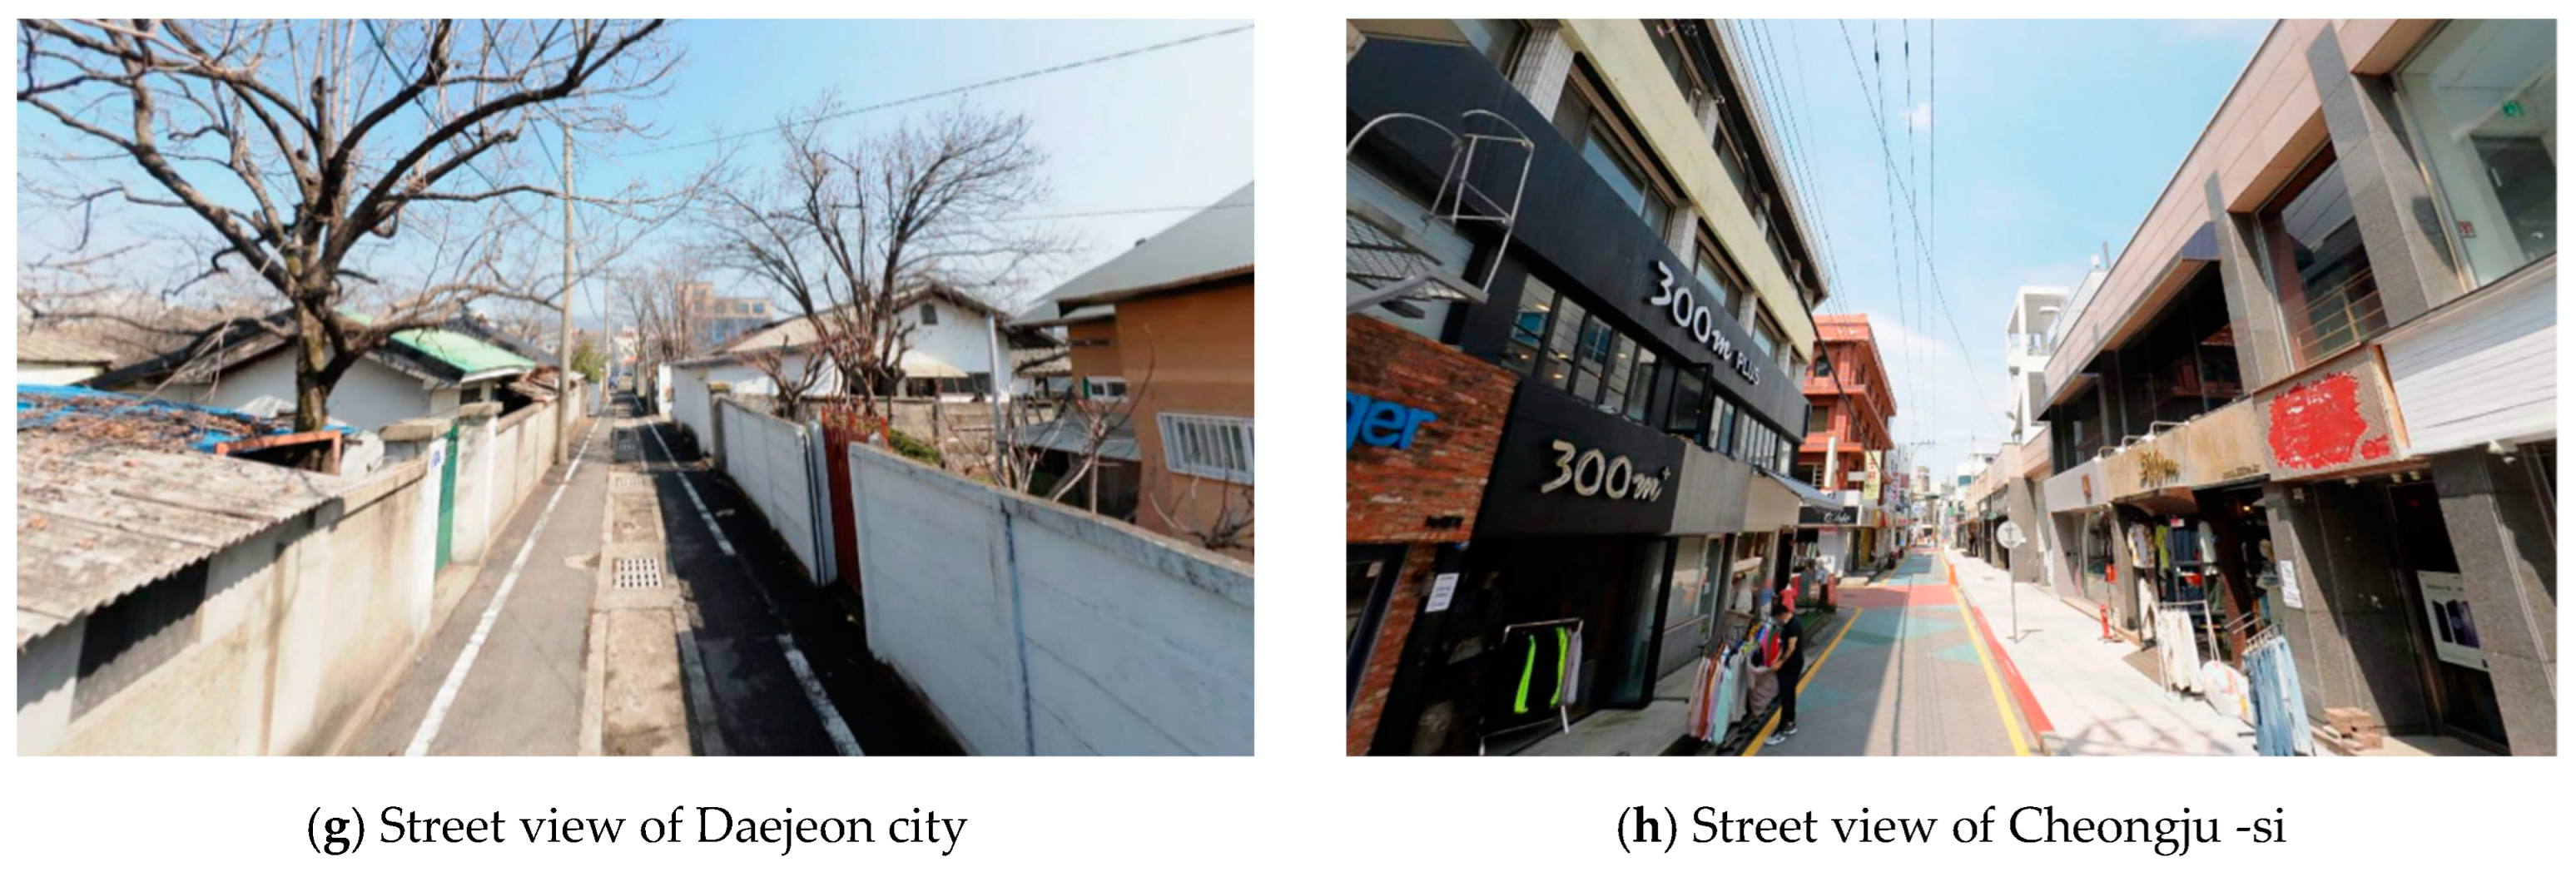
4.3. Review of Areas with A High Potential for the Designation of AAVE Zones

In addition to the areas currently designated as candidate sites for AAVE zones, it is necessary to review areas with the highest density of architectural asset candidates. For this purpose, four regions in the top five, namely Busan, Gwangju, Daejeon metropolitan city, and Cheongju-si, were examined. All four were drawn as areas with a high possibility of designating old downtown areas as AAVE zones, because the number of private buildings over 30 years was large.
First, in Busan Metropolitan City, architectural asset candidates were concentrated in Dong-gu and Busanjin-gu. The derived area was approximately 13 km2 and was triangular in shape, owing to the geographical characteristics of the mountains and sea (Figure 8a). The Sujeong-dong area was located on a sloping topography at the foot of the Gubongsan Mountain on the west side of Busan Station (Figure 8c). Busan has a long history as a port city, so the historical scope of buildings is diverse. Dong-gu is an open port, with modern cultural heritage sites, such as Japanese-style buildings and warehouses. Although old private buildings are distributed at a high density, there are many buildings with historical characteristics in Busan (Figure 8e). Thus, it was judged as an area with a high possibility of being designated and managed as an AAVE zone (Figure 8).
In the case of Gwangju Metropolitan City, the old city center is about 21 km2 and the derived area is circular in shape (Figure 8b). The old city center is densely populated with modern buildings from the 1970s and 1980s (Figure 8d). In particular, it has painful memories relating to the Gwangju Democratization Movement. Many buildings related to the democratization movement of the 1980s, from the Old Jeollanam-do Provincial Office (which was used as a base for the movement) to the Jeonil Building (that was fired upon by the military) and the Commerce Agent (where the victims were enshrined) (Figure 8f). Like other cities, the old downtown area of Gwangju Metropolitan City has declined. As part of the preservation of the Old Jeollanam-do Provincial Office and the construction of the Asian Culture Complex, the area has been revitalized. In Gwangju Metropolitan City, the possibility of AAVE zone designation has centered on the modern architectural assets being very high (Figure 8).
In Daejeon Metropolitan City, the zone is approximately 21 km2 and was formed in the area around Daejeon Station (Figure 9a). The Daejeon stream is located in front of the Station, but this does not seem to have affected the development of a circular area because of the large number of connecting bridges (Figure 9c). There are old residential areas with poor facilities in the downtown area near Daejeon Station. With the development of Dunsan District in 1988, the old downtown faced decline. However, national and local government efforts to reorganize old residential areas and revitalize the old downtown areas continue. A significant part of downtown is recovering its vitality. The old downtown area of Daejeon Metropolitan City is located on the west side of Daejeon Station, with modern buildings densely distributed along a 30 m wide road (Figure 9e). Meanwhile, Soje-dong, located on the eastern side of Daejeon Station, is where the railway village is located. Although their individual architectural value is not high, the buildings in the early 1900s were densely packed (Figure 9g). Today, one can experience the old atmosphere, and many visitors film or visit the retro cafes here. Thus, there is a high possibility that Soje-dong, centered on about 40 railway villages, and the old downtown area west of Daejeon Station may together be designated as an AAVE zone (Figure 9).
In Cheongju, an area of approximately 53 km2 was derived . Compared to Gwangju and Daejeon, it took the shape of a starfish, seemingly with the impact of the roads’ network structure and the concentration of candidates for architectural assets (Figure 9b). In particular, Cheongju has a larger area (53 km2) compared to other metropolitan cities. This is because the average speed is given based on the number of traffic lights in the city center, and Cheongju City, which has a relatively small number of traffic lights, has a wider area, making it difficult to select a specific area. However, the area around the Chungcheongbuk-do Provincial Office, the center of the derived area, is highly likely to be designated as an AAVE zone because of the concentration of numerous cultural properties and densely packed modern buildings. Starting with the main building of the Chungcheongbuk-do Provincial Office, already registered as a cultural heritage site, there are Japanese-style buildings and the governor’s office, as well as buildings over 50 years old, concentrated in the Seongan-dong area (Figure 9d,f,h).
In this way, four additional areas not designated as AAVE zones were reviewed. The derived results were drawn over a wide area, including the old downtown area. As a result of examining the regions in detail, the possibility of them being designated as AAVE zones from the viewpoints of society, culture, landscape, and history was confirmed. However, since these areas were mentioned for the verification of the research methodology, the results have nothing to do with whether they were designated as AAVE zones. The derived information could be utilized as objective data to grasp the current status for the first review before the designation of AAVE zones. It will be possible to identify the density of local architectural asset candidates, and compress the range of areas with a high possibility of designation as AAVE zones. The scope of what can be designated as architectural assets within the areas, derived through consultation with residents and experts, could be specified in detail.

5. Conclusions

A GIS-based methodology that could present more objective information for the designation of AAVE zones was presented. Since there is a high possibility that an area with a high concentration of architectural asset candidates is likely to be derived from a region with a high concentration of old buildings, we attempted to extract those locales related to cultural heritage. The derived area not only extracted an effective region, but also demonstrated the possibility of the complex management of cultural and architectural assets.
In this study, the top 30 areas with multiple architectural asset candidates within 10 min from the center of cultural properties were extracted. As a result of a detailed review of the top five areas, the existing AAVE zones (two areas with non-Hanok buildings) were included. By examining the region in detail, it was confirmed that the area had a high probability of being selected as an AAVE zone because of its unique characteristics as an old city center. Accordingly, the validity of the methodology established in this study was confirmed.
The results derived through the research methodology could identify the current status of densely populated areas of candidates for architectural assets across the country. However, since these areas were named “candidate sites” for AAVE zones, they could not be designated as AAVE zones unconditionally. Since a candidate for an architectural asset is extracted based on a national standard, this represents objective data that can be used as a reference, either before a basic investigation at local government level or at the stage of the designation of AAVE zones. Moreover, it is possible to perform a basic survey that can save time, cost, and effort by adding architectural assets or buildings that have passed various values to this standard at the local government survey stage. This would make it possible to select a candidate site that reflects localness.
Though this study confirmed the effectiveness of the research methodology to a large extent, it nevertheless provides only primary information. The limitations of the study can be presented based on the correction of the derived AAVE area and the architectural asset candidate. First, the range of the derived area was set at a distance of 10 min by vehicle. However, it is necessary to narrow the AAVE area more precisely by re-establishing the standard considering the distance that can be moved from a walking point of view. Second, to derive more detailed data, it would be necessary to reflect qualitative values as well as quantitative standards or assign weights, such as local architectural assets. In this case, weights could be assigned to the architectural asset candidate using the value classification and grade indicators provided at the basic architectural asset investigation stage. It would also be necessary to continuously discover criteria for candidates for architectural assets in addition to the five current criteria: private buildings, public buildings, non-designated architectural heritage, modern cultural heritage, and award-winning architectural sites. This would need to be addressed in future studies.

Author Contributions

Conceptualization and methodology, D.S. and N.B.; software and formal analysis and data curation, S.K.; writing—original draft preparation, D.S.; writing—review and editing, N.B.; visualization and supervision, D.S.; funding acquisition, D.S. and N.B. All authors have read and agreed to the published version of the manuscript.

Funding

This study was conducted as part of the hanok project of the Architecture and Urban Research Institute.

Acknowledgments

This article was developed based on AURI brief No. 208 of the Architecture and Urban Research Institute. The authors wish to express their gratitude to the four anonymous reviewers for the comments and suggestions provided, which have been very helpful in improving the paper.

Conflicts of Interest

The authors declare no conflict of interest.

References

  1. The Korean Law Information Center. Act on Value Enhancement of Hanok and Other Architectural Assets. 2021. Available online: https://www.law.go.kr/ (accessed on 14 June 2021).
  2. Sim, K.; Lim, Y.; Kang, K. Implementation Issues for Architectural Assets Enhancement District; Policy Report of Architecture & Urban Research Institute; Auri Press: Sejong, Korea, 2015. [Google Scholar]
  3. Shon, D.; Lee, J. Category Derivation of ‘Hanok Architectural Style’ through Typology Analysis. Archit. Inst. Korea 2020, 36, 15–24. [Google Scholar] [CrossRef]
  4. Unjoru. Available online: http://www.unjoru.net/ (accessed on 5 March 2022).
  5. Seoul Hanok Portal. Available online: https://hanok.seoul.go.kr/front/index.do (accessed on 5 March 2022).
  6. The Blue House. Available online: http://www.president.go.kr/ (accessed on 5 March 2022).
  7. The Seoul Research Data Service. Available online: https://data.si.re.kr/ (accessed on 5 March 2022).
  8. Land Daily. Design by Kim Jung-Up Sajik-Dong House, Registered as Excellent Building Asset. Available online: http://www.ikld.kr/news/articleView.html?idxno=251715 (accessed on 5 March 2022).
  9. Seoul City. Available online: https://www.seoul.go.kr/main/index.jsp (accessed on 5 March 2022).
  10. The Korean Law Information Center. Act on Act on Cultural Heritage Protection. 2021. Available online: https://www.law.go.kr/ (accessed on 28 January 2022).
  11. Chang, K. Introduction to Geographic Information Systems, 4th ed.; Tata McGraw-Hill: New Delhi, India, 2008. [Google Scholar]
  12. Maliene, V.; Grigonis, V.; Palevičius, V.; Griffiths, S. Geographic information system: Old principles with new capabilities. Urban Des. Int. 2011, 16, 1–6. [Google Scholar] [CrossRef]
  13. De Smith, M.J.; Goodchild, M.F.; Longley, P. Geospatial Analysis: A Comprehensive Guide to Principles, Techniques and Software Tools; The Winchelsea Press: London, UK, 2018. [Google Scholar]
  14. McHaffie, P.; Hwang, S.; Follett, C. GIS An Introduction to Mapping Technologies; CRC Press: Boca Raton, FL, USA, 2019. [Google Scholar]
  15. Tobler, W.R. A computer movie simulating urban growth in the Detroit Region. Econ. Geogr. 1970, 46, 234–240. [Google Scholar] [CrossRef]
  16. Public Data Portal. Available online: https://www.data.go.kr/ (accessed on 14 June 2021).
  17. National Spatial Information Portal. Available online: http://www.nsdi.go.kr/ (accessed on 24 June 2021).
  18. European Forum for Geography and Statistics. Available online: https://www.efgs.info/ (accessed on 24 June 2021).
  19. Statistics Sweden. Product Catalogue 2015 Statistics Sweden’s Market Profiles; Statistics Sweden: Stockholm, Sweden, 2015.
  20. National Geographic Information Institute. Available online: https://www.ngii.go.kr/ (accessed on 24 June 2021).
  21. Esri. ArcGIS Network Analysis. 2021. Available online: https://www.esri.com (accessed on 14 June 2021).
  22. Pearce, J.; Witten, K.; Bartie, P. Neighbourhoods and health: A GIS approach to measuring community resource accessibility. J. Epidemiol. Community Health 2006, 60, 389–395. [Google Scholar] [CrossRef] [PubMed] [Green Version]
  23. Lofti, S.; Koohsari, M. Measuring objective accessibility to neighborhood facilities in the city (A case study: Zone 6 in Tehran, Iran). Cities 2009, 26, 133–140. [Google Scholar] [CrossRef]
  24. Paez, A.; Trepanier, M.; Morency, C. Geodemographic analysis and the identification of potential business partnerships enabled by transit smart cards. Transp. Res. Part A Policy Pract. 2011, 45, 640–652. [Google Scholar] [CrossRef]
  25. Salarvandian, F.; Hosseini, S.; Moradi, A.; Karoubi, M. Assessing the spatial distribution of sports spaces within walking distance in Tehran. Int. J. Urban Sci. 2020, 24, 557–577. [Google Scholar] [CrossRef]
  26. Anderson, T. Comparison of spatial methods for measuring road accident ‘hotspots’: A case study of London. J. Maps 2007, 3, 55–63. [Google Scholar] [CrossRef]
  27. VWLAB. Available online: https://www.vw-lab.com/ (accessed on 10 June 2021).
  28. An, Y.; Jang, S.; Lee, S. A Study on the Map of Walk-and Bicycle-Access Time to Subway Station Using a Shortest-part Algorithm for Gangnam Area of Seoul. Seoul Stud. 2011, 12, 129–140. [Google Scholar]
  29. Architecture Administration System (SEUMTEO). Available online: https://cloud.eais.go.kr/ (accessed on 18 July 2021).
  30. Architecture and Urban Policy Information Centre. Available online: http://www.aurum.re.kr/ (accessed on 18 July 2021).
  31. Cultural Heritage Administration. Non-Designated Architectural Heritage Survey Project (2005–2008); Cultural Heritage Administration Press: Daejeon, Korea, 2008.
  32. Cultural Heritage Administration. Research Report on Modern Cultural Heritage Investigation and Cataloging Project (2002–2005); Cultural Heritage Administration Press: Daejeon, Korea, 2005.
  33. Cultural Heritage Administration. Available online: https://www.cha.go.kr (accessed on 18 July 2021).
  34. National Transportation DB. Available online: https://www.ktdb.go.kr/ (accessed on 18 July 2021).
  35. Ministry of Land, Infrastructure and Transport. Guidelines for Implementation of basic Investigation of Architectural Assets; Mlit Press: Sejong, Korea, 2016.
Figure 1. Various types of architectural asset. (a) Hanok built in 1776 (Unjoru) [4]; (b) urban type Hanok in the early 1900s (Bukchon Area, Seoul) [5]; (c) Hanok made of concrete structures have the potential to receive support under the VEHAA Act. (the Blue House, the Korean presidential residence) [6]; (d) modern architectural built in 1931 (chebu-dong church) [7]; (e) modern architectural built in 1983 (sajik-dong house) [8]; (f) contemporary architectural landscape in Seoul, South Korea (around Seoul city hall) [9].
Land 11 00584 g001
Figure 2. Transformation of grid maps (500 m) of architectural asset candidates based on five criteria.
Land 11 00584 g002
Figure 3. Distribution of architectural assets candidates.
Land 11 00584 g003aLand 11 00584 g003b
Figure 4. Concept image of extraction of the range of candidates for architectural assets linked to cultural heritage.
Land 11 00584 g004
Figure 5. Candidate areas for AAVE zones.
Land 11 00584 g005
Figure 6. Top areas of candidate areas for AAVE zones.
Land 11 00584 g006
Figure 7. Comparison of derived results with existing AAVE zones (left, Gunsan-si; right, Daegu city).
Land 11 00584 g007aLand 11 00584 g007b
Figure 8. Review of areas with high potential for designation of AAVE zones (left, Busan city; right, Gwangju city).
Land 11 00584 g008aLand 11 00584 g008b
Figure 9. Review of areas with high potential for designation of AAVE zones (left Daejeon city, right Cheongju-si).
Land 11 00584 g009aLand 11 00584 g009b
Table 1. A summary of the collected data [29,30,31,32,33].
Architectural Asset CandidateNumber of BuildingsSourceNote
Private buildings over 30 years2,595,599Architecture administration system (Seumteo), 2019 3rd quarter building managerMinistry of Land, Infrastructure and Transport
guideline criteria
Public buildings over 20 years85,613
Architectural award winners2122Architecture and Urban Policy Information Centre (excluding 14 cases including address error)
Modern cultural heritage *3943Investigation and cataloguing of modern cultural heritage (2002–2005), (excluding 759 cases including address error, loss, designation/registration, etc.)Investigation of local governments nationwide before the VEHAA Act
Non-designated architectural heritage *4043Non-designated architectural heritage investigation project (2005–2008), excluding 898 cases of address error, loss, etc.
Designated cultural heritage2948Cultural heritage administrationCultural heritage
Registered cultural heritage471
* Non-designated architectural heritage and modern cultural heritage reflect the latest information through self-investigation.
Table 2. Thirty regions with the largest number of architectural asset candidates.
NoName of AreaNumber of Architectural Asset CandidatesProgress of Implementation PlansProgress of the Basic InvestigationDesignated AAVE Zone
1Daegu Metropolitan City
Jung-gu area
33,306--
2Busan Metropolitan City
Dong-gu and Busanjin-gu area
32,556---
3Gwangju Metropolitan City
Dong-gu and Buk-gu area
25,474--
4Deajeon Metropolitan City
Jung-gu and Dong-gu area
25,217
5Chungcheongbuk-do Cheongju-si Seowon-gu and Sangdang-gu area21,857-
6Busan Metropolitan City
Dongnae-gu and Yeonje-gu area
21,279---
7Seoul Metropolitan City
Jongno-gu and Jung-gu area
20,972
8Gyeonggi-do Suwon-si Paldal-gu, Jangan-gu, Yeongtong-gu area20,922-
9Jeollabuk-do Jeonju-si Wansan-gu area20,007---
10Gyeongsangnam-do Changwon-si Masanhappo-gu
and Masanhoewon-gu area
19,971---
11Gyeongsangnam-do Jinju-si area17,310---
12Jeollanam-do Mokpo-si area16,595-
13Incheon Metropolitan City
Michuhol-gu area
15,450-
14Gyeongsangbuk-do Pohang-si Nam-gu area14,543-
15Jeollabuk-do Gunsan-si area13.646--
16Jeju-si area12,678-
17Jeollanam-do Yeosu-si area12,494-
18Ulsan Metropolitan City
Jung-gu area
12,264--
19Gyeonggi-do Seongnam-si Jungwon-gu area11,748-
20Gyeonggi-do Yongin-si Suji-gu area11,115-
21Jeollabuk-do Iksan-si area11,908---
22Seoul Metropolitan City
Mapo-gu and Yongsan-gu area
10,405-
23Gangwon-do Gangneung-si area9991-
24Gyeongsangbuk-do Gyeongju-si area9536-
25Jeollanam-do Suncheon-si area9515-
26Gyeongsangbuk-do Andong-si area9059-
27Gyeongsangbuk-do Yeongju-si area8439-
28Gyeongsangnam-do Tongyeong-si area7807---
29Gangwon-do Wonju-si area7636-
30Chungcheongbuk-do Jecheon-si area7377-
Completed: ●. In progress: ○ (as of October 2020). / Metropolitan cities are shown in bold.
Publisher’s Note: MDPI stays neutral with regard to jurisdictional claims in published maps and institutional affiliations.

