Article

The Early Effect of Black Land Protection Plan in Northeast China on Industrial Pollution Using Synthetic Control Method

1
Key Laboratory of Regional Sustainable Development Modeling, Institute of Geographic Sciences and Natural Resources Research, Chinese Academy of Sciences, Beijing 100101, China
2
College of Resources and Environment, University of Chinese Academy of Sciences, Beijing 100049, China
3
School of Geographic Sciences, East China Normal University, Shanghai 200241, China
4
Guangdong Institute for International Strategies, Guangdong University of Foreign Studies, Guangzhou 510420, China
*
Author to whom correspondence should be addressed.
Land 2022, 11(4), 585; https://doi.org/10.3390/land11040585
Submission received: 21 March 2022 / Revised: 13 April 2022 / Accepted: 14 April 2022 / Published: 16 April 2022
(This article belongs to the Special Issue The Eco-Environmental Effects of Urban Land Use)

Abstract

:
This study used relevant industrial pollution emission data collected between 2004 and 2020 in northeastern China. It utilized the synthetic control method (SCM) and used entire county-level areas within the scope of the typical black land protection as the experimental group. Thirty regions in China (excluding Tibet, Hong Kong, Macao, and Taiwan), including the three non-black land areas of Liaoning, Jilin, Heilongjiang, and Inner Mongolia, and the other 26 entire provinces were taken as the control group. We studied whether the Outline of Black Land Protection Plan in Northeast China (2017–2030) (BLPP) has reduced local industrial pollution emissions since it was issued in 2017. The study found that implementation of the BLPP reduced industrial wastewater and sulfur dioxide emissions in black land areas significantly. Between 2017 and 2020, local industrial wastewater production decreased by 29.3% compared to the period without implementation of the outline, while industrial sulfur dioxide decreased by 12%. These results remained robust under the placebo and difference-in-difference (DID) tests. This once again showed that implementation of the outline had a significant effect on reducing industrial pollutant emissions in the black land area of northeastern China.

1. Introduction

A valuable soil resource, black land is a type of high-quality arable land with good character and high fertility that is suitable for farming. The plains of northeastern China are among the world’s three large black land areas and are an important Chinese commodity grain production base. The protection and sustainable utilization of cultivated land resources are related to the strategic need to ensure food security and social stability in the country. As the most fertile cultivated land resources in China, black land in northeast China is an anchor that guarantees Chinese food security and the supply of high-quality agricultural products. However, heavy industrial enterprises are the core of the social economy in northeast China and the main source of pollution. Industrial wastewater and sulfur dioxide emissions have substantial destructive effects on land resources [1,2,3,4]. Due to extended, highly intensive use of black land and a lack of scientific management and protection, cultivated land resources and agricultural ecological security in the black land region are severely challenged. There is an urgent need to take relevant, substantial measures to protect black land [5].
To strengthen the protection of black land, the Chinese government issued the Outline of Black Land Protection Plan in Northeast China (20172030) (the BLPP) in June of 2017 [6]. Has the BLPP effectively reduced industrial pollution in the black land area? The purpose of this study was to explore whether remedial policies like the BLPP have reduced industrial pollutant emissions in the black land area and the extent of reduction since its implementation in the black land of northeast China.
This research contributes to the empirical literature on the effect of land protection policy on land pollution. Previous studies focused on the evolution of remedial policies for black soil protection, but lacked empirical evaluations of remedial policies. By using SCM, as well as several robust checks, this paper provides rigorous evidence of the causal effect of the remedial policies for the black land area and the reduction of industrial pollution emissions.
The remainder of the paper is organized as follows. Section 2 presents the literature review. Section 3 describes the BLPP. Section 4 presents the data and methods used for the estimation of industrial emission reductions. Section 5 presents the results of the empirical analysis, as well as several robustness checks. Section 6 talks about the limitations of this study. Finally, Section 7 concludes.

2. Literature Review

Our literature review was focused mainly on two areas: the protection of black land in northeast China and an evaluation of the environmental effects of policies.
There are three main approaches to strengthen the protection of black land. The first is to make changes in farming methods. Traditional farming methods focus on improving the land utilization rate as much as possible and improving the yield per unit area of black land. Addressing cultivation-related methods of protecting black land, Yang [7], Yu et al. [8], and Wang et al. [9] respectively proposed that traditional cultivation methods should be modified and suggested innovative measures such as crop rotation, land fallowing, and optimization of planting structures to protect black land. The second approach is ecological environment construction. As the central link between the organic and inorganic worlds, soil has a close relationship with water and air pollution. Therefore, it has received increasing attention in environmental pollution research [10]. The third is the proposal and implementation of a black land protection policy. In recent years, policies and legislation that address black land have attracted increasing attention from government at all levels. Li et al. [11] proposed that the ecological protection and restoration of black land in northeast China must rise to the level of national law to highlight the seriousness and importance of such protection. Environmental control laws and regulations mainly remove human pollution sources that affect black land resources, especially in the northeast, where large industrial enterprises produce wastewater and discharge gas [12].
The other literature thread evaluated the impact of implementing relevant laws and policies that address resource protection. Zhang et al. [13] believed that the public goods attribute of environmental resources requires that control of high-pollution industrial enterprises not rely entirely on market mechanisms, but rather should be incorporated into the scope of government regulation in a timely manner. Zhang et al. [14] also believed that environmental resource policy, a type of social policy, contains certain institutional norms. He et al. [15] believed that local protection incentives and constraints, alongside promotion of structural reform within the environmental protection management system, are important institutional foundations for improving the Chinese environment and resources. However, Lin and Zheng [16] concluded that it is difficult to judge Chinese environmental and resource control policies consistently at the present stage because environmental problems involve the interests of all parties and demonstration of the extent and scope of the environmental impact is a long-term process. In addition, some scholars have pointed out that the implementation of environmental resource protection planning mechanisms in China, a large country in transition, is certain to be intertwined with other important reforms such as “central–local” governance [17]. Local government-based environmental resource protection behaviors are not only guided by the central government’s policy but also lead to further adjustment of other local government strategies [18].
A review of relevant literature on the effects of Chinese environmental policies found that some policies failed to achieve the desired effect of reducing pollution. For example, Gamper-Rabindran [19] analyzed the Chinese Environmental Protection Agency’s voluntary industrial toxics program and found that participants from several key industries did not reduce their health-index emissions of targeted chemicals more than nonparticipants. Lin [20] found that under specific pollution collection regulations in China, actual pollution from industrial plants sometimes increases as inspections increase. Thus, inspections by Chinese environmental authorities are effective in verifying self-reported pollution from factories, but not in reducing pollution. Wang et al. [21] took Chinese central environmental inspection as the research object and evaluated the effect of campaign-style law enforcement on promoting corporate environmental action. They found that central environmental inspections affect changes in environmental actions by enterprises. After implementation of central environmental inspections, the number of polluting enterprises decreased by 48% and the declines in small and micro enterprises were even greater. Some policies are also effective, based on panel data from 40 cities in the Yangtze River Economic Belt from 2004 to 2015, She et al. [22] explored the pollution situation of surface water using the difference-in-difference (DID) method, the River Chief Policy effectively improved the water quality of each tributary of the Yangtze River.
The related studies show that environmental policies cannot achieve all of the desired effects and sometimes counteract them. Thus, we need to evaluate the results and this study focused on evaluating the effect of the BLPP. We wanted to know whether the local authorities have taken measures to reduce industrial wastewater and exhaust gas discharges to protect the precious black land resources. In addition, because the government is the leading mechanism of ecological governance in China, legislation can improve local environmental quality only in areas where the government implements environmental protection strictly [23]. Existing black land research has focused on identifying the natural properties of black land and summarizing the research footprints of conservation methods [24,25]. Since there is little quantitative analysis of policy-driven improvement of local industrial waste discharge and its effect on black land conservation, this study examines the effect of the BLPP based on the synthetic control method (SCM).

3. Policy Context

Black land in northeast China, an important food base with regard to arable land, has been the subject of several protection policies in recent years. At the Chinese central governmental level, the “No. 1 Document” of the Central Government from 2015 to 2022 mentioned the protection of black land in northeast China for eight consecutive years.
In 2017, the Ministry of Agriculture, the Development and Reform Commission, the Ministry of Finance, the Ministry of Land and Resources, the Ministry of Environmental Protection, and the Ministry of Water Resources jointly issued the BLPP. The BLPP proposed to accelerate the establishment of a long-term mechanism for the protection of black land and sought to protect 250 million mu of black land by 2030. The BLPP covered the arable land in major black land-containing areas. In addition, the BLPP was intended to curb the trend of black land degradation and improve the quality of cultivated land in the northeast black land area by more than one grade on average. However, this outline policy was ambiguous and policy goals were defined, but specific implementation paths and means were not proposed. Instead, the central government hoped that local governments could explore operational policies that could meet local development conditions and could be replicated and promoted [6].
On March 30, 2018, the second meeting of the Standing Committee of the 13th People’s Congress of Jilin Province adopted the Regulations of Jilin Province on the Protection of Black Land [26]. This was the first local law on the protection of black land in China. When the Jilin Province ecological and environmental protection conference proposed to build a beautiful “Jilin Pattern”, it was clearly to make “blue sky, clear water, green mountains and black land” the most important purpose [26]. In 2020, the Ministry of Agriculture and Rural Affairs and the Ministry of Finance issued the Action Plan for Conservation Tillage of Black Land in Northeast China (20202025), which provided specific guidelines for the protection of black land [27]. In 2021, the policy of Opinions of the CPC Central Committee and The State Council on comprehensively promoting rural revitalization and accelerating agricultural and rural modernization proposed the implementation of a national black-land protection project [28]. In June of the same year, the Ministry of Agriculture and Rural Affairs and seven other departments jointly issued the Implementation Plan of the National Black Land Protection Project (20212025). It proposed that the protection and utilization of 100 million mu of black land be completed during the 14th Five-Year Plan period from an engineering perspective and clarified the content and key points of the national black land protection project [29].
The strategies review suggests that the BLPP issued in 2017 is more comprehensive for the protection of black land in northeast China. Therefore, this study takes the year 2017 as the time point of the policy issued to test whether the implementation of the BLPP reduces industrial pollution emissions significantly.

4. Research Methodology and Data Sources

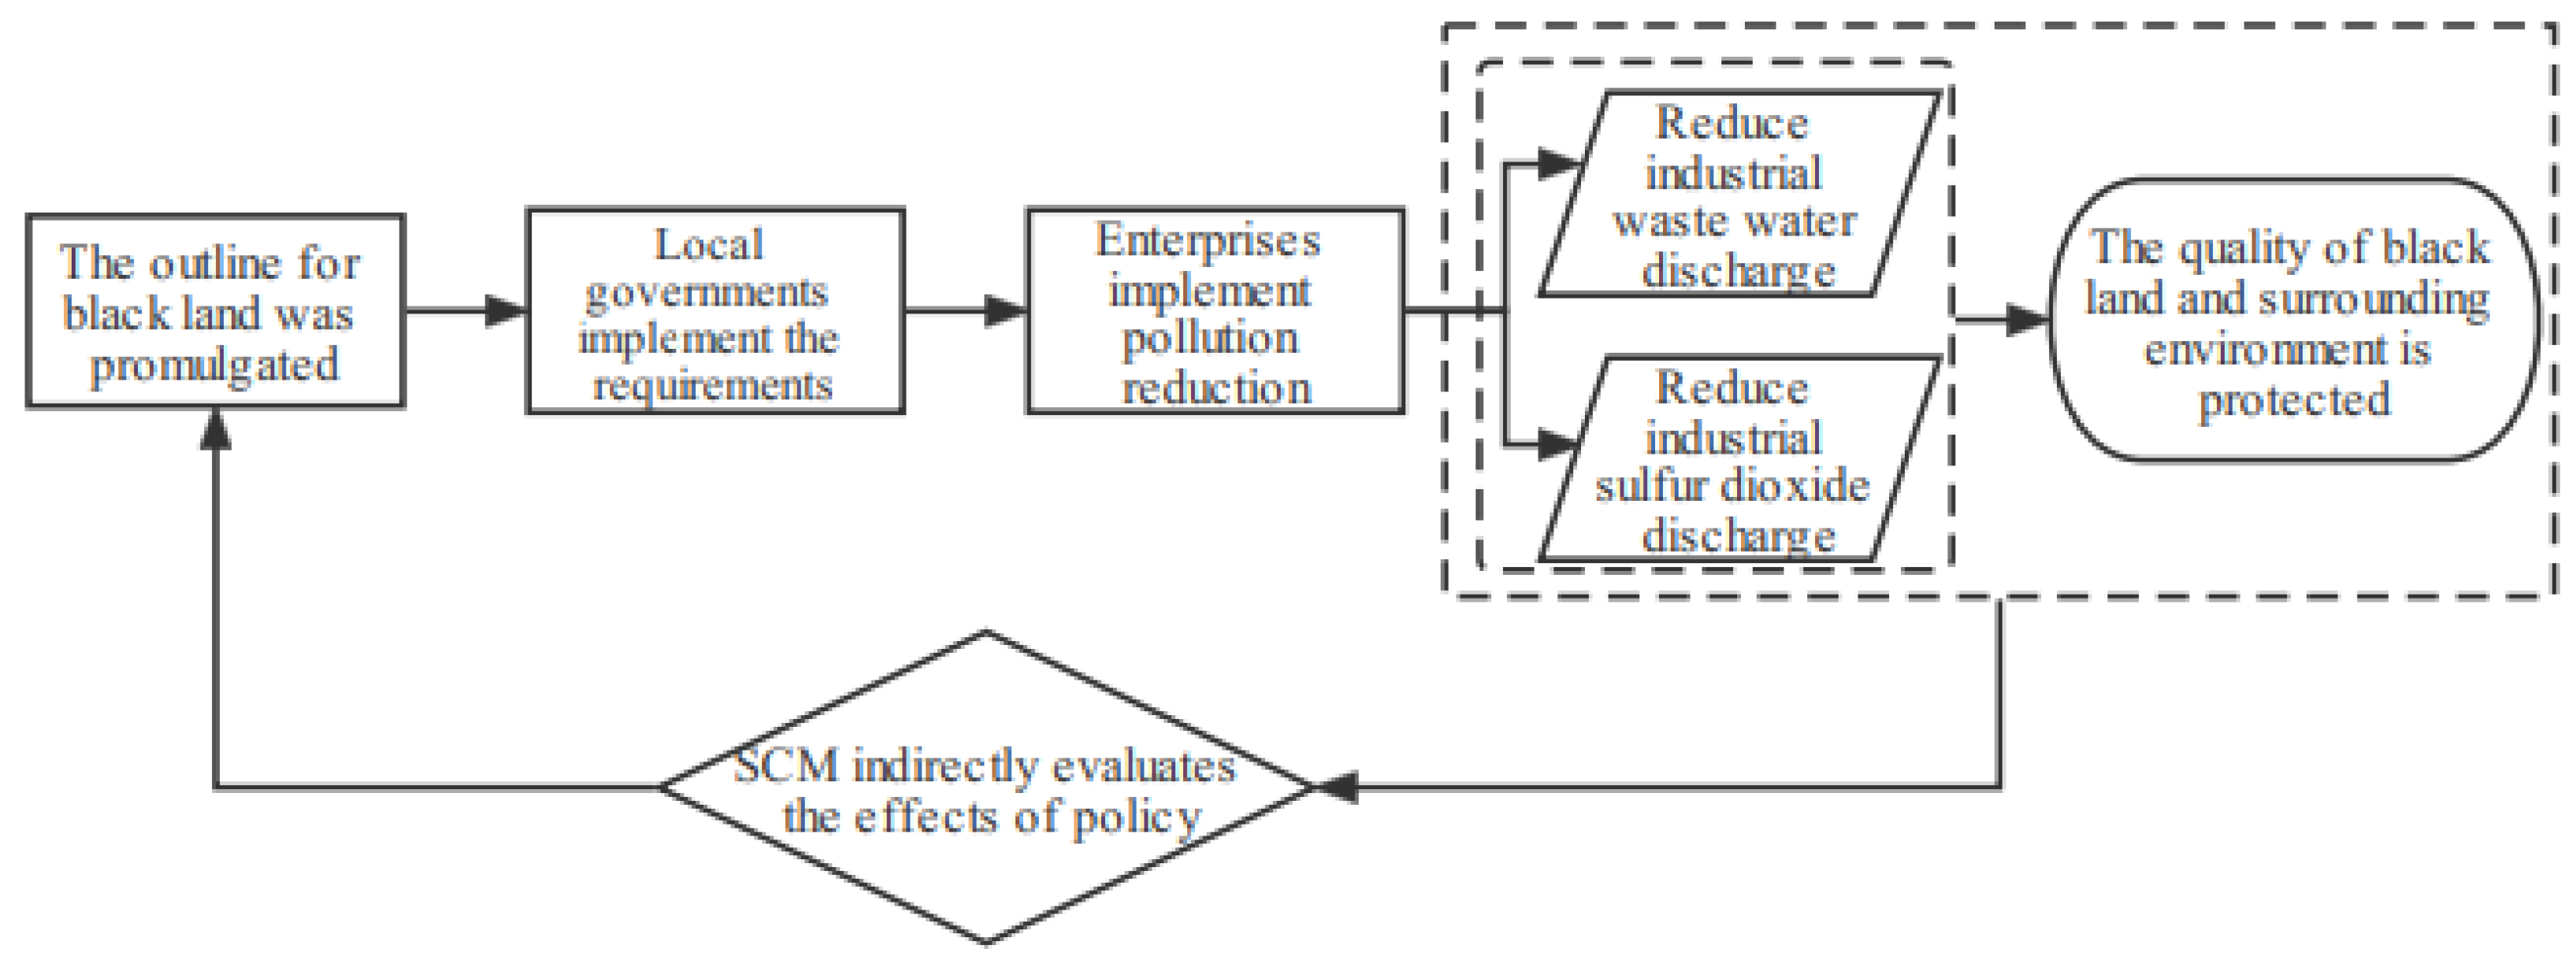
4.1. Research Outline

The promulgation and implementation of specific policies must be performed in specific government units. As an important basic economic region in China, the county-level region has a flexible economic development plan, but is easily affected by specific, strict policies. The BLPP issued in 2017 explicitly mentions the control of non-point-source pollution, with a focus on controlling emissions from industrial and mining enterprises and exogenous pollution such as urban garbage and sewage to reduce the pollution of black land. Therefore, local governments at all levels were required to take relevant measures to meet the policy requirements. The causal framework is shown in Figure 1.
Due to the vulnerability of the black land ecosystem, industrial wastewater discharge can directly affect the ecological environment of the soil and watershed. Pollutant enrichment effects are likely to damage the quality of local black land. Acid rain caused by industrial sulfur dioxide emissions has a broader impact on the ecological quality of regional black land. Therefore, this study uses the above two types of environmental pollutants to evaluate the results of the outlined policy.

4.2. Methodology

The SCM has been used widely as an advanced method of evaluating policy effects in academia [30,31,32,33,34,35,36,37]. Unlike the DID method, which focuses on subjective selection, the SCM control group is based on data selection results. The virtual control group that is most similar to the control group was constructed via data-driven selection. The choice of weights was also driven by data. This greatly reduced the error-free degree of subjective choice, solved the endogenous problem of policy to a certain extent, and ensured the reliability of the evaluation results [38]. It is feasible for one treatment group and on treatment time. This study has only one treatment group, which is the black land area of northeast China, and exactly one treatment timing, which is the year 2017. Thus, this study used the SCM method to evaluate the effect of the black land protection policy on industrial pollutant emission reduction in northeast China. The impact of the BLPP on industrial pollution emissions in the black land region was measured via a natural experiment. The typical black land region was taken as the experimental treatment group and 30 industrial pollution emission sequence data samples from other regions defined the control group.
The detailed SCM implementation steps were as follows: it was assumed that the relevant industrial pollution emission data for K + 1 regions was collected statistically in the period t [ 1 , T ] and that region i (black land), which was the subject of environmental protection planning at T 0 ( 1 T 0 T ) , was the experimental group. The other K regions were the control group, which was composed of regions that did not adopt the protection mechanism. P i t Y represents the pollution emissions from region i, which are affected by the planning outline mechanism, at time t. P i t N represents the pollution emissions from region i, which is not affected by the relevant mechanism, at time t. Let a i t = P i t Y P i t N represent the change in pollution emissions from region i, which is subject to the protection plan, within time t. D i t is a dummy variable that indicates whether it is the region where the BLPP is implemented or not. The dummy variable equals 1 if region i implements the schema at time t and 0 otherwise. The pollution emission level of region i at time t is P i t = P i t N + D i t a i t . Throughout this period, the control group is P i t = P i t N . For the experimental group, a i t = P i t Y P i t N = P i t P i t N . In this study, the change in industrial pollution emissions influenced by the policy mechanism is a i t . P i t Y represents the known industrial pollution emissions affected by the BLPP. While P i t N is unobtainable, it can be estimated using the factor model proposed by Abadie et al. [30]. The specific calculation formula is as follows:
P i t N = δ t + θ t Z i + λ t μ i + ε i t
where δ t is the time fixed effect and Z i is the observed r × 1 dimension control variable, which is not influenced by the implemented policy. In this study, the population, GDP, and industrial output of the black land region in 2005, 2010, and 2015 are selected as control variables. θ t is the 1 × r dimension unknown parameter vector, λ t is the common factor vector of the 1 × F dimension that cannot be observed, μ i is the regional fixed effect of the F × 1 dimension, and ε i t is the short-term shock that cannot be predicted and has an average value of 0. Under general conditions, k = 2 K + 1 w k P k t can be used as an unbiased estimate of P i t N if the period before the policy is longer than the period after policy implementation. Here, w k represents the regional specific weight in the SCM. Finally, the estimated a 1 t of the policy influence effect is calculated as follows:
a 1 t ^ = P 1 t k = 2 K = 1 w k P k t   ,   t [ T 0 + 1 , T ]
Let Z 1 be a k × 1 vector including the values of the pretreatment characteristics of the treated unit and Z 0 be the k × J matrix containing the values of the same characteristics for the donors. The optimal weights W * minimizes:
Z 1 Z 0 W = ( Z 1 Z 0 W ) V ( Z 1 Z 0 W )
where V is a k × k symmetric and positive semi-definitive matrix, and V reflects the relative importance of each predictor.
In a study by Bertrand et al. [39], control groups were used successively as hypothetical experimental treatment areas. Then, the SCM was used to estimate the policy protection effect on each region. This test produced effect distributions that could be compared to the actual situation in the black land region. We also used the root mean square prediction error (RMSPE) to measure the difference between the region’s real value and that of the synthetic control group. The calculation formula is as follows:
R M S P E = 1 T t = 1 T P 1 t k = 2 K + 1 w k P k t 2
where P 1 t represents the true value of the experimental group, w k represents the weight, P k t represents the value of the control group, and T is the number of time periods in a specific year. When the early fit is good, the difference of the RMSPEs measured after and before policy implementation serves to measure the degree of influence of the BLPP policy.

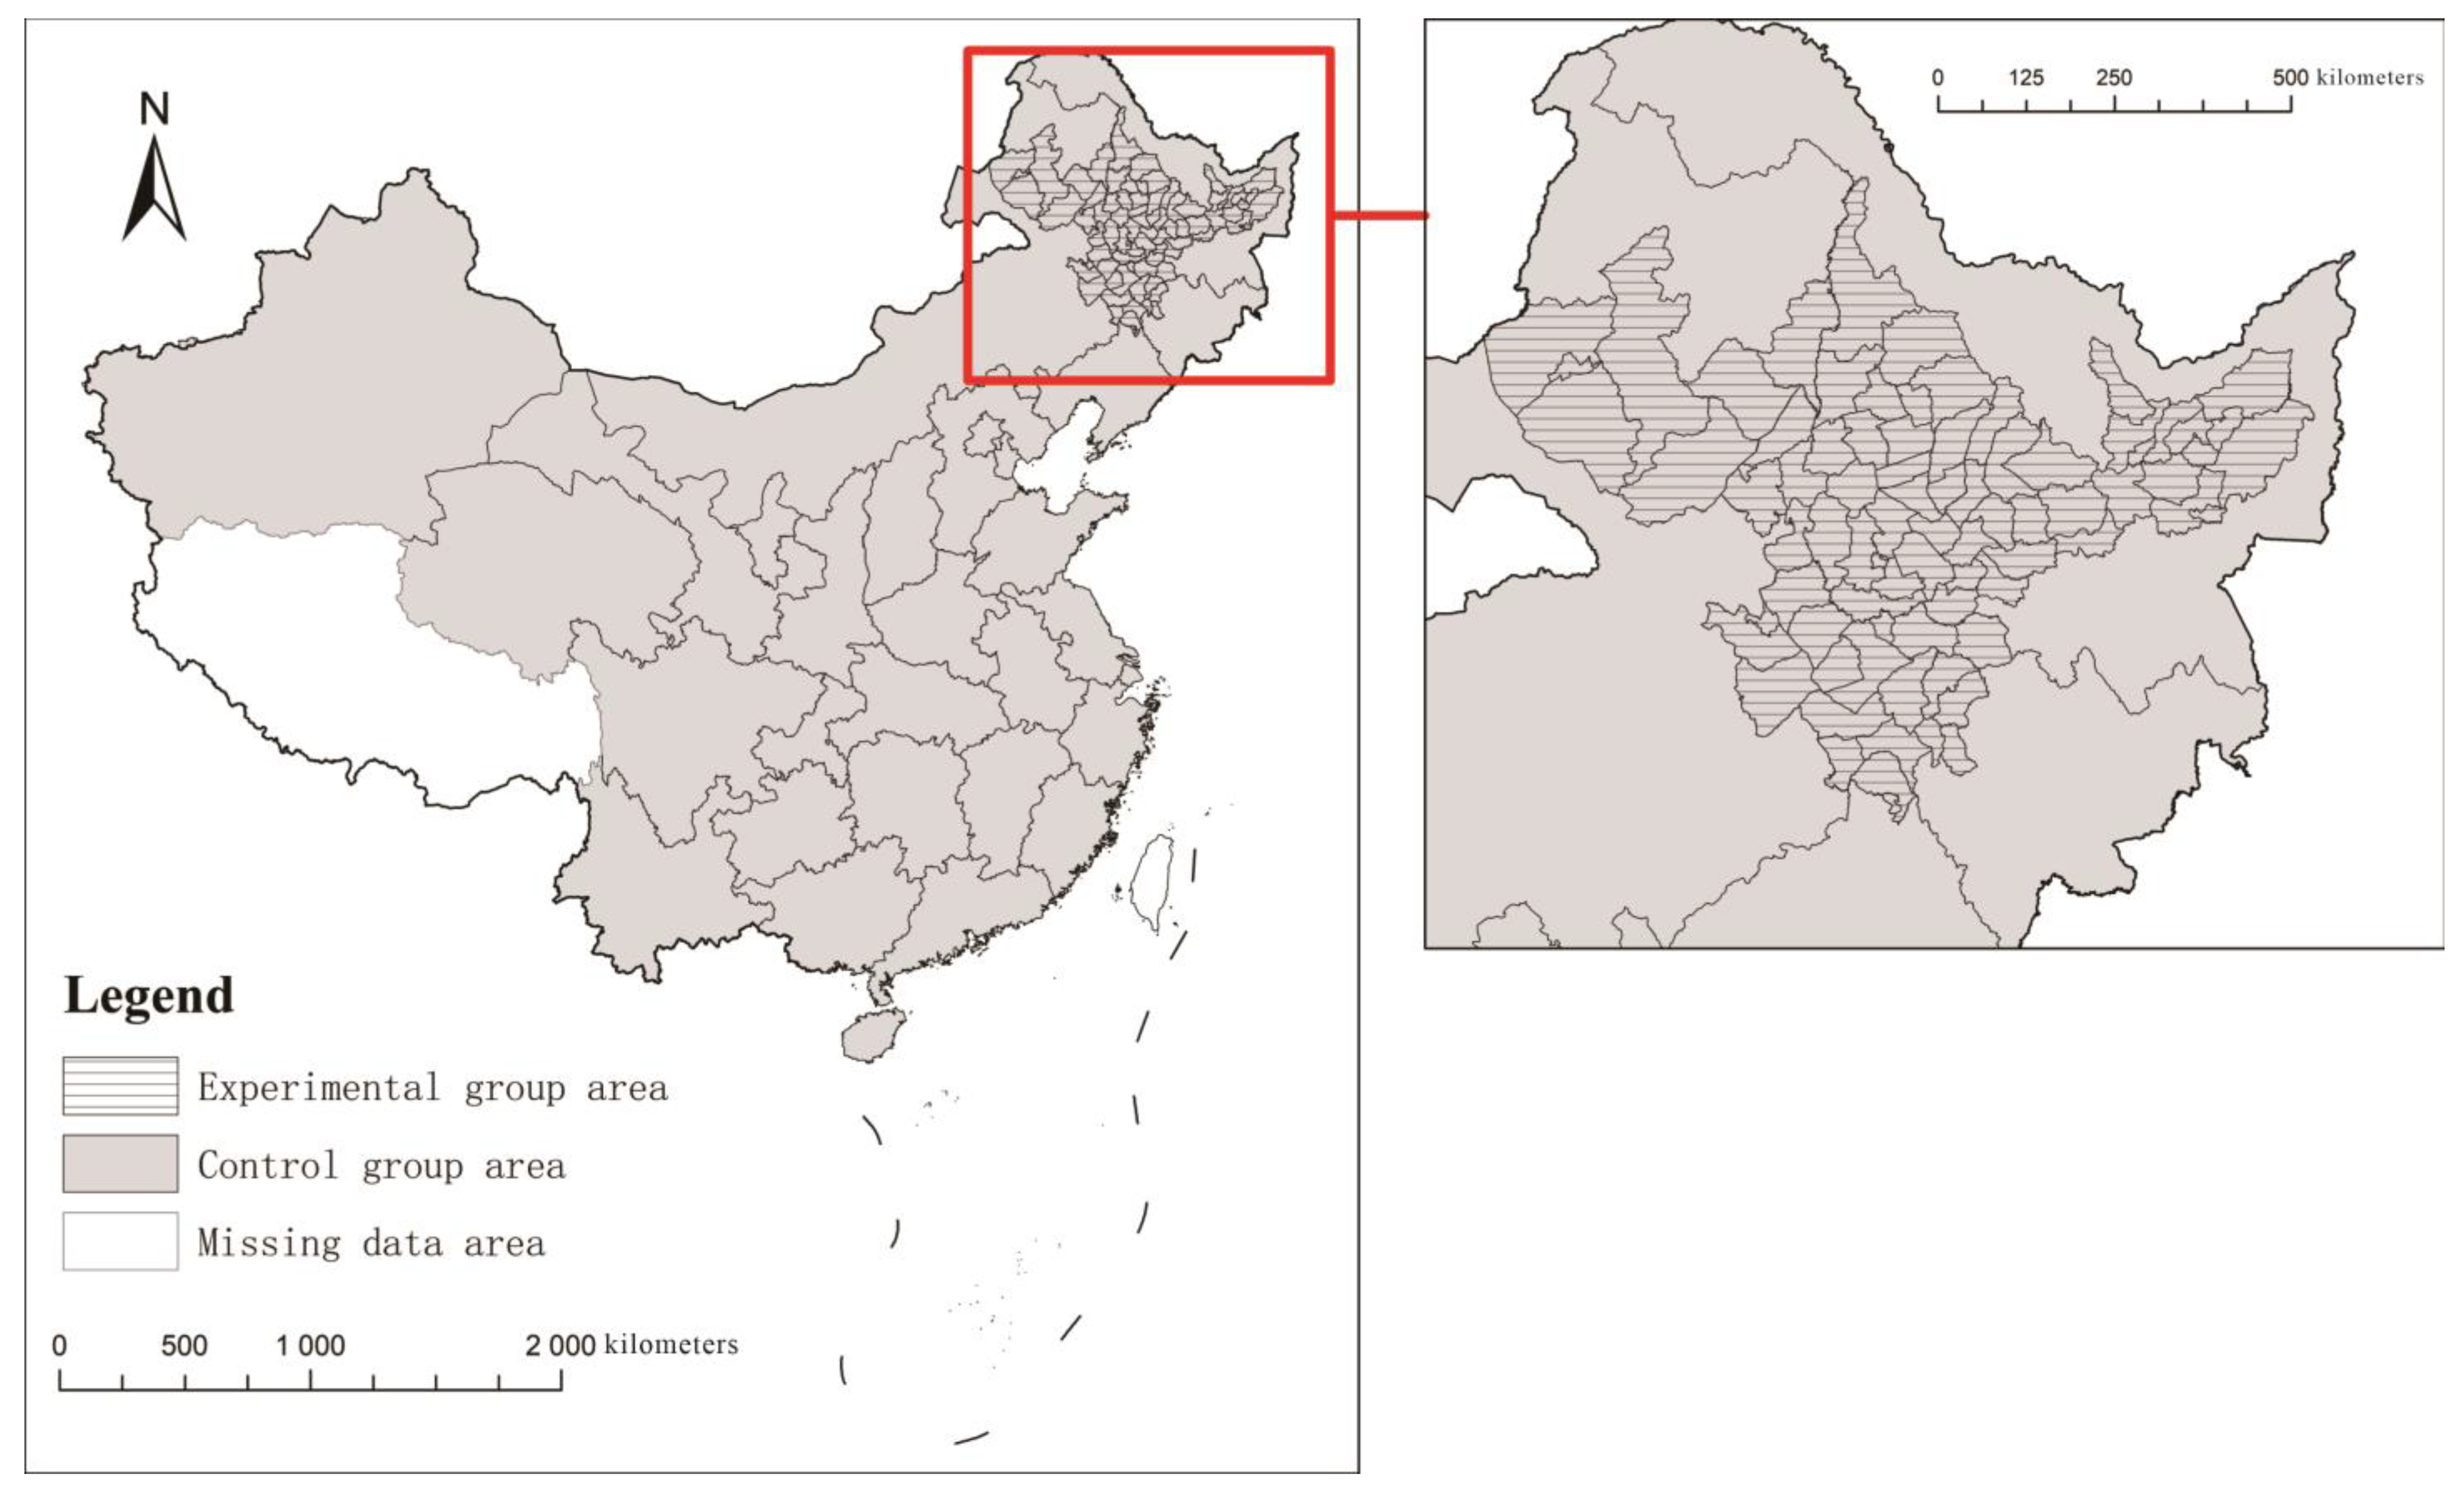
4.3. Research Area and Data

The scope of black land in this study was the boundary line of typical black soil in northeast China drawn by Liu et al. [40] using the central gravity agglomeration method. The region starts from the Great Khingan Mountains in the north and reaches the southern part of Liaoning Province in the south, the mountainous edge of the Great Khingan Mountains in eastern Inner Mongolia in the west, and the Ussuri and Tumen Rivers in the east. It covers parts of Liaoning, Jilin, and Heilongjiang provinces, as well as the eastern part of Inner Mongolia. According to the second national land survey data and the county-level cultivated land quality survey evaluation results, approximately 278 million mu (a Chinese unit of area, equal to 1/15th of a hectare or 1/6th an acre) of typical black land have been cultivated in northeast China. This accounts for 1/4th of the country’s arable land. Separately, Inner Mongolia accounts for 0.25 million mu, Liaoning province for 0.28 million mu, Jilin Province for 0.69 million mu, and Heilongjiang province for 156 million mu. At the same time, the black land in northeast China accounts for 1/4th of national grain output, 1/4th of commercial grain in the country, and 1/3rd of the total grain transfer volume nationally [1]. This zone included 73 county-level regions, which became part of the experimental group. The zone included 15 prefecture-level cities in three provinces. Thirty regions in other provinces (excluding Tibet, Hong Kong, Macao, and Taiwan) were used as the control group. The regions are shown in Figure 2.
The industrial pollution emission data used in this study were from the China Statistical Yearbook on Environment (20052021), China City Statistical Yearbook (20052021) and related Chinese provincial statistical yearbooks, and the population and socio-economic indicator data at the county level were from the China Statistical Yearbook (County-Level) (20052021) 1. However, small amounts of missing statistical data had to be added via multiple-item fitting to ensure data integrity. Then, it would be taken as the logarithm for these original data of industrial wastewater and sulfur dioxide emissions in the model.
Due to missing data in the available information on the county-level units in the black land area, it is difficult to obtain the economic and environmental data. For example, it is difficult to obtain the economic and environmental data of the counties in Inner Mongolia, which makes it difficult to use the industrial pollution emission estimation of the county-level administrative unit in this paper. Considering that the economic development level of each county-level unit in the black soil area is nearly the same, the proportion of population size represents the relative intensity of economic activities. Therefore, for some missing environmental data, the proportion of population size of each county in the municipal level and the industrial pollution emission of the municipal are introduced to estimate the industrial pollution emission of the county. The specific formula is as follows:
E i , c = p i ,   c P c · e c
where i represents a county-level region, c represents the prefecture-level city to which the county belongs, p i , c represents the population of the county-level region, P c represents the total population of the prefecture-level city, e c represents the total pollutant emission value of the prefecture-level city, and E i , c represents the calculated pollutant emission data for a specific county. This calculation method is also used for estimation of other missing data of a county-level region. Partial original industrial waste discharge data are shown in Table 1.

5. Results

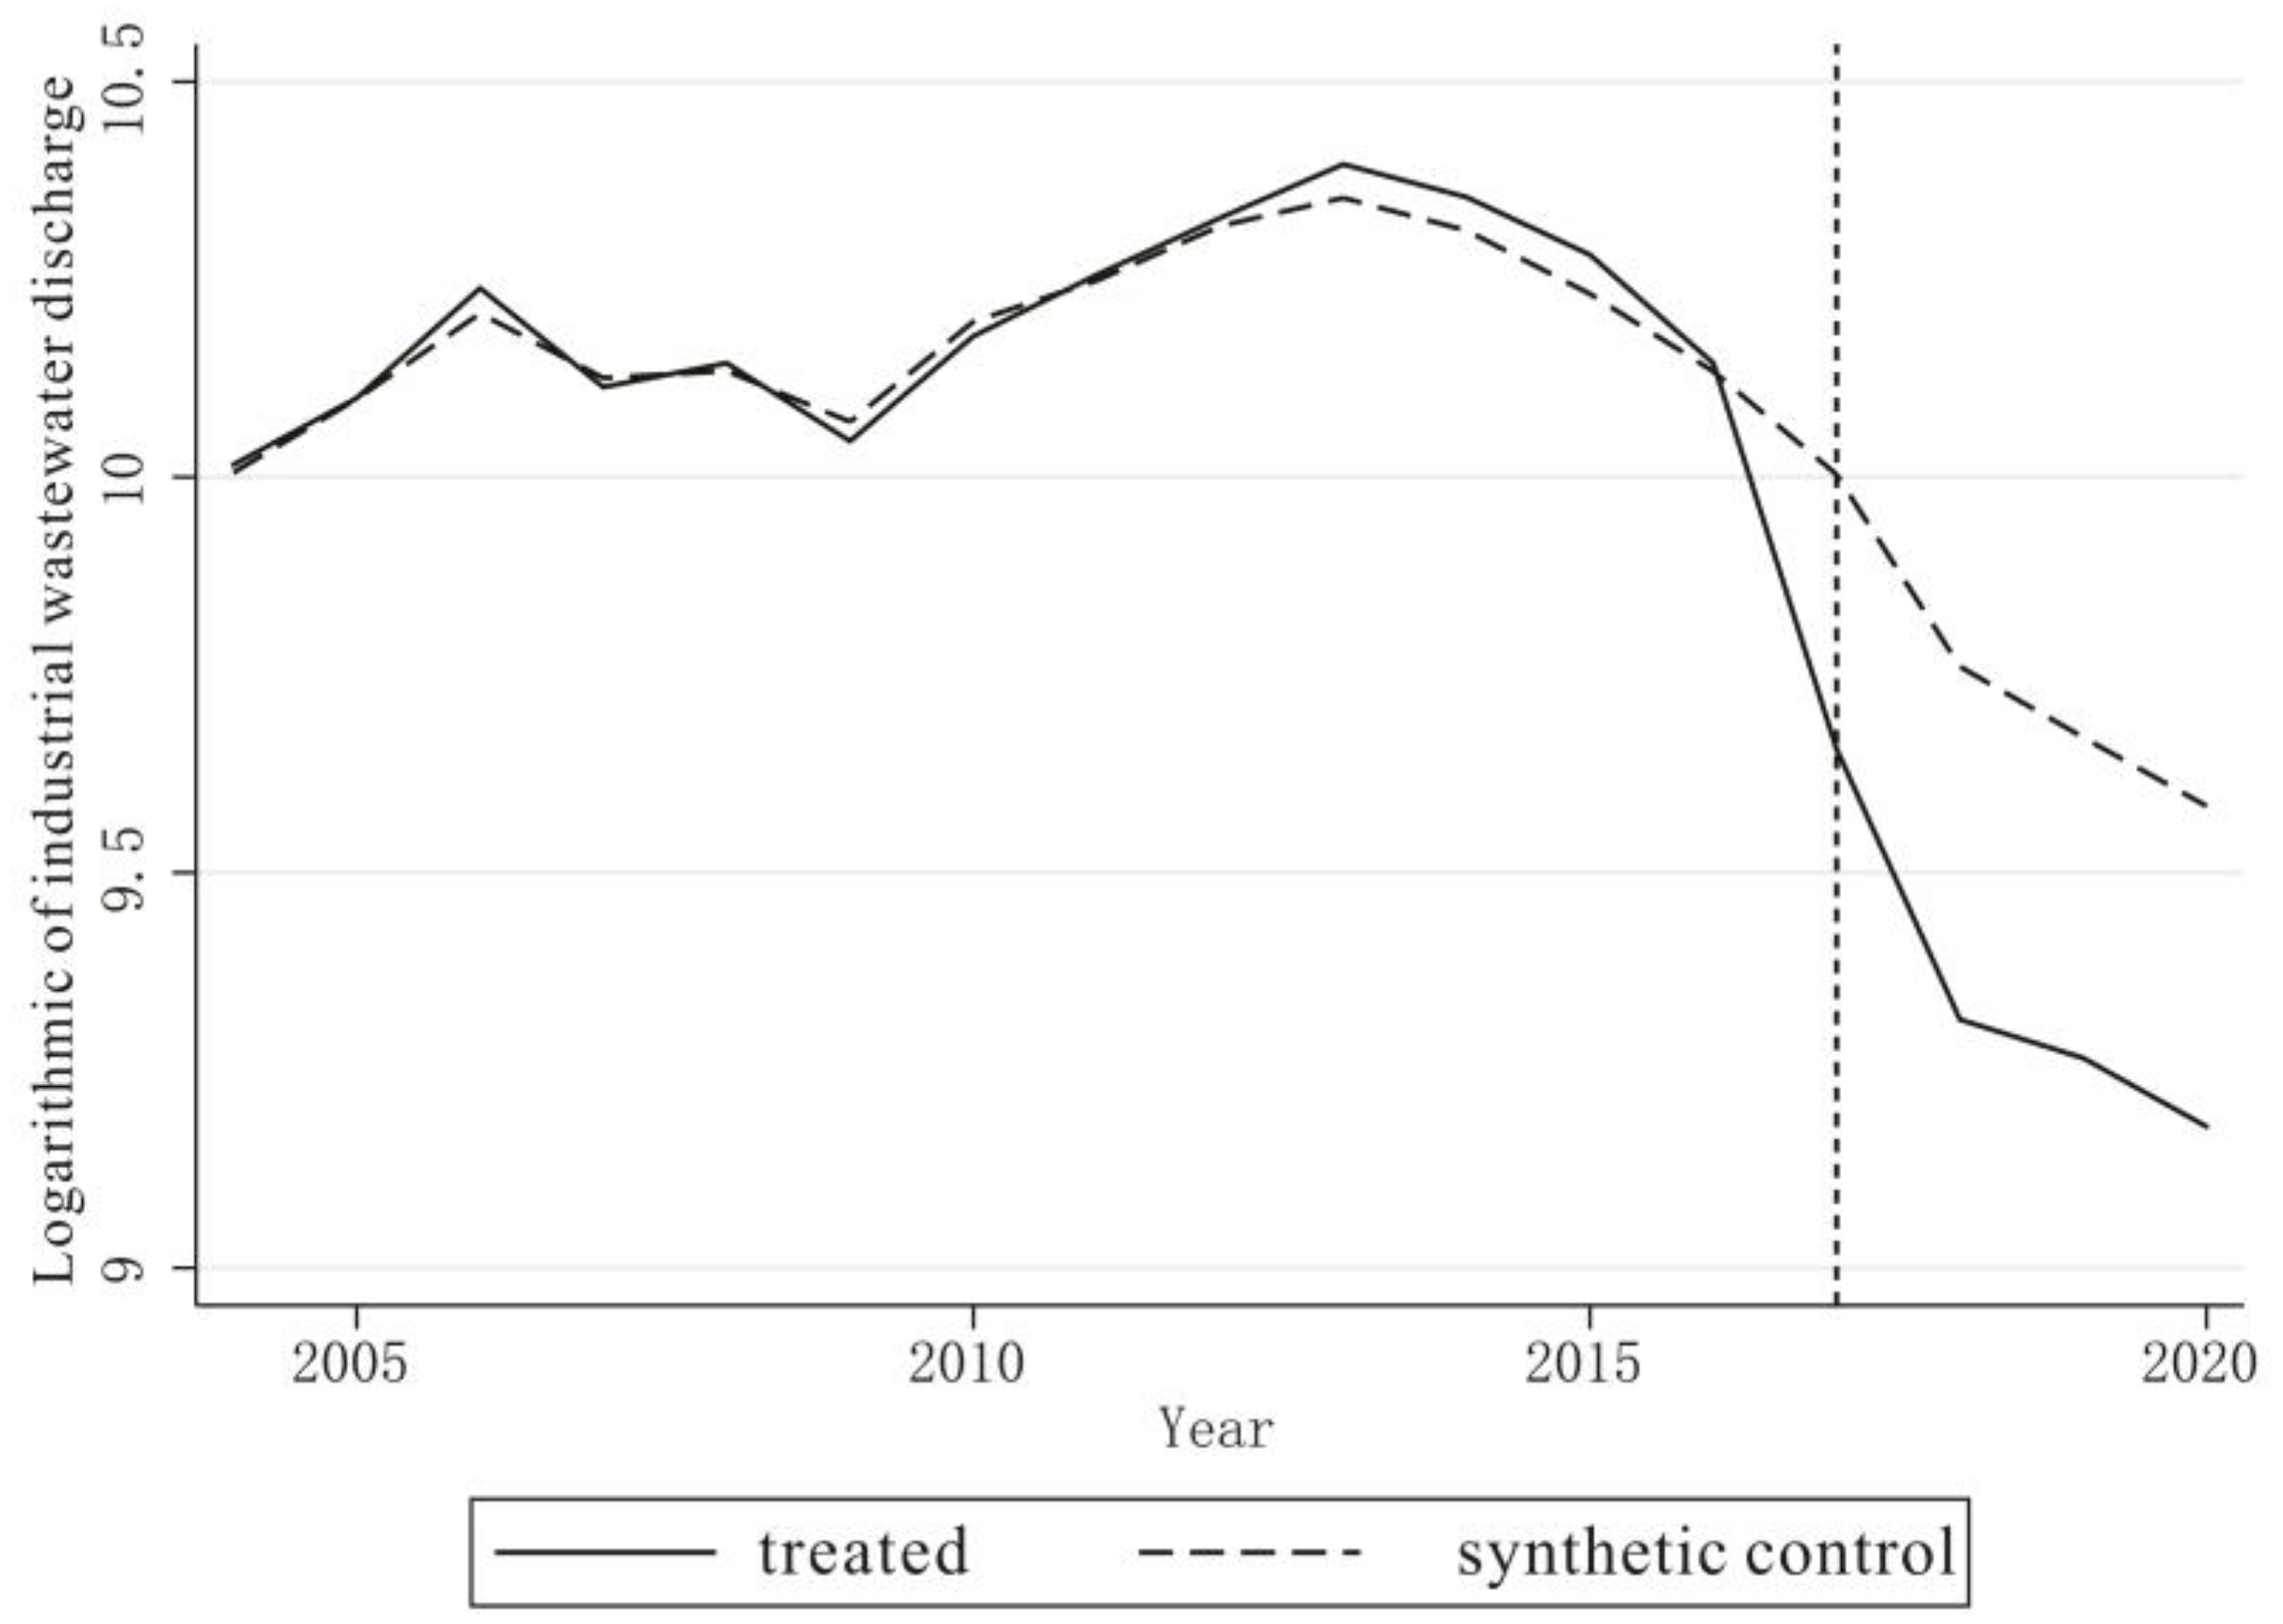
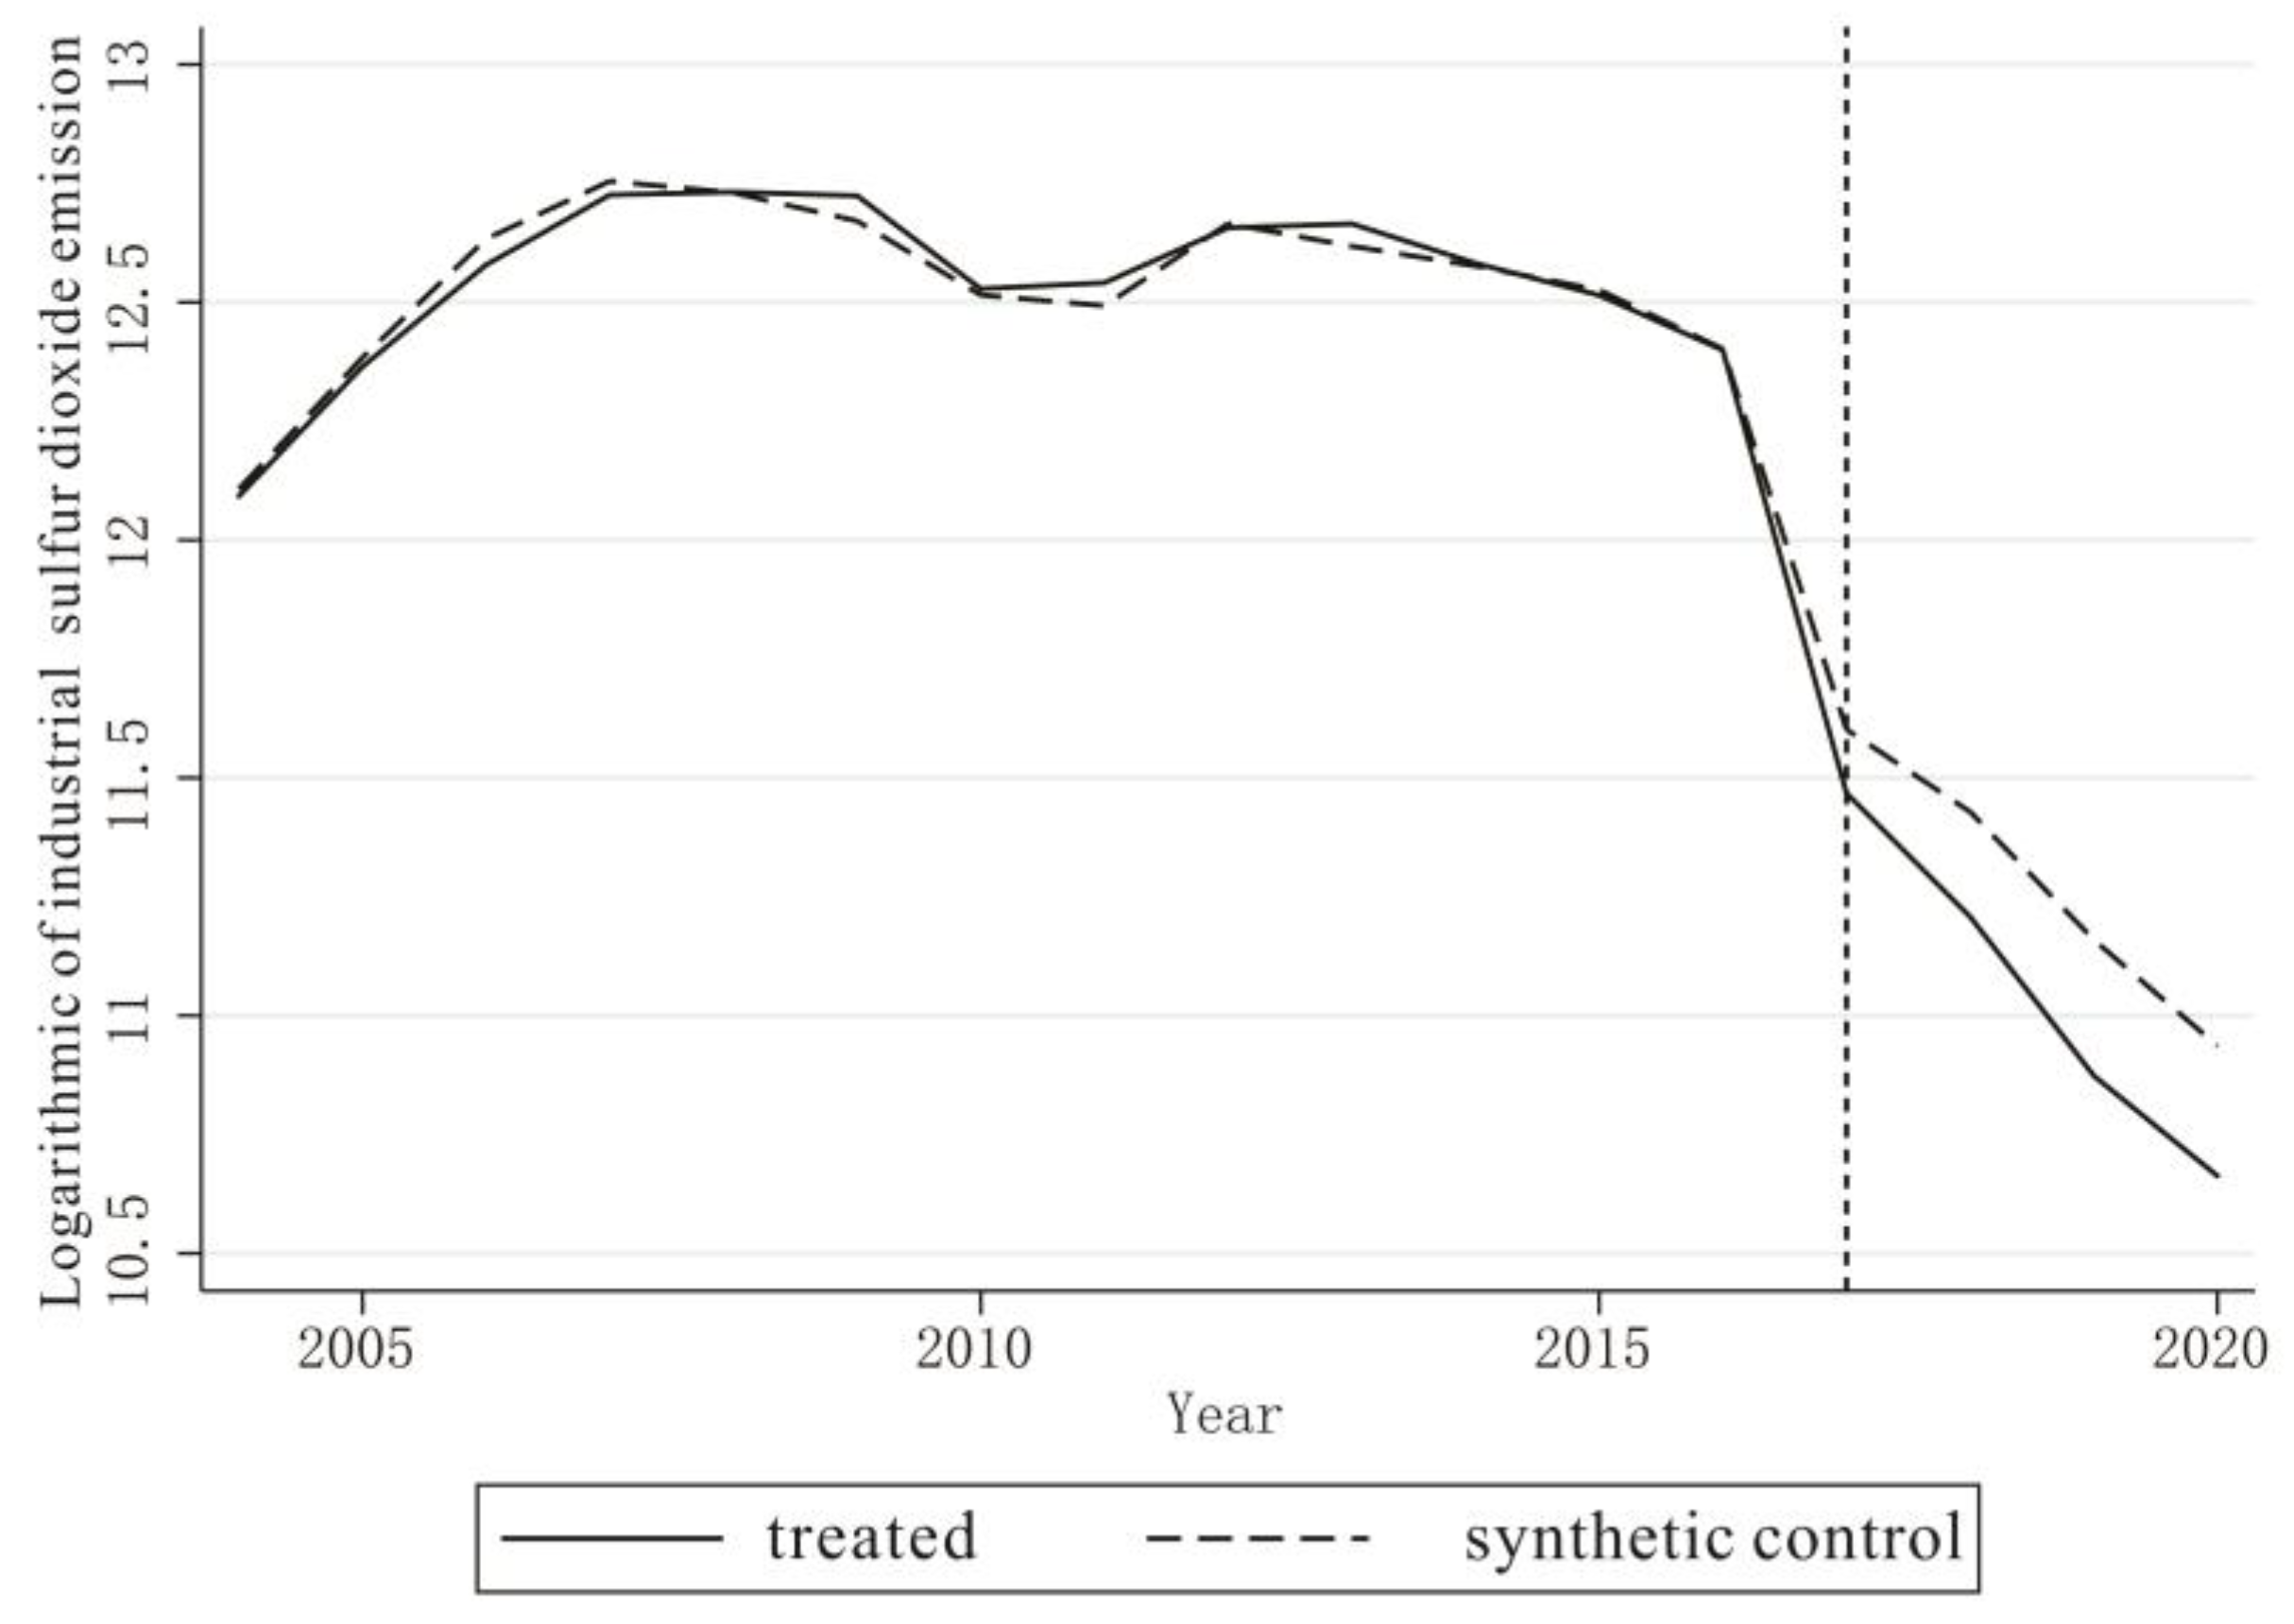
5.1. Baseline Results

The counterfactual results were synthesized by assigning weights to each region in the control group. The weights assigned to each region are shown in Table 2. According to Table 2, the weights of industrial wastewater discharge of non-black soil in Jilin, Heilongjiang, Inner Mongolia, Xinjiang, and other provinces and regions are 56.9% (the highest), 11.4%, 9.3%, 6.8%, and less than 5%, respectively. Similarly, the weights of industrial sulfur dioxide emissions of non-black soil areas in Jilin province, Inner Mongolia, and Xinjiang account for 68.3% (the highest), 28.4%, and 3.3%, respectively. The weight of the Jilin non-black land area accounts for the largest proportions in both groups because it has more similarity to the black land area.
We took the population, GDP, and total output value of industries as control variables. It could display higher accuracy of the fitting results obtained via the SCM [41]. The fitted and real results for the selected control variables are shown in Table 3. There are small differences from the real data. The fitted result is satisfying for black land regions before 2017. Thus, we can take the synthetic data as the counterfactual results of the black land and use them to analyze the impacts of the BLPP issued in 2017.
In Figure 3, the synthetic industrial wastewater discharge trend is quite consistent with that noted before implementation of the BLPP (before 2017). After 2017, the industrial wastewater discharges in the real black land area are lower than those in the synthetic black land area. This indicates that the policy effect is significant. Promulgation of the BLPP has a direct impact on industrial wastewater discharge, which is nearly 29.3% lower over the past four years (2017–2020) than that from the synthetic black land dataset.
According to Figure 4, the industrial sulfur dioxide emission trends for the synthetic black land area also fit quite well with those in the real black land area before the BLPP issued in 2017. After implementation of the BLPP, the actual industrial sulfur dioxide emission is slightly lower than the synthetic data. This indicates that industrial sulfur dioxide emissions in the black land area may have been curtailed after promulgation of the BLPP, and that the policy has a significant impact. Quantitatively, the industrial sulfur dioxide emission in the black land area decreased by approximately 12% in 2020 compared with that in the synthetic black land area.

5.2. Robustness Tests

We performed a placebo test to ensure the robustness of the results. The core idea of the placebo test is the creation of a fictitious treatment group or a fictitious policy timing. If the regression results produced by the estimators using different fictional methods remain significant, the original estimates are likely to be wrong and the changes in variables may be affected by other policy changes or random factors. Therefore, in this study, we used a fictitious treatment group to synthesize 30 control group regions sequentially.
The ratios of the post- to prior-intervention RMSPEs for the discharge of industrial wastewater and industrial sulfur dioxide emissions in the black land area and the 30 control group areas were calculated. However, to avoid problems caused by large errors and ensure the accuracy of the robustness test, we excluded provinces and regions in the control group whose prior-intervention RMSPE values were more than twice that of the experimental group by referring to the practice of Abadie et al. [38]. We took 2017 as the time node. A smaller prior-intervention RMSPE means a better fit, while larger post-intervention RMSPE indicates that the object is affected by the policy. Figure 5 and Figure 6 show changes in industrial wastewater discharges and sulfur dioxide emissions, respectively, in the black land area and in the control regions after policy implementation. The bold orange line represents the treatment effect in the black land area and the remaining lines represent the placebo effects in the control regions.
Table 4 shows the placebo test results, which include the RMSPE of the industrial wastewater discharge in the black land area and each control region. The small prior-intervention RMSPE in the black land area indicates that the fit is good before BLPP implementation. If the ratio is the largest, the area has the most significant change in industrial wastewater discharge upon the policy’s implementation. After eliminating part of the control group, 19 regions remain. Figure 5 shows that since the year 2017, compared with other regions (grey lines), the black land area (orange line) has had more significant changes in industrial wastewater discharge. This means that there is a 1/20 or 5% probability of rejecting the significant result. Therefore, the placebo test demonstrates that the BLPP has a highly significant effect on industrial wastewater discharges in the black land area.
The placebo test was also applied to obtain RMSPE values for industrial sulfur dioxide emissions in the black land area and other control regions. As shown in Table 5, the prior-RMSPE value in the black land area is small. This indicates that the fit is good. Based on the ratios of the post- to prior-intervention RMSPEs, the BLPP has an obvious impact on industrial sulfur dioxide emission reduction. After excluding unqualified control regions, the remaining 20 control regions were compared with the black land area. Figure 6 also displays that compared with other regions (grey lines), the black land area (orange line) has had a more significant change in industrial sulfur dioxide emissions since 2017. We conclude that the probability of industrial sulfur dioxide emission reduction in the black land area affected by the BLPP reaches more than 95%. Thus, it passes the placebo test.
In addition to the placebo test, we referred to the methods of Li et al. [42], who used the DID method. The specific DID method steps are as follows:
Y i t = β 0 + β 1 · T r e a t i t × P e r i o d i t + k = 1 3 γ k Z i t k + u i + τ t + ε i t
where Y i t is the explained variable for the region i and time t, and both T r e a t i t and P e r i o d i t are dummy variables in region i and time t. The coefficient β 1 of the interaction term T r e a t i t × P e r i o d i t reflects the effect of the BLPP. In addition, Z i t k (k = 1, 2, 3) is the control variable, u i is the individual fixed effect term, and τ t is the time fixed effect term. We still use the black land area as the treatment group and the rest of the area as the reference group. The DID results are shown in Table 6 and Table 7. Regardless of whether the control variables (population, GDP, and the value of industrial output) are added or not, the BLPP has an obvious significant effect on reducing industrial wastewater discharges and industrial sulfur dioxide emissions in the region with a dual time and region fixed effect (iii and vi). Thus, the robust effect of BLPP is verified further.

6. Discussions

Under China’s rapid urbanization and industrialization in recent decades, land pollution has become an unavoidable problem in the sustainable development of black land. Numerous remedial policies have been raised and implemented [7]. Such policies may face consistency and effectiveness problems [43]. Some studies have evaluated the effects of the remedial land protection policies, such as the arable land reduction effect [44], the positive economic impacts [45], etc., while there is little empirical evidence on how the remedial land protection policies affect the industrial pollution.
This study takes the implementation of the BLPP as a natural experiment to study the causal environmental impact of the BLPP. Our results find that after the implementation of the BLPP, the industrial wastewater discharges and sulfur dioxide emissions of the black land region were reduced significantly. This shows that the BLPP is crucial for protecting the black land region, which is also in accordance with the current research [7]. The results also show that the BLPP’s effect is much greater for reducing industrial wastewater discharges than industrial sulfur dioxide emissions. A possible reason for this difference is that industrial wastewater discharges reduction is a more urgent factor in black land protection.
The results are also consistent with many other existing studies, which also found that land protection policies have effects on land protection, which includes arable land loss [44] and positive economic effects [45]. While the method employed to evaluate the effects of land protection policies varies, Zhong et al. [46] used the probit model and Sims et al. [45] used the fixed-effect model. With the SCM being widely used in the evaluation of policy impact, in this study, the SCM was applied to evaluate the environmental impact of the BLPP, and the results are more robust and convincing compared to the probit and fixed-effect models because of its natural-experiment setting. In this study, the pretreatment period is 2004 to 2016, which fulfills the requirement of the SCM. The characteristics of the synthetic control unit and treatment unit fit well in the pretreatment period, which tells us that the synthetic control is a better control for the causal effect of the BLPP. The causal inference method can be widely used in land research.
In addition, one may further question how industrial pollution reduction affects land quality and productivity, for what we really care about is how the BLPP improved the black land. Although it is well known that industrial pollution is one of the causes of harm to the black land [12], the impact of the industrial pollution on land quality may take more time to play a role and this also needs to be evaluated.
However, our research still needs to be furthered in three aspects. First, land contains other types of pollution that are not covered in our research, such as heavy metal pollution and solid waste pollution. Second, our research only provides an early-impact evaluation of the BLPP; the long-term effect should also be investigated. Third, the mechanism of how the BLPP affects the industrial pollution and the heterogeneity of the effect in different regions of black land are not discussed in this paper.

7. Conclusions

The typical black land area is an important soil resource in China, known as the northeast granary. In 2017, six departments jointly issued the BLPP to strengthen the protection of the black land. The discharge of large quantities of industrial waste into the black land regions was the most serious factor driving the destruction of the black land. Using SCM, we assessed whether the BLPP could effectively reduce industrial wastewater discharges and sulfur dioxide emissions in the black land area so that it could improve environmental quality and protect the overall external environment. The results show that industrial pollution emissions in the black land area did indeed decrease significantly after the BLPP was issued in 2017 compared with the previous situation. By 2020, industrial wastewater discharges in the black land area decreased by 29.3% compared to in the synthetic black land area, while industrial sulfur dioxide emissions decreased by 12%. Both of these effects passed robustness tests that involved placebo tests and other estimation methods.
This study shows that as a remedial policy to protect the quality of the black land in northeast China, the BLPP has achieved substantial results; the early impact of the BLPP on the reduction of industrial pollution is significant. This tell us that future designs should continue to be implemented.

Author Contributions

Conceptualization, Z.T. and J.Z.; methodology, J.Z. and Z.T.; software, W.S.; validation, Z.T. and J.Z.; formal analysis, Z.T. and J.Z.; investigation, Z.T. and W.S.; data curation, W.S.; writing—original draft preparation, W.S. and Z.T.; writing—review and editing, J.Z.; visualization, W.S. All authors have read and agreed to the published version of the manuscript.

Funding

This research was funded by the Strategic Priority Research Program of the Chinese Academy of Sciences (grant number XDA28060301) and the National Natural Science Foundation of China (No. 41430636).

Institutional Review Board Statement

Not applicable.

Informed Consent Statement

Informed consent was obtained from all subjects involved in the study.

Data Availability Statement

Not applicable.

Conflicts of Interest

The authors declare no conflict of interest.

Note

1
Chinese National Knowledge Infrastructure. Chinese Journal Full-text Database. https://www.cnki.net/, accessed on 18 January 2022.

References

  1. Liang, J. Suggestions on the treatment of industrial waste gas and wastewater. Encycl. Form. 2020, 17, 197. (In Chinese) [Google Scholar] [CrossRef]
  2. Hao, M.Y.; Zhu, X.Y. Sources and effects of soil heavy metal pollution. Jiangsu Salt Sci. Technol. 2017, 1126. (In Chinese) [Google Scholar] [CrossRef]
  3. Bourliva, A.; Papadopoulou, L.; Aidona, E.; Giouri, K. Magnetic signature, geochemistry, and oral bioaccessibility of “technogenic” metals in contaminated industrial soils from Sindos Industrial Area, Northern Greece. Environ. Sci. Pollut. Res. 2017, 24, 17041–17055. [Google Scholar] [CrossRef] [PubMed]
  4. Hu, H.; Han, L.; Li, L.; Wang, H.; Xu, T. Soil heavy metal pollution source analysis based on the land use type in Fengdong District of Xi’an, China. Environ. Monit. Assess. 2021, 193, 643. (In Chinese) [Google Scholar] [CrossRef]
  5. Niu, S.D.; Lyu, X.; Gu, G.Z. Research on the impact of perceived benefits on farmers’ behavior decision-making of black soil protection: A typical sample of “Lishu Pattern”. Sci. Land. Sin. 2021, 35, 44–53. (In Chinese) [Google Scholar]
  6. Ministry of Agriculture and Rural Affairs, PRC. Outline of Black Land Protection Plan in Northeast China (2017–2030); Beijing, China, 2017. Available online: http://www.moa.gov.cn/nybgb/2017/dqq/201801/t20180103_6133926.htm (accessed on 1 December 2021).
  7. Yang, W.Y. Overview of Agronomy; China Agriculture Press: Beijing, China, 2011. (In Chinese) [Google Scholar]
  8. Yu, L.; Zhang, B. The degradation situations of black soil in China and its prevention and counter measures. Arid Land Resour. Environ. 2004, 18, 99–103. (In Chinese) [Google Scholar]
  9. Wang, Y.L.; Fang, S.Q.; Zhang, Q.; Jiang, G.G. Resources development makes use of the present condition protection counterplan JiIin Province. J. Jilin Agric. Univ. 2010, 32, 57–59. Available online: https://kns.cnki.net/kcms/detail/detail.aspx?dbname=cjfd2010&filename=jlny2010s1021&dbcode=cjfq (accessed on 4 March 2022).
  10. Xu, M.G.; Zeng, X.B.; Huang, H.X. Development trend and priority research area of current soil science. China Soils Fert. 2006, 6, 1–7. (In Chinese) [Google Scholar]
  11. Li, W.B.; Li, M. Ecological protection and restoration of black soil in Northeast China. Acad. Exch. 2014, 7, 151–155. (In Chinese) [Google Scholar]
  12. Ren, J.M.; Ma, Y.J. Studies on the spatiotemporal dynamics of industrial pollution in Northeast China. Acta Sci. Circumst. 2018, 38, 2108–2118. [Google Scholar]
  13. Zhang, J.X.; Cai, N.; Yang, C. Impact of environmental regulation on green growth index of industry in China. China Pop. Resour. Environ. 2015, 25, 24–31. [Google Scholar]
  14. Zhang, Q.; Yu, Z.; Kong, D. The real effect of legal institutions: Environmental courts and firm environmental protection expenditure. J. Environ. Econ. Manag. 2019, 98, 102254. [Google Scholar] [CrossRef]
  15. He, Q. Fiscal decentralization and environmental pollution: Evidence from Chinese panel data. China Econ. Rev. 2015, 36, 86–100. [Google Scholar] [CrossRef]
  16. Lin, B.C.; Zheng, S. A new direction in environmental economics. J. Econ. Surv. 2016, 30, 397–402. [Google Scholar] [CrossRef]
  17. Liu, Y.; Chen, Z. Environmental regulations in China: Policies and their effects. Comp. Econ. Soc. Syst. 2016, 1, 164–173. (In Chinese) [Google Scholar]
  18. Chu, Z.P.; Chen, B.; Liu, C.X.; Zhu, J. Evolutionary game analysis on haze governance in Beijing-Tianjin-Hebei: Based on a simulation tool for proposed environmental regulation policies. China Pop. Resour. Environ. 2018, 28, 63–75. (In Chinese) [Google Scholar]
  19. Gamper-Rabindran, S. Did the EPA’s voluntary industrial toxics program reduce emissions? A GIS analysis of distributional impacts and by-media analysis of substitution. J. Environ. Econ. Manage. 2006, 52, 391–410. [Google Scholar] [CrossRef]
  20. Lin, L. Enforcement of pollution levies in China. J. Public Econ. 2013, 98, 32–43. [Google Scholar] [CrossRef]
  21. Wang, H.; Fan, C.; Chen, S. The impact of campaign-style enforcement on corporate environmental Action: Evidence from China’s central environmental protection inspection. J. Clean. Prod. 2021, 290, 125881. [Google Scholar] [CrossRef]
  22. She, Y.; Liu, Y.; Jiang, L.; Yuan, H. Is China’s River Chief policy effective? Evidence from a quasi-natural experiment in the Yangtze River Economic Belt, China. J. Clean. Prod. 2019, 220, 919–930. [Google Scholar] [CrossRef]
  23. Bao, Q.; Shao, M.; Yang, D.L. Environmental regulation, provincial legislation and pollution emission in China. J. Econ. Res. 2013, 48, 42–54. (In Chinese) [Google Scholar]
  24. Han, X.Z.; Zhou, W.X. Research perspectives and footprint of utilization and protection of black soil in northeast China. Acta Pedol. Sin. 2021, 58, 1341–1358. (In Chinese) [Google Scholar]
  25. Han, X.Z.; Li, N. Research progress of black soil in Northeast China. Sci. Geogr. Sin. 2018, 38, 1032–1041. (In Chinese) [Google Scholar] [CrossRef]
  26. Dou, S. Protection and high-value utilization engineering of Mollisol land in Jilin Province. J. Jilin Agric. Univ. 2020, 42, 473–476. (In Chinese) [Google Scholar]
  27. Ministry of Agriculture and Rural Affairs, PRC. Action Plan for Black Land Conservation Tillage in Northeast China (2020–2025); Beijing, China, 2020. Available online: http://www.moa.gov.cn/gk/tzgg_1/tz/202003/t20200318_6339304.htm (accessed on 1 December 2021).
  28. Ministry of Agriculture and Rural Affairs, PRC. Opinions of the CPC Central Committee and The State Council on Comprehensively Promoting Rural Revitalization and Accelerating Agricultural and Rural Modernization; Beijing, China, 2020. Available online: http://www.moa.gov.cn/xw/zwdt/202102/t20210221_6361863.htm (accessed on 3 February 2022).
  29. Central People’s Government of the People’s Republic of China. Implementation Plan of the National Black Land Protection Project (2021–2025). Available online: http://www.gov.cn/xinwen/2021-07/30/content_5628527.htm (accessed on 3 February 2022).
  30. Abadie, A.; Gardeazabal, J. The economic costs of conflict: A case study of the Basque country. Am. Econ. Rev. 2003, 93, 113–132. [Google Scholar] [CrossRef] [Green Version]
  31. Abadie, A.; Diamond, A.; Hainmueller, A.J. Synthetic control methods for comparative case studies: Estimating the effect of California’s tobacco control program. J. Am. Stat. Assoc. 2010, 105, 493–505. [Google Scholar] [CrossRef] [Green Version]
  32. Abadie, A.; Diamond, A.; Hainmueller, J. Comparative Politics and the Synthetic Control Method. Am. J. Pol. Sci. 2015, 59, 495–510. [Google Scholar] [CrossRef]
  33. Sampaio, B. Identifying peer states for transportation policy analysis with an application to New York’s handheld cell phone ban. Transp. A Transp. Sci. 2014, 10, 1–14. [Google Scholar] [CrossRef]
  34. Lin, B.; Chen, X. Is the implementation of the increasing block electricity prices policy really effective? Evidence based on the analysis of synthetic control method. Energy 2018, 163, 734–750. [Google Scholar] [CrossRef]
  35. Albalate, D.; Bel, G.; Mazaira-Font, F.A. Decoupling synthetic control methods to ensure stability, accuracy and meaningfulness. SERIEs 2021, 12, 549–584. [Google Scholar] [CrossRef]
  36. Xia, H.; Wu, S. Effect of the international tourism island policy on Hainan Farmers’ income and the urban-rural income gap: An analysis based on the GPCA and SCM models. J. Adv. Comput. Intell. Intell. Inform. 2021, 25, 592–600. [Google Scholar] [CrossRef]
  37. Qi, X.; Han, Y. Energy quota trading can achieve energy savings and emission reduction: Evidence from China’s pilots. Environ. Sci. Pollut. Res. 2021, 28, 52431–52458. [Google Scholar] [CrossRef] [PubMed]
  38. Abadie, A. Using synthetic controls: Feasibility, data requirements, and methodological aspects. J. Econ. Lit. 2021, 59, 391–425. [Google Scholar] [CrossRef]
  39. Bertrand, M.; Duflo, E.; Mullainathan, S. How much should we trust differences-in-differences estimates? Q. J. Econ. 2004, 119, 249–275. [Google Scholar] [CrossRef] [Green Version]
  40. Liu, B.Y.; Zhang, G.L.; Xie, Y.; Shen, B.; Gu, Z.J.; Ding, Y.Y. Delineating the black soil region and typical black soil region of northeastern China. Chin. Sci. Bull. 2021, 66, 96–106. (In Chinese) [Google Scholar] [CrossRef]
  41. Du, R.; Mao, X.F. Estimating the effects of the policies applied in major grain producing areas based on synthetic control method. Chin. Soft Sci. 2017, 6, 31–38. (In Chinese) [Google Scholar]
  42. Li, S.Y. The influence of low-carbon city pilot policy on electric energy consumption intensity: Based on synthetic control method. Urban Probl. 2018, 7, 38–47. (In Chinese) [Google Scholar] [CrossRef]
  43. Kuang, B.; Han, J.; Lu, X.; Zhang, X.; Fan, X. Quantitative evaluation of China’s cultivated land protection policies based on the PMC-Index model. Land Use Policy 2020, 99, 105062. [Google Scholar] [CrossRef]
  44. Xie, H.; Wang, W.; Zhang, X. Evolutionary game and simulation of management strategies of fallow cultivated land: A case study in Hunan province, China. Land Use Policy 2018, 71, 86–97. [Google Scholar] [CrossRef]
  45. Sims, K.R.; Thompson, J.R.; Meyer, S.R.; Nolte, C.; Plisinski, J.S. Assessing the local economic impacts of land protection. Conserv. Biol. 2019, 33, 1035–1044. [Google Scholar] [CrossRef]
  46. Zhong, T.; Huang, X.; Zhang, X.; Scott, S.; Wang, K. The effects of basic arable land protection planning in Fuyang County, Zhejiang Province, China. Appl. Geogr. 2012, 35, 422–438. [Google Scholar] [CrossRef]
Figure 1. Evaluation of the effect of the BLPP.
Land 11 00585 g001
Figure 2. Typical black land county-level and national provincial regions.
Land 11 00585 g002
Figure 3. Industrial wastewater discharge in real and synthetic black land areas.
Land 11 00585 g003
Figure 4. Industrial sulfur dioxide emission in real and synthetic black land areas.
Land 11 00585 g004
Figure 5. Industrial wastewater discharge gaps in the black land area and placebo gaps in the control regions.
Land 11 00585 g005
Figure 6. Industrial sulfur dioxide emission gaps in the black land area and placebo gaps in the control regions.
Land 11 00585 g006
Table 1. Industrial pollution emission data for northeast black land area and some provinces.
AreaIndustrial Pollutants2005201020152020Average
Black land areawastewater (million tons)243.44263.21291.7996.90234.64
sulfur dioxide (ten thousand tons)30.4727.6027.234.7523.61
Jilin non-black land areawastewater (million tons)241.90338.91367.98157.33287.88
sulfur dioxide (ten thousand tons)14.0916.2317.003.6014.69
Heilongjiang non-black land areawastewater (million tons)171.3675.3671.2146.33100.00
sulfur dioxide (ten thousand tons)6.6310.953.911.996.91
Beijingwastewater (million tons)128.1387.1391.7477.1692.46
sulfur dioxide (ten thousand tons)10.505.994.031.015.47
Hebeiwastewater (million tons)1245.331096.521065.50395.121004.12
sulfur dioxide (ten thousand tons)128.10104.29104.2422.4596.56
Shanxiwastewater (million tons)320.99394.31492.62315.80402.19
sulfur dioxide (ten thousand tons)120.00103.06107.7969.64102.40
Anhuiwastewater (million tons)634.87733.99695.80655.24690.17
sulfur dioxide (ten thousand tons)51.5048.6847.4320.4244.15
Shandongwastewater (million tons)1390.711545.721800.211015.791623.94
sulfur dioxide (ten thousand tons)171.50115.26135.8973.35134.96
Szechwanwastewater (million tons)1225.90949.04598.21453.16827.16
sulfur dioxide (ten thousand tons)114.1085.6865.7134.1376.92
Shaanxiwastewater (million tons)428.19480.15343.49194.38378.25
sulfur dioxide (ten thousand tons)80.0077.7457.5912.4359.97
Note: For brevity, only some representative data are listed.
Table 2. Weights of two groups of black land areas of synthetic industrial pollution emissions.
Synthetic Industrial Wastewater Emission Group
(RMSEP = 0.0225)
Synthetic Industrial Sulfur Dioxide Emission Group (RMSEP = 0.0317)
ProvinceWeightProvinceWeight
Jilin non-black land area0.569Jilin non-black land area0.683
Heilongjiang non-black land area0.114Heilongjiang non-black land area0.000
Inner Mongolia non-black land area0.093Inner Mongolia non-black land area0.284
Xinjiang0.068Xinjiang0.033
Fujian0.047Fujian0.000
Hainan0.030Hainan0.000
Qinghai0.012Qinghai0.000
Ningxia0.011Ningxia0.000
Note: The weights of other regions not listed are 0.
Table 3. Comparison of the variable values of real and synthetic black land areas.
Predictive Control VariableBlack Land AreaSynthetic Black Land Area ①Synthetic Black Land Area ②
2005 Population (10,000)3001.743041.652624.26
2010 Population (10,000)3004.243077.082670.55
2015 Population (10,000)3249.573077.612685.72
2005 GDP (100 million yuan)4394.394297.633696.80
2005 GDP (100 million yuan)9987.689662.419502.81
2005 GDP (100 million yuan)16,594.4315,236.3315,110.74
2005 Industrial output (100 million yuan)4552.784368.253511.53
2010 Industrial output (100 million yuan)12,420.9313,651.4812,962.24
2015 Industrial output (100 million yuan)26,420.9322,652.4122,005.28
Note: ① using the weight of the industrial wastewater discharge, ② using the weight of the industrial sulfur dioxide discharge.
Table 4. Post/prior-RMSPE ratios for industrial wastewater discharges in the black land area and the control regions.
AreaPrior-Intervention RMSPEPost-Intervention RMSPERatio
Black land area0.02380.354514.8611
Shanxi0.08680.49095.6552
Liaoning0.08470.34764.1026
Anhui0.06810.27173.9947
Jilin non-black land area0.06810.23243.4158
Tianjin0.04330.10112.3349
Fujian0.16590.37522.2481
Zhejiang0.05890.12282.0853
Jiangxi0.10380.17391.6752
Shandong0.14680.18821.2821
Beijing0.26340.29711.1281
Jiangsu0.30590.22030.7202
Note: For brevity, only some representative data are listed.
Table 5. Post/prior-RMSPE ratios for industrial sulfur emissions in the black land area and the control regions.
AreaPrior-Intervention RMSPEPost-Intervention RMSPERatio
Black land area0.14120.44513.1518
Anhui0.03490.09822.8093
Shanxi0.06050.14142.3366
Guangxi0.08020.17552.1881
Henan0.04710.10232.1707
Shandong0.23940.44051.8397
Liaoning0.10770.17131.5904
Hunan0.09650.14511.503
Jiangsu0.05770.69431.2029
Hubei0.06840.07471.0921
Guangdong0.09880.07710.7807
Tianjin0.34940.09520.2723
Note: For brevity, only some representative data are listed.
Table 6. DID estimation results of the BLPP effects (industrial wastewater discharge).
Variable(i)(ii)(iii)(iv)(v)(vi)
Treat × Period−0.472 **−0.459 *−0.581 **−0.818 ***−0.487 **−0.525 **
Variable controlNOYESNOYESYESYES
Time fixedNONOYESNOYESYES
Region fixedNONOYESYESNOYES
Number   of   observations 510510510510510510
R 2 0.090.130.270.290.280.25
Note: *, **, and *** indicate significance levels of 10%, 5%, and 1%, respectively.
Table 7. DID estimation results of the BLPP effects (industrial sulfur dioxide emission).
Variable(i)(ii)(iii)(iv)(v)(vi)
Treat × Period−1.026 **−0.856 ***−0.423 *−0.758 ***−0.623 *−0.376 *
Variable controlNOYESNOYESYESYES
Time fixedNONOYESNOYESYES
Region fixedNONOYESYESNOYES
Number   of   observations 510510510510510510
R 2 0.170.230.290.280.210.36
Note: *, **, and *** indicate significance levels of 10%, 5%, and 1%, respectively.
Publisher’s Note: MDPI stays neutral with regard to jurisdictional claims in published maps and institutional affiliations.

