
Insect Abundance and Diversity Respond Favorably to Vegetation Communities on Interim Reclamation Sites in a Semi-Arid Natural Gas Field

 ,
,
Abstract
1. Introduction
2. Methods
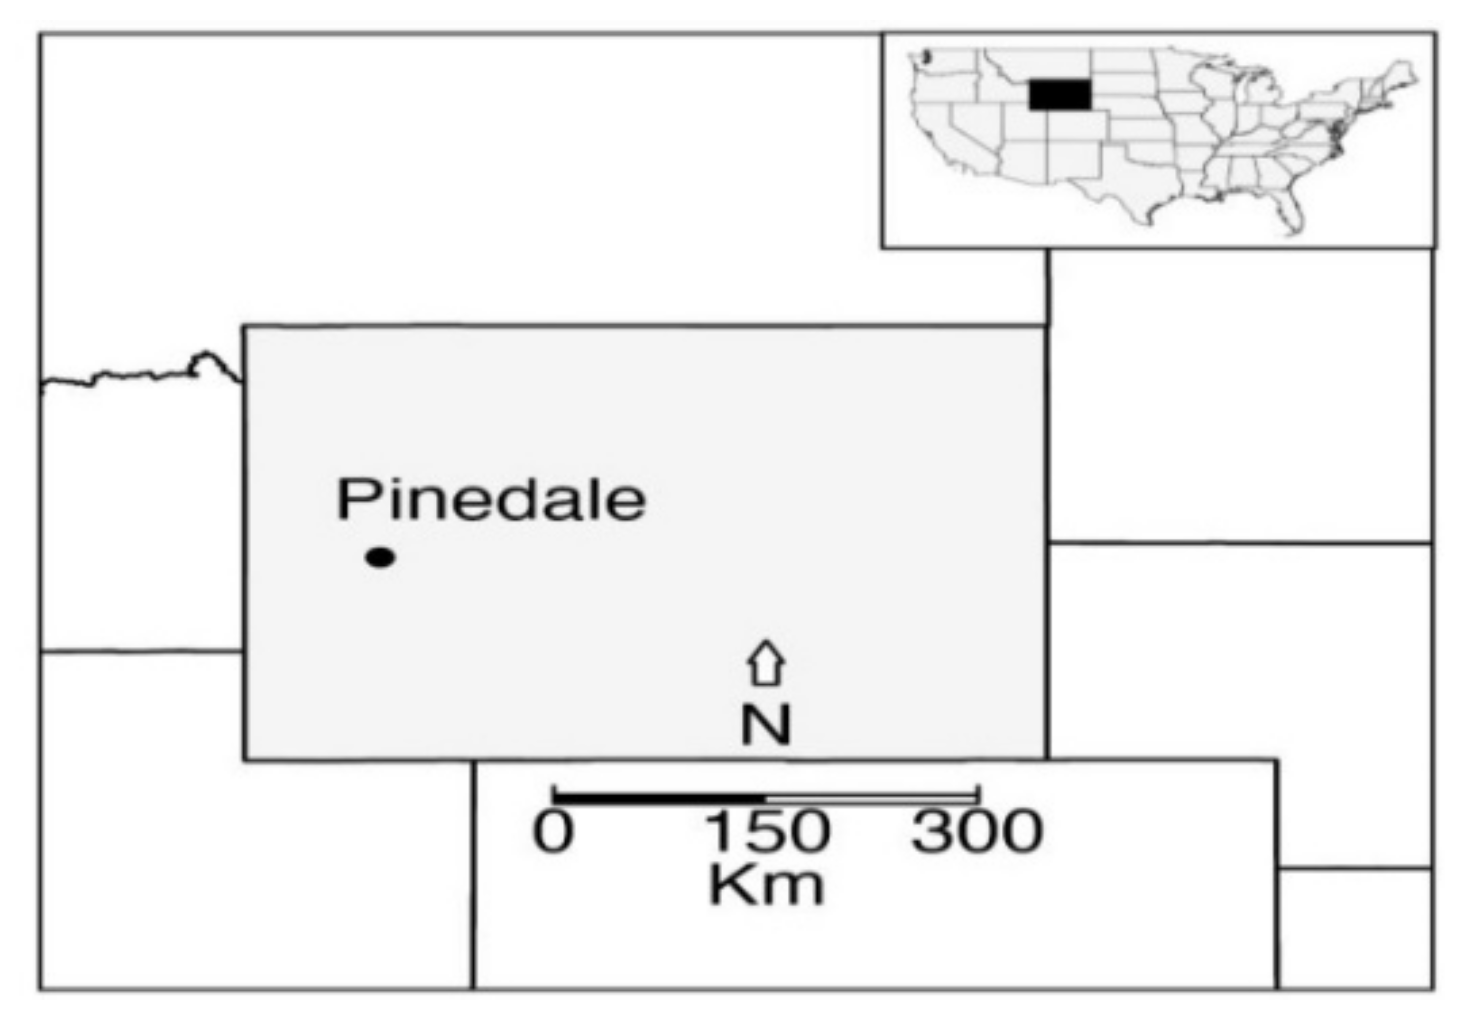
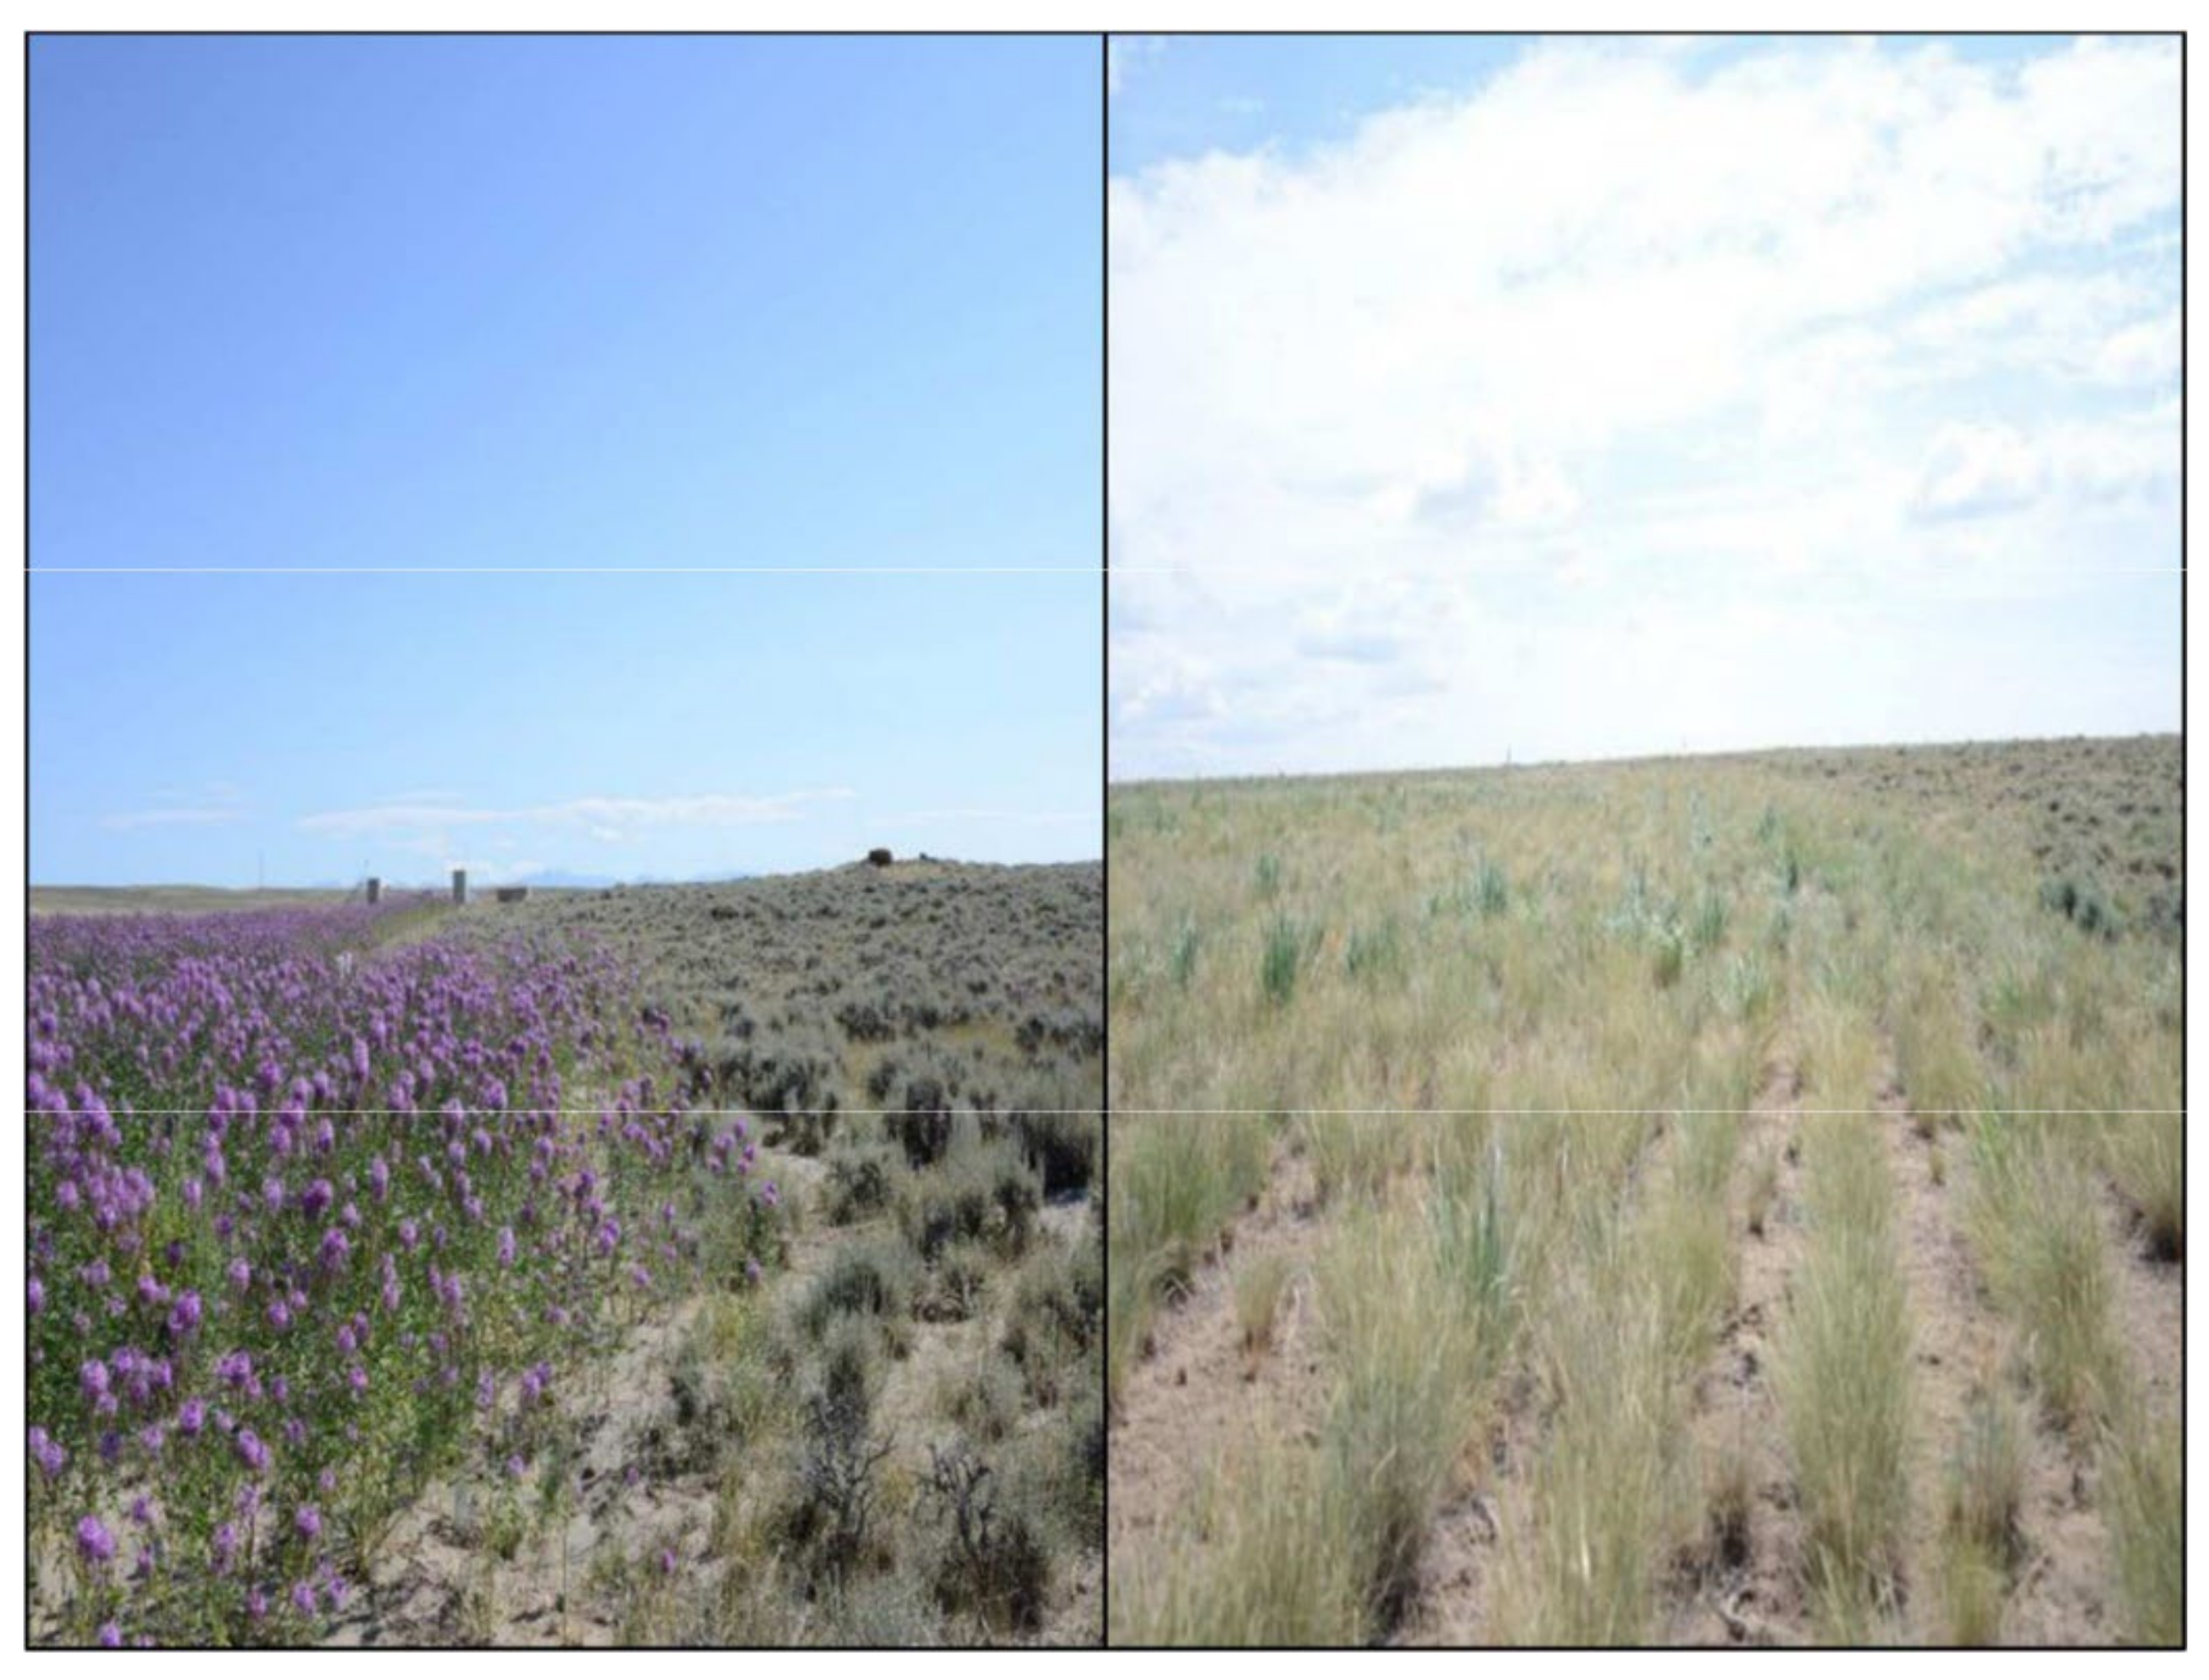
2.1. Study Site
2.2. Vegetation Sampling and Analysis
2.3. Insect Sampling
2.4. Statistical Analysis
3. Results
3.1. Vegetation Sampling
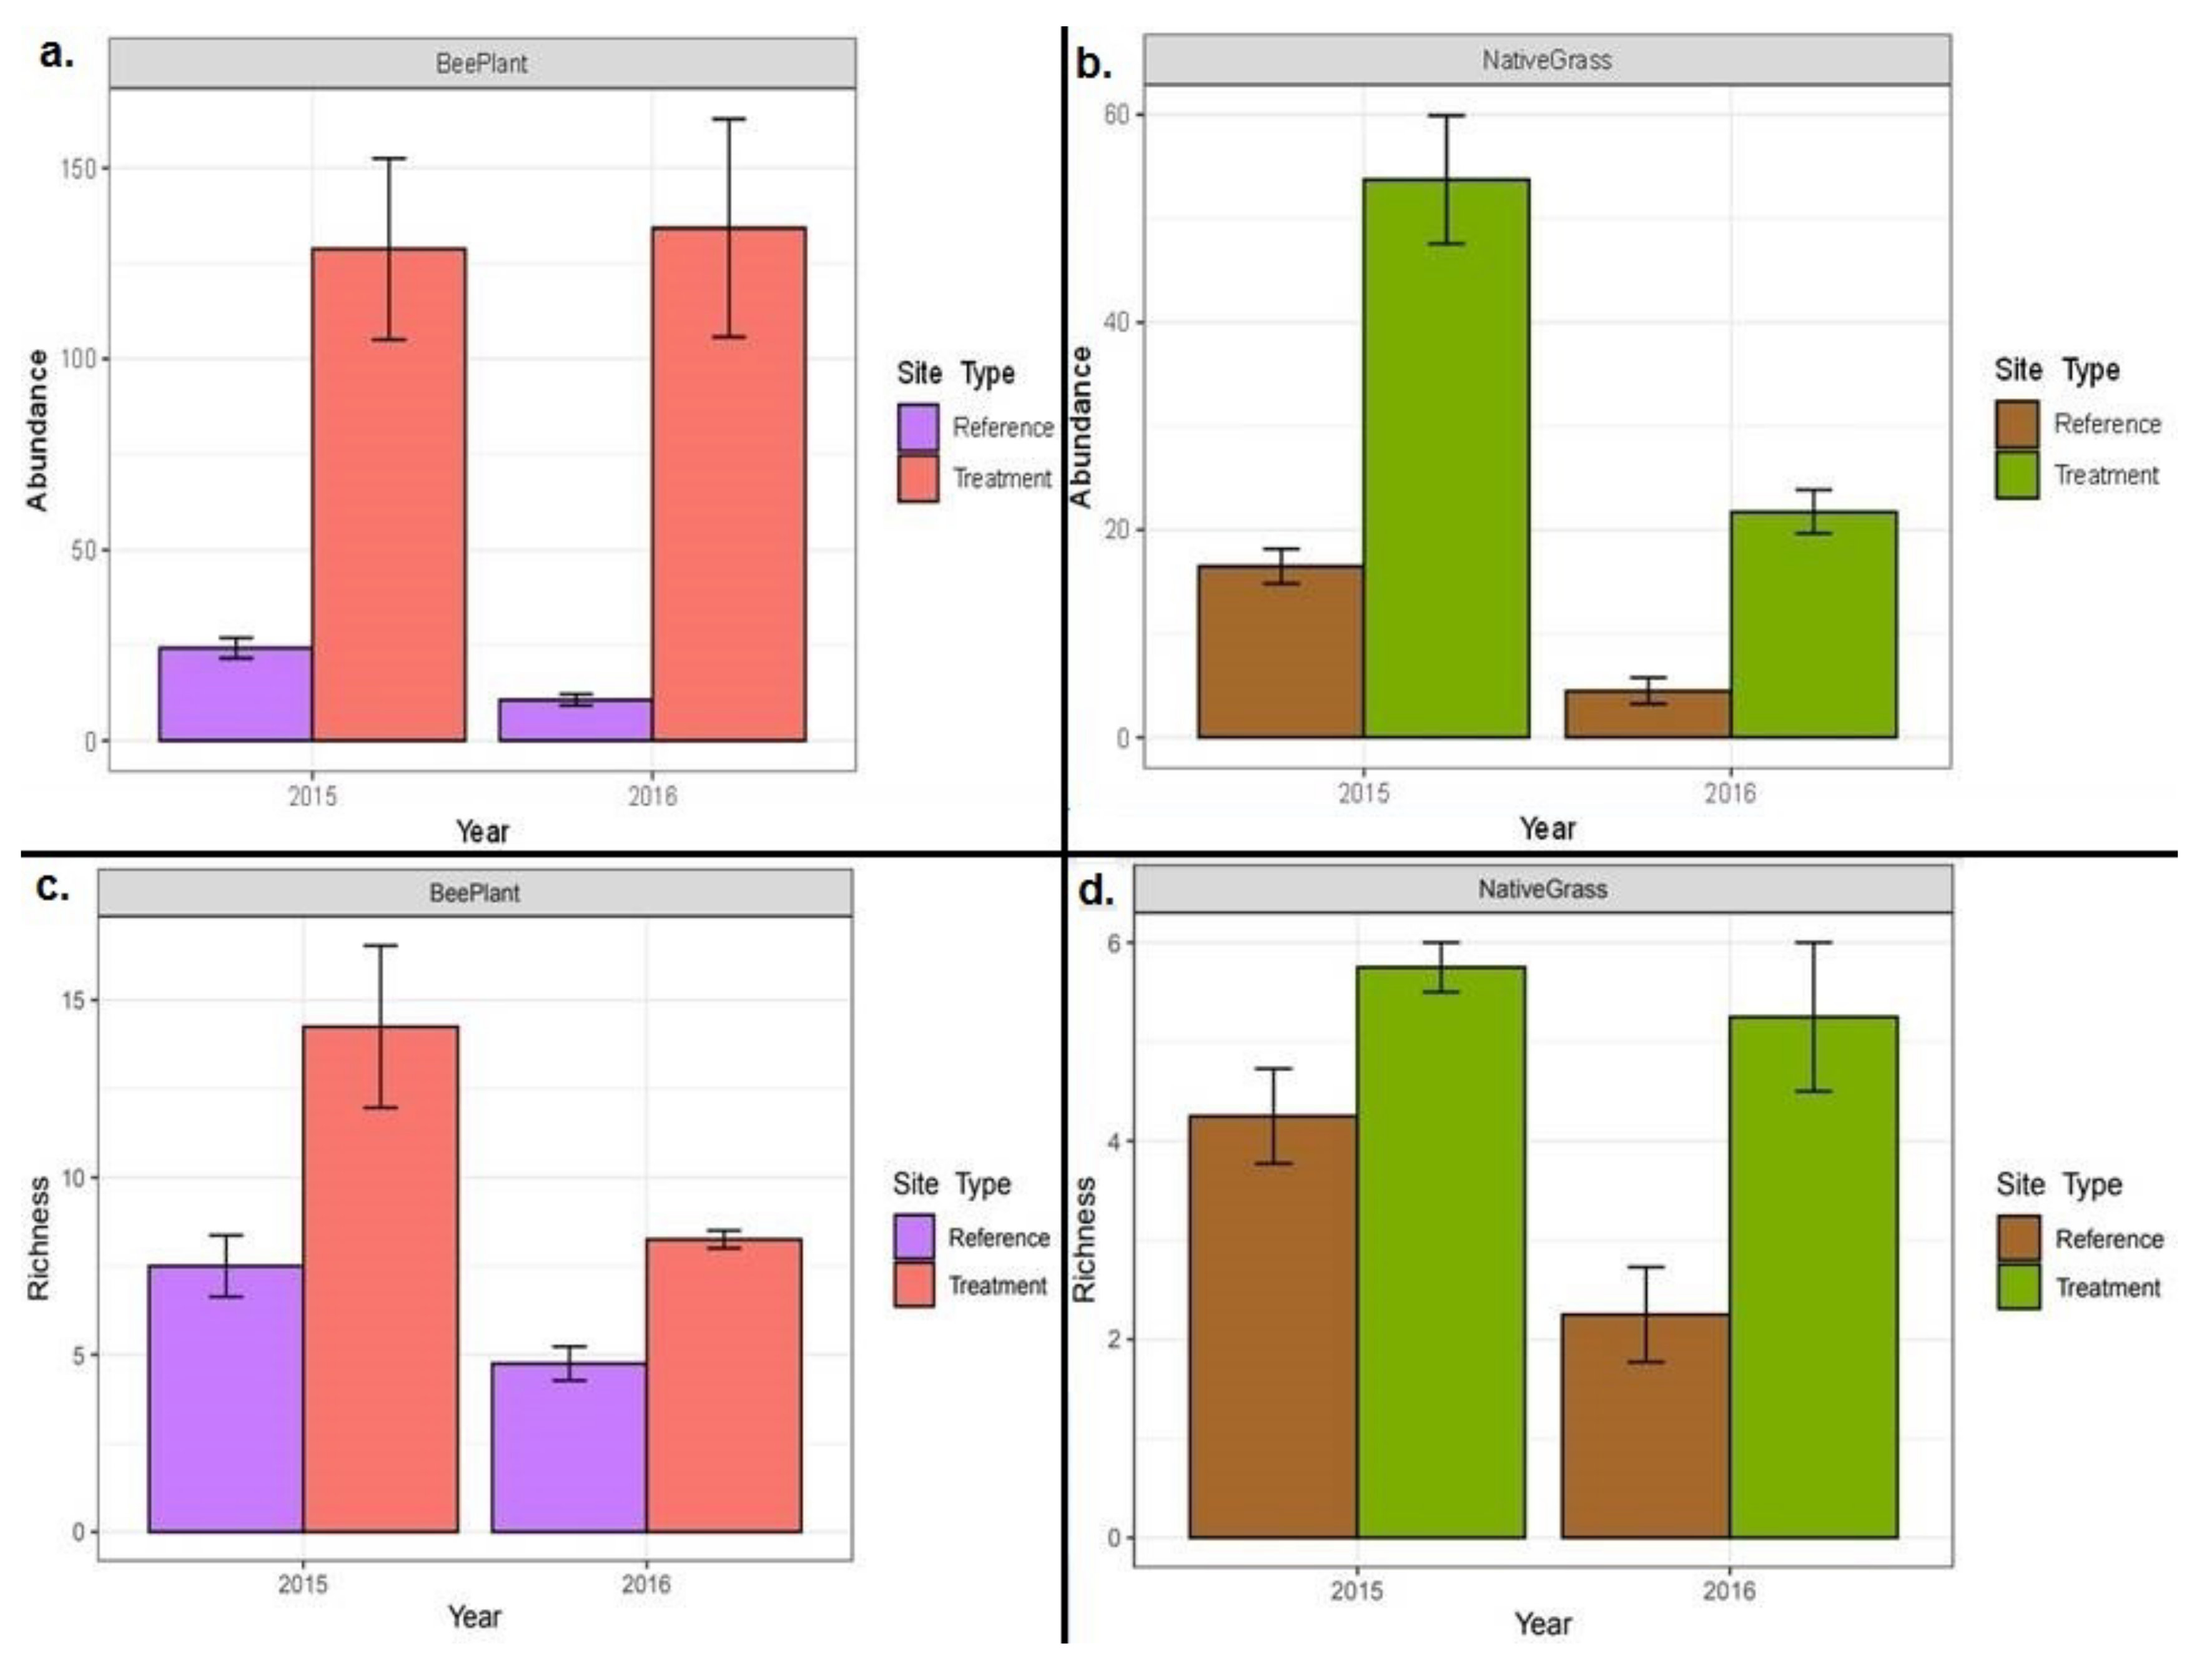
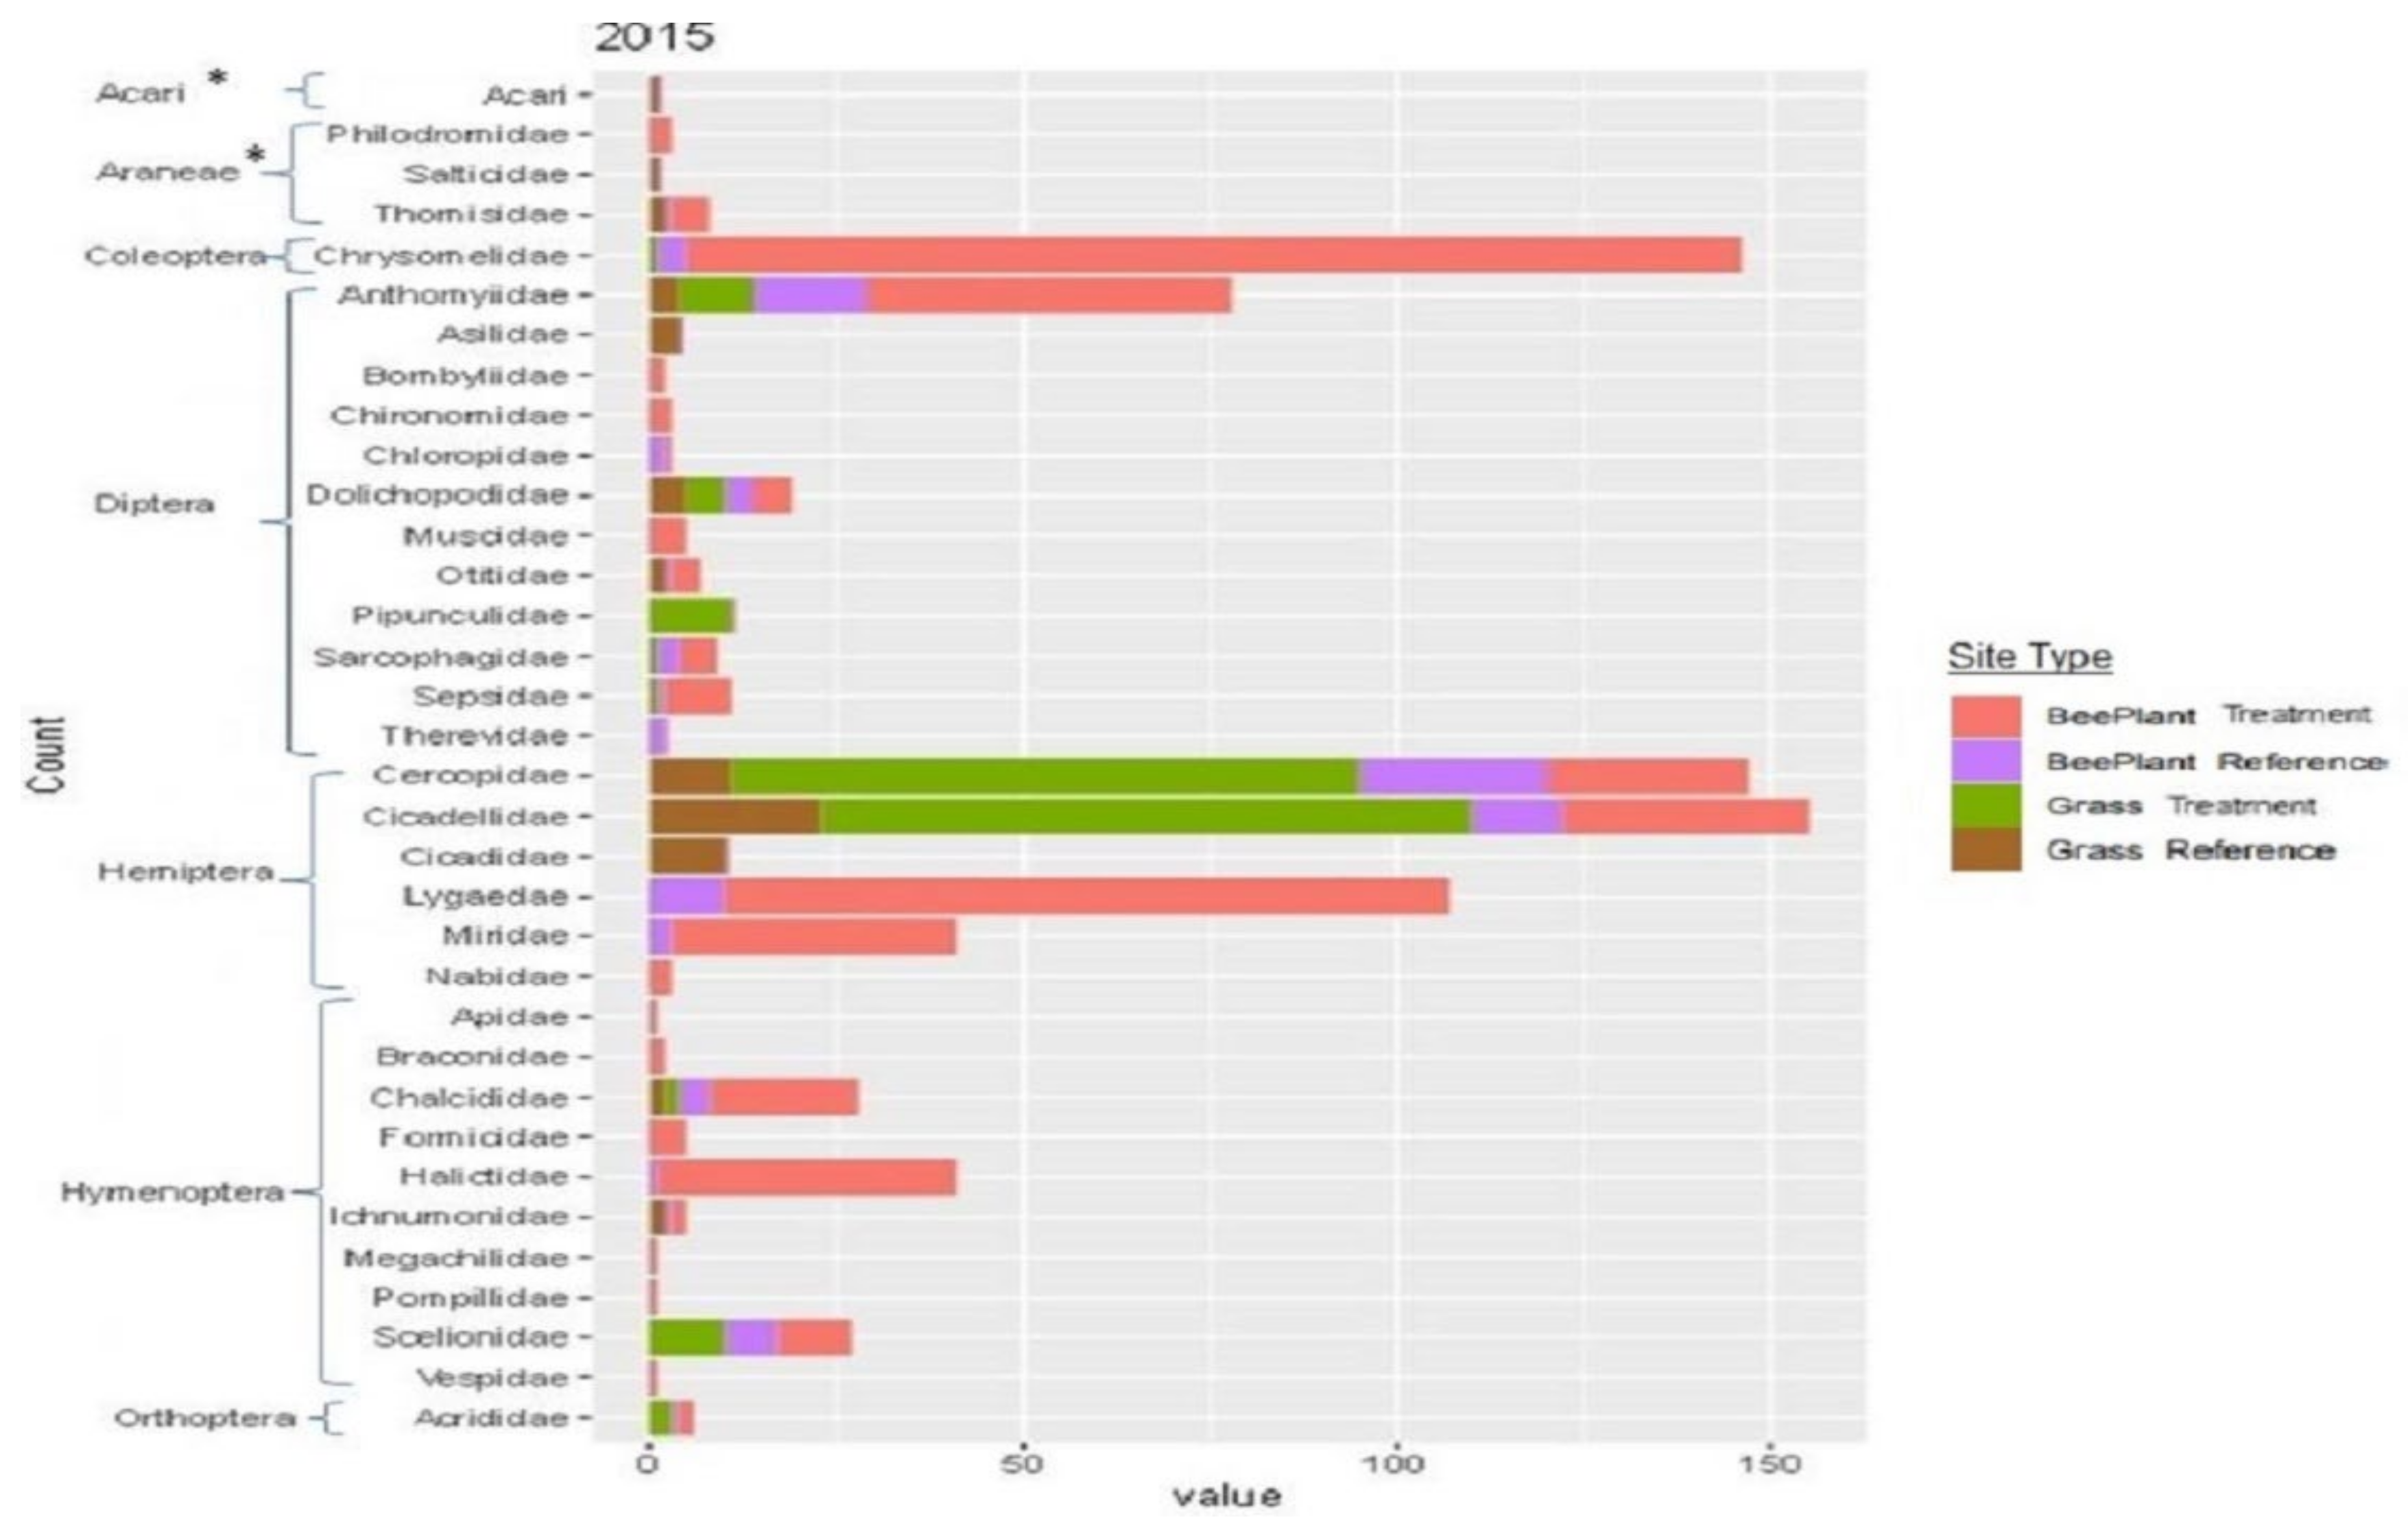
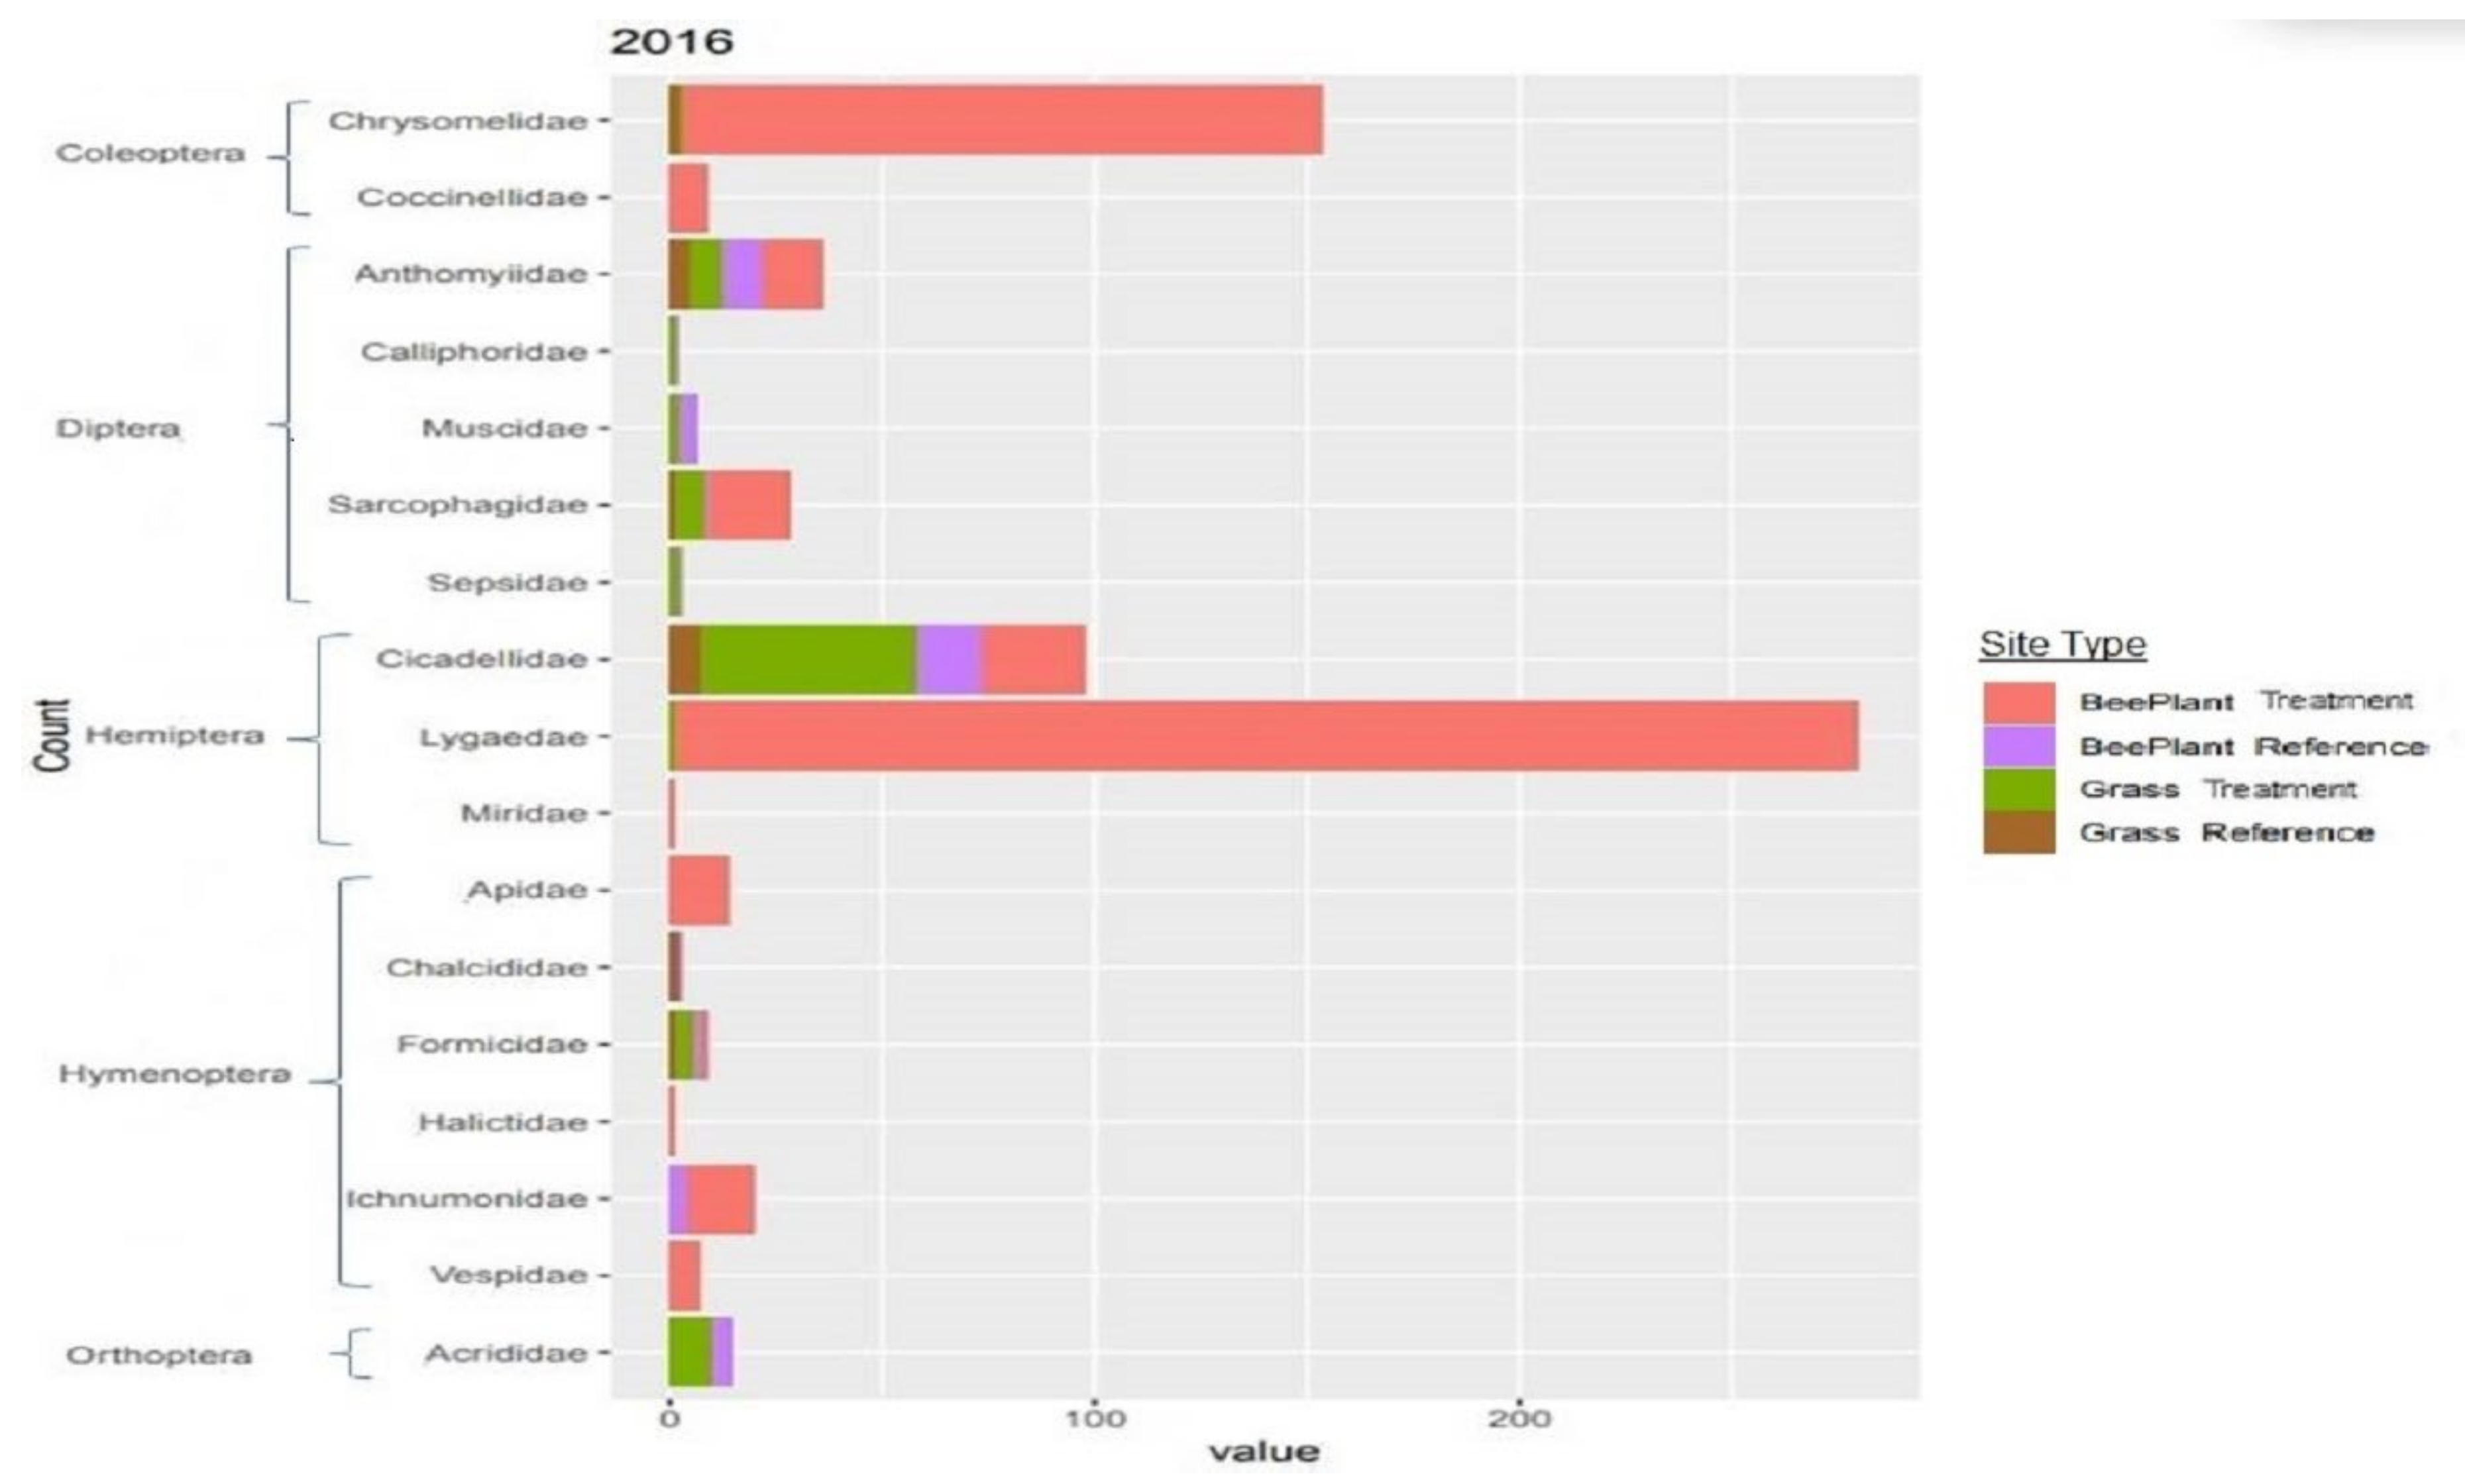
3.2. Insect Sampling
4. Discussion
5. Conclusions
Supplementary Materials
Author Contributions
Funding
Institutional Review Board Statement
Informed Consent Statement
Data Availability Statement
Acknowledgments
Conflicts of Interest
References
- Finn, S.P.; Knick, S.T. Changes in the Wyoming basins landscape from oil and natural gas development. In Sagebrush Ecosystem Conservation and Management: Ecoregional Assessment Tools and Models of the Wyoming Basins; Allen Press: Lawrence, KS, USA, 2011; pp. 46–68. [Google Scholar]
- Society for Ecological International Science and Policy Working Group. The SER International Primer on Restoration Ecology; Society for Ecological Restoration International: Tucson, AZ, USA, 2004. [Google Scholar]
- Wortley, L.; Hero, J.M.; Howes, M. Evaluating restoration success: A review of the literature. Restor. Ecol. 2013, 21, 537–543. [Google Scholar] [CrossRef]
- Curran, M.F.; Wolff, B.J.; Stahl, P.D. Approaching oil and gas pad reclamation with data management: A framework for the future. J. Am. Soc. Min. Reclam. 2013, 2, 195–204. [Google Scholar]
- Curran, M.F.; Stahl, P.D. Database management for large scale reclamation projects in Wyoming: Developing better data acquisition, monitoring, and models for applications to future projects. J. Environ. Solut. Oil Gas Min. 2015, 1, 31–43. [Google Scholar] [CrossRef]
- Curran, M.F.; Cox, S.E.; Robinson, T.J.; Robertson, B.L.; Rogers, K.A.; Sherman, Z.A.; Adams, T.A.; Strom, C.F.; Stahl, P.D. Spatially balanced sampling and ground-level imagery for revegetation monitoring on reclaimed well pads. Restor. Ecol. 2019, 27, 947–980. [Google Scholar] [CrossRef]
- Longcore, T. Terrestrial arthropods as indicators of ecological restoration success in coastal sage scrub (California, USA). Restor. Ecol. 2003, 11, 397–409. [Google Scholar] [CrossRef]
- Ruiz-Jaen, M.C.; Aide, T.M. Restoration success: How is it being measured? Restor. Ecol. 2005, 13, 569–577. [Google Scholar] [CrossRef]
- Walker, L.R.R.; Walker, J.; del Moral, R. Forging a new alliance between succession and restoration. In Linking Restoration and Ecological Succession; Walker, L.R.R., Walker, J., Hobbs, R.H., Eds.; Springer: New York, NY, USA, 2007; pp. 1–18. [Google Scholar]
- Albrecht, M.; Riesen, M.; Schmid, B. Plant-pollinator network assembly along the chronosequence of a glacier foreland. Oikos 2010, 119, 1610–1624. [Google Scholar] [CrossRef]
- Devoto, M.; Bailey, S.; Craze, P.; Memmott, J. Understanding and planning ecological restoration of plant-pollinator networks. Ecol. Lett. 2012, 15, 319–328. [Google Scholar] [CrossRef]
- Menz, M.M.H.; Phillips, R.D.; Winfree, R.; Kremen, C.; Aizen, M.A.; Johnson, S.D.; Dixon, K.W. Reconnecting plants and pollinators: Challenges in the restoration of pollination mutualisms. Trends Plant Sci. 2011, 16, 4–12. [Google Scholar] [CrossRef]
- Brophy, C.; Dooley, A.; Kirwan, L.; Finn, J.A.; McDonnell, J.; Bell, T.; Cadotte, M.W.; Connolly, J. Biodiversity and ecosystem function: Making sense of numerous species interactions in multi-species communities. Ecology 2017, 98, 1771–1778. [Google Scholar] [CrossRef]
- Losey, J.E.; Vaughan, M. The economic value of ecological services provided by insects. Bioscience 2006, 56, 311–323. [Google Scholar] [CrossRef]
- Dangles, O.; Casas, J. Ecosystem services provided by insects for achieving sustainable development goals. Ecosyst. Serv. 2019, 35, 109–115. [Google Scholar] [CrossRef]
- Cusser, S.; Goodell, K. Diversity and distribution of floral resources influence the restoration of plant-pollinator networks on a reclaimed strip mine. Restor. Ecol. 2013, 26, 713–721. [Google Scholar] [CrossRef]
- Tonietto, R.K.; Larkin, D.J. Habitat restoration benefits wild bees: A meta-analysis. J. Appl. Ecol. 2018, 55, 582–590. [Google Scholar] [CrossRef]
- Harmon, J.P.; Ganguli, A.C.; Solga, M.A. An overview of pollination in rangelands: Who, why, and how. Rangelands 2011, 33, 4–9. [Google Scholar] [CrossRef][Green Version]
- United States Department of the Interior; United States Department of Agriculture. The Gold Book: Surface Operating Standards and Guidelines for Oil and Gas Exploration and Development, 4th ed.; BLM/WO/ST-06/021+3071/REV 07; Bureau of Land Management: Denver, CO, USA, 2007.
- Pickett, S.T.A.; Parker, V.T. Avoiding the old pitfalls: Opportunities in a new discipline. Restor. Ecol. 1994, 2, 75–79. [Google Scholar] [CrossRef]
- Aronson, J.; Dhillion, S.; le Floc’h, E. On the need to select a reference site, however imperfect: A reply to Pickett and Parker. Restor. Ecol. 1995, 3, 1–3. [Google Scholar] [CrossRef]
- Monroe, A.P.; Aldridge, C.L.; O’Donnell, M.S.; Manier, D.J.; Homer, C.G.; Anderson, P.J. Using remote sensing products to predict recovery of vegetation across space and time following energy development. Ecol. Indic. 2020, 110, 105872. [Google Scholar] [CrossRef]
- Sommers, J. Green River Drift: A History of the Upper Green River Cattle Association; Falcon Press Publishing Co., Inc.: Helena, MT, USA, 1994. [Google Scholar]
- Harmon-Threatt, A.N.; Chin, J. Common methods for tallgrass prairie restoration and their potential effects on bee diversity. Nat. Areas J. 2016, 36, 400–411. [Google Scholar] [CrossRef]
- Buckles, B.J.; Harmon-Threatt, A.N. Bee diversity in tallgrass prairies affected by management and its effect on above-and-below-ground resources. J. Appl. Ecol. 2019, 56, 2443–2453. [Google Scholar] [CrossRef]
- Westphal, C.; Steffan-Dewenter, I.; Tscharntke, T. Mass flowering crops enhance pollinator densities at landscape scales. Ecol. Lett. 2003, 6, 961–965. [Google Scholar] [CrossRef]
- Holzschuh, A.; Dormann, C.F.; Tscharntke, T.; Steffan-Dewenter, I. Mass-flowering crops enhance wild bee abundance. Oecologia 2013, 172, 477–484. [Google Scholar] [CrossRef] [PubMed]
- Todd, K.J.; Gardiner, M.M.; Lindquist, E.D. Mass flowering crops as a conservation resource for wild pollinators (Hymenoptera: Apoidea). J. Kans. Entomol. Soc. 2016, 89, 158–167. [Google Scholar] [CrossRef]
- Rundlöf, M.; Persson, A.S.; Smith, H.G.; Bommarco, R. Late-season mass-flowering red clover increases bumble bee queen and male densities. Biol. Conserv. 2014, 172, 138–145. [Google Scholar] [CrossRef]
- Wenninger, E.J.; Inouye, R.S. Insect community response to plant diversity and productivity in a sagebrush-steppe ecosystem. J. Arid Environ. 2008, 72, 24–33. [Google Scholar] [CrossRef]
- Martin, C.A.; Guldan, S.J. Sagebrush as a short-term arthropod repellent. J. Sustain. Agric. 1998, 11, 77–85. [Google Scholar] [CrossRef]
- Price, P.W. The plant vigor hypothesis and herbivore attack. Oikos 1991, 62, 244–251. [Google Scholar] [CrossRef]
- Pan, V.S.; Pepi, A.; Goidell, J.; Karban, R. Retention of green leaves not brown leaves increases spring cynipid diversity on large valley oaks. Arthropod-Plant Interact. 2021, 15, 353–362. [Google Scholar] [CrossRef]
- Flieschner, T.L. Ecological costs of livestock grazing in western North America. Conserv. Biol. 1994, 8, 629–644. [Google Scholar] [CrossRef]
- Debano, S.J. Effects of livestock grazing on aboveground insect communities in semi-arid grasslands of southeastern Arizona. Biodivers. Conserv. 2006, 15, 2547–2564. [Google Scholar] [CrossRef]
- Holechek, J.L.; de Souza Gomes, H.; Molinar, F.; Galt, D. Grazing intensity: Critique and approach. Rangel. Arch. 1998, 20, 15–18. [Google Scholar]
- Shapira, T.; Henkin, Z.; Dag, A.; Mandelik, Y. Rangeland sharing by cattle and bees: Moderate grazing does not impair bee communities and resource availability. Ecol. Appl. 2020, 30, e02066. [Google Scholar] [CrossRef]
- Cagney, J.; Cox, S.E.; Booth, D.T. Comparison of point intercept and image analysis for monitoring rangeland composition and trend. Rangel. Ecol. Manag. 2011, 64, 309–315. [Google Scholar] [CrossRef]
- Curran, M.F.; Cox, S.E.; Robinson, T.J.; Strom, C.F.; Stahl, P.D. Combining spatially balanced sampling, route optimization and remote sensing to assess biodiversity response to reclamation practices on semi-arid well pads. Biodiversity 2020, 21, 1–11. [Google Scholar] [CrossRef]
- Curran, M.F.; Hodza, P.; Cox, S.E.; Lanning, S.G.; Robertson, B.L.; Robinson, T.J.; Stahl, P.D. Ground-level unmanned aerial system imagery coupled with spatially balanced sampling and route optimization to monitor rangeland vegetation. J. Vis. Exp. 2020, 160, e61052. [Google Scholar] [CrossRef]
- Booth, D.T.; Cox, S.E.; Berryman, R.D. Sampling digital imagery with ‘SamplePoint’. Environ. Monit. Assess. 2006, 123, 97–108. [Google Scholar] [CrossRef]
- Milne, L.; Milne, M. National Audubon Society: Field Guide to North American Insects and Spiders; No. 595.7 M659; Toppan Printing Co., Ltd.: Tokyo, Japan, 2011. [Google Scholar]
- McCall, C.; Primack, R.B. Influence of flower characteristics, weather, time of day, and season on insect visitation rates in three plant communities. Am. J. Bot. 1992, 79, 434–442. [Google Scholar] [CrossRef]
- Solga, M.J.; Harmon, J.P.; Ganguli, A.C. Timing is everything: An overview of phenological changes to plants and their pollinators. Nat. Areas J. 2014, 34, 227–235. [Google Scholar] [CrossRef]
- R Core Team. R: A Language and Environment for Statistical Computing; R Foundation for Statistical Computing: Vienna, Austria, 2016; Available online: https://www.Rproject.org/ (accessed on 1 March 2022).
- Curran, M.F.; Crow, T.M.; Hufford, K.M.; Stahl, P.D. Forbs and greater sage-grouse habitat restoration efforts: Suggestions for improving commercial seed availability and restoration practices. Rangelands 2015, 37, 211–216. [Google Scholar] [CrossRef]
- Dumroese, R.K.; Luna, T.; Pinito, J.R.; Landis, T.D. Forbs: Foundation for restoration of monarch butterflies, other pollinators, and greater sage-grouse in Western United States. Nat. Areas J. 2016, 36, 499–511. [Google Scholar] [CrossRef]
- Curran, M.F.; Summerfield, K.; Alexander, E.-J.; Lanning, S.G.; Schwyter, A.R.; Torres, M.L.; Schell, S.; Vaughan, K.; Robinson, T.J.; Smith, D.I. Use of 3-dimensional videography as a non-lethal way to improve visual insect sampling. Land 2020, 9, 340. [Google Scholar] [CrossRef]
- Prasser, N.K.; Hilld, A.L. Competitive interactions between an exotic annual, Halogeton glomeratus, and 10 North American native species. Nativ. Plants J. 2016, 17, 244–255. [Google Scholar] [CrossRef]
- Leger, E.A.; Goergen, E.M.; de Queiroz, T.F. Can native annual forbs reduce Bromus tectorum biomass and indirectly facilitate establishment of a native perennial grass? J. Arid Environ. 2014, 102, 9–16. [Google Scholar] [CrossRef]
- Cane, J.H. Breeding biologies, seed production and species-rich bee guilds of Cleome lutea and Cleome serrulata (Cleomaceae). Plant Species Biol. 2008, 23, 152–158. [Google Scholar] [CrossRef]
- Curran, M.F.; Sorenson, J.; Stahl, P.D. Rocky mountain beeplant aids revegetation in an arid natural gas field. Environ. Connect. 2019, 14, 27–29. [Google Scholar]
- Shackelford, N.; Paterno, G.B.; Winkler, D.E.; Erickson, T.E.; Leger, E.A.; Svejcar, L.N.; Breed, M.F.; Faist, A.M.; Harrison, P.A.; Curran, M.F.; et al. Drivers of seedling establishment success in dryland restoration efforts. Nat. Ecol. Evol. 2021, 5, 1283–1290. [Google Scholar] [CrossRef]
- Lodhi, M.A.K. Allelopathic potential of Salsola kali L. and its possible role in rapid disappearance of weedy stage during revegetation. J. Chem. Ecol. 1979, 5, 429–437. [Google Scholar] [CrossRef]
- Loch, J.M.; Walters, L.J.; Cook, G.S. Recovering trophic structure through habitat restoration: A review. Food Webs 2020, 25, e00162. [Google Scholar] [CrossRef]


| Site Type | Bare Ground | Herbaceous | Woody | Rock | Bee | Russian | Sagebrush | Grass |
|---|---|---|---|---|---|---|---|---|
| Litter | Litter | Plant | Thistle | |||||
| Bee Plant | 26.2% * | 19.9% * | 0% * | 0% | 29.4% * | 23.8% * | 0.01% * | 0.1% |
| Reclaimed | ||||||||
| Bee Plant | 50.0% * | 7.2% * | 11.6% * | 0.1% | 0% * | 0% * | 26.9% * | 3.5% |
| Reference | ||||||||
| Grass | 64.1% * | 4.8% * | 0.1% * | 3.1% | 0% | 0% | 0.2% * | 25.3% * |
| Reclaimed | ||||||||
| Grass | 56.6% * | 0.2% * | 9.1% * | 0.1% | 0% | 0% | 22.8% * | 7.3% * |
| Reference |
| Site Type | Bare Ground | Herbaceous | Woody | Rock | Bee | Russian | Sagebrush | Grass |
|---|---|---|---|---|---|---|---|---|
| Litter | Litter | Plant | Thistle | |||||
| Bee Plant | 26.0% * | 19.9% * | 0% * | 1.1% | 29.2% * | 23.9% * | 0% * | 0% |
| Reclaimed | ||||||||
| Bee Plant | 49.1% * | 7.2% * | 11.6% * | 1.8% | 0% * | 0% * | 26.9% * | 3.4% |
| Reference | ||||||||
| Grass | 62.5% * | 4.8% | 0% * | 5.1% * | 0% | 0% | 2.2%* | 25.3% * |
| Reclaimed | ||||||||
| Grass | 54.3% * | 2.8% | 7.1% * | 8.9% * | 0% | 0% | 26.8% * | 9.3% * |
| Reference |
Publisher’s Note: MDPI stays neutral with regard to jurisdictional claims in published maps and institutional affiliations. |
© 2022 by the authors. Licensee MDPI, Basel, Switzerland. This article is an open access article distributed under the terms and conditions of the Creative Commons Attribution (CC BY) license (https://creativecommons.org/licenses/by/4.0/).
Share and Cite
Curran, M.F.; Robinson, T.J.; Guernsey, P.; Sorenson, J.; Crow, T.M.; Smith, D.I.; Stahl, P.D. Insect Abundance and Diversity Respond Favorably to Vegetation Communities on Interim Reclamation Sites in a Semi-Arid Natural Gas Field. Land 2022, 11, 527. https://doi.org/10.3390/land11040527
Curran MF, Robinson TJ, Guernsey P, Sorenson J, Crow TM, Smith DI, Stahl PD. Insect Abundance and Diversity Respond Favorably to Vegetation Communities on Interim Reclamation Sites in a Semi-Arid Natural Gas Field. Land. 2022; 11(4):527. https://doi.org/10.3390/land11040527
Chicago/Turabian StyleCurran, Michael F., Timothy J. Robinson, Pete Guernsey, Joshua Sorenson, Taylor M. Crow, Douglas I. Smith, and Peter D. Stahl. 2022. "Insect Abundance and Diversity Respond Favorably to Vegetation Communities on Interim Reclamation Sites in a Semi-Arid Natural Gas Field" Land 11, no. 4: 527. https://doi.org/10.3390/land11040527
APA StyleCurran, M. F., Robinson, T. J., Guernsey, P., Sorenson, J., Crow, T. M., Smith, D. I., & Stahl, P. D. (2022). Insect Abundance and Diversity Respond Favorably to Vegetation Communities on Interim Reclamation Sites in a Semi-Arid Natural Gas Field. Land, 11(4), 527. https://doi.org/10.3390/land11040527