Article

Study on the Evolutionary Features and Driving Factors of Land-Use System in Xilingol, China

1
School of Environment, Northeast Normal University, Changchun 130024, China
2
Key Laboratory for Vegetation Ecology, Ministry of Education, Changchun 130024, China
3
State Environmental Protection Key Laboratory of Wetland Ecology and Vegetation Restoration, Changchun 130024, China
4
College of Geographical Science, Inner Mongolia Normal University, Hohhot 010022, China
*
Author to whom correspondence should be addressed.
Land 2022, 11(4), 526; https://doi.org/10.3390/land11040526
Submission received: 18 February 2022 / Revised: 31 March 2022 / Accepted: 3 April 2022 / Published: 5 April 2022

Abstract

:
In this paper, we selected Xilingol League in Inner Mongolia, China, as the research area, based on the land-use data of five Landsat remote sensing images taken between 1980 and 2015. Then, we calculated the complex network eigenvalues, such as the average shortest path, betweenness centrality, and degree, to identify the key land-use types, stability, and ecological environment change regularity from the perspective of the land-use system. Finally, we used the Canonical Correspondence Analysis (CCA) method to explore the main driving forces behind changes in the land-use system, to provide scientific support for the study of changing trends in land-use, and regional grassland ecological management. The findings are shown below. First, in the last 35 years, grasslands have always been the major type of change in land-use transfer matrices. Grasslands play a controlling role in the whole land-use system. Second, grassland and cultivated land are the major “transfer out” type of land in the Xilingol area, while construction land and water area belong to the major “transfer in” type of land. Third, the average shortest path values of four transition matrix networks were all less than 1.5, indicating that the land-use system becomes less stable, but the average shortest path values of these four networks present an increasing trend, leading to a more stable development of the land-use system. However, on the whole, it shows an upward trend, and the land-use system is moving in a stable direction. Fourth, the average annual rainfall, population, topographic factors, GDP, and distance from settlements play a prominent role in determining the spatial distribution of change in land-use in Xilingol.

1. Introduction

The land is an important basis for human survival and development. Land-Use and Land-Cover Change (LULC) are indicators of changes to regional man-land coupling systems and the most direct response of human activities to the Earth’s surface environment [1]. It is the link between human socio-economic activities and ecological processes [2,3,4]. With the emergence of issues like global warming and ecological environment imbalance, the study of land-use change and its driving mechanism has gradually become an important direction of global change research. More and more scholars at home and outside the country are focusing on land-use related research, which has become the core of global environmental change research [5,6]. At present, land-use research has formed a relatively perfect research method model and research system, and the research results mainly focus on the land-use change process, driving mechanism, land system change trend prediction, and land-use environmental benefits [7,8,9,10]. The common methods and models of land-use system research include the system dynamics model, the cellular automata (CA) model [11,12], and the Markov model [13]. The traditional method is to measure the position and function of a certain land type in the land-use system by calculating the change of land type area. It lacks the overall concept of the land system and does not fully consider the relationship between various types of land in the land system. Complex network technology analyzes the change process of regional land-use from the perspective of a complex system, the behavior of individuals in the system, and the relationship between them. This method has been widely used in industry [14], the internet [15], transportation [16], disease transmission [17], commodity trade [18], etc. Using the complex network model indexes such as node degree, betweenness, and average shortest path, this paper analyzes the relationship between different land-use categories, which can better reflect the relationship between each type of land-use in the process of change in land-use.
The change in the type of land-use is the direct manifestation of the evolution of nature, society, economy, and the ecosystem. The complexity of its change mechanism and the interaction of driving factors determine the complicated linear correlation between land-use change and its driving factors. To sum up, we must explore the driving factors of land-use change from a holistic perspective.
However, many scholars mostly use the regression analysis method [19,20,21] when discussing the driving mechanism of land-use change, which has great limitations in analyzing multiple dependent variables and multiple independent variables [22]. The CCA method is a direct sequencing method combining ordination and multiple regression analysis. It is widely used in ecology to determine the mathematical relationship between soil’s physical and chemical properties and environmental factors [23,24,25,26], but it is rarely used in the analysis of driving factors of land-use change.
Therefore, the purpose of this study was to use the complex network model, and CCA method to (a) study the complex network analysis method to analyze the network structure characteristics of the transfer matrix, analyze the changes in the ecological environment in the past 35 years, identify the key change areas in the transfer matrix, and evaluate the stability of the land-use system; (b) discuss the driving forces behind the land-use changes. This will provide empirical research results for the study of land-use change and its trend and offer scientific support for regional grassland ecological management.

2. Materials and Methods
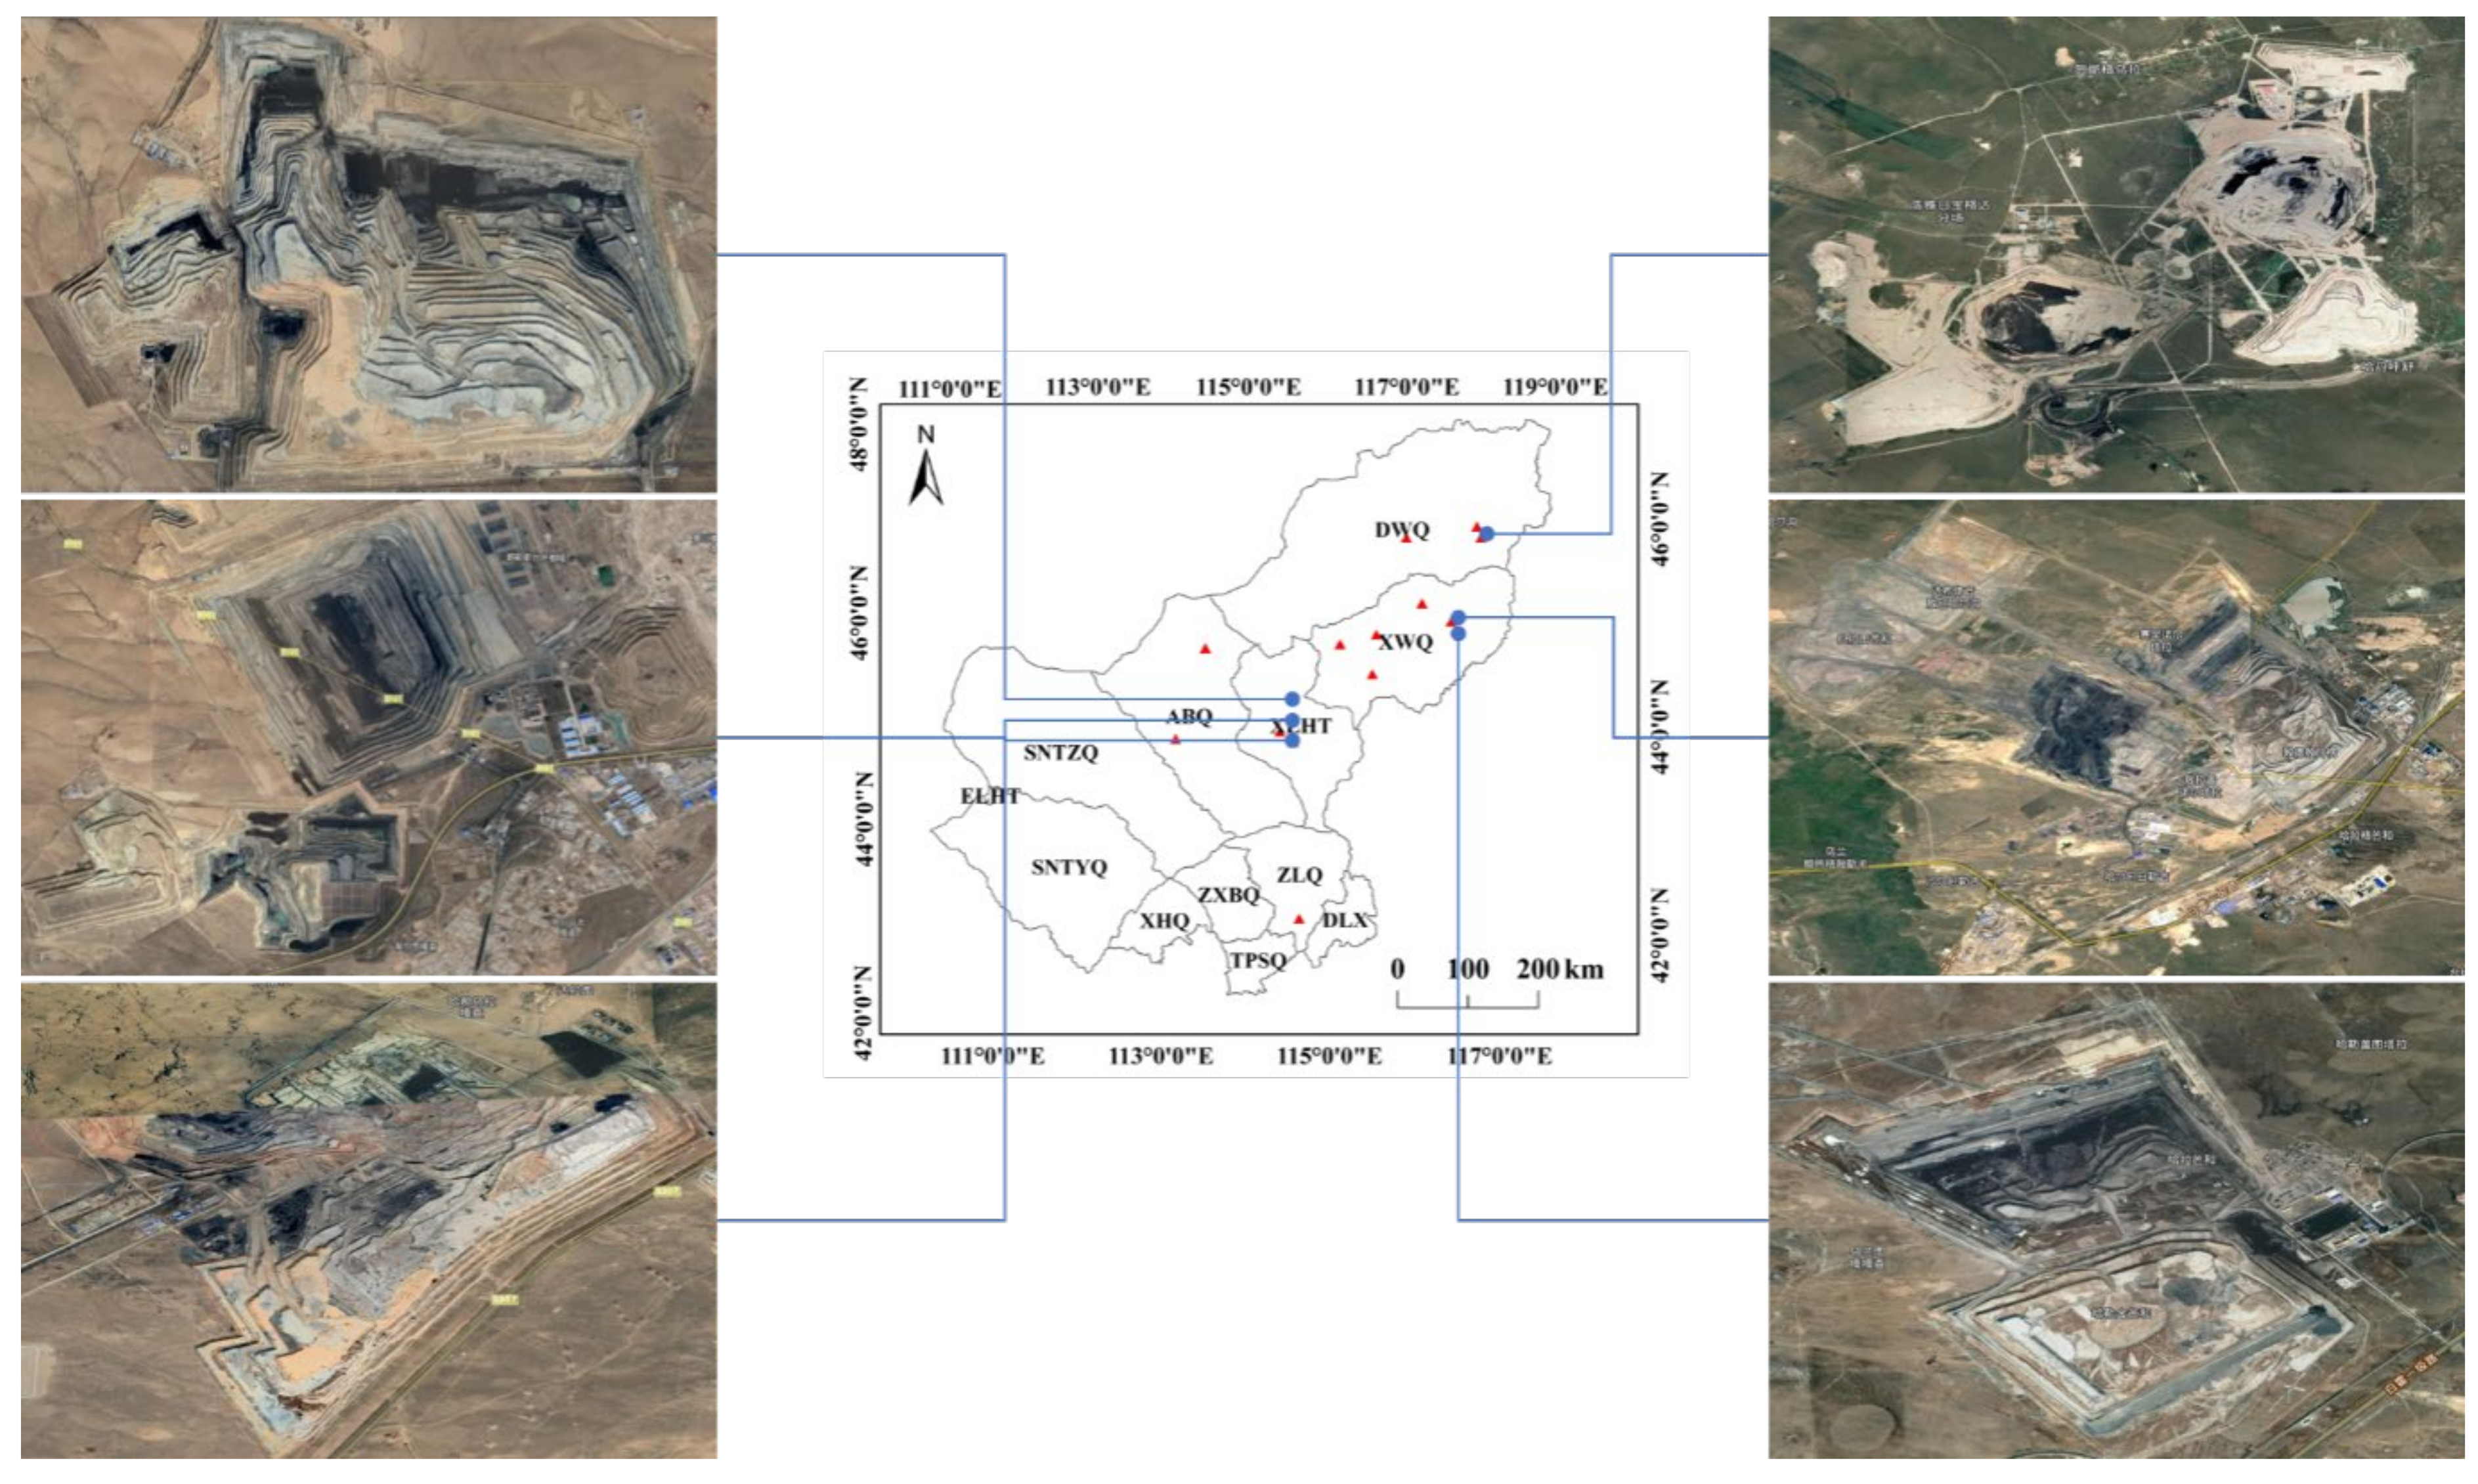
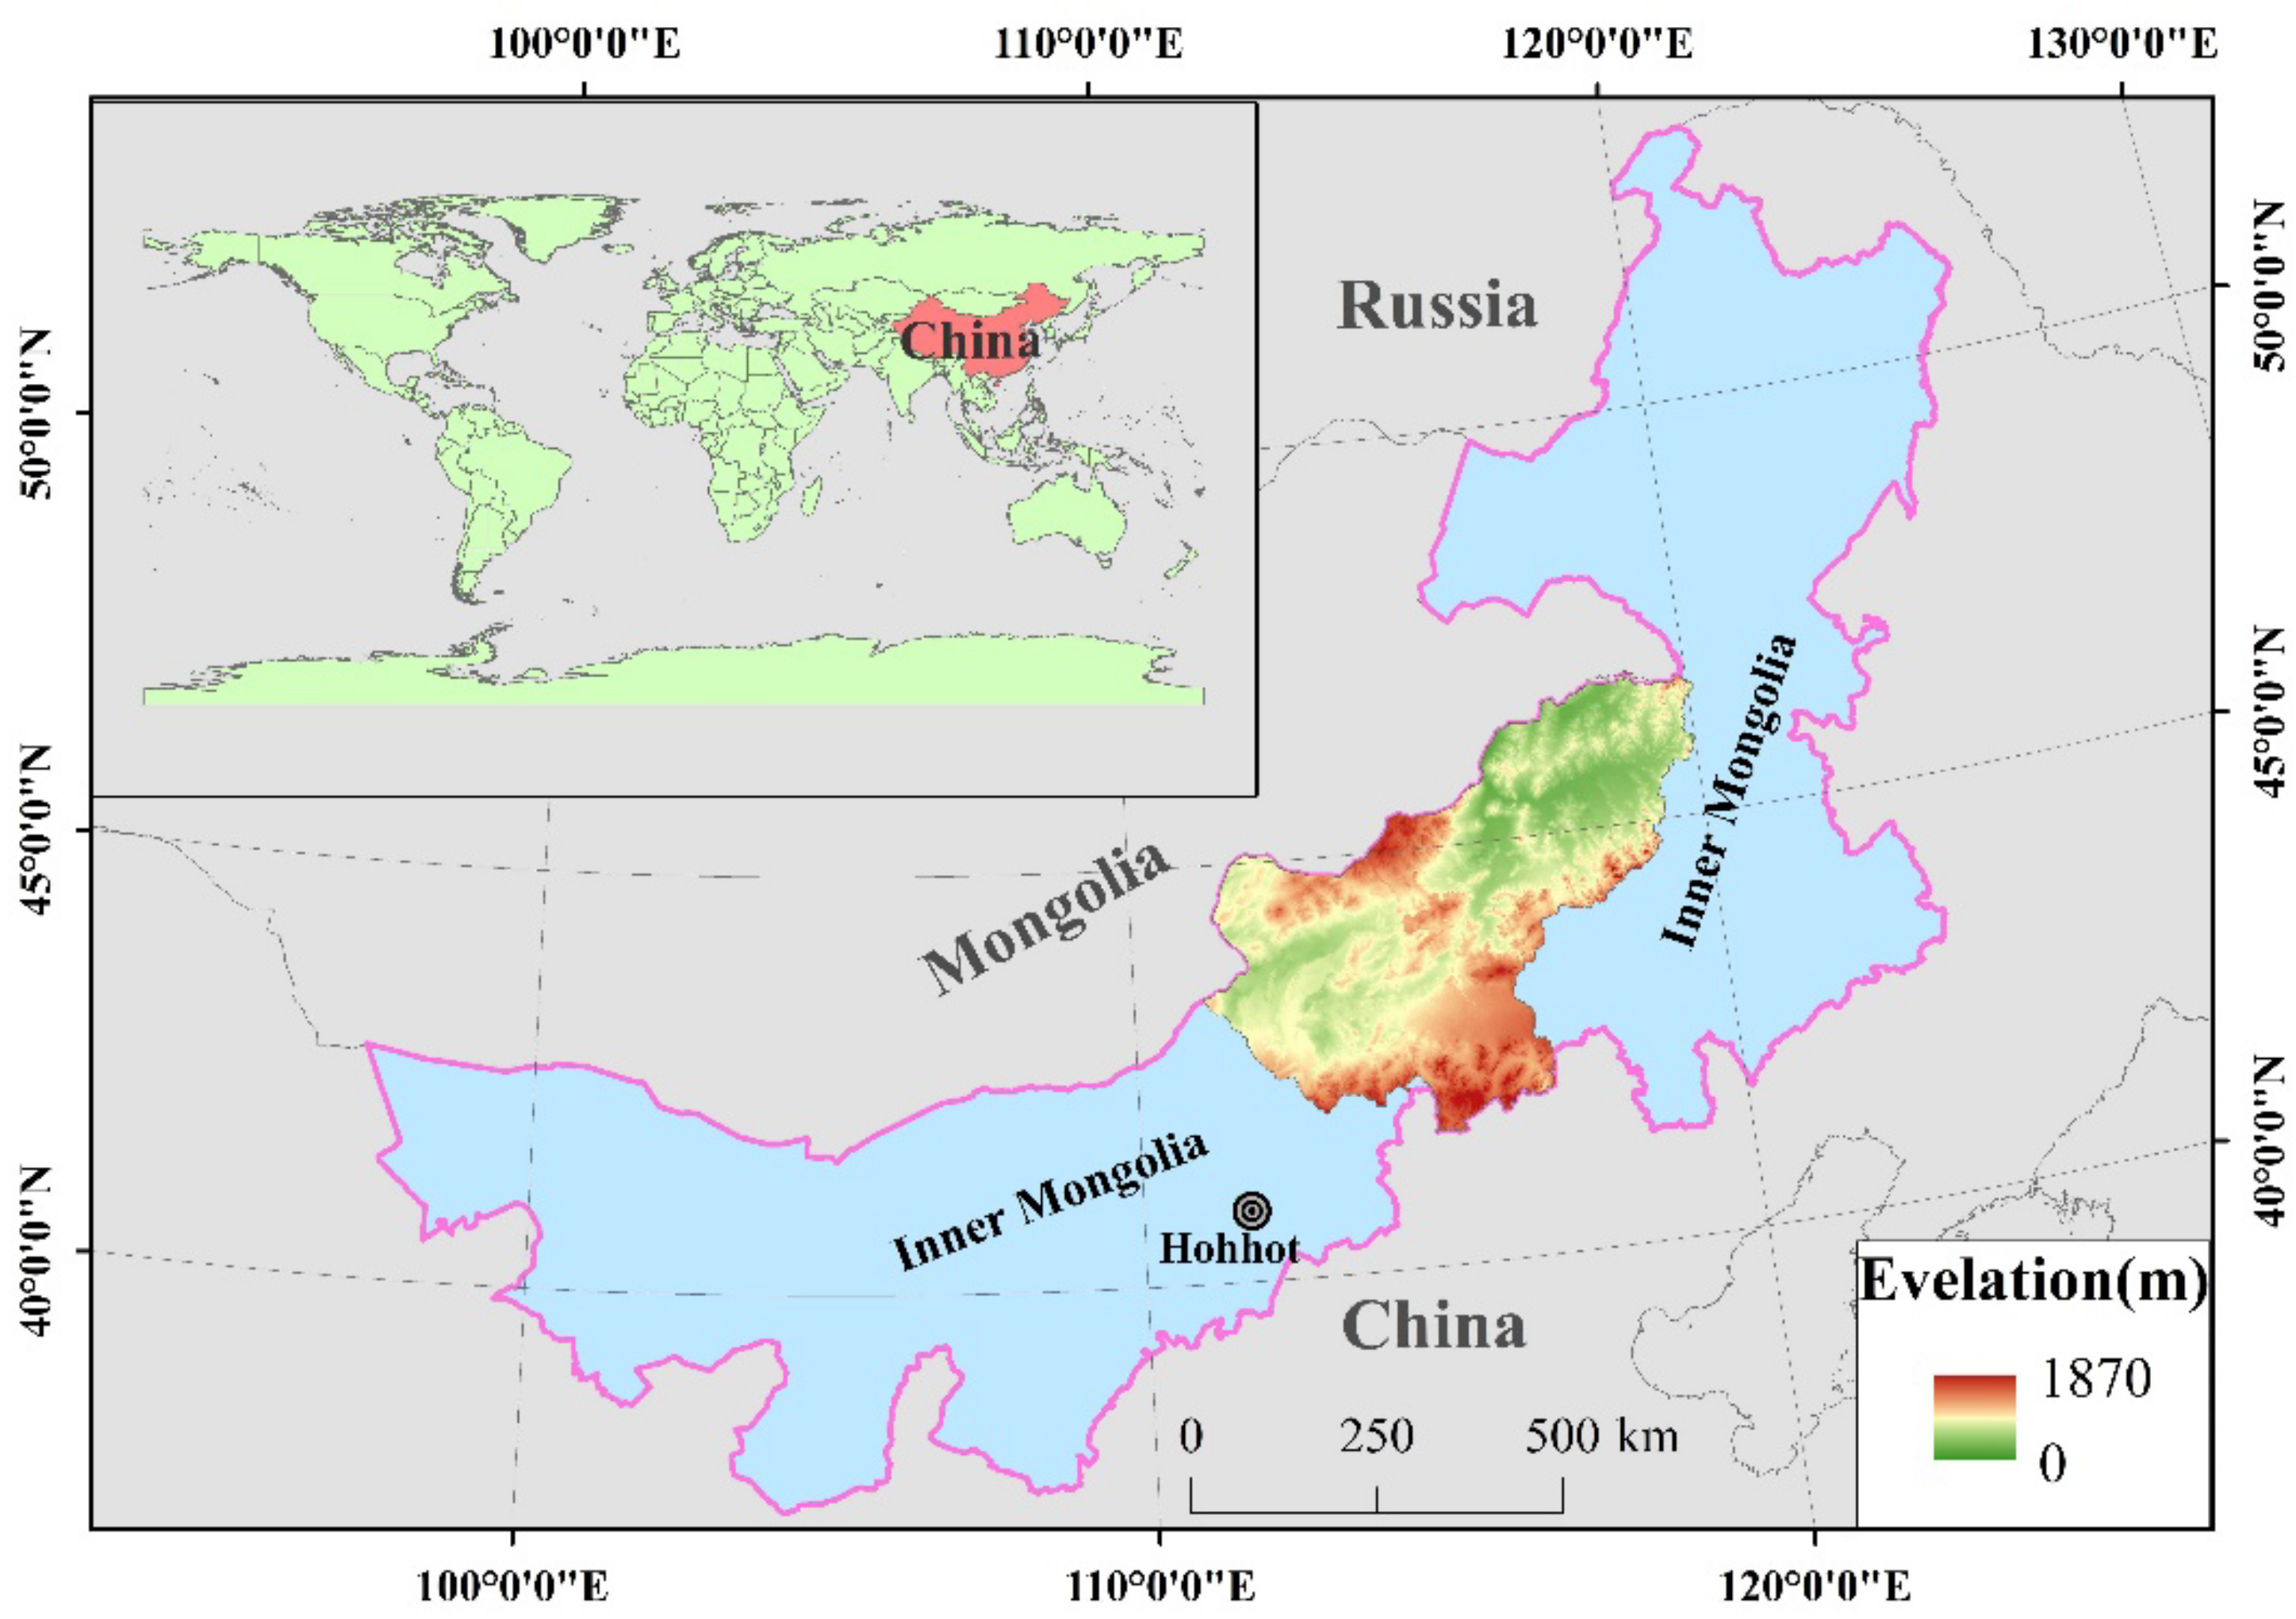
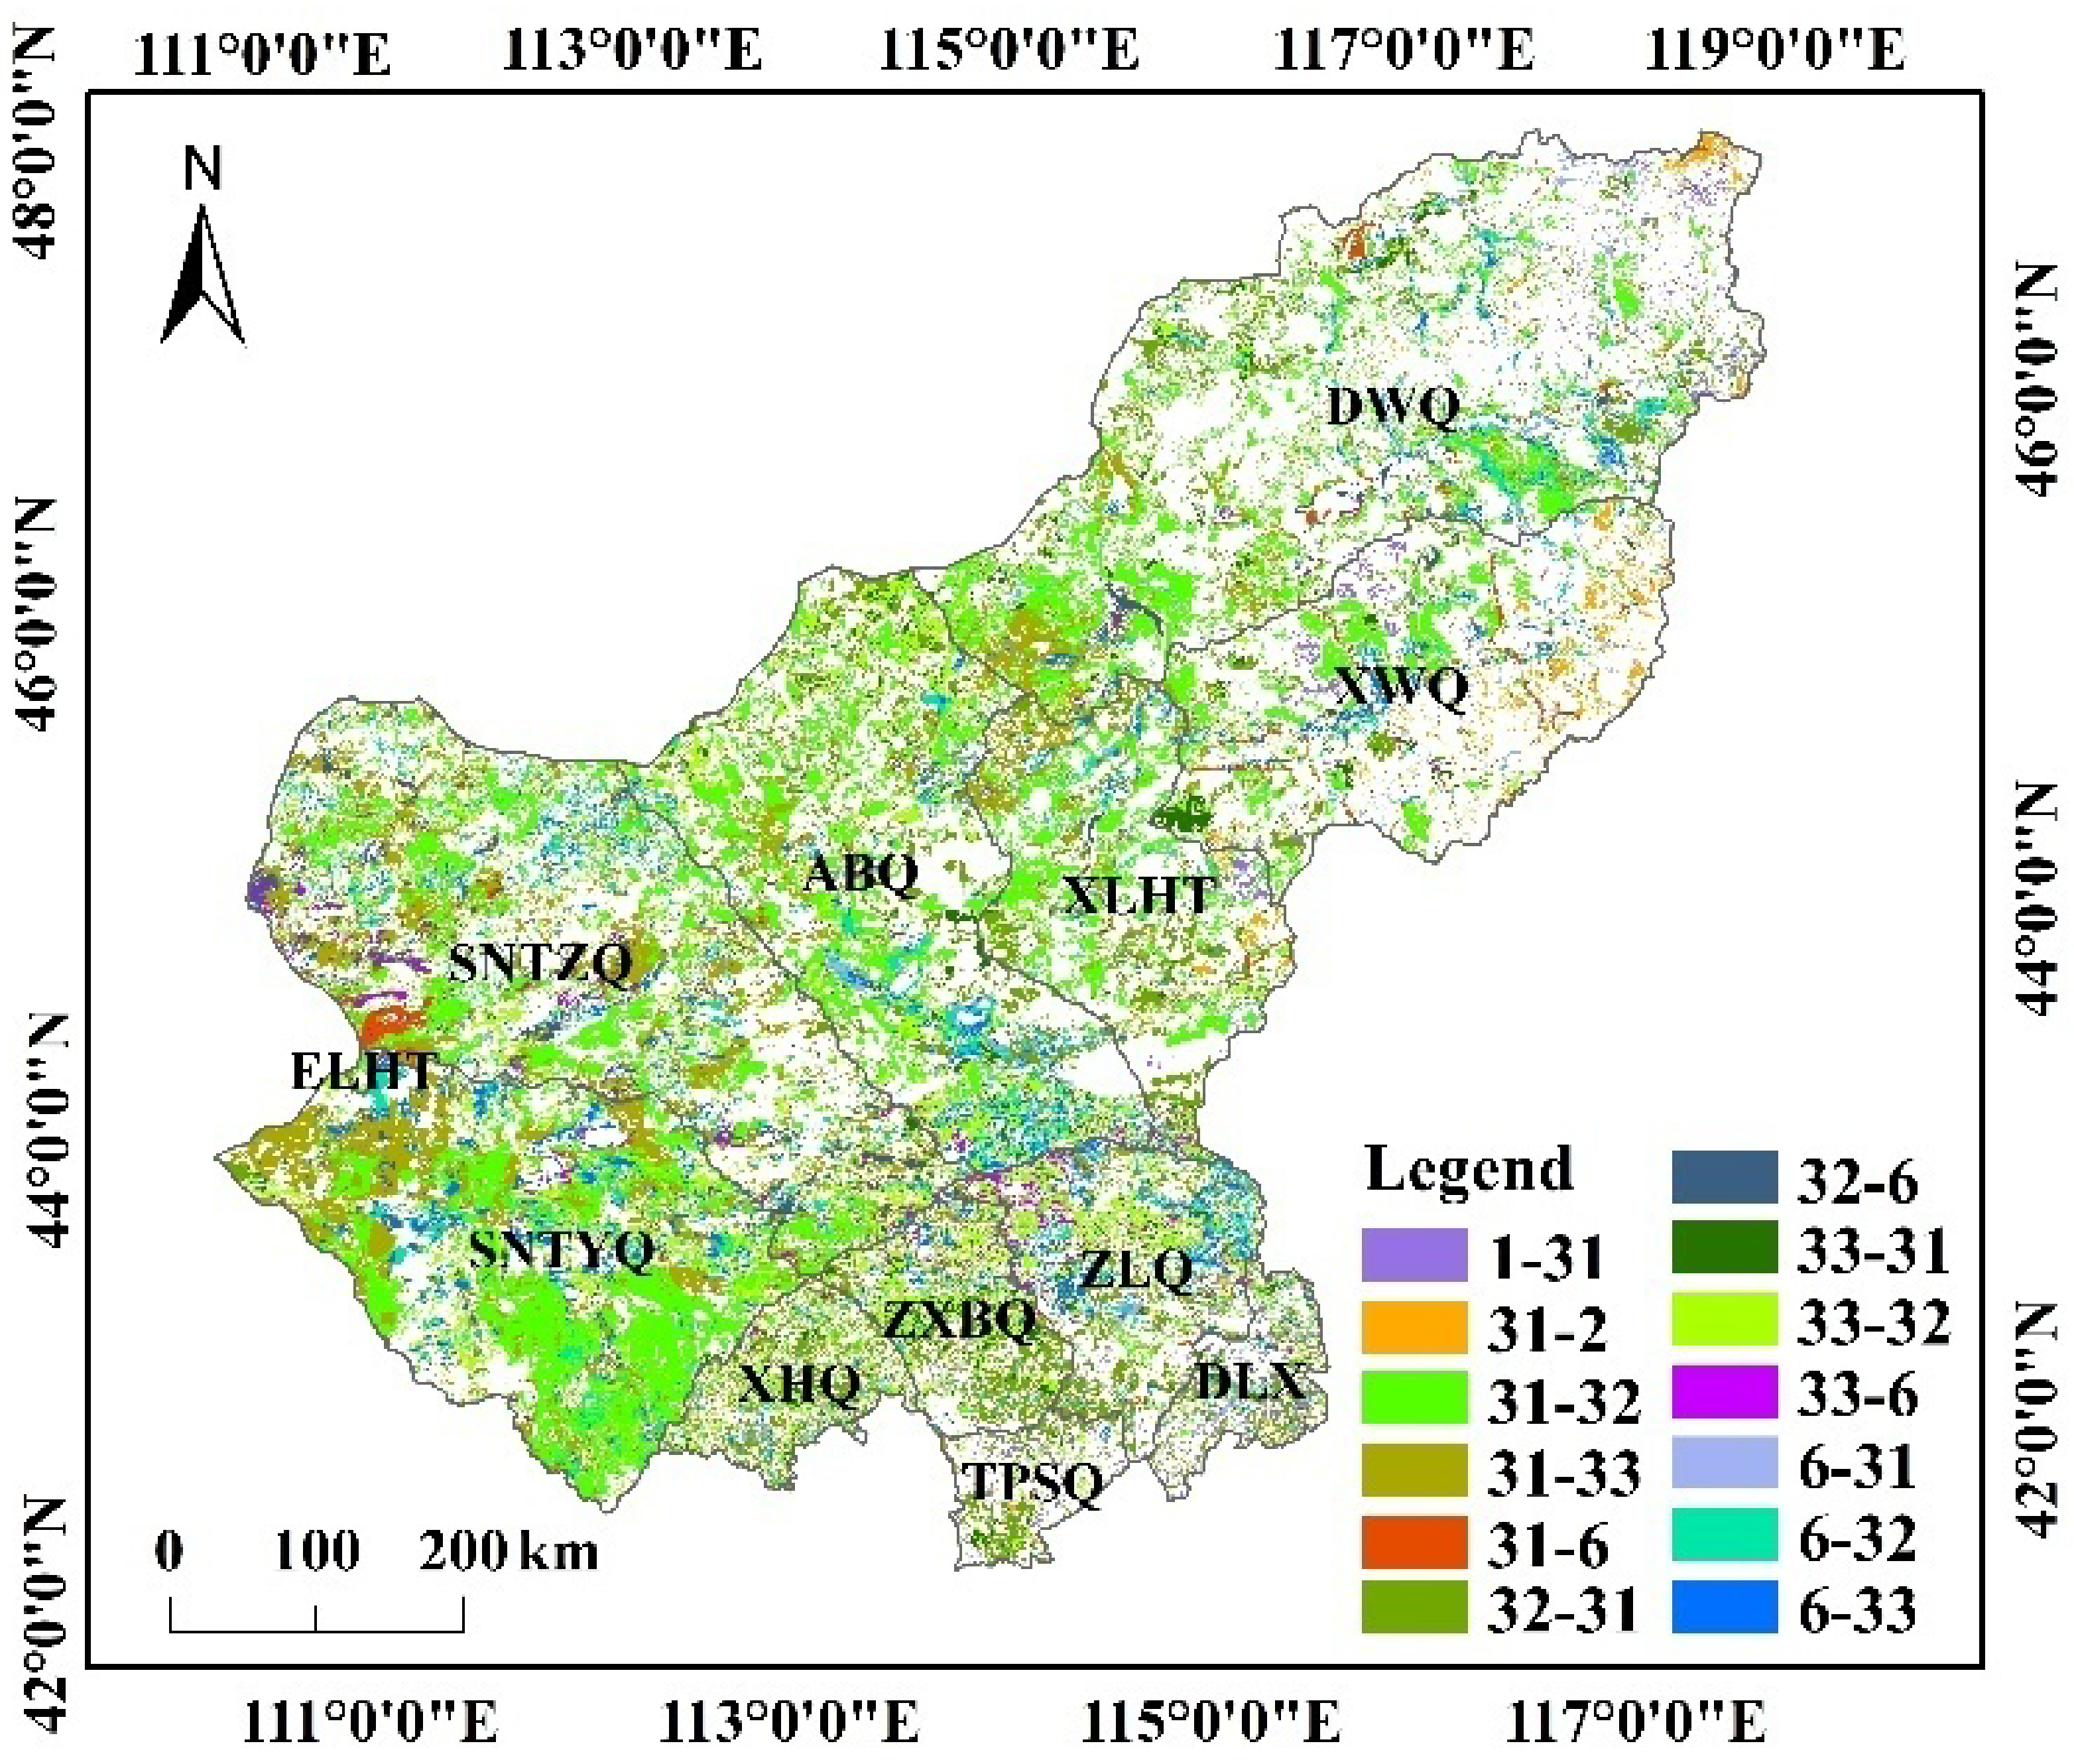
2.1. Study Area

The Xilingol is located in the central part of the Inner Mongolia Autonomous Region, which belongs to temperate arid and semi-arid areas. It lies to the southern edge of the Mongolia Plateau—the second largest “water tower” in China. It has a fragile ecological environment and enjoys a special ecological status (Figure 1). In addition, the continuous overload on resources and environment in recent years has led to a serious deterioration of the environment in northern pastoral areas, which has a far-reaching impact. Under the dual influence of global climate change and human activities, the grassland eco-environment system has been threatened and disturbed unprecedentedly, which leads to the destruction of land-use structure and function. This system is of great ecological significance to the study of change in land-use and its driving forces in sensitive and fragile areas. The purpose of this paper was to analyze the spatiotemporal evolution of land-use and its driving factors in Xilingol. Therefore, this study selected land-use data, meteorological data, and typical environmental factors of human activities in Xilingol between 1980 to 2015. We set up an evaluation model of “land-use-climate-human activities” and analyzed further the temporal and spatial evolution of land-use in Xilingol in the last 35 years. The results of this study can provide a basis for the rational planning and utilization of land resources by the government. It can also help in ecological environment protection and the sustainable development of the social economy in the Xilingol region.

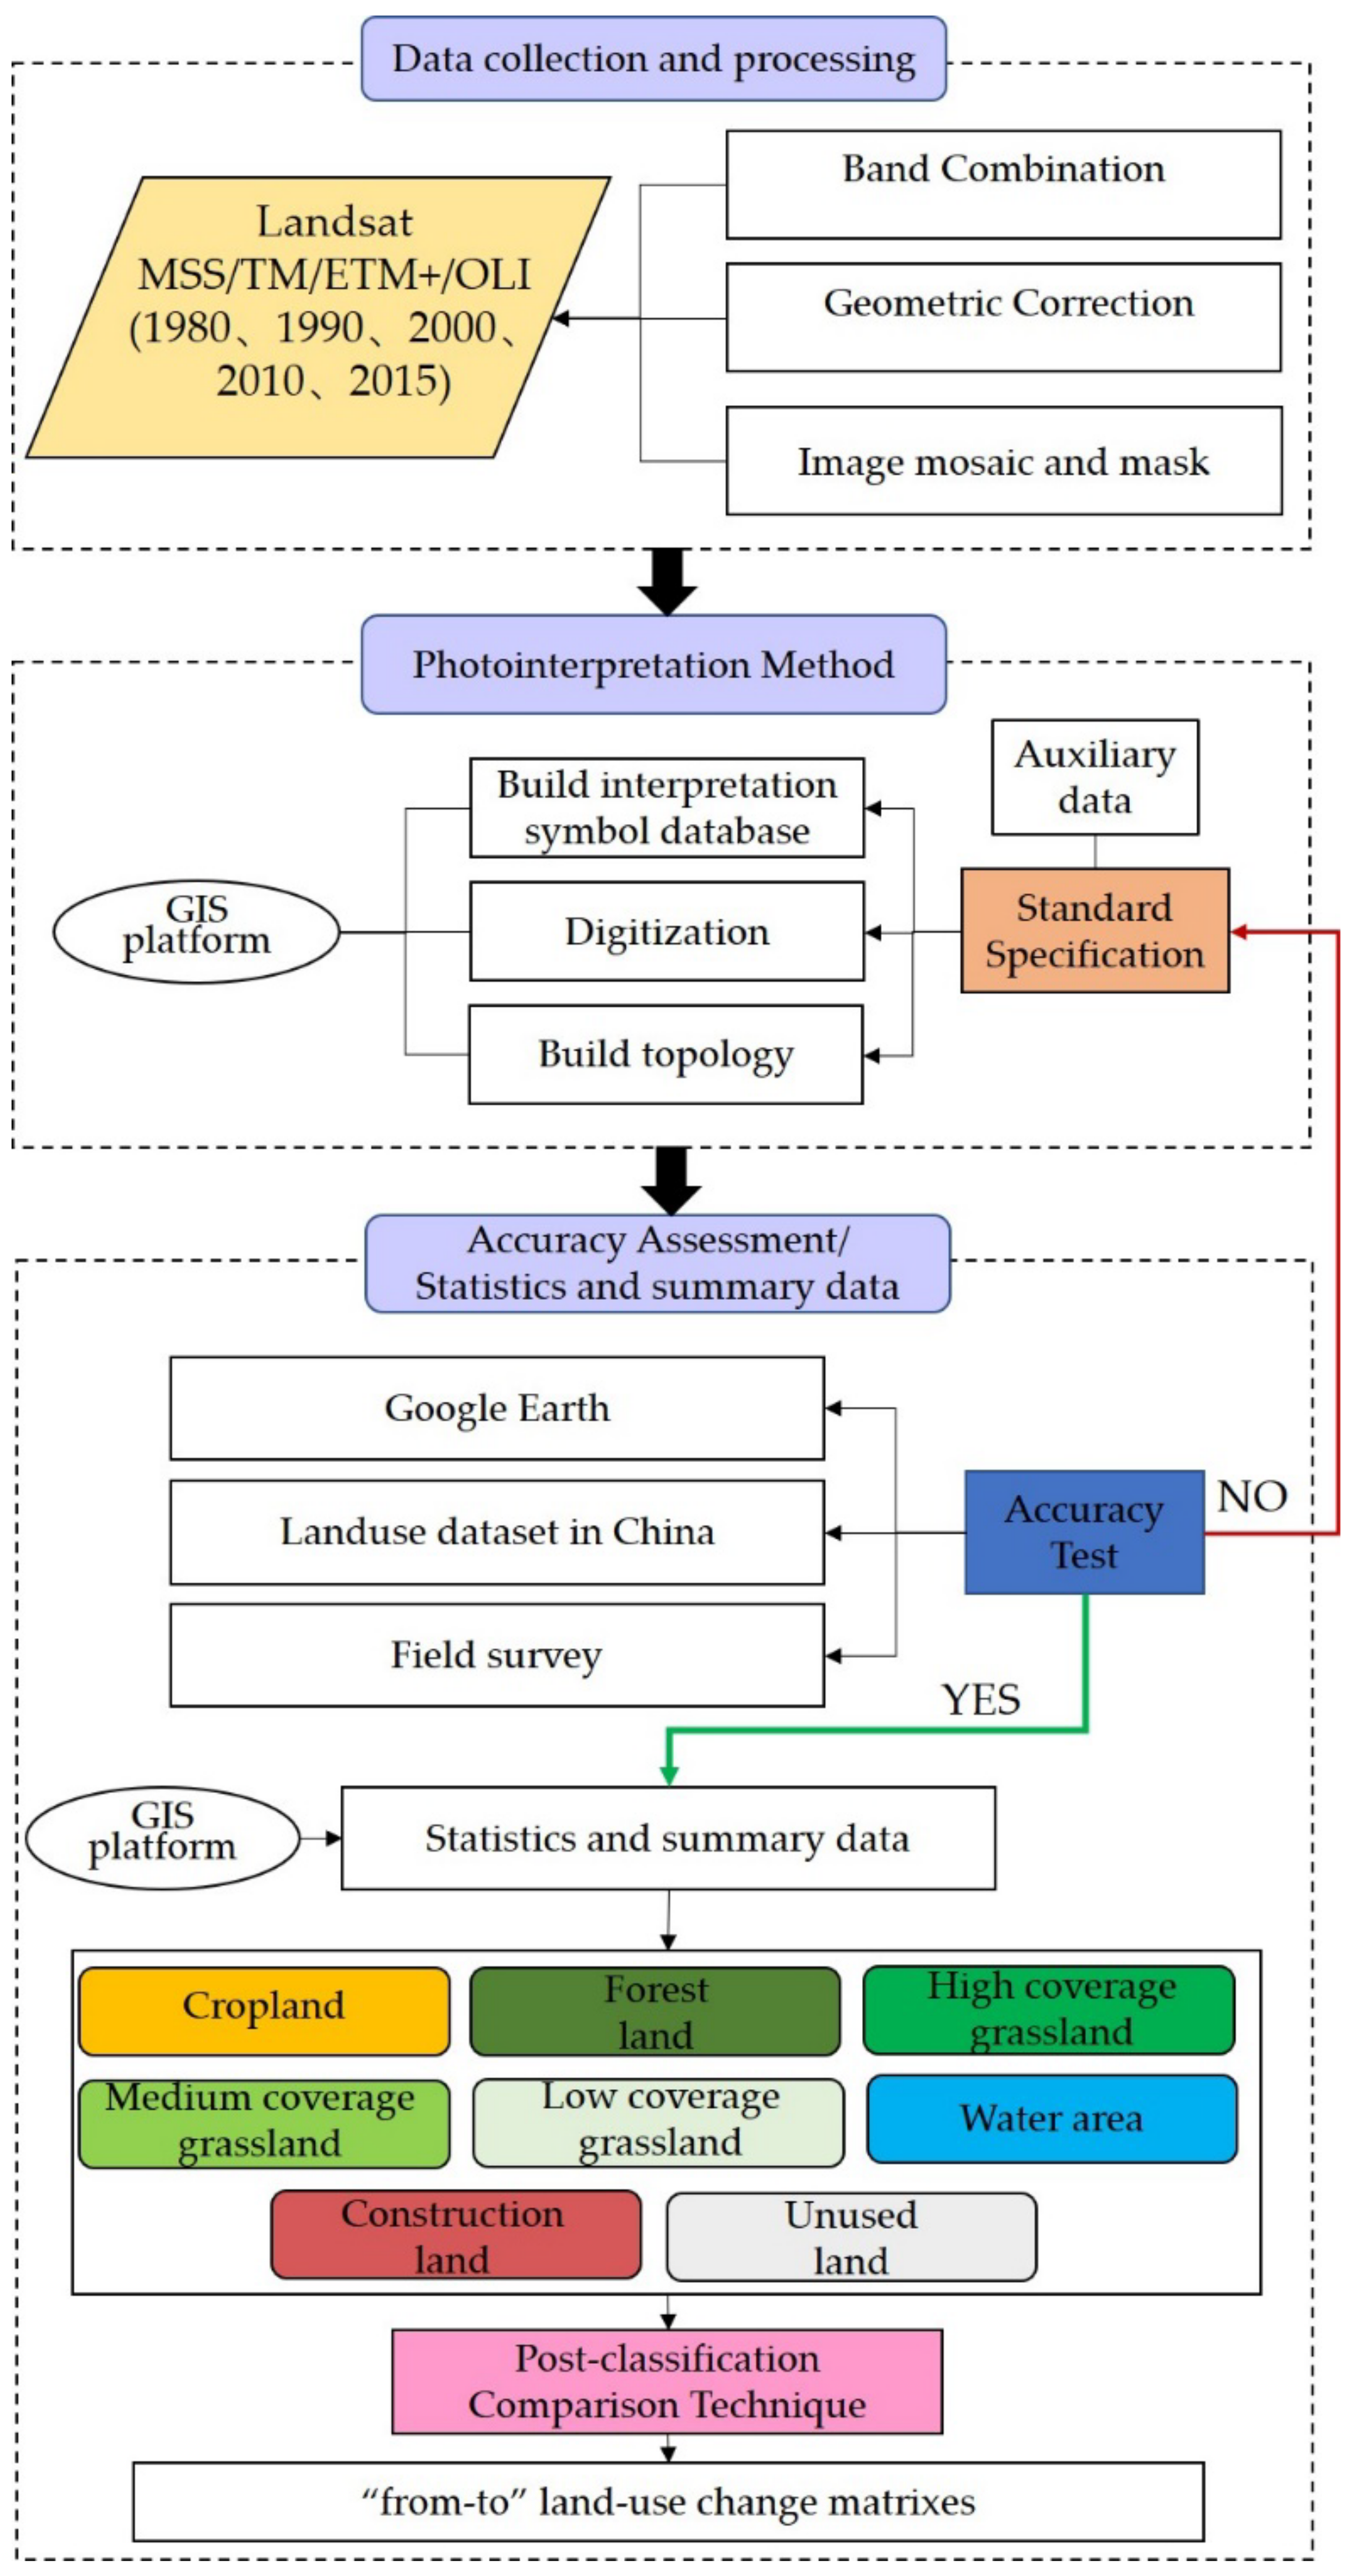
2.2. Data Sources and Methodology

2.2.1. Data Sources and Preprocessing

The LULC data for 1980, 1990, 2000, 2010, and 2015 were provided by Landsat MSS/TM/ETM+/OLI image. The remote sensing images were collected in July, August, and September with better weather conditions, and the cloud cover was less than 5%. The spatial resolution was 80 m (1975), 30 m (1990, 2000, 2005, 2010 and2015), The list of satellite data used in our study is given in Table 1. Auxiliary data include topographic map and vegetation map. These auxiliary data are used for photointerpretation and verification of land use classification. Prior to photointerpretation, all satellite images were geo-referenced by selecting ground control points and co-registered to the Krasovsky_1940_Albers coordinates based on the 1:100,000 topography. We used a photointerpretation method to interpret the types of land-use and land cover in the study area.
The steps of the computer-assisted photointerpretation method are as follows: establishing classification system, establishing interpretation symbol database, checking and processing the topology, and verifying interpretation results. In order to balance the quality and efficiency of classification, we used the combination of computational classification and manual interpretation of satellite images. The photointerpretation and digitization on the screen were carried out in a fixed ratio of 1:100000. Interpretation quality control standards were as follows: The smallest patch of land-use change we selected was not less than 3 * 3 pixels (240 * 240 m, 5.76 ha) for MSS, and for the 2015/2020/2000 and 1990 TM/ETM images, the minimum mapping patch was 8 * 8 pixels (240 * 240 m, 5.76 ha) and the deviation of the depicted position on the screen was less than 1 pixel. According to the image spectral characteristics, combined with the field measured data, and referring to the relevant geographical maps, we analyzed the geometric shape, color characteristics, texture characteristics and spatial distribution of the ground objects. We used the ArcGIS software to identify land-use types on screen.
The verification method mainly relies on the combination of Google Earth, the land-use dataset in China and field verification. If the sampling accuracy does not reach 85%, the data are corrected again (Table 1). Considering that most areas in the study area belong to grassland type, we also used vegetation index data and field survey data to further verify the accuracy of the interpretation results of grassland secondary type. There are 51 sample sites of the field verification survey involved in this article. The classification used in this study was based on the land-use types defined by J. Y. Liu et al. [27], and combined with the actual situation of the study area, were classified into eight aggregated classes of land cover: cropland (code:1), forest land (code:2), high coverage grassland (code:31), medium coverage grassland (code:32), low coverage grassland (code:33), water area (code:4), construction land (code:5), and unused land (code:6) (Table 2). Relevant research results have proved that the post-classification techniques are widely used in most of the LULC research studies and achieve high overall accuracy [28]. Therefore, this study also realized the land use change transfer matrixes through the post-classification method (Figure 2).
There are many types of data used to analyze the driving factors behind the change in land-use, including meteorological data, topography, socio-economic, and location conditions. The socio-economic data were downloaded from the National Bureau of Statistics (http://www.stats.gov.cn/ accessed on 24 December 2021). This data is based on the average annual data of meteorological elements from 20 meteorological stations in Xilingol and its surrounding areas, using the inverse distance weight method (IDW) to obtain the spatial distribution map of precipitation and temperature in the study area. Digital Elevation Model (DEM), river, and other geographic information data were downloaded from the National Basic Geographic Information System database (http://nfgis.nsdi.gov.cn, accessed on 24 December 2021).

2.2.2. Construct Complex Network Model

Both natural and human environments belong to a hugely complex system, and there are various complex network relationships between them. Nodes and connections (boundaries) are the two most basic elements of complex networks in which nodes represent different individuals in the real system, while connections represent the relationships between individuals. In the complex system of land-use, we regard the types of land-use as nodes and the transformation between the different types of land-use as a connection. The complex network of land-use is a network with direction and weight. Direction shows that one type of land-use is transformed into another type of land, such as A-type land to B-type land. Weight shows that the connection line has attribute information, such as the size of the land area from A-type to B-type. In the network structure diagram of the land-use transfer matrix, the arrow represents the direction, and the line’s thickness represents the size of the transfer amount (Figure 3, Table 3). In addition, the software Pajek was used to calculate betweenness centrality and average distance.
k i i n t = j = 1 N t a j i t ; k i o u t t = j = 1 N t a i j t
where N t means the number of land-use types in time t, a i j and a j i means the value of network connection matrix of the land-use transfer matrix.
1.
Betweenness centrality
The node betweenness of a complex network is an important basis for judging the key types of land-use complex systems. The larger the number of nodes, the more important is the type of land-use in the whole complex network [29,30]. Its change behavior can control the structure and nature of the system to a great extent and plays the role of “broker” or “gatekeeper” in a complex network. For the complex network system of land-use transfer matrix, the key nodes represent the key types of land-use in the network system, and the process of regional land-use change largely revolves around these key types of land-use. When the role of the key types of land-use weakens, many transformation relations in the land-use system will weaken and even disappear.
2.
Average distance (AveD)
Average distance (AveD) is used to measure the overall transmission performance of the network. It refers to the average distance between all nodes in the network [31]. As network nodes are gradually removed, the average shortest path between nodes becomes larger, which makes the connectivity of the network worse. The AveD describes the degree of node dispersion or network accessibility in the network, reflecting the overall stability of the system [32]. As the land-use transfer matrix network of the average distance is enlarged, it becomes difficult to transfer between different land types. It shows that the complex network system has strong overall stability, which is defined as:
A ve D = 1 1 2 N ( N + 1 ) i j d i j
where A ve D means average distance, N means the total number of nodes, d i j denotes the shortest path length between node i and j .
First, there is a schematic diagram complex network of land use in Figure 4a, in which the circles indicate the land use types and the connection line represents the transformation between each type. Then we take Figure 4b which is a one sub-network of Figure 4a to further illustrate the degree, betweenness centrality and average distance of complex network of land use transformations.
Assuming that we are calculating betweenness centrality of “d” in Figure 4b, first, the transformation between land use types must be through “d” to make it a central. Then we can see from the Figure 4b that four routes meet the above condition. That is “a-d-e”, “b-d-e”, “c-d-e”, and “a-d-c”; among them “a-d-e”, “b-d-e”, and “c-d-e” are the ones with the shortest distance from “a”, “b”, “c”, to “e”. Under this situation the betweenness centrality of “d” is both marked as 1. However, there are two short routes from “a to c”, that is “a-d-c” and “a-b-c”, so at this point the betweenness centrality of “b” and “d” is 0.5 respectively. Therefore, the betweenness centrality of “d” is 1 + 1 + 1 + 0.5 = 3.5 in Figure 4b.

2.2.3. Canonical Correspondence Analysis (CCA)

CCA is a sorting method developed from correspondence analysis. It combines correspondence analysis with multiple regression analyses, and each step of the calculation is regressed with environmental factors. CCA, also known as multiple direct gradient analysis, is a multivariate analysis method to analyze the relationship between species and their living environment. In this study, the CCA method was used to analyze the driving forces of land-use change in Xilingol. The results of CCA analysis can be made into a two-dimensional map, which can directly show the corresponding spatial relationship between changes in types of land-use and their driving factors. This is helpful in analyzing the change of land-use transfer under the constraints of various driving factors. The arrow vector in the figure represents the environmental factor, the quadrant represents the positive and negative correlation between the environmental factor and the sorting axis, and the length of the arrow indicates the contribution of the driver to the sorting. The length of the arrow indicates the influence of the driving factor on the sorting. The longer the arrow, the greater the contribution of the driving factor to the sorting, that is, the greater the impact on the distribution of change in land-use and vice versa. The angle between the arrow line and the sorting axis represents the correlation between an environmental factor and the sorting axis. The smaller the angle, the higher is the correlation and vice versa. More detailed information of CCA is given in http://www.canoco5.com/ (accessed on 24 December 2021). The calculation results of CCA ranking are realized by the international general software Canoco 4.5 and cartographic software CanoDraw 4.x.

3. Results

3.1. Evolutionary Features of Land-Use System in Xilingol League

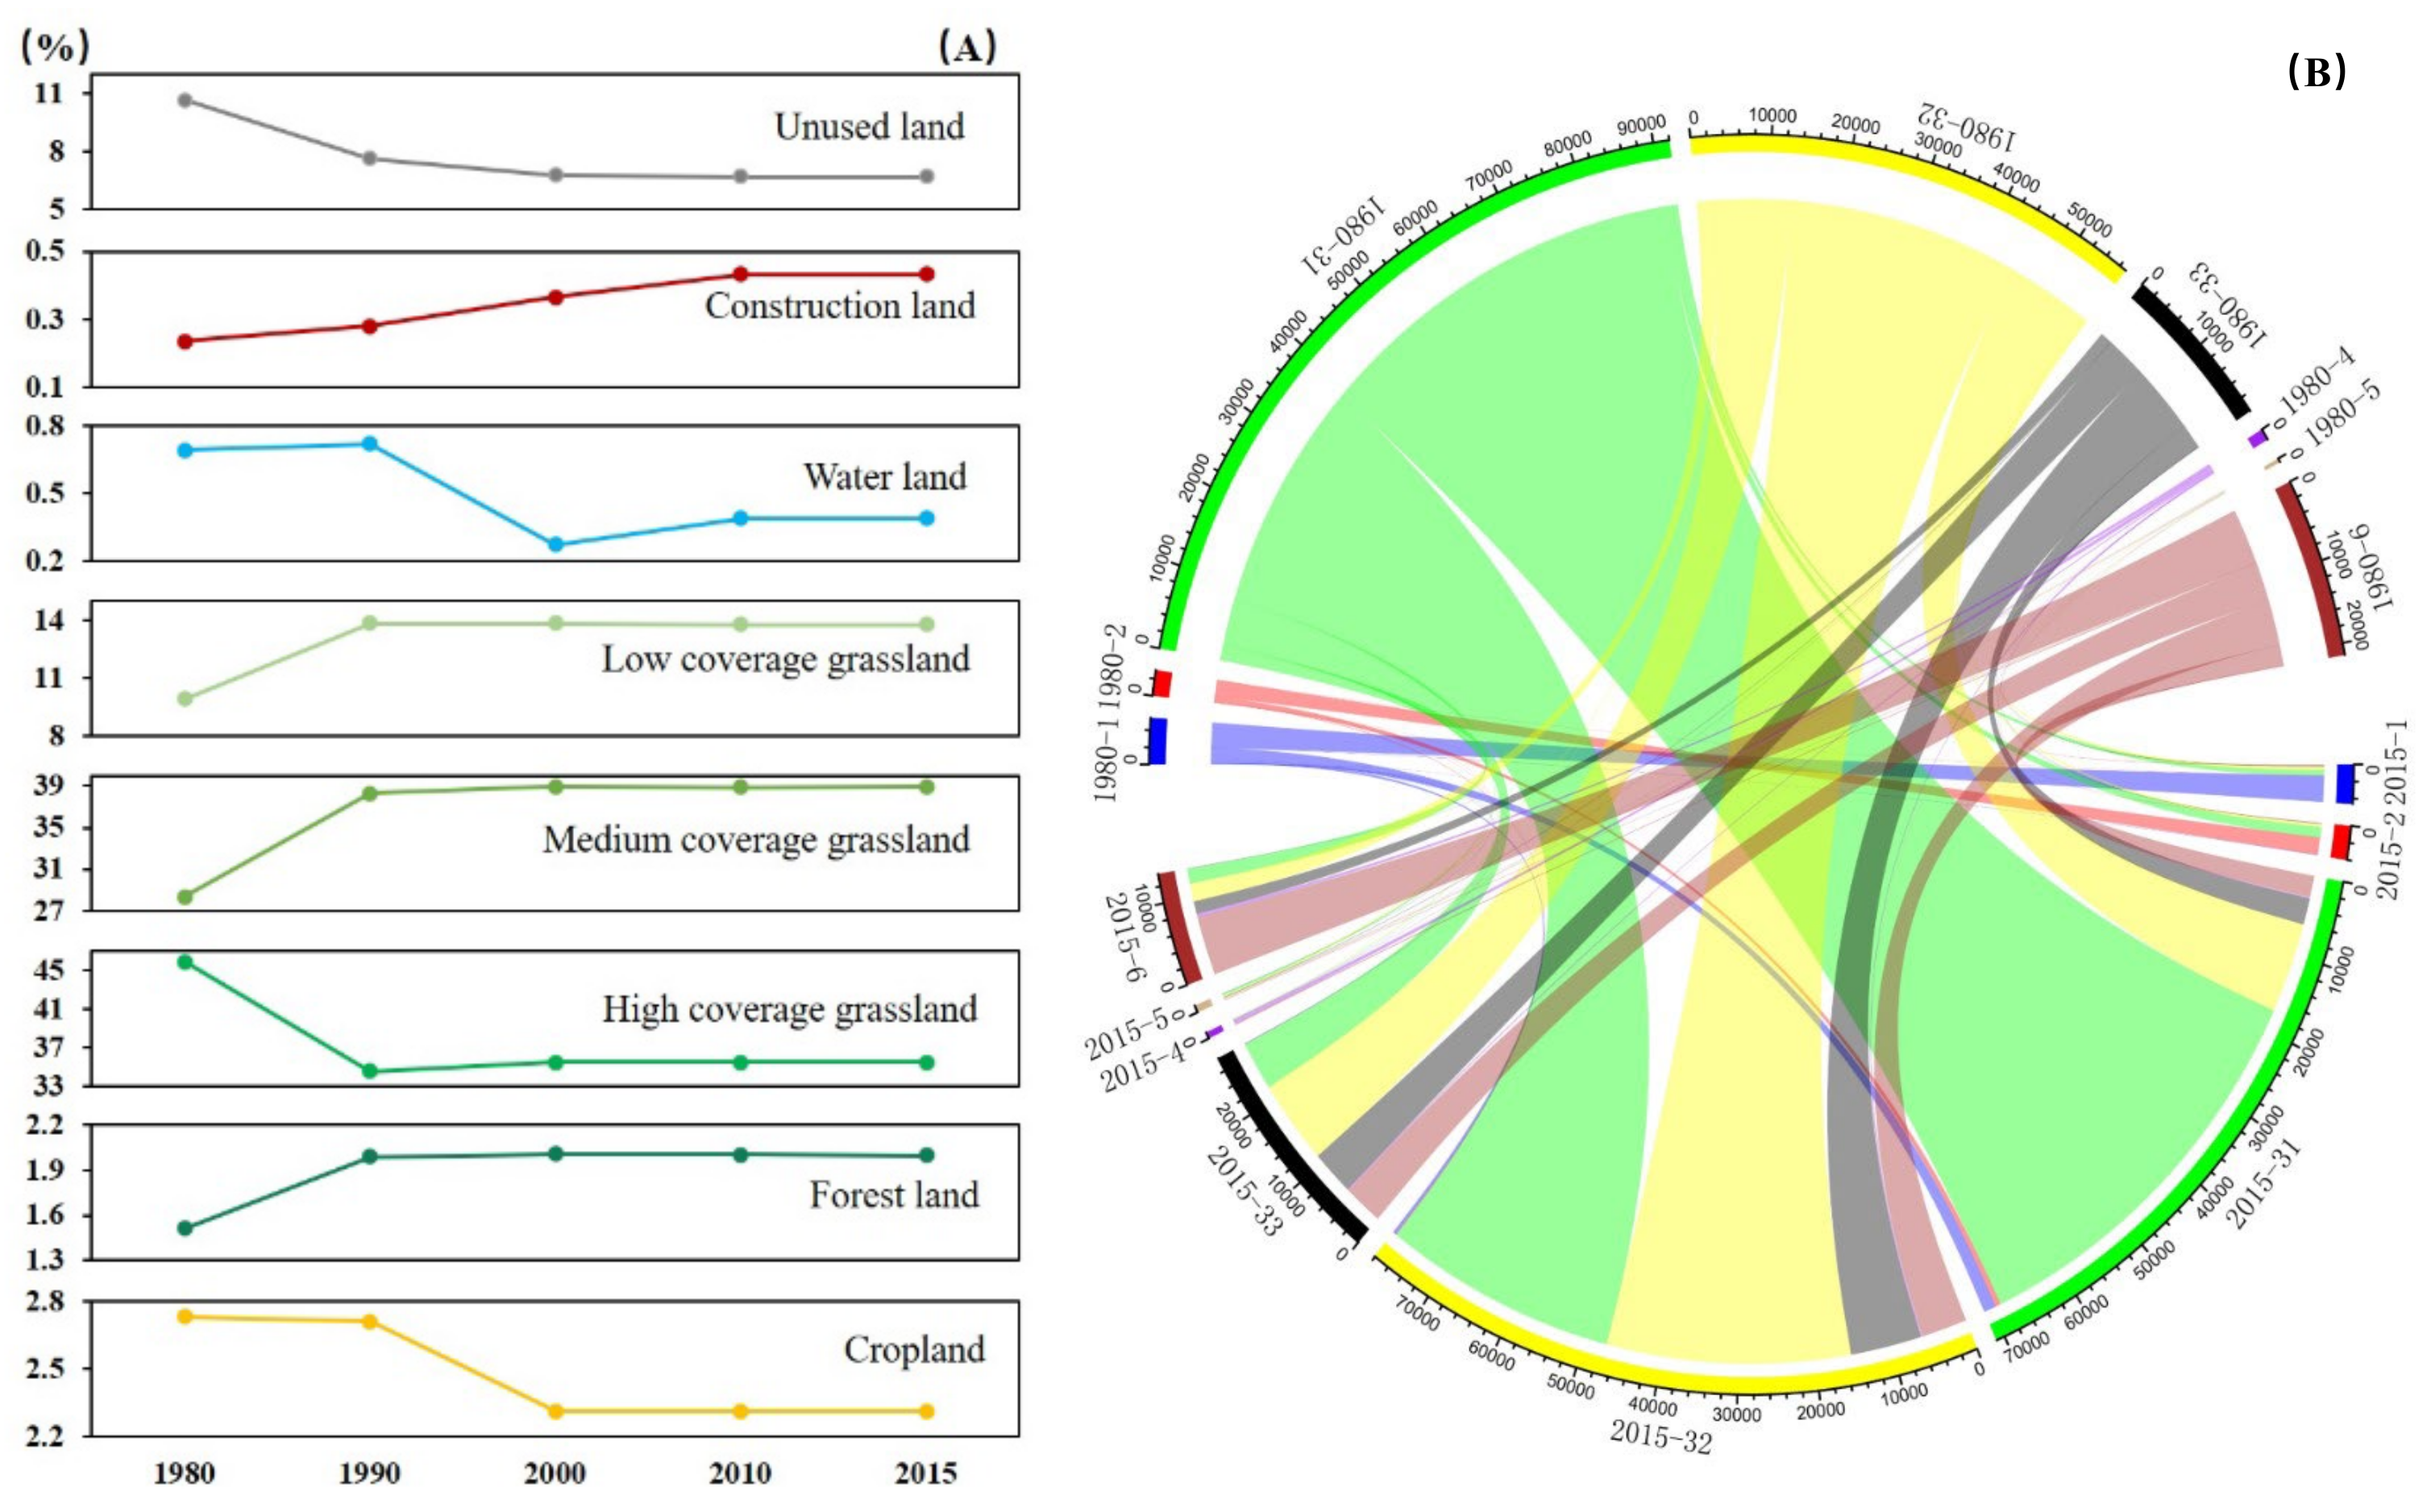
3.1.1. Change Characteristics of Ecosystem Function

The degree of land type indicates the number of types of land transformed with this type of land, under the support of ucinet6.0 software, using the calculation formula (1), the value of each different type of land-use is calculated. The degree of each land type can be divided into out-degree and in-degree. If the ratio is greater than 1, it means that the number of transfer out directions is greater than that of turning in directions, which belongs to the “transfer out” type of land. If the ratio is less than 1, it means that the number of transfers out directions is less than that of transfer in indirections, which belongs to the “transfer in” type of land (Table 3).
The results of the node degree of land-use transfer matrix network in Xilingol are shown in Table 3 and Figure 5 The average ratio values of out and in-degrees of high coverage grassland, medium coverage grassland, low coverage grassland, unused land, water area, and cultivated land are 1.378, 1.066, 1.38, 1.502, 2.869, and 2.276, respectively, which are all greater than 1, belonging to the “transfer out” type. The average ratio values of out and in degrees of construction land and forest land are less than 1, indicating that it is a “transfer in” type of land. In the last 35 years, construction land and forest land have always belonged to “transfer in” type of land, and their total area has increased. The net increase of construction land and forest land is 618.691 km2 and 1874.238 km2, respectively. The proportion of the urban population in Xilingol has been increasing, and the urbanization rate has increased from 22.84% in 2000 to 51.78% in 2016. The main reason for the rapid growth of construction land in the study area is that grassland, cultivated land, and other types of land are becoming occupied by urban construction land due to regional, social, and economic development and urbanization. Therefore, the ratio of out-degrees and in-degrees of grassland in the study area is higher. Forest land always belongs to “transfer in” type, which benefits Xilingol by strengthening and protecting the ecological environment. In order to improve and optimize the ecological environment quality of the Beijing and Tianjin area, control desertification, and curb dust hazard, the state initiated the implementation of the “Beijing-Tianjin Sandstorm Source Control Project” in June 2000. In addition, a series of ecological projects for “returning farmland to forest and grassland” was introduced and implemented. The above ecological construction projects and measures have played a positive role in restoring natural vegetation and improving ecological function [33,34]. The complex network in land-use transfer matrix of out-degree and in-degree of the natural environment is generally higher than that of the human environment in Xilingol. Grassland is a special type of land in the study area, which has a high value of out-degree and in-degree. This may end efforts to the out-degree while the in-degree of the natural environment is well above the out-degree and in-degree of the human environment. The ratio of out-degree and in-degree in the natural environment and the human environment shows a fluctuating development. The ratio value appears to have a declining trend between 1980–2000 and 2010–2015 and appears to have an increasing trend between 2000–2010. The change in the ratio of out-degree and in-degree in the water area is significant between 1980–1990 and 2000–2010. The ratio of water area out-degree and in-degree is greater than 1, which means that it belongs to the “transfer out” type. However, between 1990–2000 and 2010–2015, the ratio of water area out-degree and in-degree was less than 1, which means that it belongs to the “transfer in” type. The change of water area is more sensitive than other types of land-use, and it is easily affected by changes in the external environment. Change in precipitation is one of the important factors affecting the change in the water area. Many studies have proved that the area of lakes has shrunk under the dual action of climate change and human activities in the Mongolian plateau [35,36].

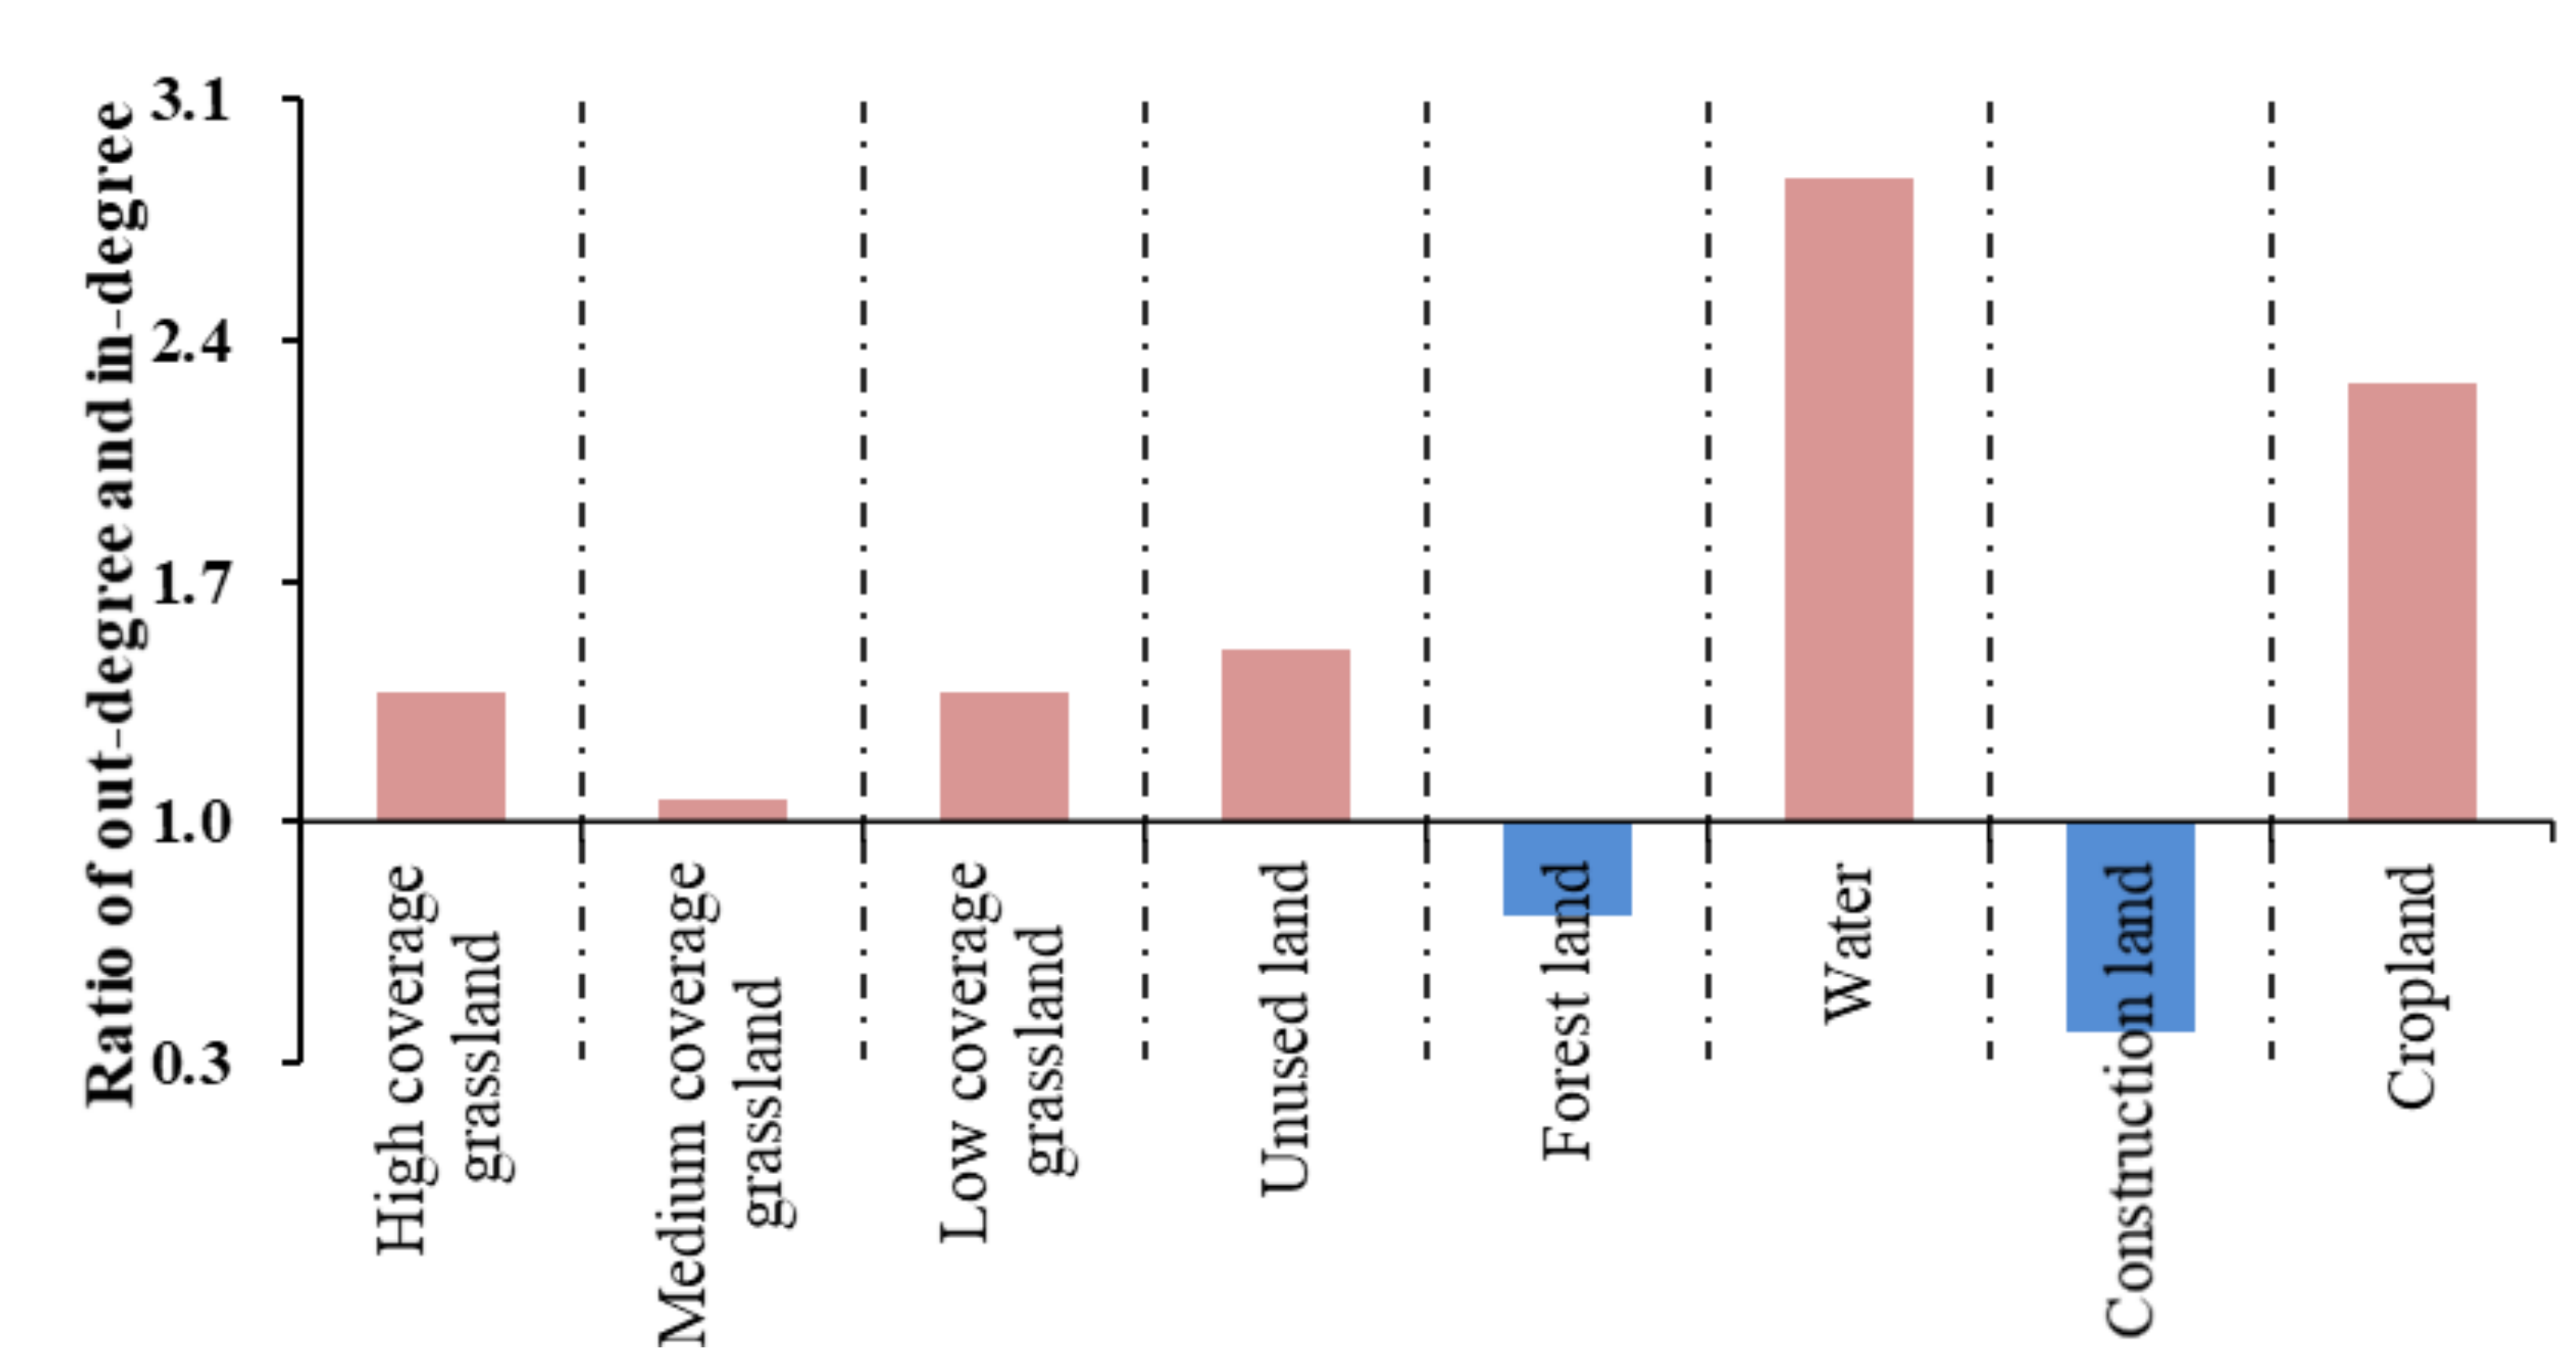
3.1.2. Identification of Key Land Types in the Land-Use Complex System

The node betweenness of a complex network is an important basis to judge the key land class of complex systems. The betweenness centrality values of land-use transfer matrix in the study areas during 1980–1990, 1990–2000, 2000–2010, and 2010–2015 are shown in Table 4. We found that the betweenness centrality value of high coverage grassland and medium coverage grassland was highest between 1980–1990. Both values were 7.024. Between 2000–2010, the betweenness centrality value of high coverage grassland, medium coverage grassland, low coverage grassland, and forest land was the highest at 2.183. Between 2010–2015, the betweenness centrality value of medium coverage grassland was the highest at 16.071. High coverage grassland plays a key role in the change of land types between 1980–1990, 1990–2000, 2000–2010, and 2005–2010. Between 2010 and 2015, high coverage grassland and medium coverage grassland become the key types of land which play an important role in controlling the land-use change process. Grassland is the main type of land in the study area, accounting for more than 85% of the regional land area. The change of grassland will inevitably cause change of other land areas in the surrounding region. Therefore, grassland plays an important role in the system, which is the key class of complex network systems. Between 1980 and 2015, the grassland area in Xilingol showed a fluctuating decline, and the change in trend was obvious (Figure 6).
Xilingol’s urbanization is very fast. According to the statistical data from the National Bureau of Statistics, the proportion of people living in urban areas increased from 23.3% in 1980 to 63.87% in 2015, and the construction land increased from 472.387 km2 in 1980 to 869.074 km2 in 2015. In the study area, the conversion of types of land-use is obvious. The most obvious types of land-use are medium coverage grassland, high coverage grassland, low coverage grassland, and construction land.

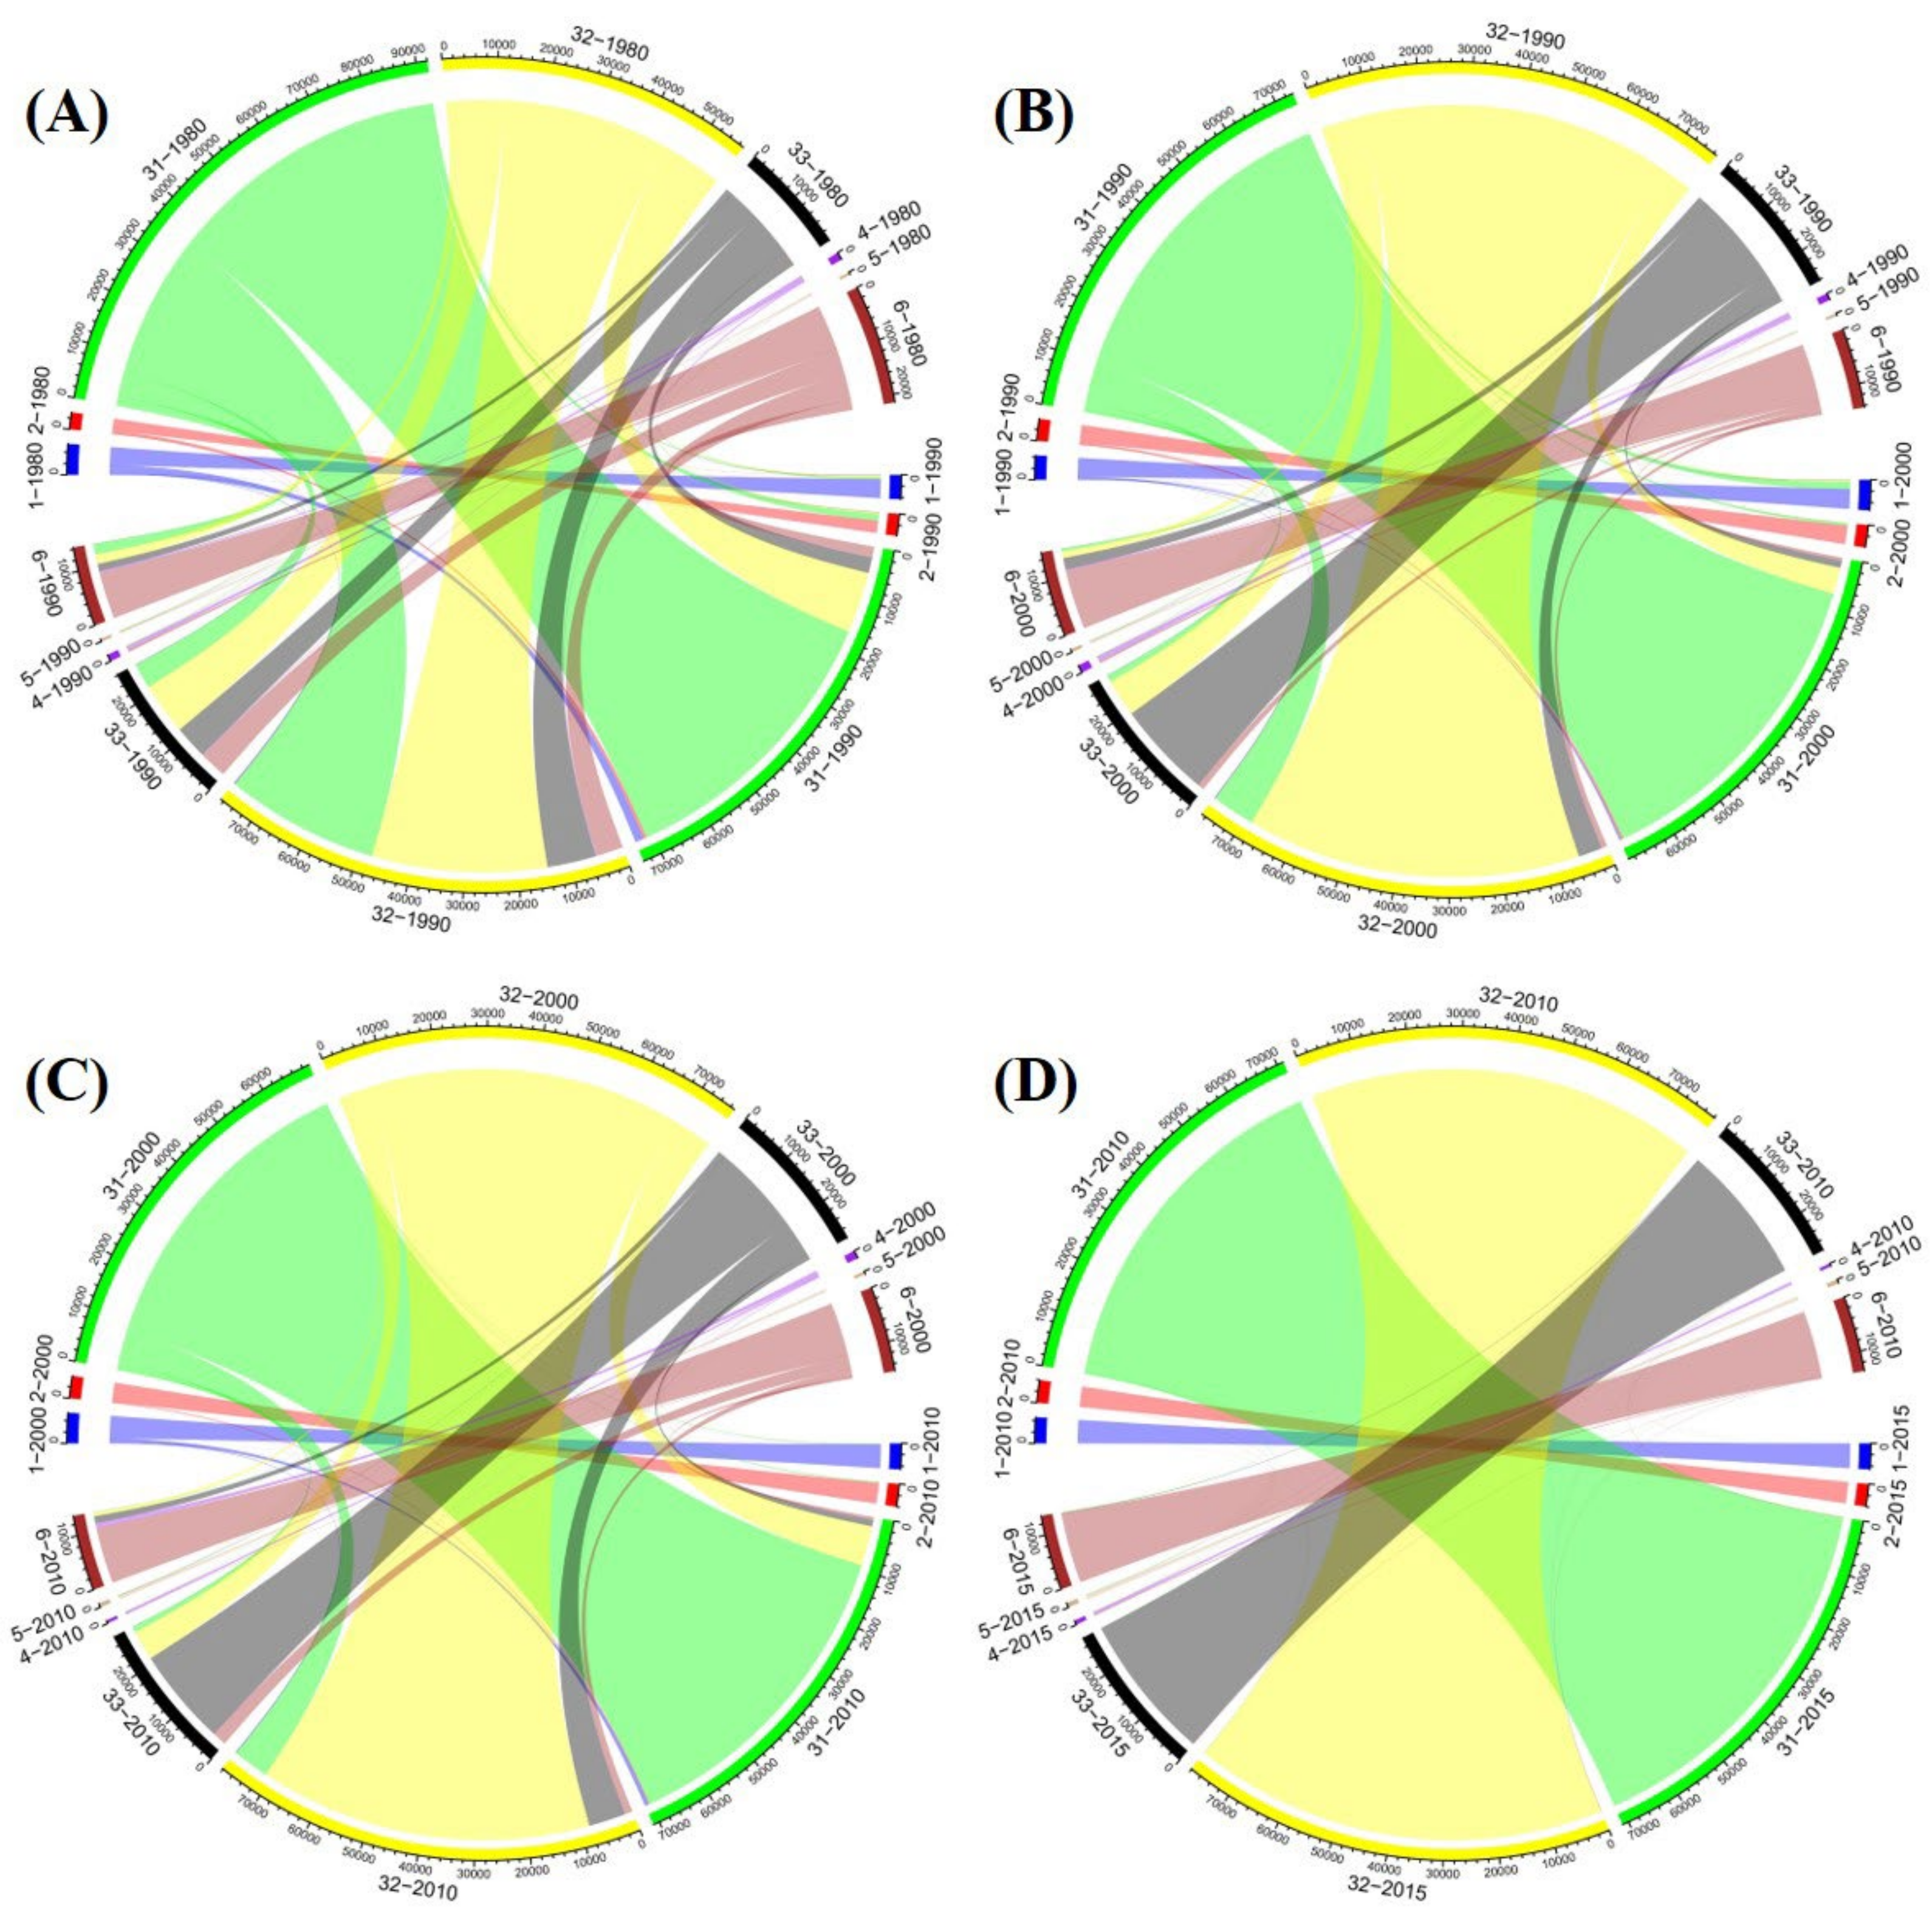
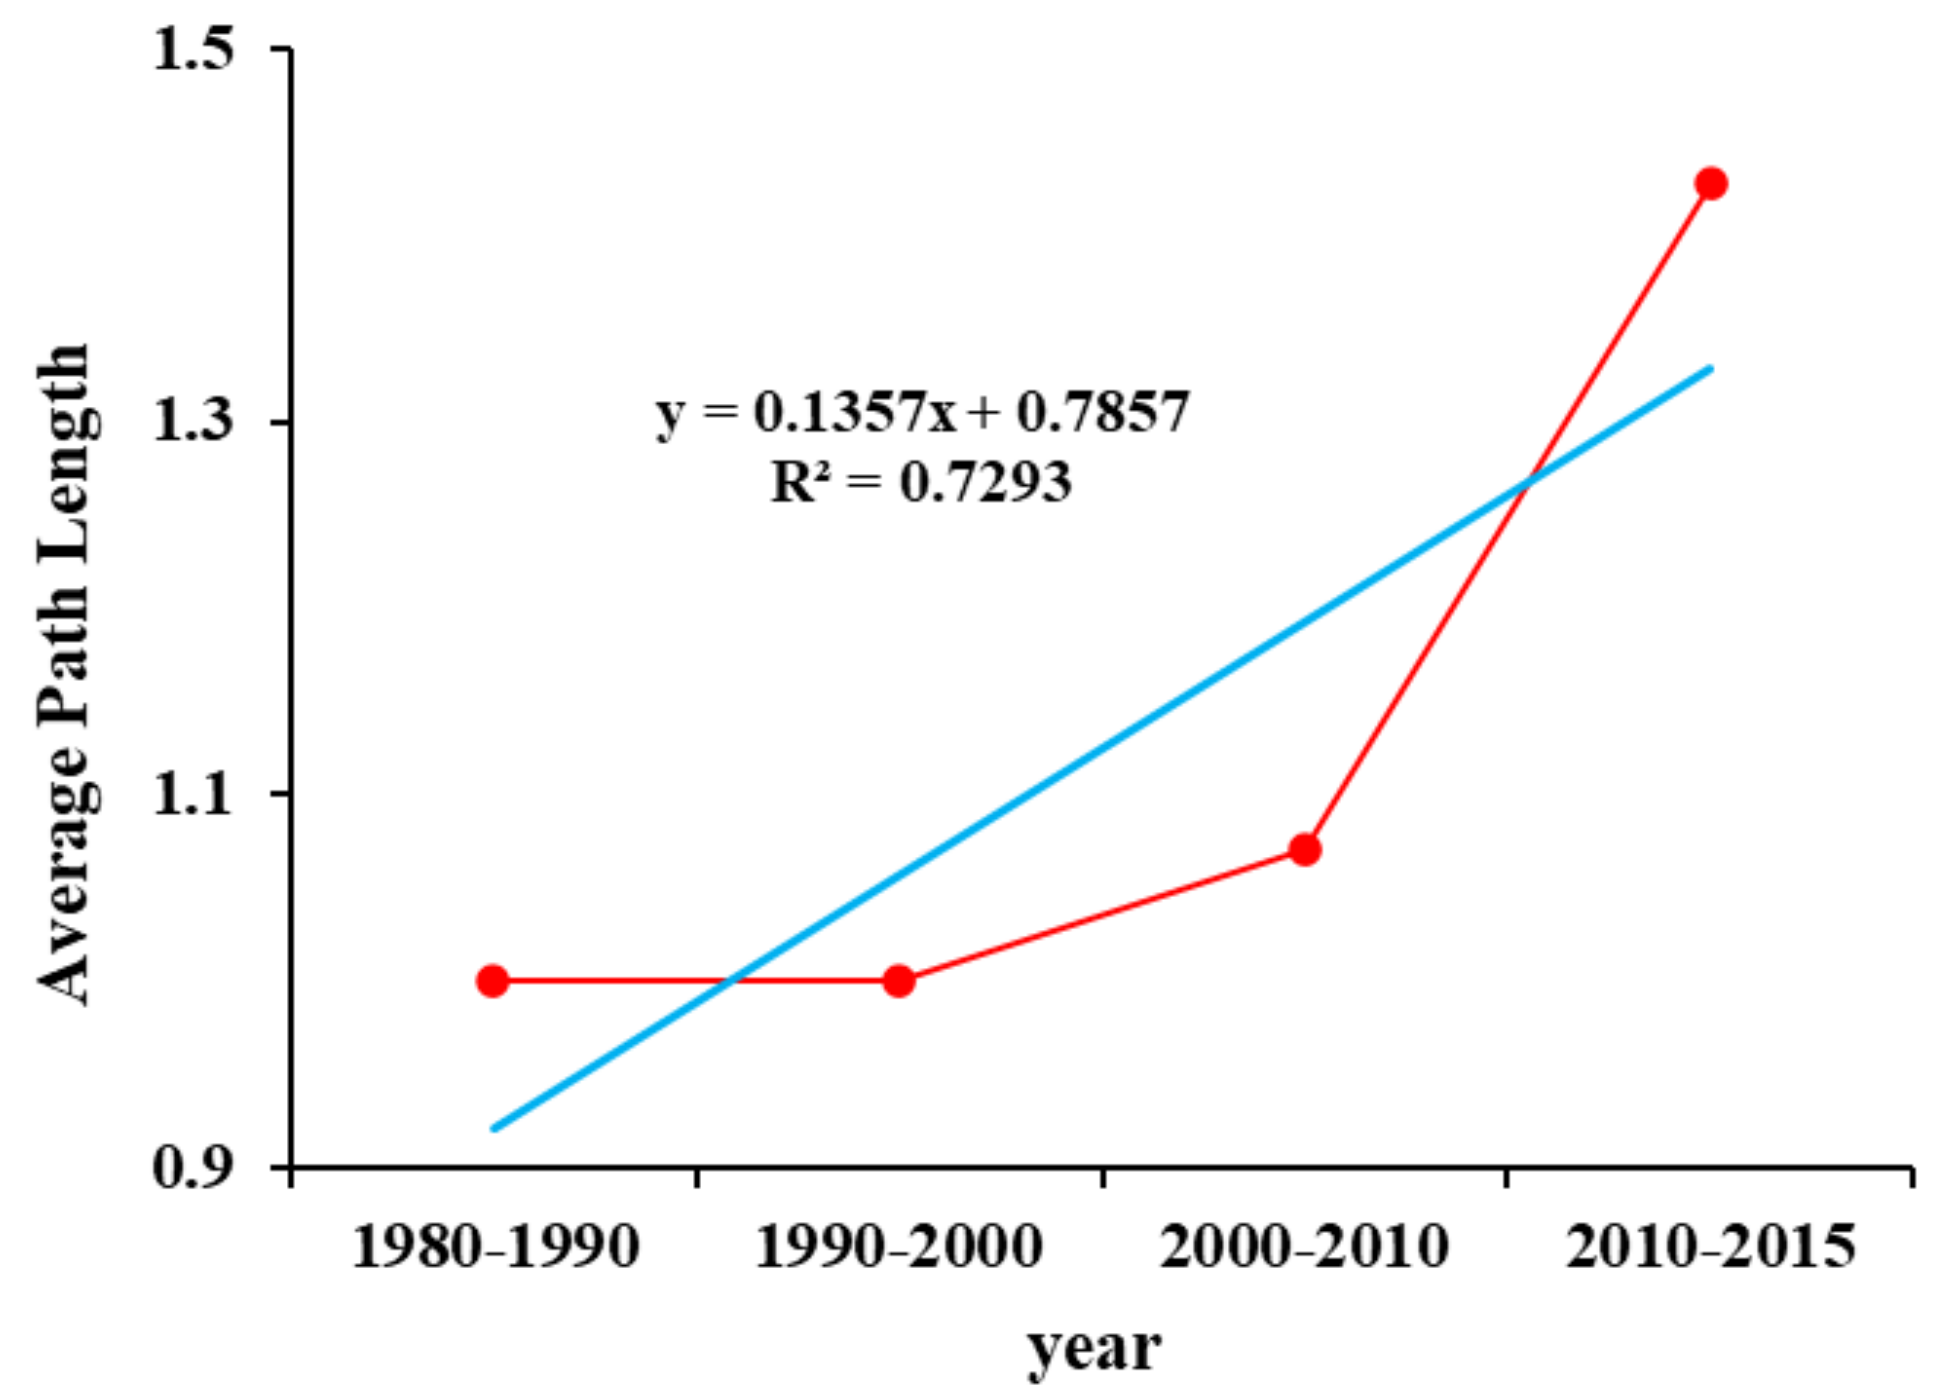
3.1.3. Analysis on the Overall Structural Characteristics of Land-Use Change Network

The Average distance of a complex network reflects the overall structural characteristics of the network. It indicates the dispersion degree of nodes in the network or the accessibility of the network and shows the overall stability of the system [37]. The smaller the value of the average path, the stronger is the connectivity of the network. In other words, any two types of land-use are easy to transfer. On the contrary, the larger the value of average path, the more difficult is the transfer between different types of land-use in the system. It indicates that the stability of the network system is higher. The average length of path of land-use transfer matrix in Xilingol League is less than 1.5, which means that the link between two random types of land-use in the complex system can be established only through one land class link.
Figure 7 shows that the Average distance of Xilingol’s land-use complex network is a steady and increasing trend. We found that the value of the average shortest path of land-use transfer matrix network between 1980–1990 and 1990–2000 is the lowest, which indicates that the stability of the land-use system in Xilingol was poor before 2000. Between 1980–1990 and 1990–2000, the high coverage grassland decreased significantly while low coverage grassland and other types of land-use increased significantly. The average shortest path value of the land-use transfer matrix network between 2000 and 2010 is the highest (average shortest path value = 1.42857). It indicates that the change in the types of land-use tends to be relatively stable in Xilingol. Generally, the average shortest path value of land-use transfer matrix network shows a steady upward trend in study areas between 1990–1995, 1995–2000, 2000–2005, 2005–2010, and 2010–2015, indicating that the land-use transfer system is developing toward a stable direction.

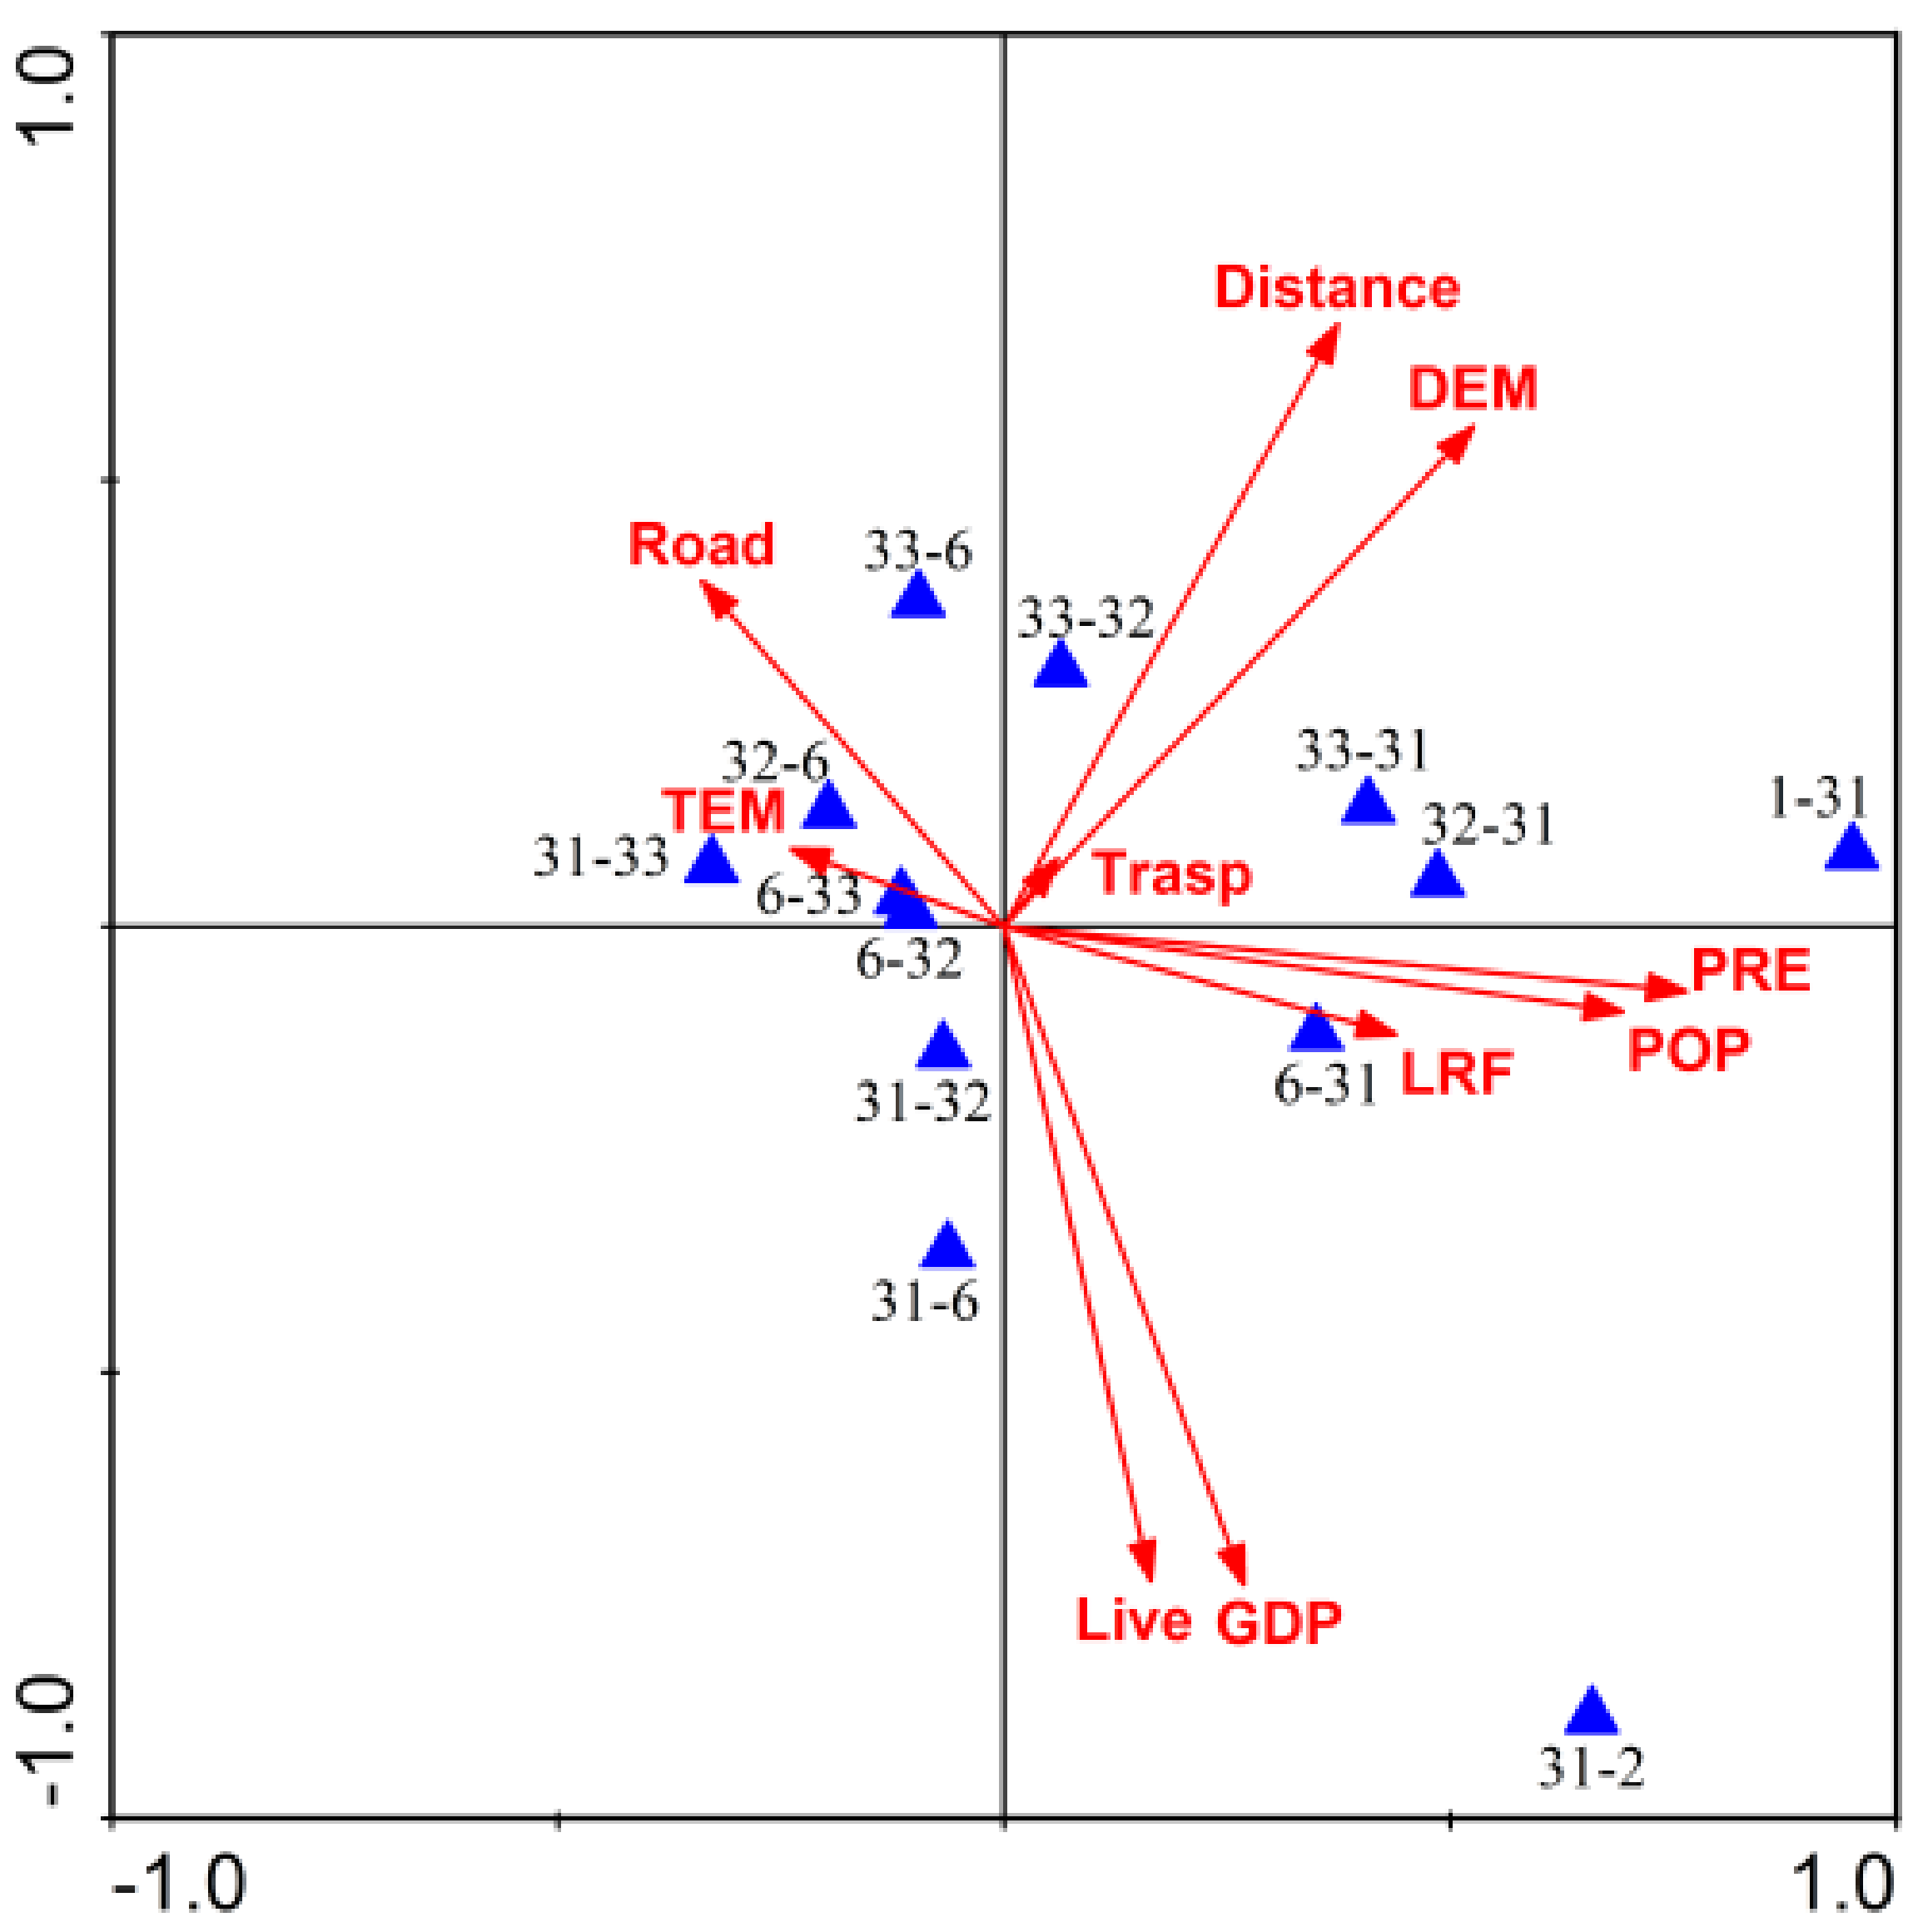
3.2. Driving Forces behind the Transformation in Types of Land-Use in Xilingol

Land resources are the link between socio-economic activities and the natural ecological environment [38]. The evolution of land is a complicated process influenced by many factors, such as natural ecological environment, social economy, and development policy. The research on driving forces is one of the core contents of land-use change dynamics. The in-depth study of the interrelation, action condition, rate, and scope of change in driving factors of land-use provides the basis for understanding changes to regional land-use law, internal mechanism, predicting future land-use change trend, and formulating sustainable countermeasures for land-use.
First, we established the land-use transfer matrix. We made overlay analysis to land-use spatial data in 1980 and 2015, obtained the areas where the types of land-use changed during the study period, and counted the changed areas. Second, we selected 446 grids (covering 88% of the study area) of 20 × 20 km as the spatial analysis samples. The eight types of the land-use grid were cultivated land, woodland, high coverage grassland, medium coverage grassland, low coverage grassland, water area, construction land, and other types as species variables. In addition, we chose several typical environmental factors, such as temperature (TEM), precipitation (PRE), population density (POP), economic development level (GDP), traffic road density (Road), distance from residential area (Distance), livestock density (Live), elevation (DEM), and transformation of aspect (Trasp). Third, we established the driving force analysis model of land-use change. Among them, the patch land-use change transfer matrix and patch driving factor matrix were obtained by data processing and sorting. Generally, social and economic data are based on administrative units, while land-use data are based on spatial geographical unit statistics, which leads to the statistical units in the study, not matching. Therefore, the population data gridding in this paper is based on the concept of multi-factor comprehensive analysis using a multiple regression model to carry out spatial interpolation while economic data is based on population and residential areas as collaborative variables using the collaborative spatial interpolation method for spatial distribution. According to Roberts and Cooper [39], the aspect angle is converted from 0~360° compass value to 0~1 value. The transformation formula is as follows:
T r a s p = 1 cos π / 180 a s p e c t 30 / 2
where Trasp means aspect index; aspect means aspect azimuth angle. According to transformation, Trasp is between 0 and 1. The higher the value, the drier and hotter is the growing environment. Here 0 indicates the north-northeast direction and 1 indicates the south-southwest direction.
Between 1980 and 2015, there were 56 types of changes in land-use in Xilingol. 98,386 km2 of area accounted for about 49% of the total area. We had to take a huge number of patches into account. In order to reduce data redundancy, we selected 13 types of land change with the proportion of change area greater than or equal to 1.312% accounting for 94.615% of the total change. Figure 8 shows the spatial distribution of the types of change in the map. We can see that the changed patches are evenly distributed in the whole area, which shows the process of change in land-use in the study area.
We used the typical land-use data change to calculate the correlation among driving factors behind changes in land-use. From the correlation coefficient diagram of driving factors, we derived that the correlation coefficients among most of the driving factors are small. This indicates that the information redundancy between the driving factors we selected is small and relatively independent, which can better represent the driving factors behind changes in land-use. In order to further understand the relationship between changes in land-use and environmental factors, we used the CCA method to analyze 446 grids and ten environmental factors in the study area. Table 5 shows that the relationship between driving factors and change in land-use was 93.8%. Among them, 78.2% of the change in land-use is explained by the first and second axis, which indicate that the first two axes of CCA could well reflect the relationship between change in land-use and driving factors in Xilingol. Among the ten driving factors, PRE had the highest correlation with the first axis, followed by POP, DEM, LRF, and Distance. Trasp was the least driving factor. GDP had the highest correlation with the second axis, followed by Live, Distance, DEM, and Road, while PRE was the least.
As shown in Figure 9, the PRE, POP, and DEM increased from left to right along the first axis of CCA, and Live and GDP decreased from bottom to top along with the second axis of CCA. The change in land-use can be divided into four groups on the first and second axis. Among them, 32–31, 33–31, 32–31 and 1–31 belong to the first group, 33–6, 32–6, 31–33, 6–33, and 6–32 the second group, 31–32 and 31–6 the third group, and 6–31 and 31–2 the fourth group, which are distributed in the first, second, third, and fourth quadrants of the sequence map. The change in land-use on the left side of the vertical axis of CCA ordination map is mainly affected by regional traffic density and annual average temperature. The 31–33, 32–6, 6–33, and 6–32 were more distributed in areas with higher traffic density and drought climate. The change in land-use types located on the right side of the vertical axis is more widely distributed in areas with relatively humid climate and less human activities, such as the conversion of high cover grassland converted to woodland. The types of change in land-use located below the horizontal axis of CCA are affected by economic development factors and livestock pressure, while the types of land-use transfer above the horizontal axis are affected by altitude and human activities. The obvious change patterns are mainly concentrated in the middle and high-altitude areas near rivers and residential areas with high traffic density and relatively large impact of human activities.

4. Discussion and Conclusions

4.1. Discussion

The transformation of types of land-use is a complex systematic project, which is the result of the comprehensive action of natural conditions, location conditions, social and economic development, population change, national or local policy control, personal quality, and other factors. How to identify and screen the driving factors behind change in land-use, and how to quantify the factors of social economy and government policies need to be solved. In recent years, many studies have paid attention to the impact of government policies, regulations, and the progress of science and technology on change in land-use. However, the problem of quantifying the driving factor has not been overcome. The Xilingol Grassland, 180 km from Beijing, is the nearest sand source area to the capital and plays an integrated ecological barrier in the Beijing-Tianjin region. In order to effectively control the windblown sand hazards and strengthen the ecological barrier function in the north, the Beijing-Tianjin sandstorm control project was launched in 2000. In addition, a series of ecological projects have been carried out, such as returning farmland to forest and grassland, ecological migration, and grazing prohibition and rotation, etc. With the implementation of the above policies and measures, the ecological environment in some areas of Xilingol has been significantly improved. Many previous studies have suggested that the ecological protection policies have worked effectively in Xilingol [40]. Since 2000, a series of ecological protection engineering policies have been implemented in the study area, such as the Beijing-Tianjin Sand Source Control Engineering Project (BTSSC), Return Grazing to Grassland Program (RGGP), and Fencing Grassland and Moving Users (FGMU). These policies have an important role in the change of land-use structure in the region. This is shown by the increase of forest land area, the decrease of unused land, the conversion of arable land and desert to grassland (Figure 3C,D), the optimization of land-use structure, and the improvement of the regional ecological environment. However, in this study, the government system, policy guidance, and other factors were less considered. In the follow-up study, the driving mechanism behind the change in land-use should pay more attention to the relevant content of land resource management decision-making.
Rapid urbanization has become an increasingly debated topic in the 21st century, as there has been an increase in the area of urban construction and industrial and mining, and the impact of human activities on change in land-use is increasingly prominent. With the rapid increase of urbanization level, the proportion of the urban and rural population in Xilingol is increasing, and by 2015, the urbanization rate of the resident population in Xilingol reached 63.87%. The growth rate of the urbanization rate between 1980 and 2015 was 1.57% (Figure 10), indicating an obvious impact of urbanization across Xilingol after 2000. According to the research results of Batunacun et al. [41], the dense grassland areas (eastern part of the study area) suffered much more from urbanization, followed by the moderately dense and sparse grassland (including the southern and western regions of the study area) (Figure 6A,B).
The Xilingol area has 144.8 billion tons of proven coal resources and 260 billion tons of predicted coal reserves, which has been identified as the key coal power base of the state. The coal resources development and utilization industry has gradually become the pillar industry of the research area, and relevant studies show that open-pit mining has become one of the main reasons for the destruction of the ecological environment [42]. Figure 11 shows the destruction of the grassland landscape caused by open-pit coal mining activities. This study analyzed the spatial and temporal characteristics of change in land-use and the driving factors from the macro-level but did not involve the research at the micro-level. However, there are a few discussions on the micro-level about the impact of the development of mineral resources and their utilization on changes in land-use. Future studies on changes in land-use should strengthen the study of these changes in land-use on the macro- and micro-scales.
The CCA method is widely used in the field of ecology. In this study, the CCA method was applied to the study of change in land-use, and the results are satisfactory. The four axes can represent 93.8% of the effective information in the canonical effect, which shows that the CCA method can well explain the relationship between change in land-use and environmental factors, and it also proves that the CCA method is one of the effective methods to study the driving mechanism behind the change in land-use.

4.2. Conclusions

Land degradation occurs in all kinds of landscapes over the world, and the drivers of land degradation vary from region to region. Identifying the land use changes and drivers is an essential prerequisite for developing and implementing appropriate area-specific policies. Xilingol is one of the three major natural grasslands of China and a typical temperate grassland of Eurasia, with a fragile ecological system and sensitive to global climate change and human activities. Moreover, land degradation has became serious in recent years. Therefore, Xilingol was selected as the study area in this paper.
The complex network method and CCA method were introduced into the study of change in land-use and opens up a new application field for complex network analysis. In this study, we used the complex network analysis method to (a) analyze the changes in the ecological environment, (b) identify the key change areas in the transfer matrix, and (c) evaluate the stability of the land-use system. In addition, we also investigated the driving factors of land use cover change based on the CCA method. Eventually, we found that the high coverage grassland had the strongest control effect on the complex network of the land-use transfer matrix in Xilingol. The number of transferred out is greater than that of transferred in of land in the natural ecosystem, while in the artificial ecosystem, the number of transfer in is always greater than that in the out directions. The result of complex network analysis showed that the average shortest path values of the four-period transfer matrix network were all less than 1.5 and exhibited a downward trend, which indicated that the overall stability of the land-use system is poor and prone to change. Furthermore, the CCA analysis demonstrated that the main driving factors behind change in land-use in Xilingol League are annual average precipitation, population, terrain undulation, economy, and distance from residential areas.
In summary, the present study introduced the complex network and canonical correspondence analysis to make up for the traditional land-use change methods and obtained several innovative viewpoints. This will provide empirical research results for the study of land-use change and its trend and offer scientific support for regional grassland ecological management.

Author Contributions

Conceptualization, J.Z. and Z.T.; methodology, Z.D. and A.R.; software, A.R. and A.H.; validation, F.Z.; writing—original draft preparation, Z.D.; writing—review and editing, J.Z.; funding acquisition, J.Z. and A.R. All authors have read and agreed to the published version of the manuscript.

Funding

This research was funded by the International (Regional) Cooperation and Exchange Programs of National Natural Science Foundation of China (41961144019), the National Natural Science Foundation of China (42001127), the Inner Mongolia Social Science Planning Project (2019NDC097), and the Research Foundation for Advanced Talents of Inner Mongolia Normal University (2018YJRC007).

Data Availability Statement

The data presented in this study are available on request from the corresponding author. The data are not publicly available due to it is the result of relevant project in remote sensing interpretation of land use, so it is not allowed to publicly unless special requirements.

Conflicts of Interest

The authors declare no conflict of interest.

References

  1. Fan, Y.; Yu, G.; He, Z. Entropies of the Chinese land use/cover change from 1990 to 2010 at a county level. Entropy 2017, 19, 51. [Google Scholar] [CrossRef]
  2. Wu, L.N.; Yang, S.T.; Liu, X.Y. Response analysis of land use change to the degree of human activities in Beiluo River basin since 1976. Acta Geogr. Sin. 2014, 69, 54–63. [Google Scholar]
  3. Liu, J.Y.; Kuang, W.H.; Zhang, Z.X.; Xu, X.L.; Qin, Y.W.; Ning, J.; Zhou, W.C.; Zhang, S.W.; Li, R.D.; Yan, C.Z.; et al. Spatiotemporal characteristics, patterns, and causes of land-use changes in China since the late 1980s. J. Geogr. Sci. 2014, 24, 195–210. [Google Scholar] [CrossRef]
  4. Liu, J.Y.; Zhang, Z.X.; Zhuang, D.F. A study on the spatial-temporal dynamic changes of land-useand driving forces analyses of China in the 1990s. Geogr. Res. 2003, 22, 1–12. [Google Scholar]
  5. Turner, B.L., II; Moss, R.H.; Skole, D.L. Relating Land Use and Global Land Cover Change: A Proposal for an IGBP-HDP Core Project; IGBP Report No. 24; HDP Report No. 5.; International Geosphere-Biosphere Programme: Stockholm, Sweden, 1993; 65p. [Google Scholar]
  6. Katarzyna, C.; Tomasz, N. Land use and land cover changes in post-socialist countries: Some observations from Hungary and Poland. Land Use Policy 2018, 78, 1–18. [Google Scholar]
  7. Li, J.J.; Luo, N.S. The double threshold effects of the urbanization on process on urban land use efficiency. Econ. Geogr. 2015, 35, 156–162. [Google Scholar]
  8. Liu, Y.Q.; Long, H.L. Land use transitions and their dynamic mechanism in the Huang-Huai-Hai Plain. Acta Geogr. Sin. 2016, 71, 666–679. [Google Scholar] [CrossRef] [Green Version]
  9. Lv, L.G.; Zhou, S.L.; Zhou, B.B.; Dai, L.; Chang, T.; Bao, G.Y.; Zhou, H.; Li, Z. Land use transformation and its eco-environmental response in process of the regional development: A case study of Jiangsu province. Sci. Geogr. Sin. 2013, 33, 1442–1449. [Google Scholar]
  10. Xu, L.H.; Wang, H.H.; Zhang, J.C.; Yue, W.Z. Spatial-temporal dynamics of land use in the hangzhou city during the recent 15 years. Econ. Geogr. 2014, 34, 135–142. [Google Scholar]
  11. Yang, J.; Xie, P.; Xi, J.C.; Ge, Q.S.; Li, X.M.; Ma, Z.D. LUCC simulation based on the cellular automata simulation: A case study of Dalian economic and technological development zone. Acta Geogr. Sin. 2015, 70, 461–475. [Google Scholar]
  12. Sun, J.; Zhang, L.H.; Peng, C.L.; Peng, Z.R.; Xu, M. CA-based urban land use prediction model: A case study on orange county, Florida, US. J. Transp. Syst. Eng. Inf. Technol. 2012, 6, 85–92. [Google Scholar] [CrossRef]
  13. Lei, S.; Quan, B.; Ou, Y.H.; Bai, Y.J.; Xie, J.N. Prediction and comparison of the land use changes in shangsha city and quanzhou city based on Markov model. Res. Soil Water Conserv. 2013, 20, 224–229. [Google Scholar]
  14. Anderson, J.C.; Hakansson, H.; Johanson, J. Dyadic business relationships within a business network context. J. Mark. 1994, 58, 1–15. [Google Scholar] [CrossRef]
  15. Guan, M.; Bo, L. Research and analysis of complex networks statistical regularity for internet. Comput. Eng. 2008, 34, 92–94. [Google Scholar]
  16. Liu, H.K.; Zhou, T. Empirical study of Chinese city airline network. Acta Phys. Sin. 2007, 56, 106–112. [Google Scholar]
  17. Xu, J.X.; Peng, H.O.; Wang, X.M.; Wang, Y.H. Epidemic spreading with time delay in complex networks. Phys. A 2006, 367, 525–530. [Google Scholar] [CrossRef] [Green Version]
  18. Hao, X.Q.; An, H.Z.; Chen, Y.R.; Gao, X.Y. Research on evolution of international iron ore trade based on complex network theory. Econ. Geogr. 2013, 33, 92–97. [Google Scholar]
  19. Han, H.R.; Yang, C.F.; Song, J.P. The Spatial-temporal characteristic of land use change in Beijing and its driving mechanism. Econ. Geogr. 2015, 35, 148–154. [Google Scholar]
  20. Qiao, W.F.; Sun, Z.H.; Shao, F.R.; Ni, T.; Feng, S.S.; Zhang, G. Analysis evolution and driving factors of land use structure in highly urbanized area: A case study of suzhou. Resour. Environ. Yangtze Basin 2012, 21, 557–564. [Google Scholar]
  21. Zhang, H.Y.; Zhao, X.Y.; Cai, Y.L.; Yin, J. The driving mechanism of human forces to the land-use change in the karst mountain area: The case study of Guizhou province. Geogr. Res. 1999, 18, 25–31. [Google Scholar]
  22. Zhou, Q.; Zhang, Z.M.; Ou, X.K.; Yang, M.Y. Multivariable analysis of socio-econ mic factors to drive the land use change in the area of manwan dam. Acta Ecol. Sin. 2010, 30, 165–173. [Google Scholar]
  23. Kong, Y.; Jiang, H.; Zhang, X.Y.; Jin, J.X.; Xiao, Z.Y.; Cheng, M.M. The comparison of ecological geographical regionalization in China based on Holdridge and CCA analysis. Acta Ecol. Sin. 2013, 3, 3825–3836. [Google Scholar] [CrossRef]
  24. Li, Q.H.; Han, B.P. Structure and dynamics of phytoplankton community based CCA analysis in a pumped storage reservoir. Acta Ecol. Sin. 2007, 27, 2355–2364. [Google Scholar]
  25. Yang, S.C.; Pang, H.C.; Wang, C.B.; Li, Y.Y.; Huo, L.; Jiang, W.L. Characterization of soil salinization based on canonical correspondence analysis method in Gansu Yellow River irrigation district of northwest China. Sci. Agric. Sin. 2014, 47, 100–110. [Google Scholar]
  26. Zhou, X.; Zuo, X.A.; Zhao, X.Y.; Wang, S.K.; Liu, C.; Zhang, J.; Lv, P.; Zhang, J.P. Comparison analyses of DCA, CCA and DCCA on relationships between plant community distribution and soil properties of Horqin Sandy Land. Chin. J. Ecol. 2015, 34, 947–954. [Google Scholar]
  27. Liu, J.Y.; Liu, M.L.; Tian, H.Q.; Zhuang, D.F.; Zhang, Z.X.; Zhang, W.; Tang, X.M.; Deng, X.Z. Spatial and temporal patterns of China’s cropland during 1990–2000: An analysis based on Landsat TM data. Remote Sens. Environ. 2005, 98, 442–456. [Google Scholar] [CrossRef]
  28. Chughtai, A.H.; Abbasi, H.; Karas, I.R. A review on change detection method and accuracy assessment for land use land cover. Remote Sens. Appl. Soc. Environ. 2021, 22, 100482. [Google Scholar] [CrossRef]
  29. Liu, T.; Chen, Z.; Chen, X.R. A brief review of complex networks and its application. Syst. Eng. 2005, 23, 1–7. [Google Scholar]
  30. John, S. Social Network Analysis; Chongqing University Press: Chongqing, China, 2007; pp. 72–73. [Google Scholar]
  31. Leng, B.R.; Yang, Y.C.; Li, Y.J.; Zhao, S.D. Spatial characteristics and complex analysis: A perspective from basic activities of urban networks in China. J. Geogr. Sci. 2011, 66, 199–211. [Google Scholar]
  32. Zhang, K.; Zhang, B.L.; Feng, C.Y.; Liang, K. A study of land use and land cover change in xiaoqing river watershed based on complex network. Bull. Soil Water Conserv. 2013, 33, 81–84. [Google Scholar]
  33. Yan, E.P.; Lin, H.; Dang, Y.F.; Xia, C.Z. The spatiotemporal changes of vegetation cover in Beijing-Tianjin sandstorm source control region during 2000–2012. Acta Ecol. Sin. 2014, 34, 5007–5020. [Google Scholar]
  34. Wu, D.; Gong, G.L.; Shao, Q.Q.; Cao, W. Ecological effects assessment of Beijing and Tianjin sandstorm source control project. J. Arid. Land Resour. Environ. 2016, 30, 117–123. [Google Scholar]
  35. Zhou, Y. Lake Changes and Their Causes Analysis on the Mongolia Plateau from 2000 to 2015. Master’s Thesis, University of Geosciences, Wuhan, China, 2018; pp. 1–74. [Google Scholar]
  36. Tao, S.L.; Fang, J.Y.; Zhao, X.; Zhao, S.Q.; Hu, H.F.; Tang, Z.Y.; Wang, Z.H.; Guo, Q.H. Rapid loss of lakes on the Mongolian Plateau. Proc. Natl. Acad. Sci. USA 2015, 112, 2281–2286. [Google Scholar] [CrossRef] [PubMed] [Green Version]
  37. Zhen, M.C.; Zhang, J.Q.; Yang, G.L. Characteristics of commercial bank branch networks based on complex networks theory: A case study on Bank of China in Beijing. Prog. Geogr. 2013, 32, 1732–1741. [Google Scholar]
  38. Liu, J.Y.; Ning, J.; Kuang, W.H.; Xu, X.L.; Zhang, S.W.; Yan, C.Z.; Li, R.D.; Wu, S.X.; Hu, Y.F.; Du, G.M.; et al. Spatiotemporal patterns and characteristics of land-use change in China during 2010–2015. J. Geogr. Sci. 2018, 73, 789–802. [Google Scholar]
  39. Roberts, D.W.; Cooper, S.V. Concepts and techniques of vegetation mapping. In Land Classifications Based on Vegetation: Applications for Resource Management; USDA, Forest Service, Intermountain Research Station: Ogden, UT, USA, 1989; pp. 90–96. [Google Scholar]
  40. Hu, Y.F.; Nacun, B. An analysis of land-use change and grassland degradation from a policy perspective in Inner Mongolia, China, 1990–2015. Sustainability 2018, 10, 4048. [Google Scholar] [CrossRef] [Green Version]
  41. Wieland, R.; Lakes, T.; Hu, Y.F.; Nendel, C. Identifying drivers of land degradation in Xilingol, China, between 1975 and 2015. Land Use Policy 2019, 83, 543–559. [Google Scholar]
  42. Ah, R.; Bi, Q.G.; Dong, Z.H. Change of grassland vegetation and driving factors based on MODIS/NDVI in Xilingol, China. Resour. Sci. 2019, 41, 1374–1386. [Google Scholar]
Figure 1. The location of the study areas—Xilingol League.
Land 11 00526 g001
Figure 2. The flow chart of data processing in this study.
Land 11 00526 g002
Figure 3. Network structure LULC transfer matrix for the study area between 1980–1990 (A), 1990–2000 (B), 2000–2010 (C), and 2010–2015 (D).
Land 11 00526 g003
Figure 4. (a) A schematic diagram complex network of land use and (b) its one sub-network.
Land 11 00526 g004
Figure 5. Changes of average out-degree, in-degree, and out-degree/in-degree between natural ecosystems and artificial ecosystems.
Land 11 00526 g005
Figure 6. Changes in the area of individual categories(A), and network structure LULC transfer matrix for the study area between 2010–2015 (B).
Land 11 00526 g006
Figure 7. Changes of the average shortest path of transfer matrix networks in study areas for 1990–1995, 1995–2000, 2000–2005, 2005–2010, and 2010–2015.
Land 11 00526 g007
Figure 8. Spatial pattern of each type of change in land-use between 1980 and 2015.
Land 11 00526 g008
Note: DWQ, Dong Ujimqin Banner; XWQ, Xi Ujimqin Banner; XLHT, Xilinhot; ABQ, Abag Banner; SNTZQ, Sonid Left Banner; SNTYQ, Sonid Right Banner; ELHT, Erlianhot; XHQ, Xianghuang Banner; ZXBQ, Zhengxiangbai Banner; ZLQ, Zhenglan Banner; DLX, Duolun County; TPSQ, Taibus Banner.
Figure 9. CCA biplot of land-use change types and environmental factors.
Land 11 00526 g009
Note: The land-use code in the figure is shown in Section 2.2.1 data sources; Road: Traffic road density; TEM: temperature; Live: livestock density; GDP: Economic development level; POP: Population density; PRE: Precipitation; Trasp: Transformation of aspect; DEM: Distance: Distance from the residential area.
Figure 10. Change in the urbanization rate of Xilingol from 1980 to 2015.
Land 11 00526 g010
Figure 11. Image showing the main open-pit coal mining in Xilingol.
Land 11 00526 g011
Table 1. Satellite data for this study.
TimeSensorsResolution
(m)
Number of ImagesSatelliteAccuracy (%)Sources
1980MSS8040Landsat389.356https://glovis.usgs.gov/app (accessed on 24 December 2021)
1990TM3035Landsat587.946
2000TM3035Landsat587.609
2010ETM+3035Landsat785.998
2015OLI3035Landsat886.515
Table 2. LULC classification system.
TypeCodeDescriptionsImage Features
Cropland1The land used for planting crops, including cultivated land, new development, reclamation, and leisure (including wheel-rest and rotation); the cultivation of crops (including vegetables), and the land of scattered fruit trees, mulberry trees; the reclaimed land and sea paint cultivated for more than three years. Land 11 00526 i001
Forest land2Land where trees are grown, including arbor, shrub, bamboo, and for forestry use. Land 11 00526 i002
High coverage
grassland
31Refers to >50% coverage of natural grasslands, improved grasslands, and mowed grasslands. This type of grassland generally has better water conditions, and the grass is densely grown. Land 11 00526 i003
Medium coverage grassland32Natural grasslands and improved grasslands with a coverage of 20–50%. Such grasslands generally lack water and are sparsely covered. Land 11 00526 i004
Low coverage
grassland
33The natural grassland with a coverage of 5–20%. This type of grassland lacks water, the grass is sparse, and the conditions for animal husbandry are poor. Land 11 00526 i005
Water area4Natural land waters and land for water conservancy facilities. Land 11 00526 i006
Construction land5Urban and rural residential areas and other land for industrial, mining, transportation, etc. Land 11 00526 i007
Unused land6Land that is not put into practical use or that is difficult to use, including sandy land, salina, and bare rock. Land 11 00526 i008
Table 3. Degree distribution of nodes in transfer matrix networks in different periods.
Land Use TypesNatural EnvironmentHumanistic Environment
High Coverage GrasslandMedium Coverage GrasslandLow Coverage GrasslandUnused LandForest LandWaterMean ValueConstruction LandCroplandMean Value
1980–1990O-D18.462 11.811 6.764 6.283 0.389 0.345 7.342 0.106 0.977 0.542
I-D9.267 21.590 9.894 2.751 0.828 0.282 7.435 0.116 0.407 0.262
Ratio1.992 0.547 0.684 2.284 0.470 1.223 1.200 0.914 2.401 1.657
1990–2000O-D20.911 24.141 14.243 5.539 0.854 0.554 11.040 0.195 1.085 0.640
I-D13.431 24.443 17.073 7.364 0.987 0.877 10.696 0.316 3.032 1.674
Ratio1.557 0.988 0.834 0.752 0.865 0.632 0.938 0.617 0.358 0.487
2000–2010O-D15.739 26.640 18.048 8.954 0.369 1.910 11.943 0.011 1.898 0.955
I-D19.343 29.255 17.990 5.627 0.432 0.200 12.141 0.340 0.383 0.362
Ratio0.814 0.911 1.003 1.591 0.854 9.550 2.454 0.032 4.956 2.494
2010–2015O-D10.888 14.765 12.375 25.345 0.974 1.170 10.920 0.026 0.328 0.177
I-D9.483 8.116 4.124 18.343 0.000 16.762 9.471 8.808 0.236 4.522
Ratio1.148 1.819 3.001 1.382 -0.070 1.484 0.003 1.390 0.696
Note: O-D: Out-degree; I-D: In-degree; Ratio: Percentage value of Out-degree and In-degree.
Table 4. Betweenness of nodes in transfer matrix networks between 1980–2015.
1980–1990 1990–2000 2000–2010 2010–2015
Medium coverage grassland7.0242.8572.18316.071
Construction land0.0000.0000.00012.698
High coverage grassland7.0242.8572.18310.516
Water0.0000.4760.0003.175
Low coverage grassland3.4520.4762.1832.183
Unused land1.0710.0000.3970.595
Cropland2.8572.8570.3970.000
Forest land0.0000.0002.1830.000
Table 5. Correlation coefficients between environmental factors and CCA ordination axes and summary.
Axis 1Axis 2Axis 3Axis 4
Distance0.37370.67370.36110.0035
Road−0.33840.3855−0.1267−0.11
Trasp0.05970.07480.08380.1862
Live0.1637−0.7327−0.1685−0.4004
GDP0.2684−0.73750.109−0.1784
POP0.6927−0.0963−0.0062−0.139
DEM0.52570.5594−0.25880.3629
LRF0.4382−0.12070.05850.2835
PRE0.7637−0.07240.2122−0.3389
TEM−0.23870.0860.13750.4083
Summary of CCA ranking
Eigenvalues 0.220.0830.0410.019
Cumulative percentage variance of species–environment (%)56.978.288.993.8
Species–environment correlations0.7890.5630.4710.338
Test of significance of all canonical axes0.387
Publisher’s Note: MDPI stays neutral with regard to jurisdictional claims in published maps and institutional affiliations.

