
Interconnections between Coastal Sediments, Hydrodynamics, and Ecosystem Profiles on the Mexican Caribbean Coast

 ,
,  and
and 
Abstract
:1. Introduction
2. Materials and Methods
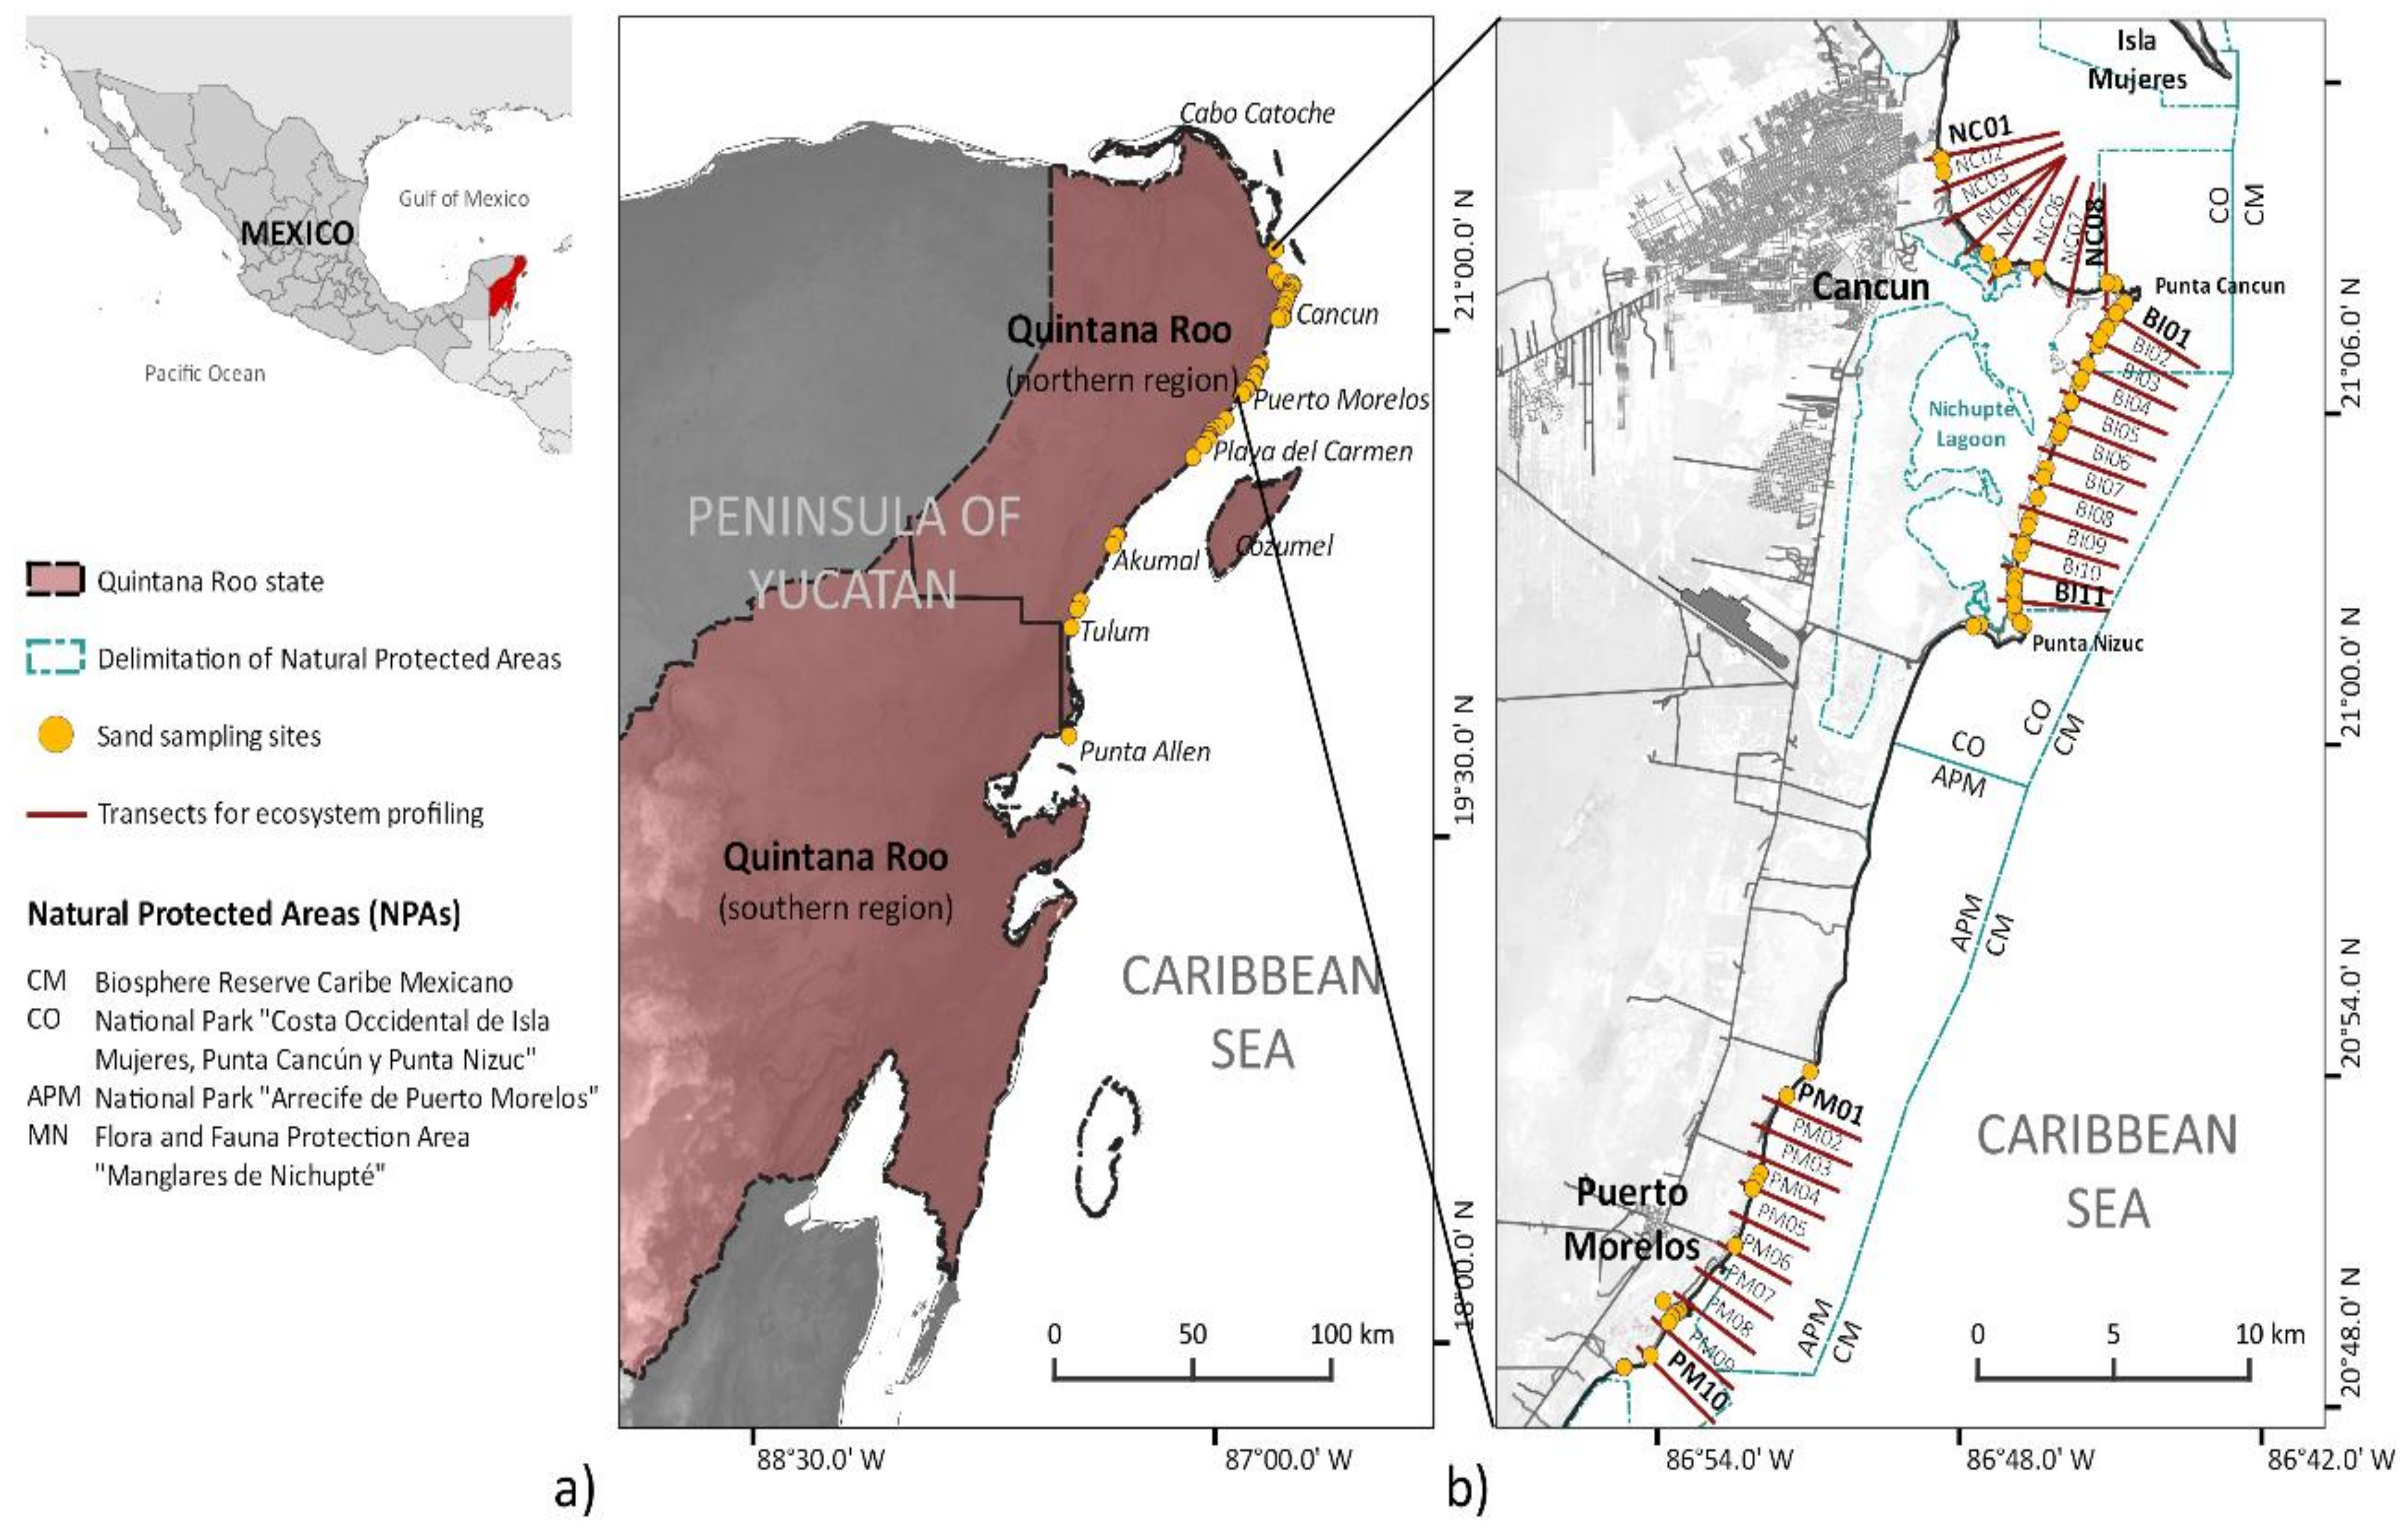
2.1. Study Area
2.2. Sampling Techniques, Numerical Modelling and Data Analysis
2.2.1. Regional Analysis
2.2.2. Local-Scale Analysis
3. Results
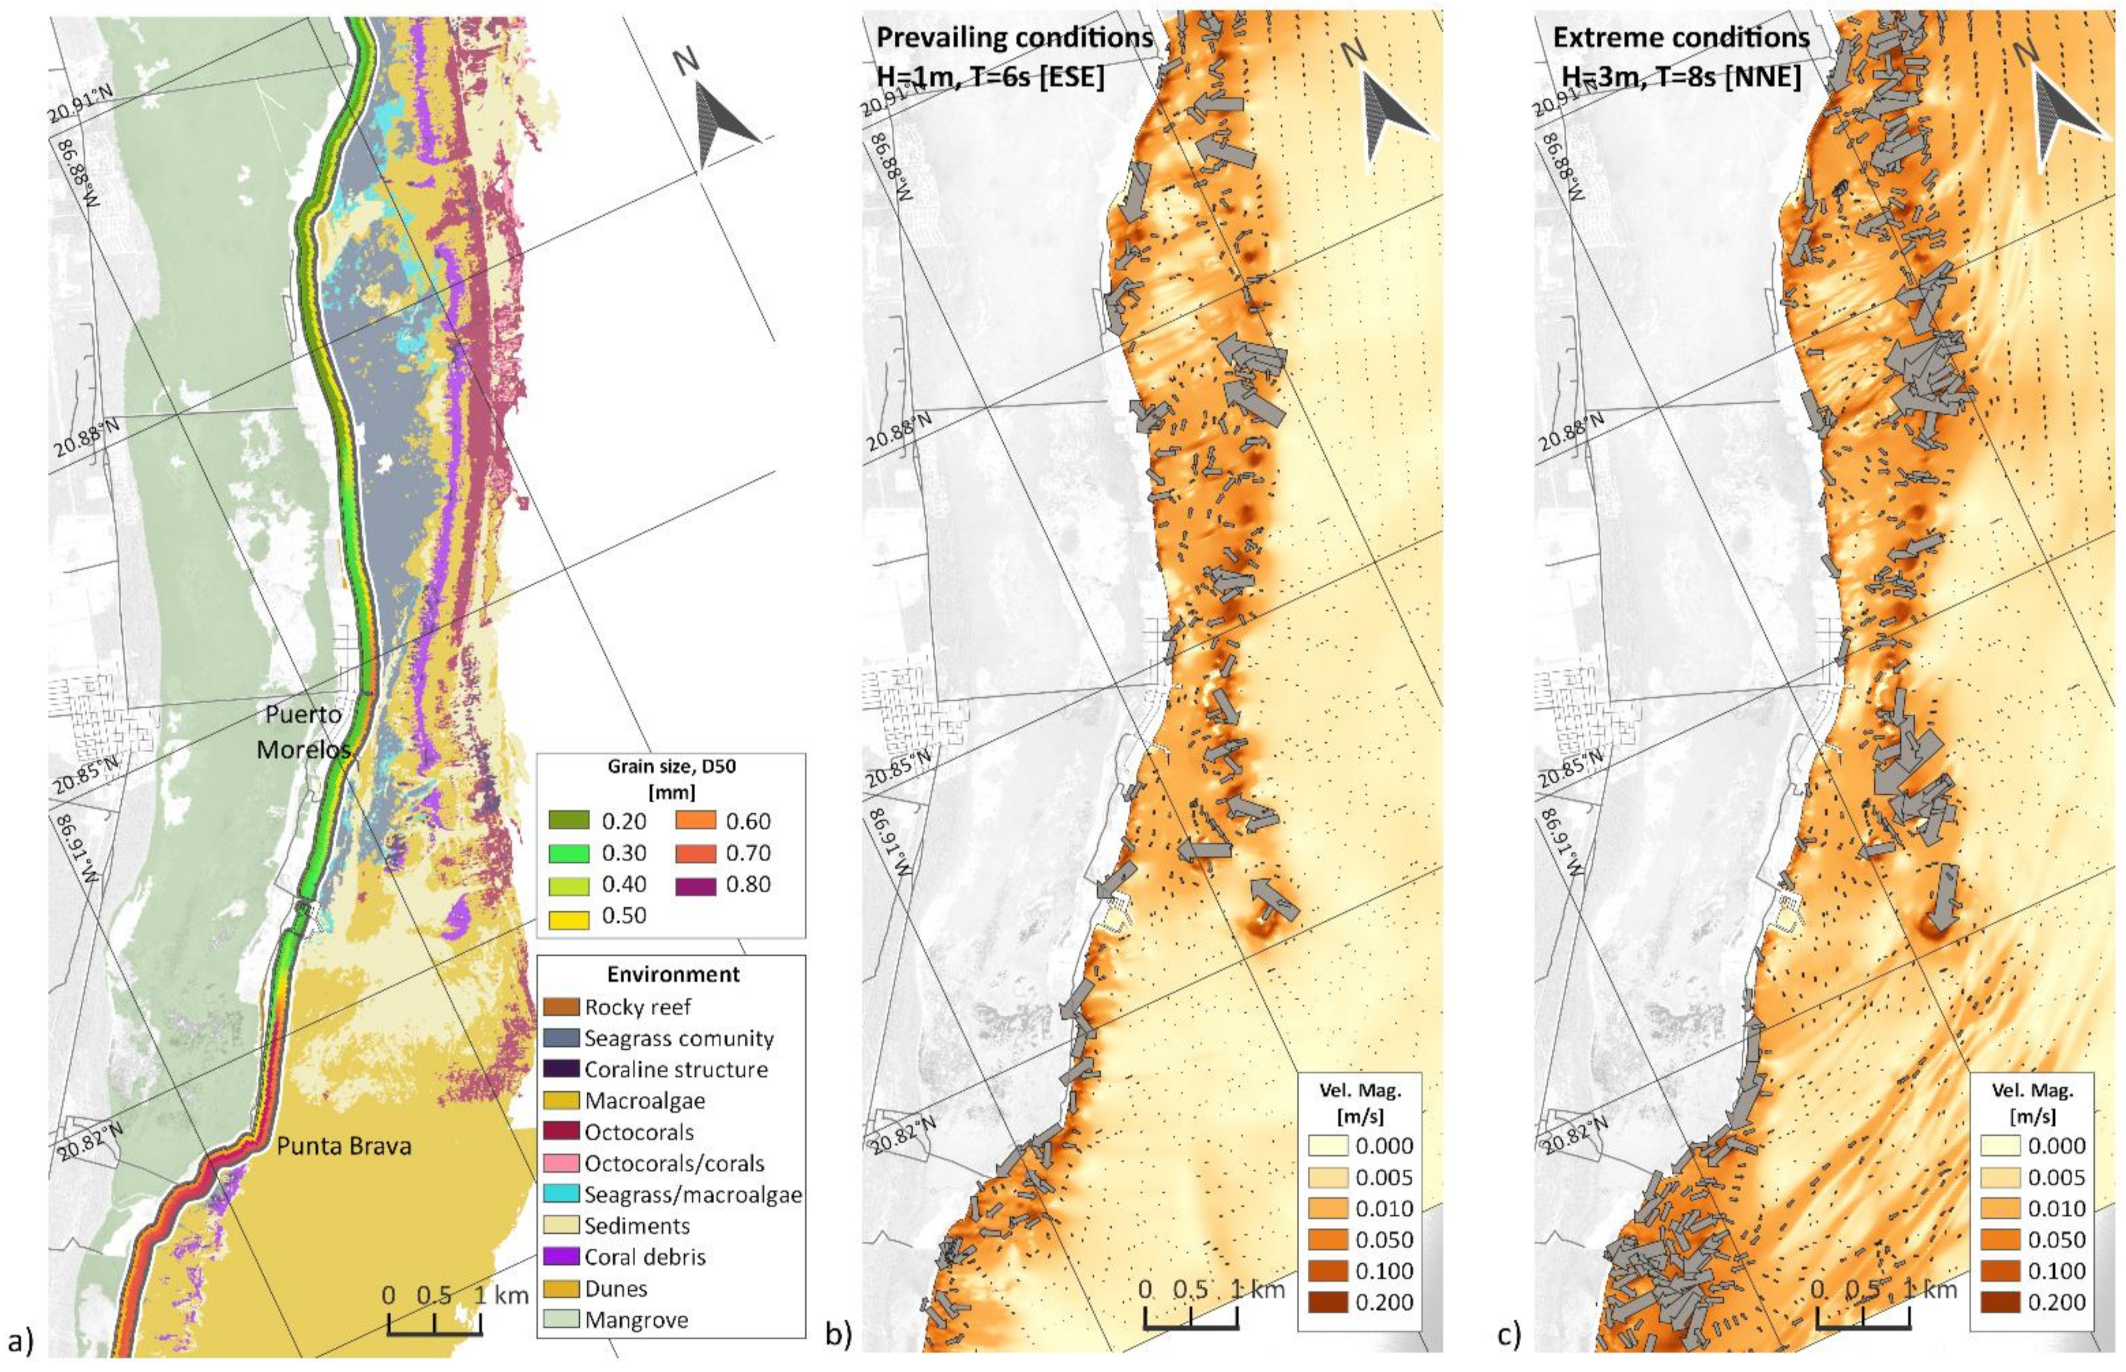
3.1. Sediments, Wave Climate, and Coastal Environment
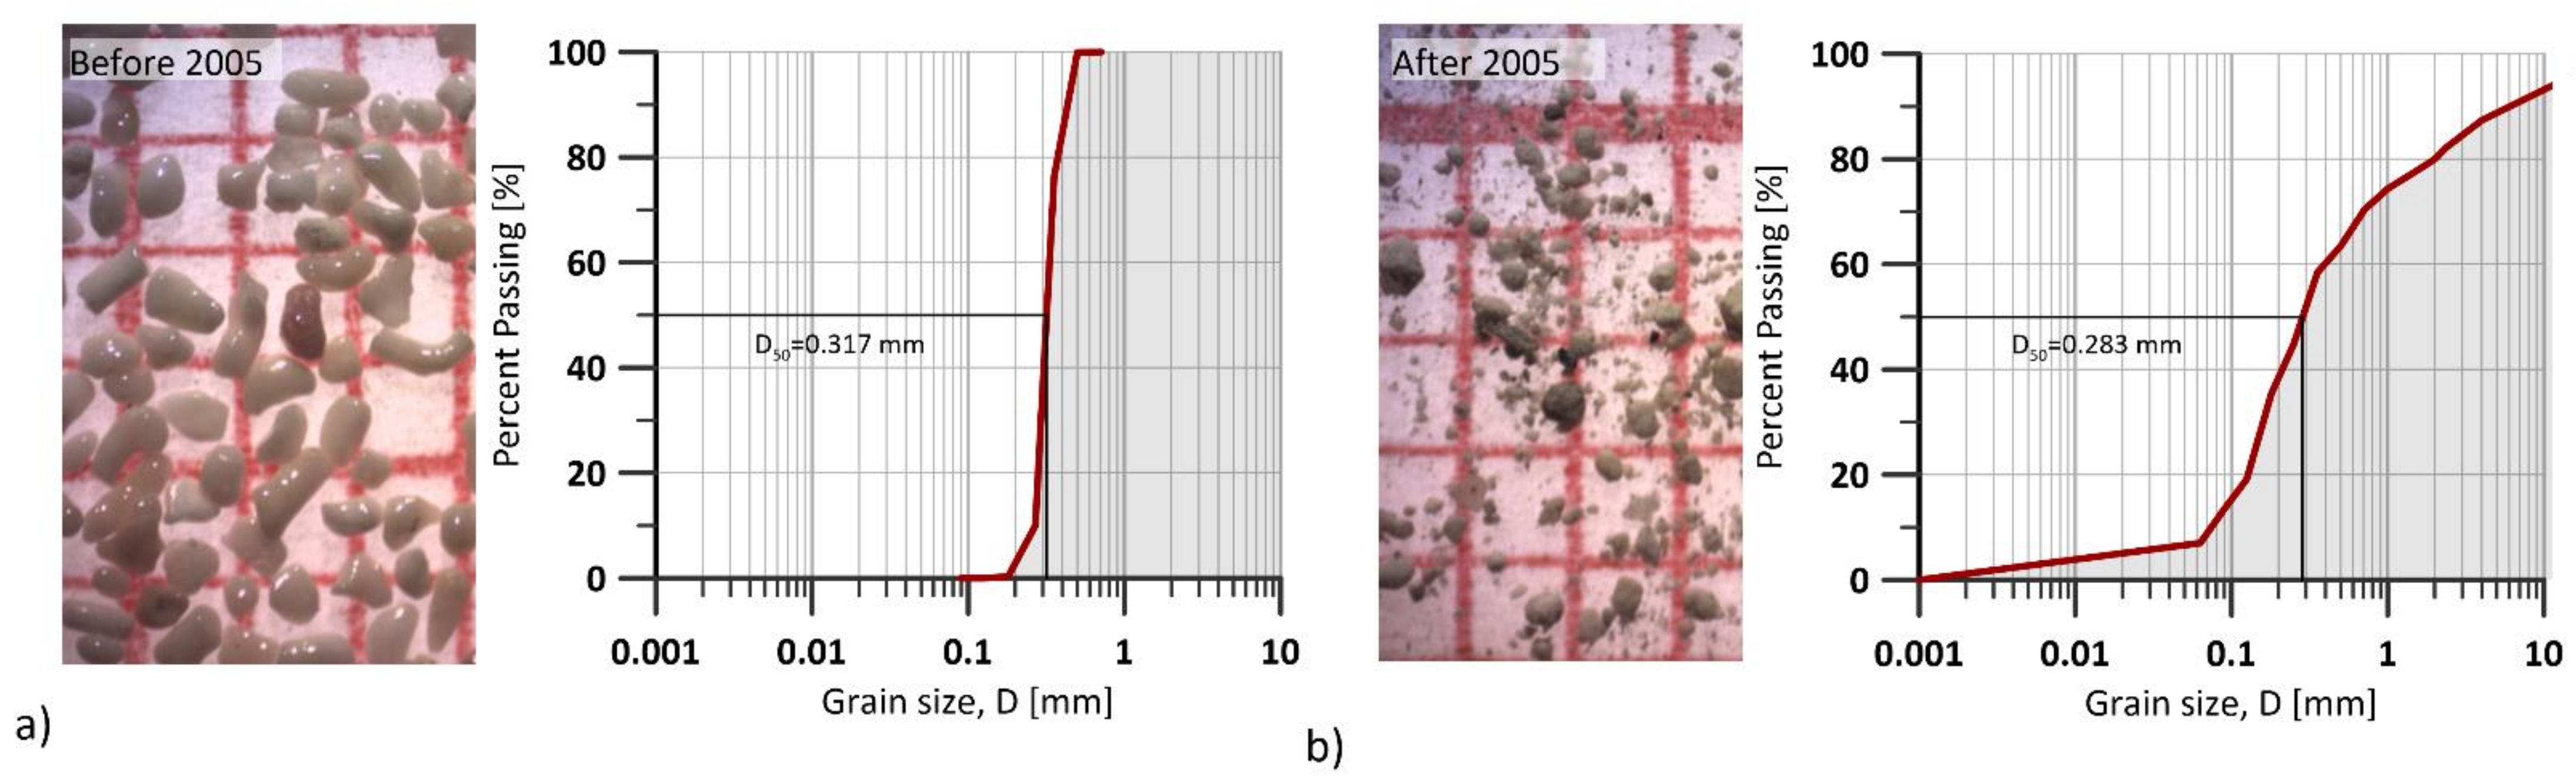
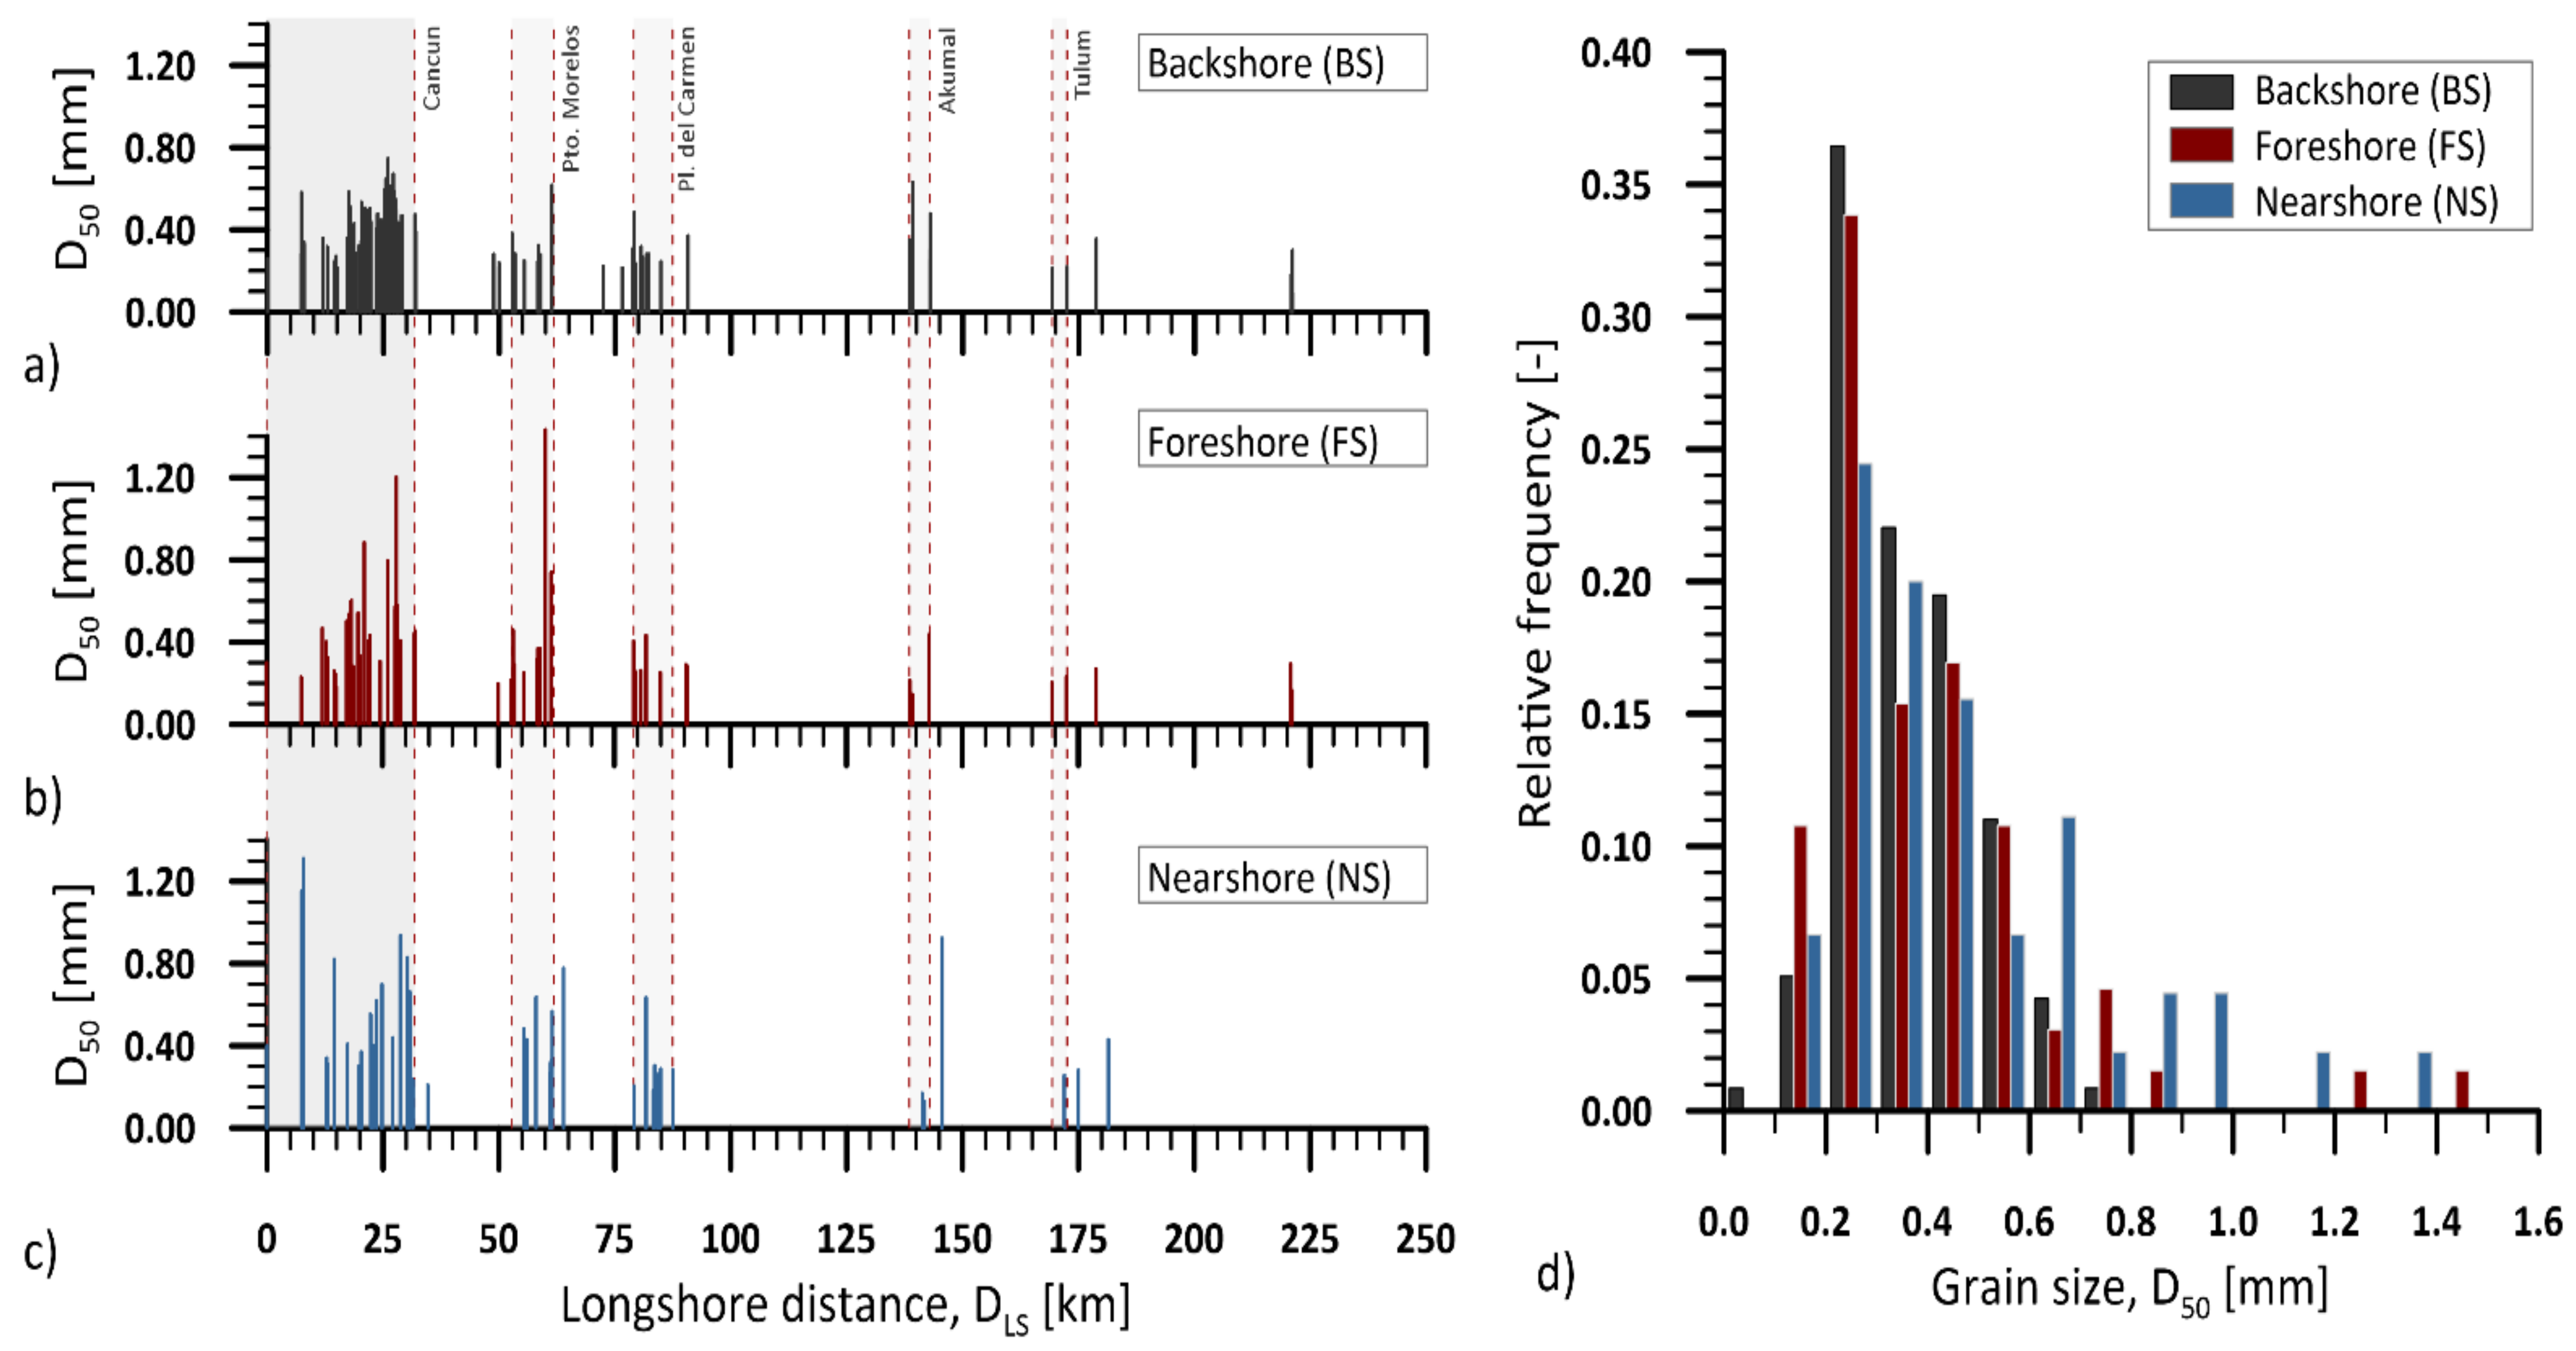
3.1.1. Sediment Characterisation
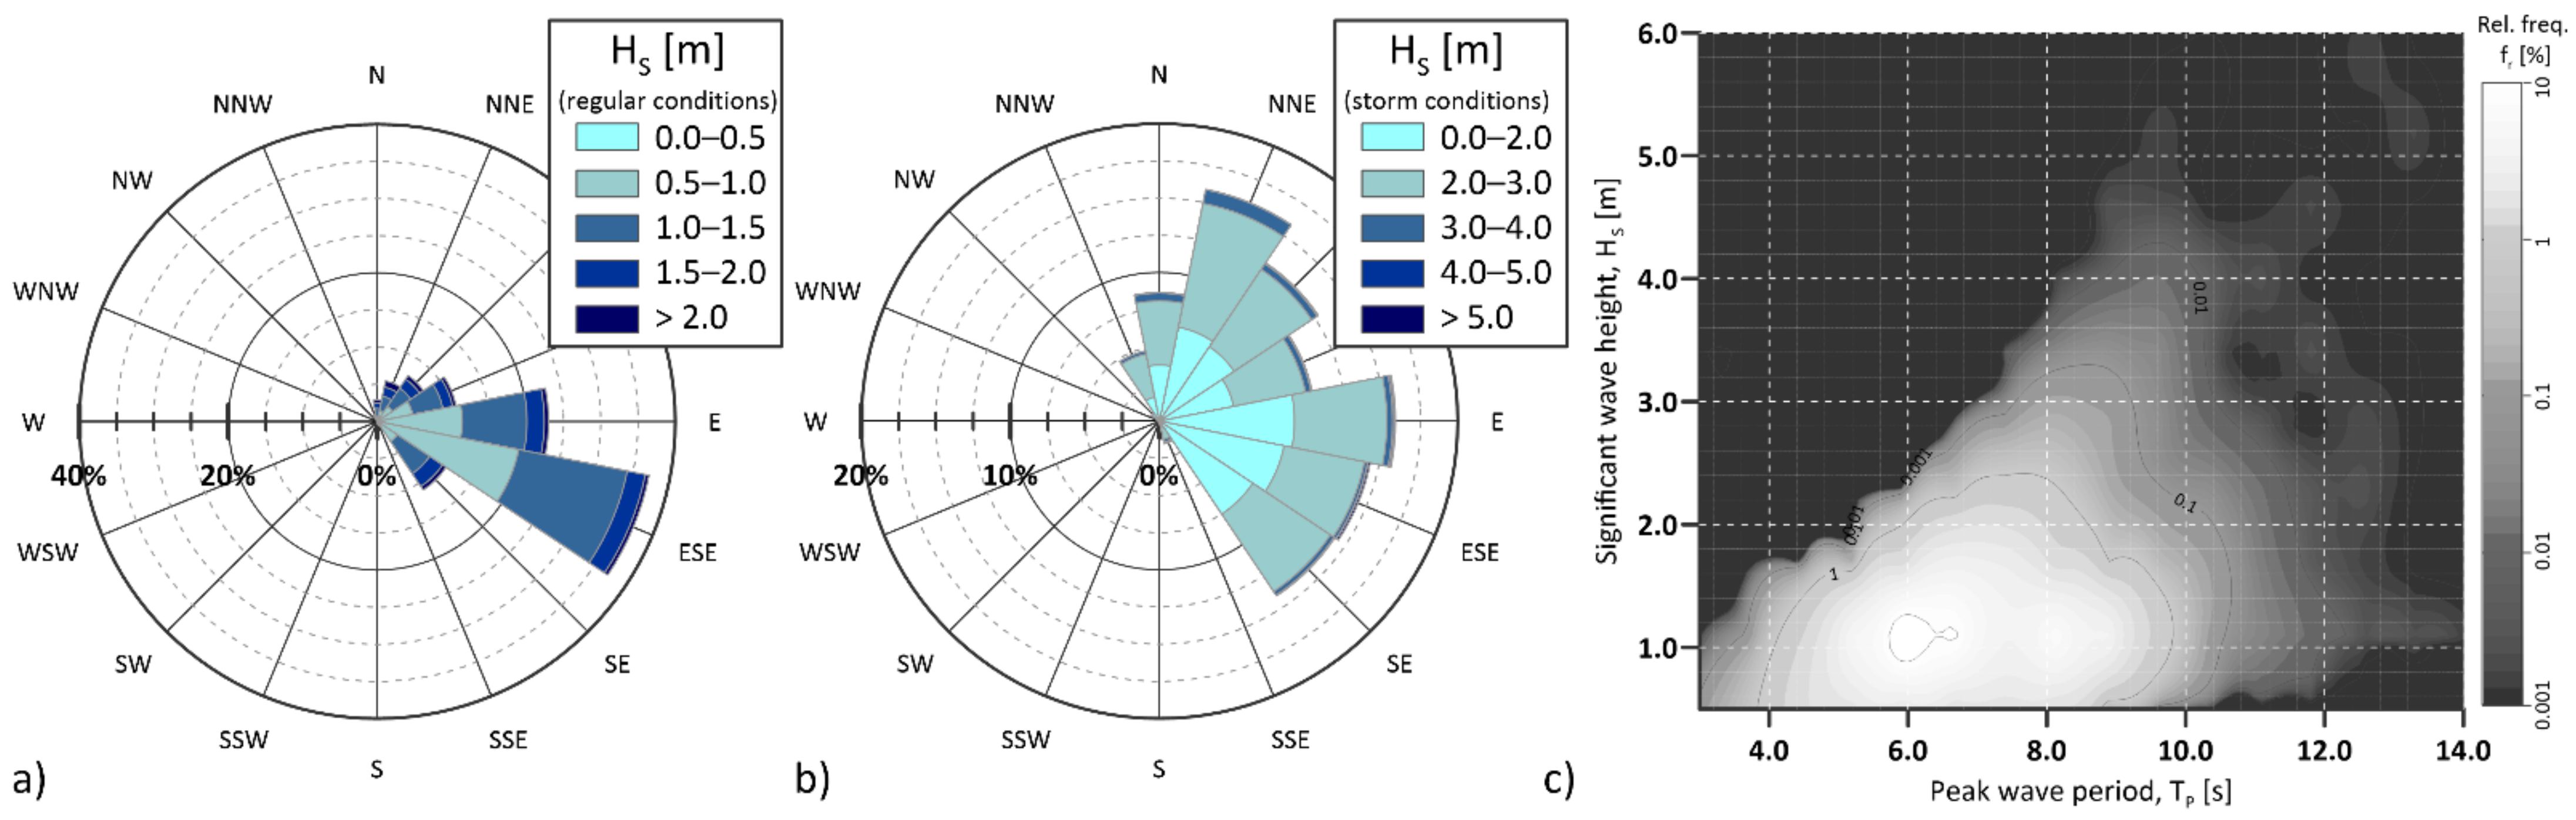
3.1.2. Wave Climate Conditions
3.1.3. Land Use
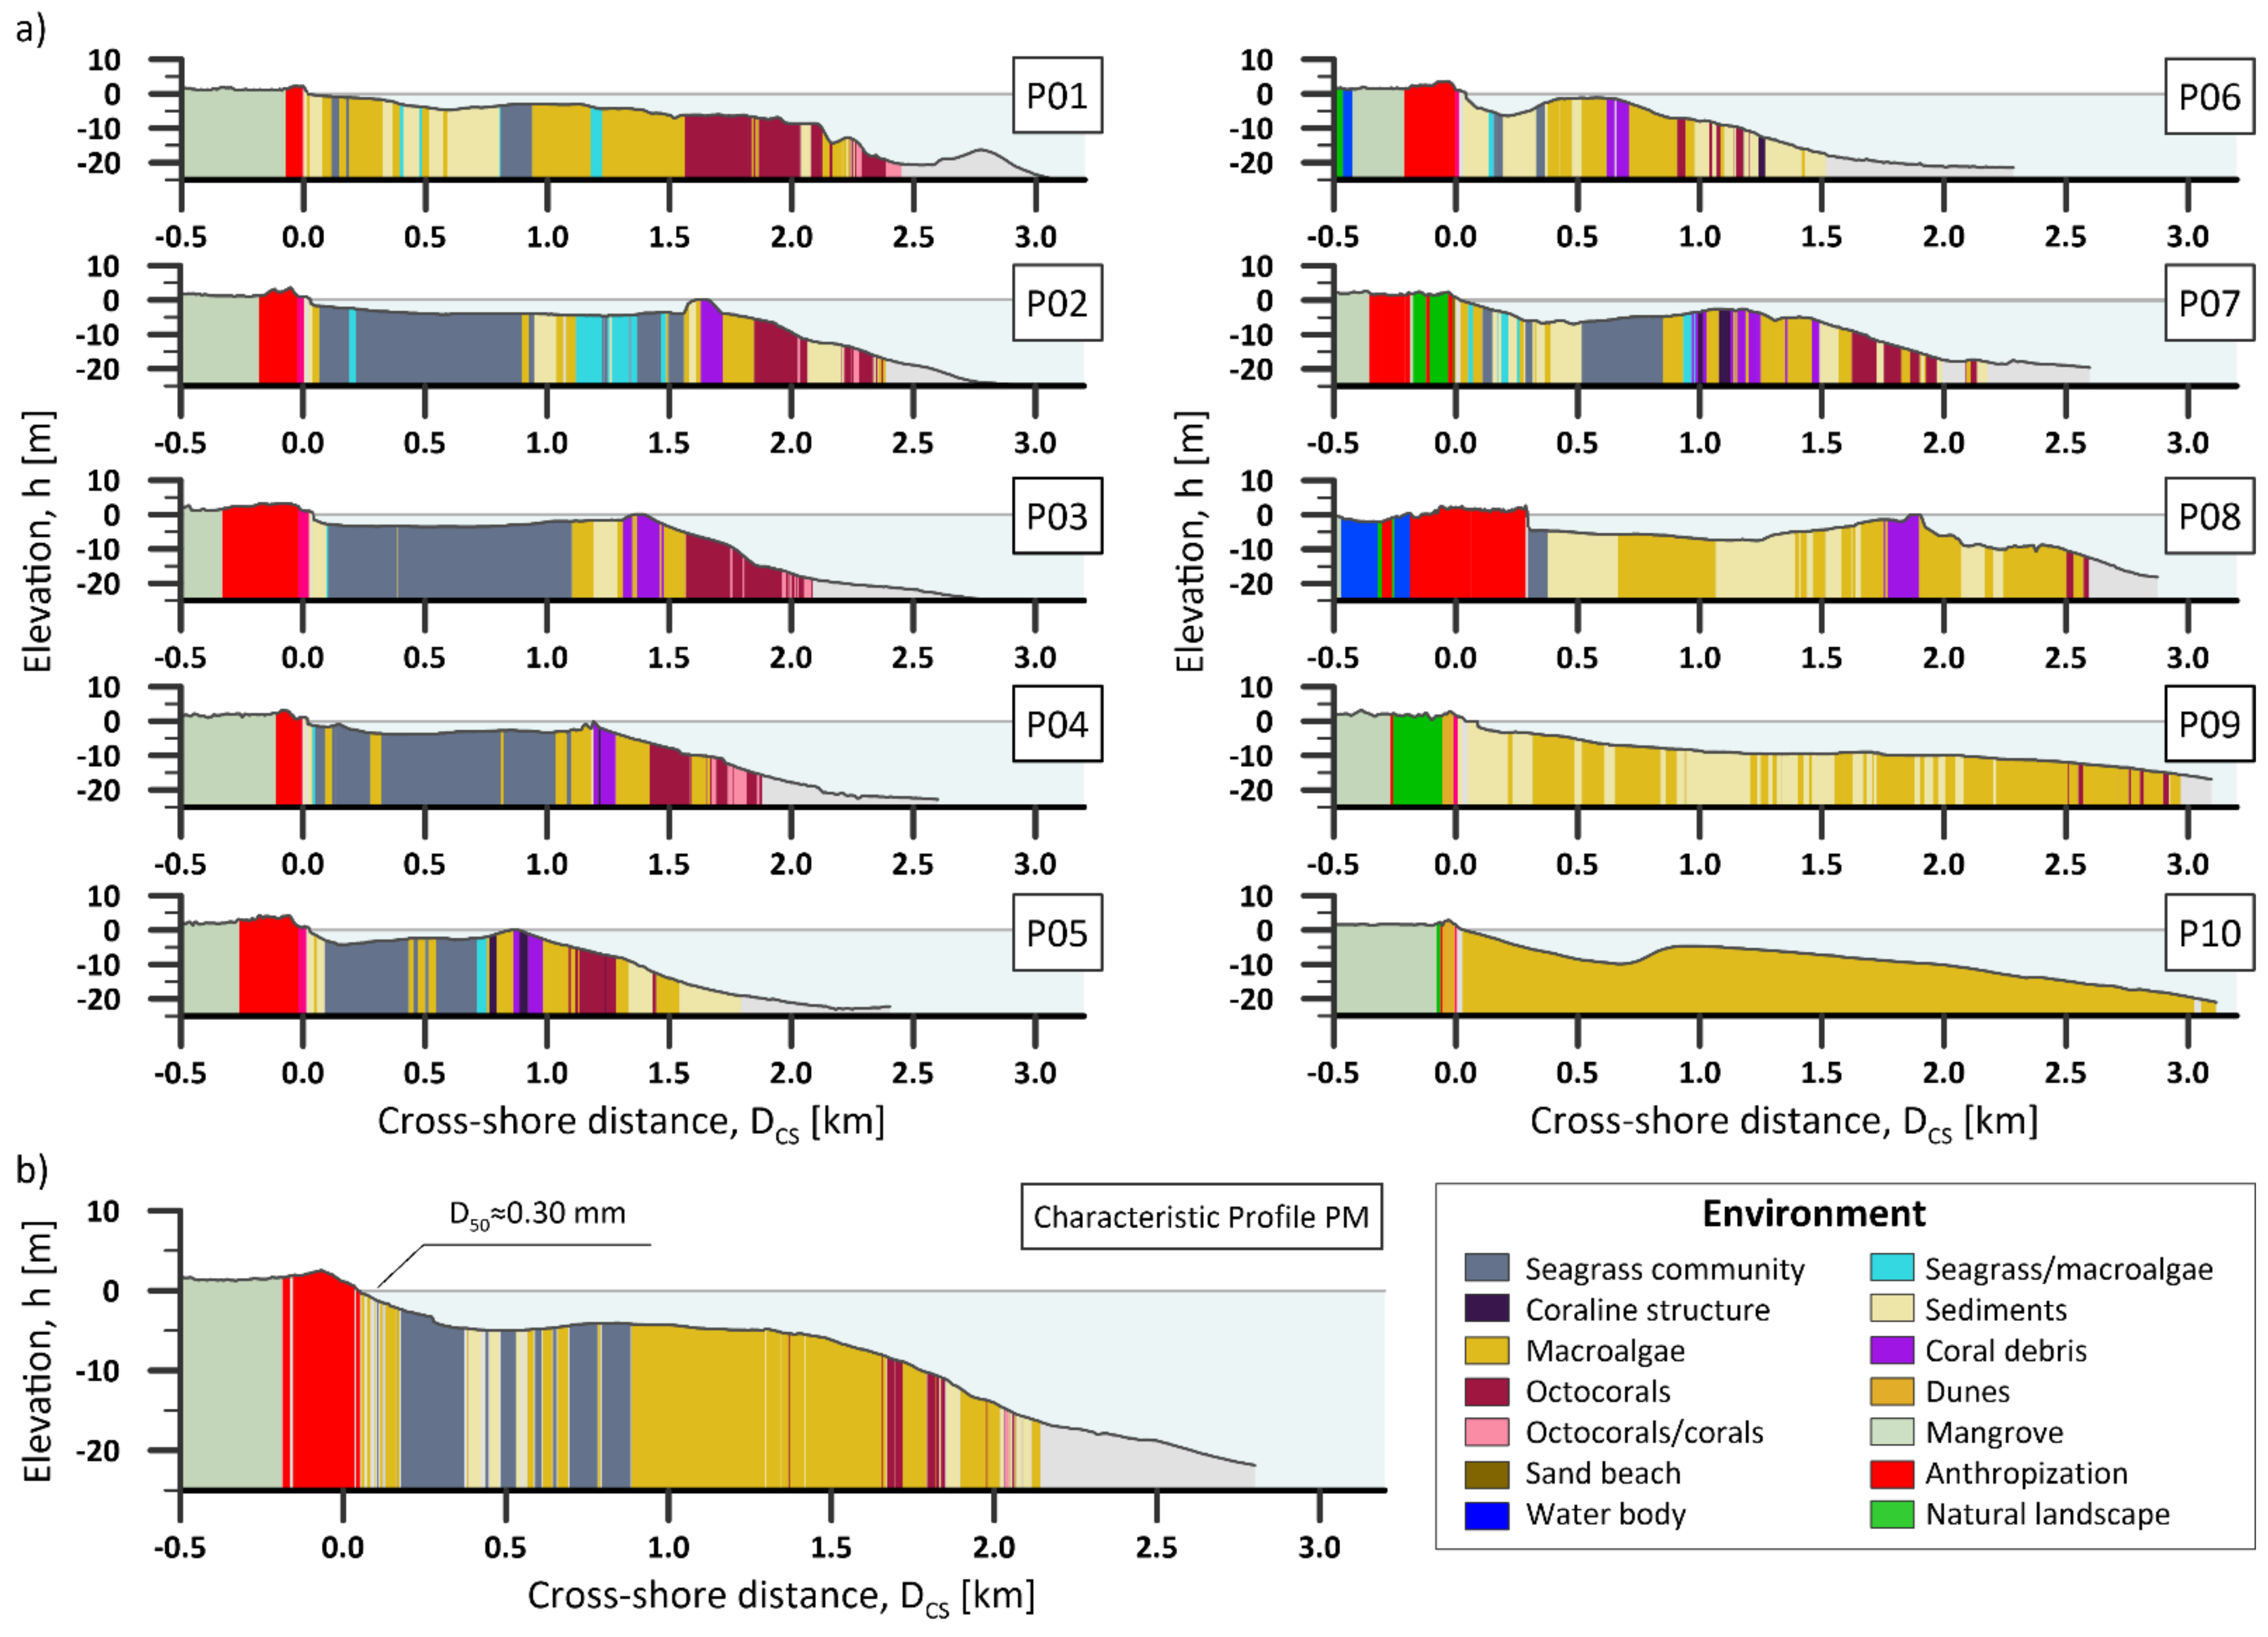
3.2. Case Studies
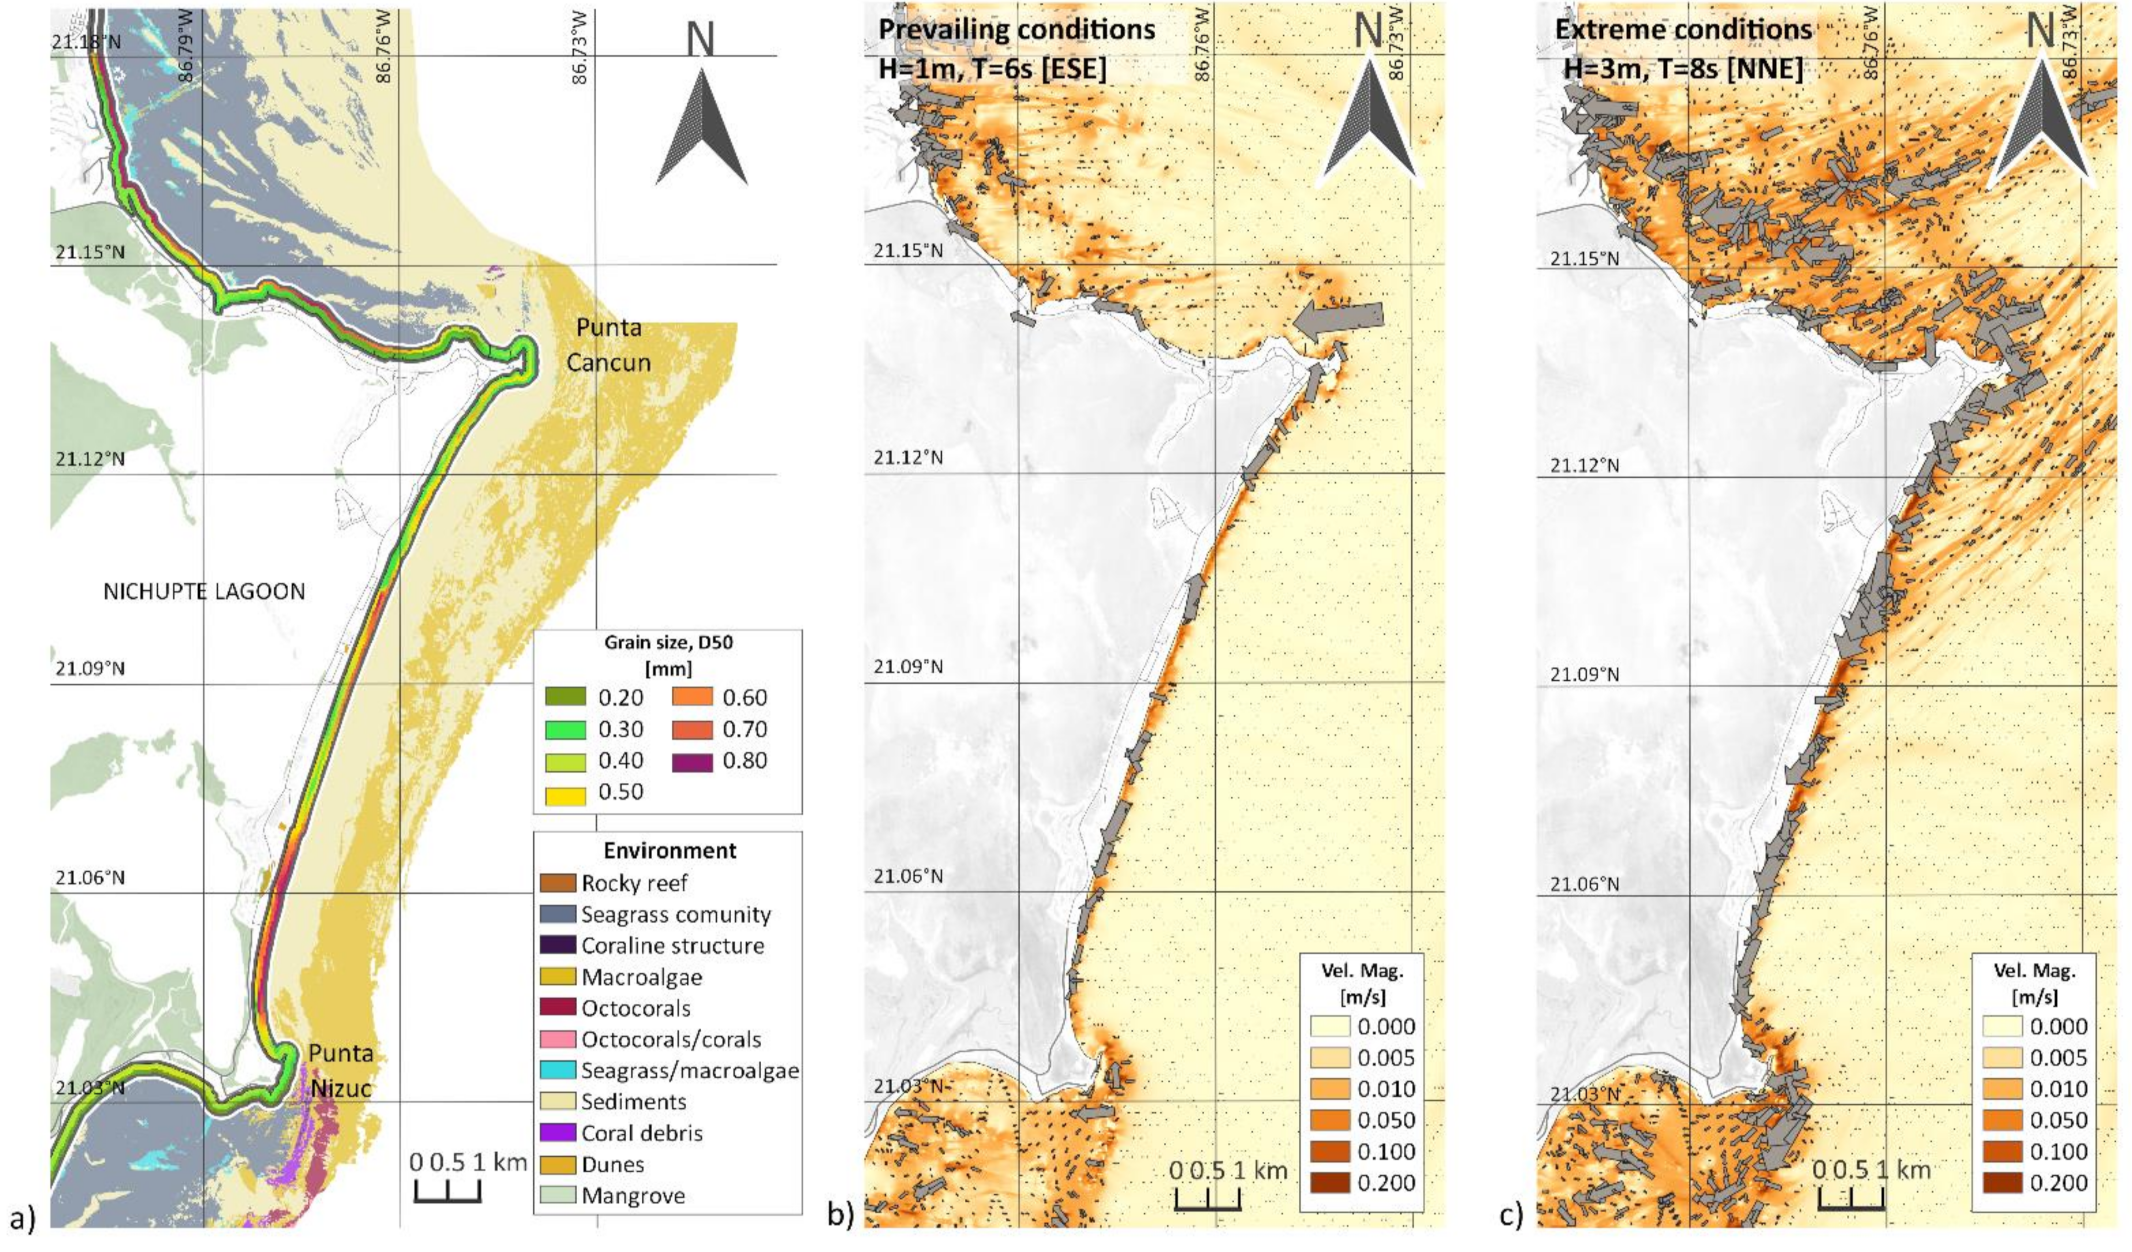
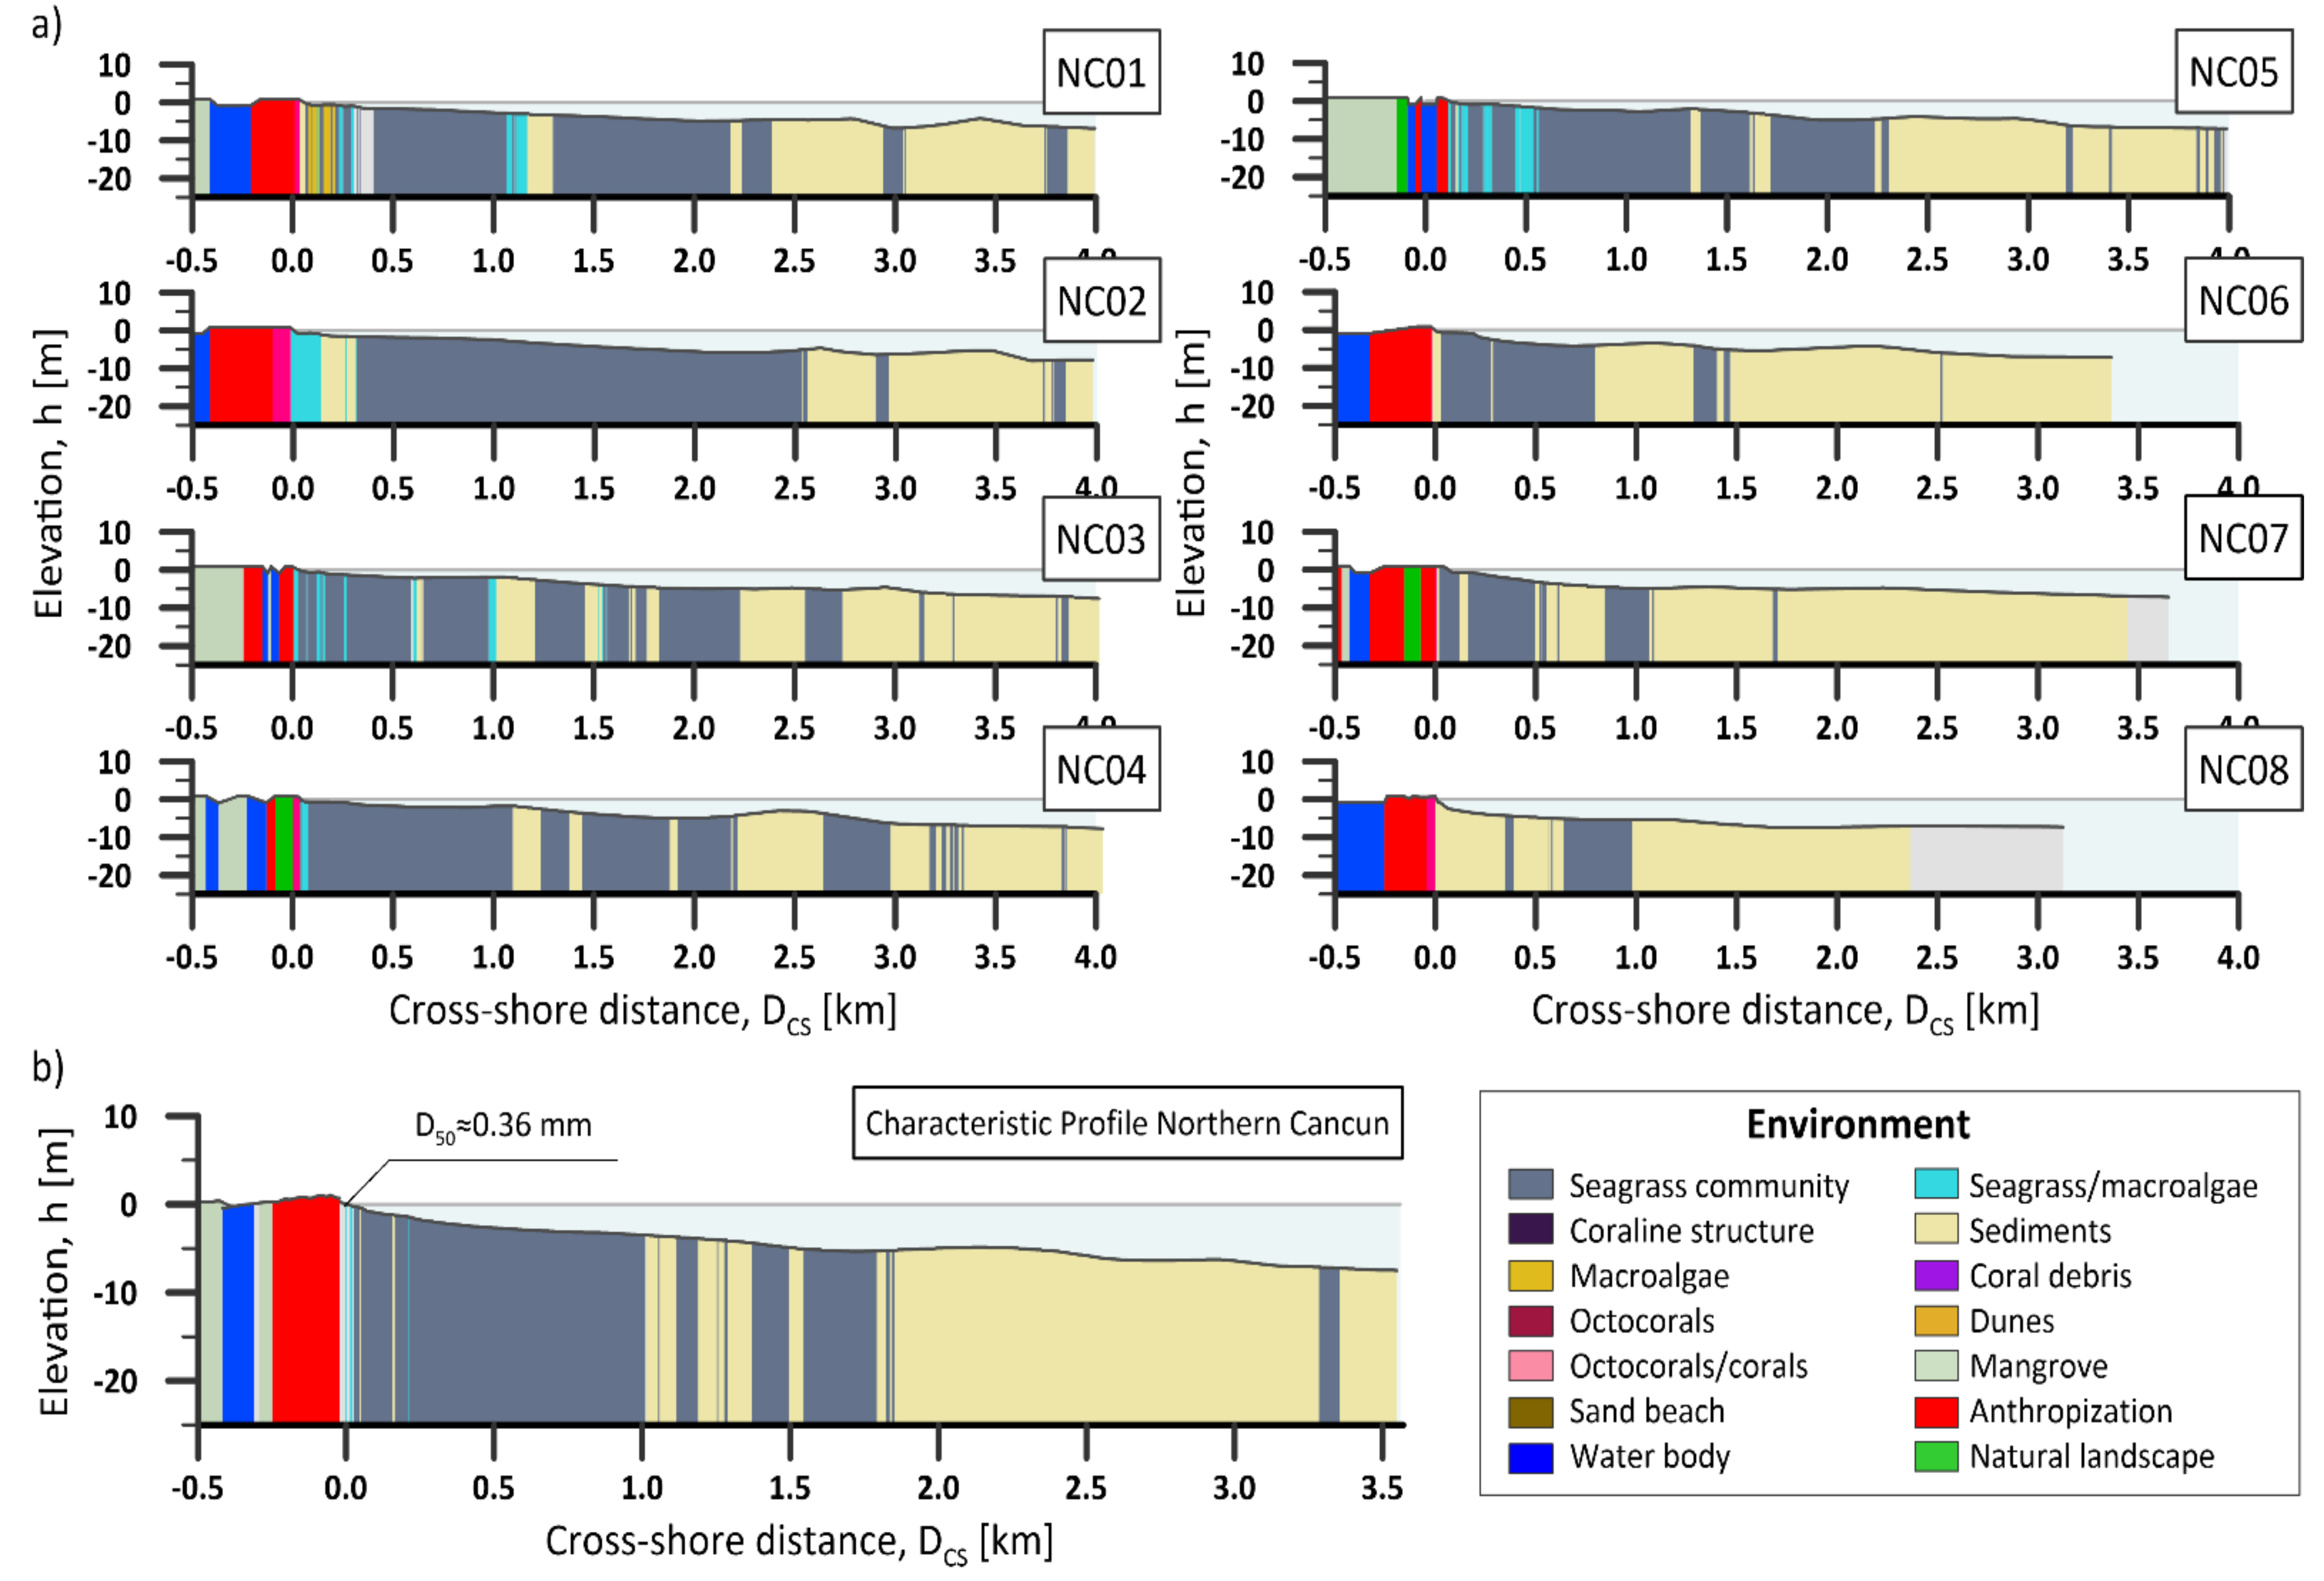
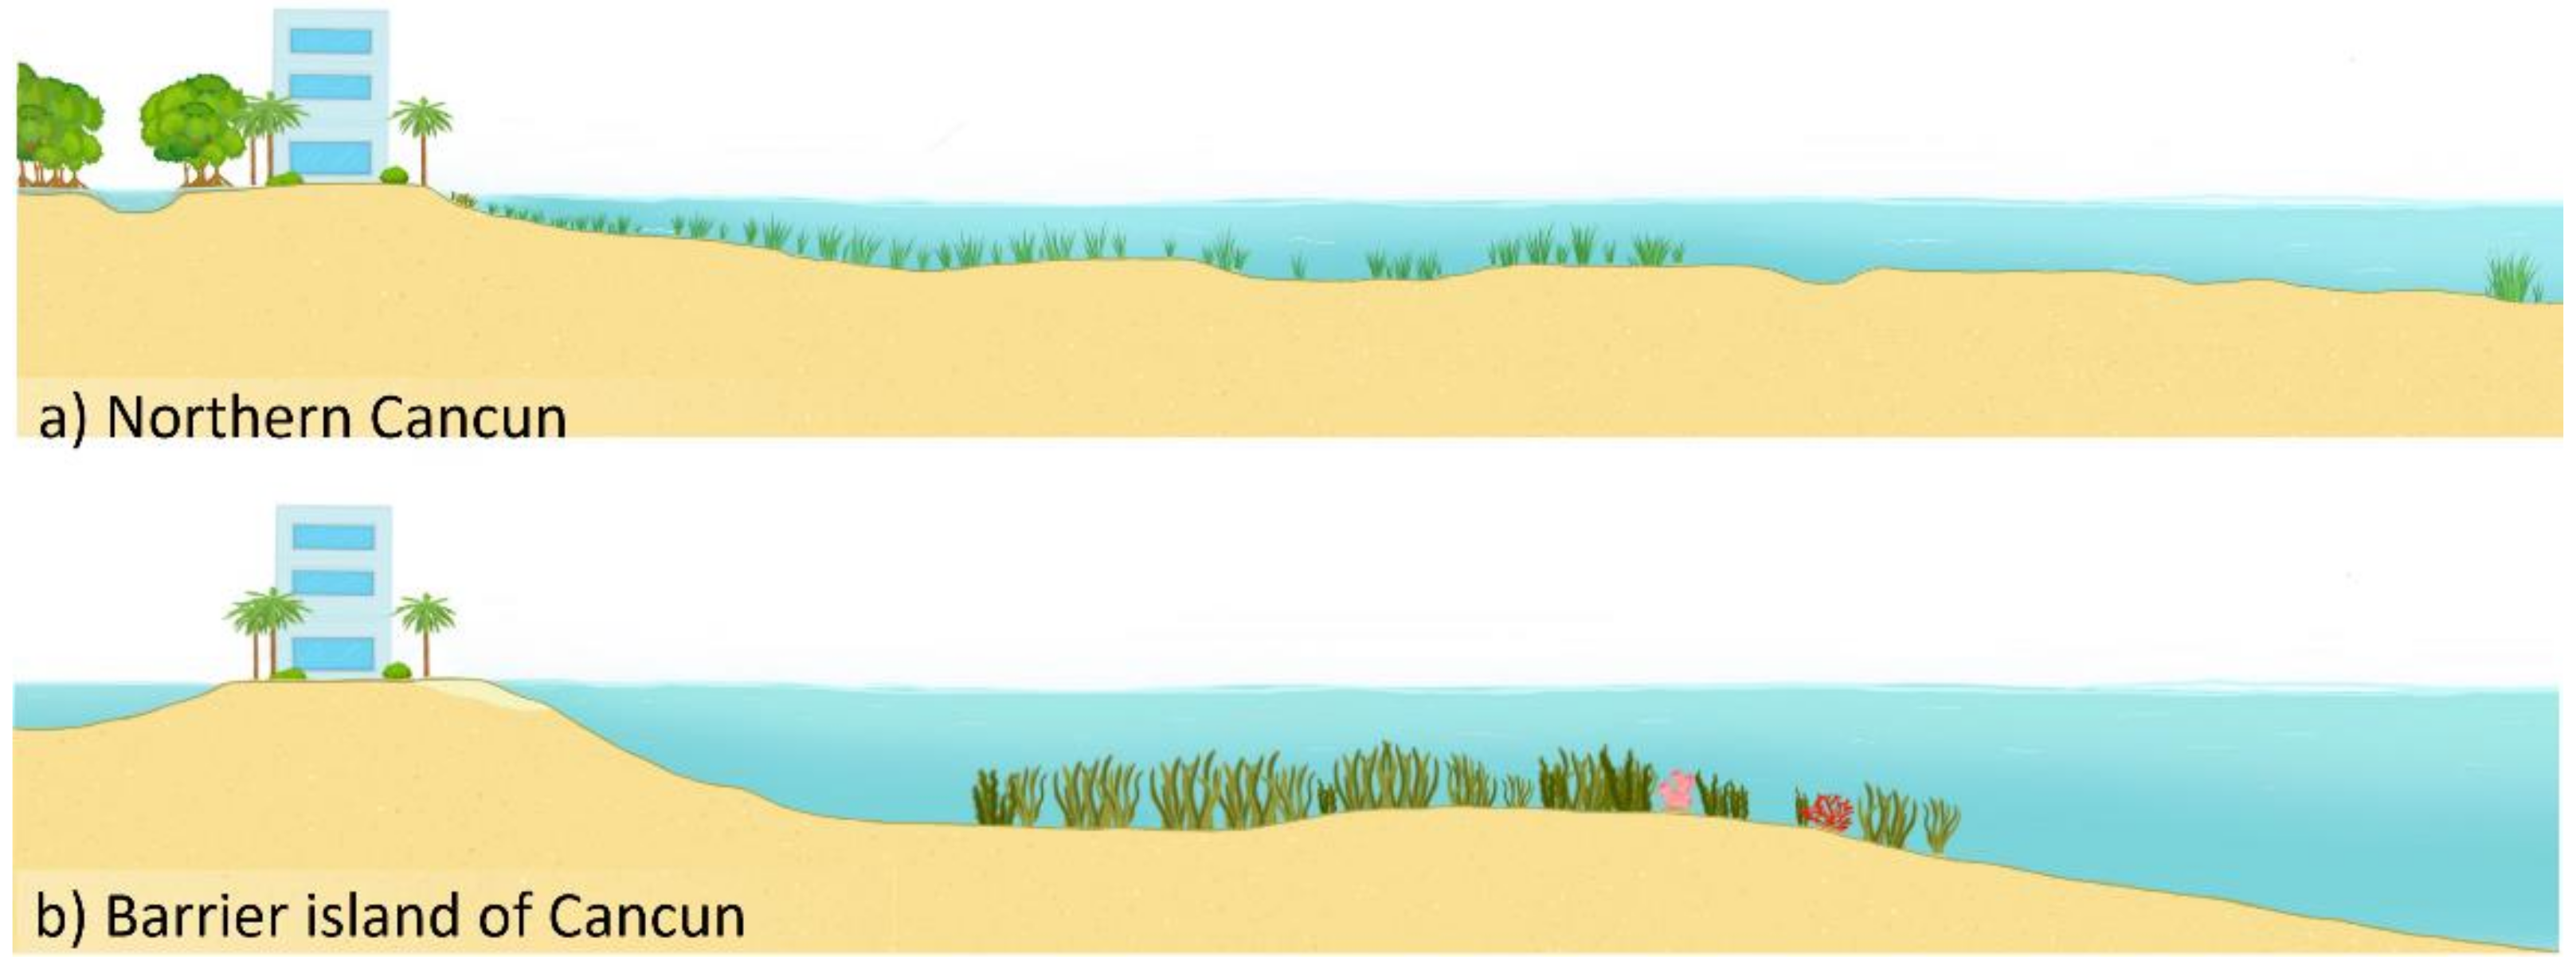
3.2.1. Case Study 1: Cancun
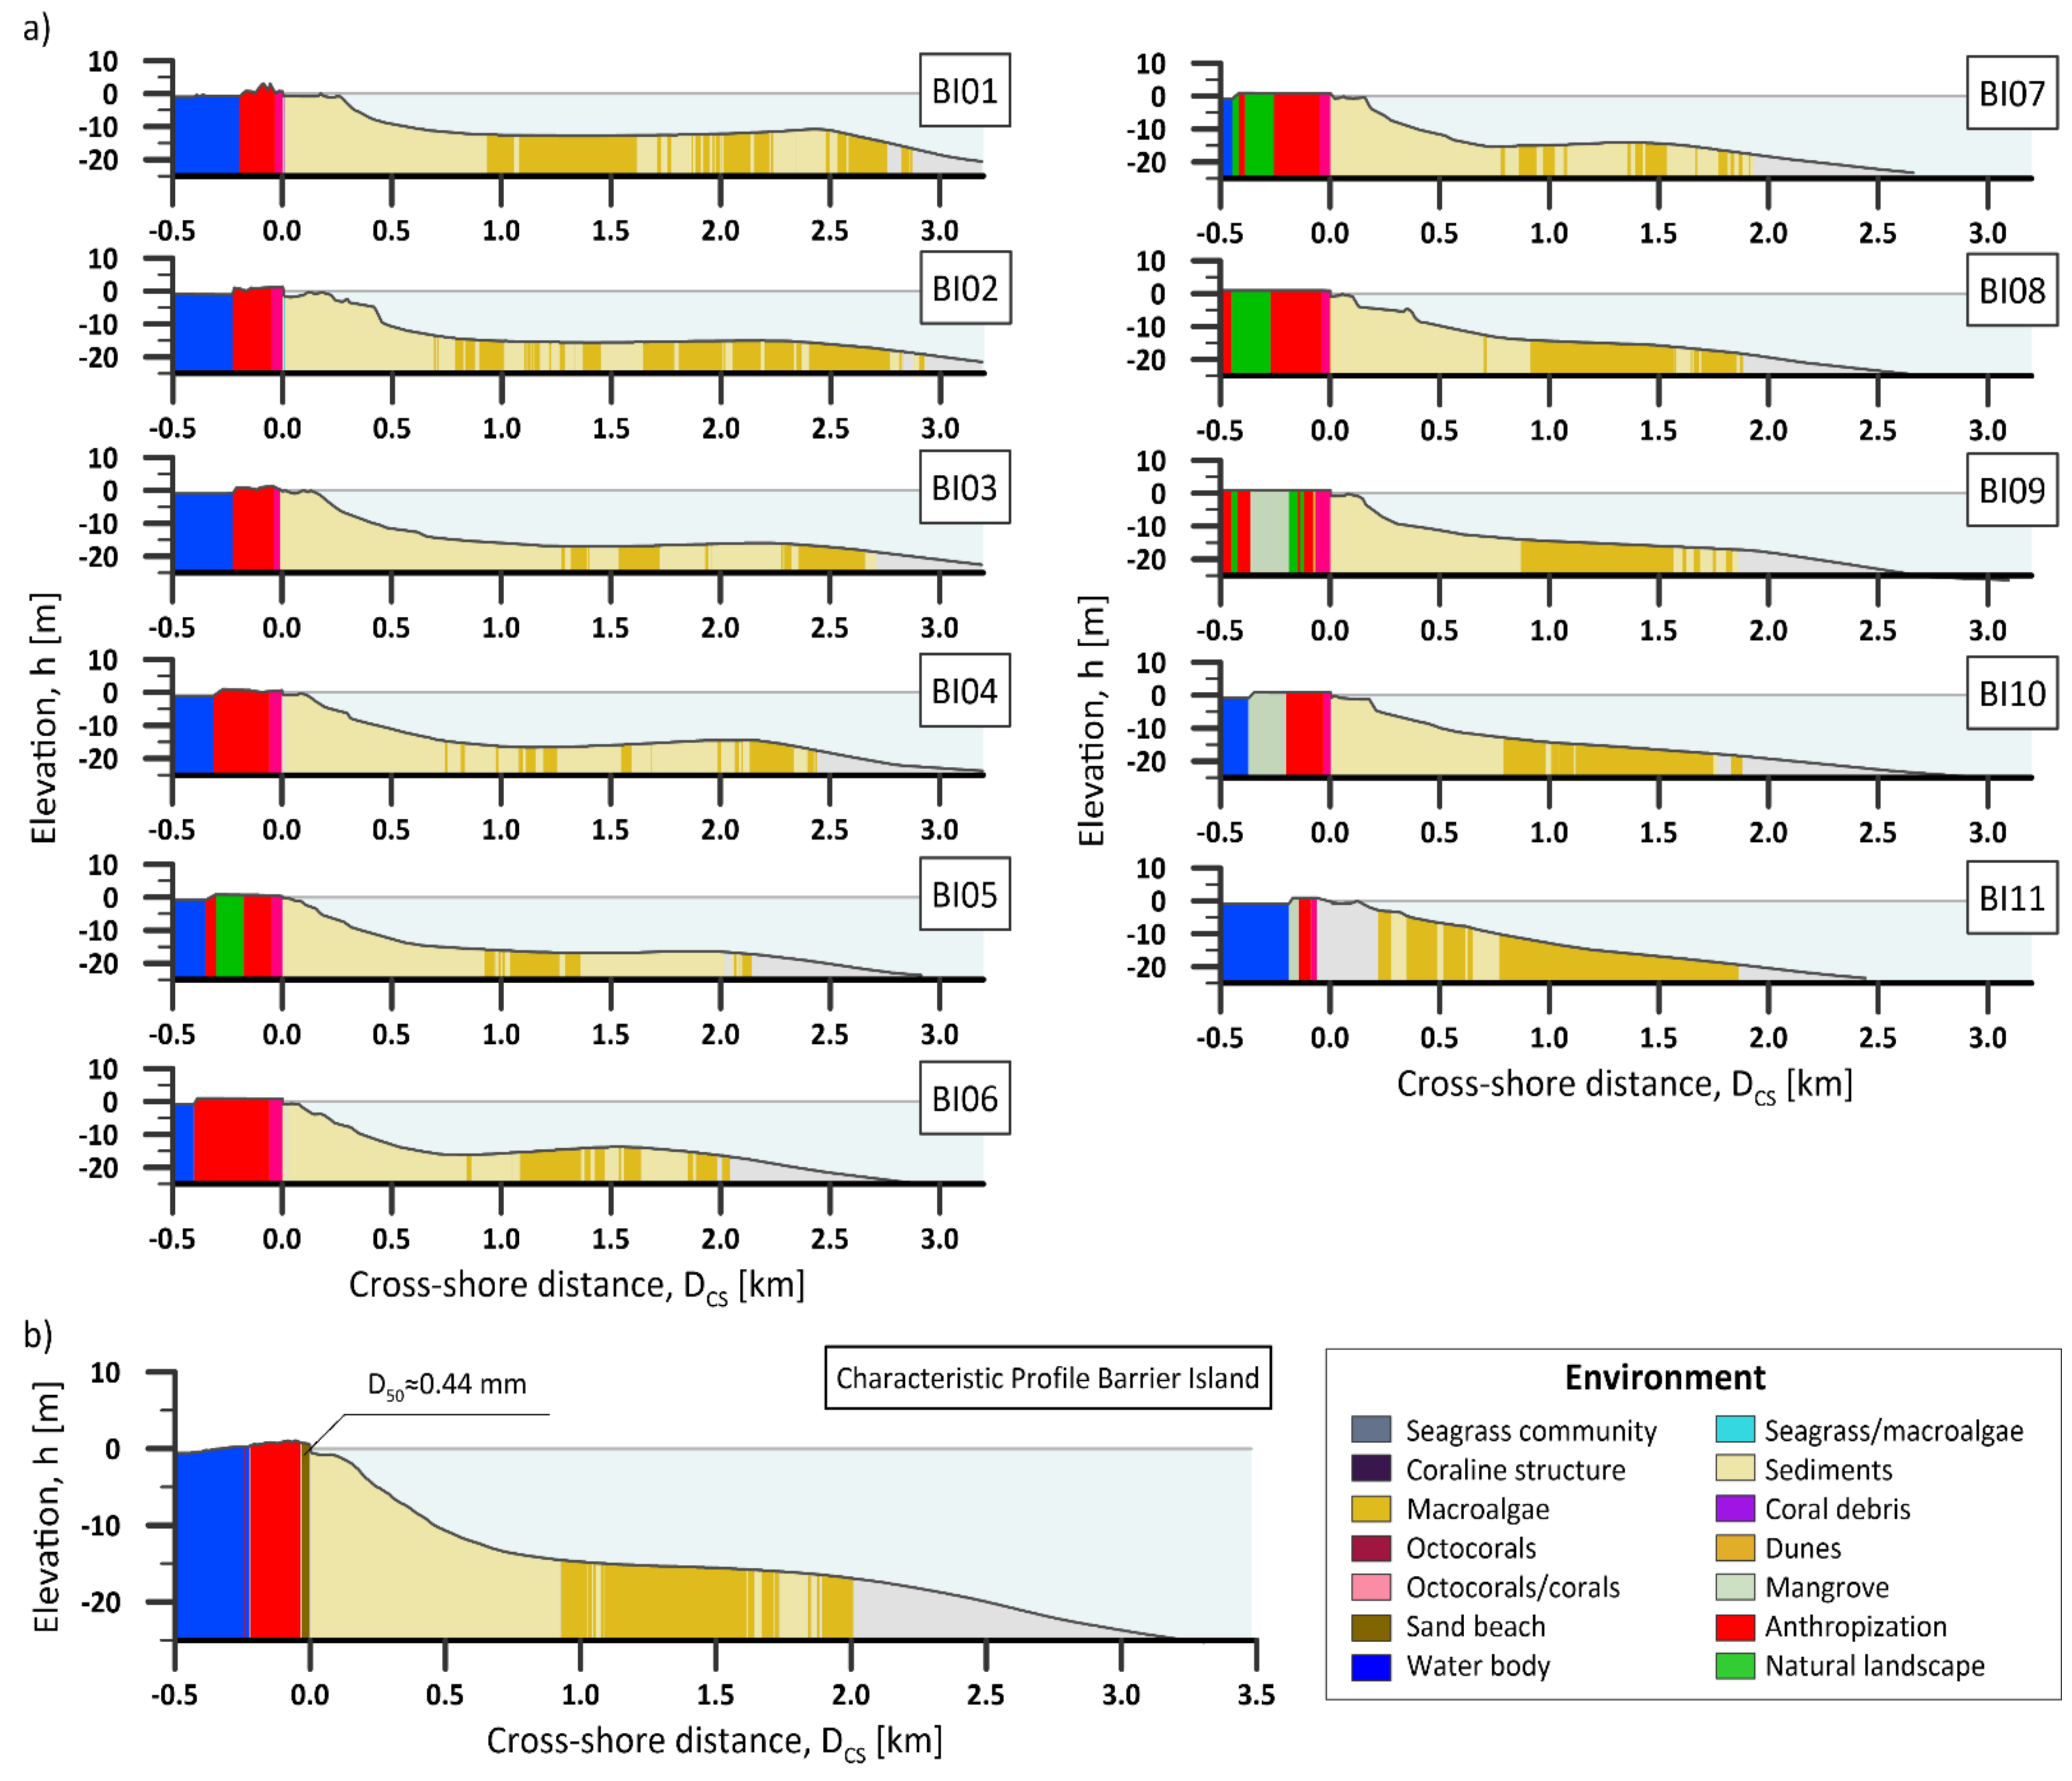
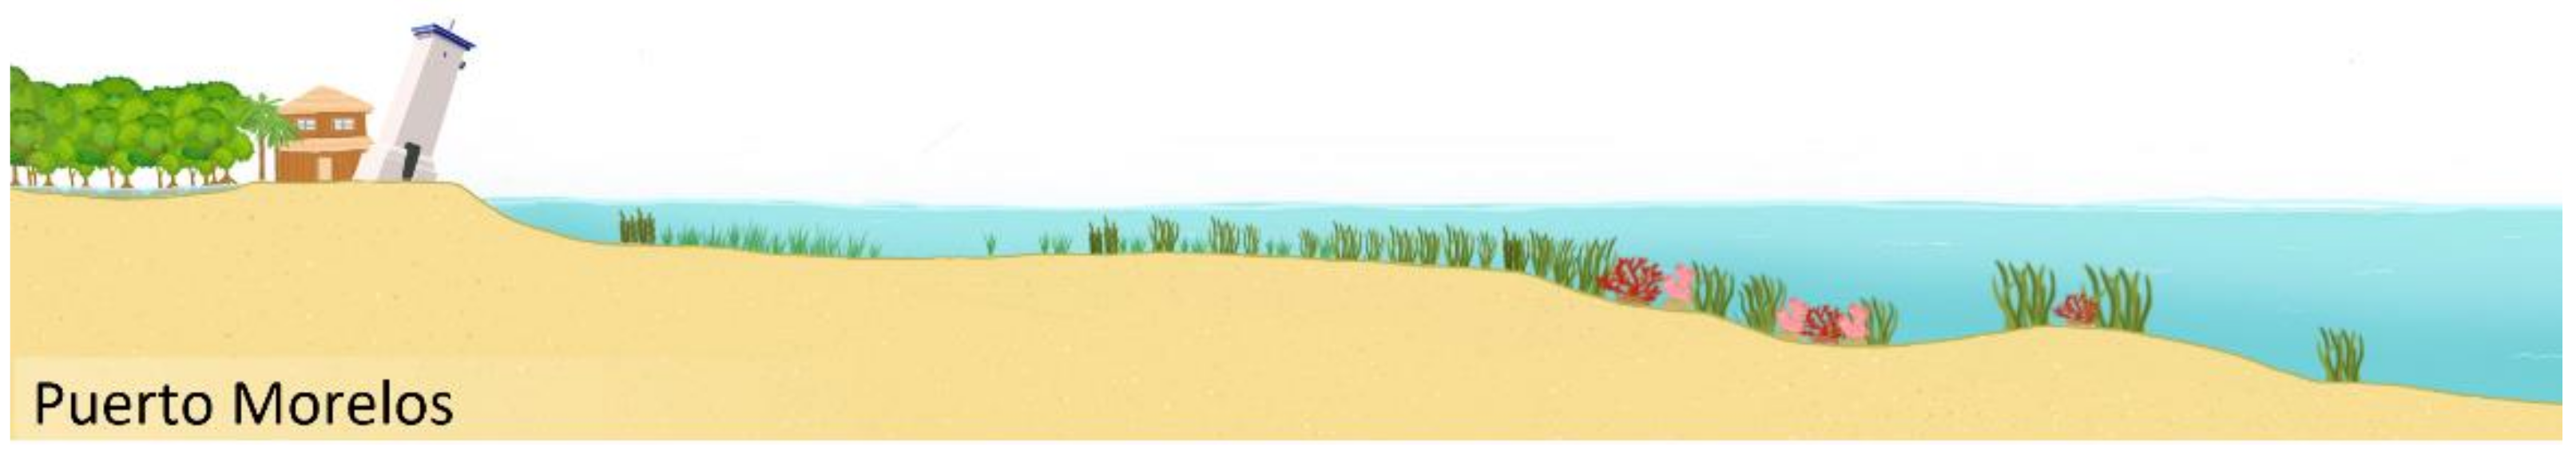
3.2.2. Case Study 2: Puerto Morelos
4. Discussion and Concluding Remarks
Author Contributions
Funding
Data Availability Statement
Acknowledgments
Conflicts of Interest
References
- Hughes, T.P.; Barnes, M.L.; Bellwood, D.R.; Cinner, J.E.; Cumming, G.S.; Jackson, J.B.C.; Kleypas, J.; van de Leemput, I.A.; Lough, J.M.; Morrison, T.H.; et al. Coral reefs in the Anthropocene. Nature 2017, 546, 82–90. [Google Scholar] [CrossRef] [PubMed]
- Larcombe, P.; Costen, A.; Woolfe, K.J. The hydrodynamic and sedimentary setting of nearshore coral reefs, central Great Barrier Reef shelf, Australia: Paluma Shoals, a case study. Sedimentology 2001, 48, 811–835. [Google Scholar] [CrossRef]
- van den Hoek, L.S.; Bayoumi, E.K. Importance, destruction and recovery of coral reefs. IOSR J. Pharm. Biol. Sci. 2017, 12, 59–63. [Google Scholar] [CrossRef]
- Sheppard, C.; Dixon, D.J.; Gourlay, M.; Sheppard, A.; Payet, R. Coral mortality increases wave energy reaching shores protected by reef flats: Examples from the Seychelles. Estuar. Coast. Shelf Sci. 2005, 64, 223–234. [Google Scholar] [CrossRef]
- Christianen, M.J.A.; van Belzen, J.; Herman, P.M.J.; van Katwijk, M.M.; Lamers, L.P.M.; van Leent, P.J.M.; Bouma, T.J. Low-canopy seagrass beds still provide important coastal protection services. PLoS ONE 2013, 8, e62413. [Google Scholar] [CrossRef] [Green Version]
- Maxwell, P.S.; Eklöf, J.S.; van Katwijk, M.M.; O’Brien, K.R.; de la Torre-Castro, M.; Boström, C.; Bouma, T.J.; Krause-Jensen, D.; Unsworth, R.K.F.; van Tussenbroek, B.I.; et al. The fundamental role of ecological feedback mechanisms for the adaptive management of seagrass ecosystems—A review. Biol. Rev. 2017, 92, 1521–1538. [Google Scholar] [CrossRef] [Green Version]
- Cohn, N.; Hoonhout, B.; Goldstein, E.; De Vries, S.; Moore, L.; Durán Vinent, O.; Ruggiero, P. Exploring marine and aeolian controls on coastal foredune growth using a coupled numerical model. J. Mar. Sci. Eng. 2019, 7, 13. [Google Scholar] [CrossRef] [Green Version]
- Pellón, E.; de Almeida, L.R.; González, M.; Medina, R. Relationship between foredune profile morphology and aeolian and marine dynamics: A conceptual model. Geomorphology 2020, 351, 106984. [Google Scholar] [CrossRef]
- Delgado-Fernandez, I. Meso-scale modelling of aeolian sediment input to coastal dunes. Geomorphology 2011, 130, 230–243. [Google Scholar] [CrossRef] [Green Version]
- de Almeida, L.R.; Silva, R.; Martínez, M.L. The relationships between environmental conditions and parallel ecosystems on the coastal dunes of the Mexican Caribbean. Geomorphology 2022, 397, 108006. [Google Scholar] [CrossRef]
- Franklin, G.; Mariño-Tapia, I.; Torres-Freyermuth, A. Effects of reef roughness on wave setup and surf zone currents. J. Coast. Res. 2013, 165, 2005–2010. [Google Scholar] [CrossRef]
- Guannel, G.; Arkema, K.; Ruggiero, P.; Verutes, G. The power of three: Coral reefs, seagrasses and mangroves protect coastal regions and increase their resilience. PLoS ONE 2016, 11, e0158094. [Google Scholar] [CrossRef] [PubMed] [Green Version]
- Golshani, A.; Baldock, T.E.; Mumby, P.J.; Callaghan, D.; Nielsen, P.; Phinn, S. Climate impacts on hydrodynamics and sediment dynamics at reef islands. In Proceedings of the 12th International Coral Reef Symposium, James Cook University. Townsville, Australia, 9–13 July 2012. [Google Scholar]
- Elfrink, B.; Baldock, T. Hydrodynamics and sediment transport in the swash zone: A review and perspectives. Coast. Eng. 2002, 45, 149–167. [Google Scholar] [CrossRef]
- Liu, C.; Shen, Y. Flow structure and sediment transport with impacts of aquatic vegetation. J. Hydrodyn. 2008, 20, 461–468. [Google Scholar] [CrossRef]
- Moki, H.; Taguchi, K.; Nakagawa, Y.; Montani, S.; Kuwae, T. Spatial and seasonal impacts of submerged aquatic vegetation (SAV) drag force on hydrodynamics in shallow waters. J. Mar. Syst. 2020, 209, 103373. [Google Scholar] [CrossRef]
- Nakayama, K.; Shintani, T.; Komai, K.; Nakagawa, Y.; Tsai, J.W.; Sasaki, D.; Tada, K.; Moki, H.; Kuwae, T.; Watanabe, K.; et al. Integration of submerged aquatic vegetation motion within hydrodynamic models. Water Resour. Res. 2020, 56, 8. [Google Scholar] [CrossRef]
- Amoudry, L.O.; Souza, A.J. Deterministic coastal morphological and sediment transport modeling: A review and discussion. Rev. Geophys. 2011, 49, RG2002. [Google Scholar] [CrossRef] [Green Version]
- Storlazzi, C.D.; Elias, E.; Field, M.E.; Presto, M.K. Numerical modeling of the impact of sea-level rise on fringing coral reef hydrodynamics and sediment transport. Coral Reefs 2011, 30, 83–96. [Google Scholar] [CrossRef] [Green Version]
- Gillis, L.; Bouma, T.; Jones, C.; van Katwijk, M.; Nagelkerken, I.; Jeuken, C.; Herman, P.; Ziegler, A. Potential for landscape-scale positive interactions among tropical marine ecosystems. Mar. Ecol. Prog. Ser. 2014, 503, 289–303. [Google Scholar] [CrossRef] [Green Version]
- Stallins, J.A. Geomorphology and ecology: Unifying themes for complex systems in biogeomorphology. Geomorphology 2006, 77, 207–216. [Google Scholar] [CrossRef]
- Perry, C.T.; Kench, P.S.; Smithers, S.G.; Riegl, B.; Yamano, H.; O’Leary, M.J. Implications of reef ecosystem change for the stability and maintenance of coral reef islands. Glob. Chang. Biol. 2011, 17, 3679–3696. [Google Scholar] [CrossRef]
- Odériz, I.; Gómez, I.; Ventura, Y.; Díaz, V.; Escalante, A.; Gómez, D.T.; Bouma, T.J.; Silva, R. Understanding drivers of connectivity and resilience under tropical cyclones in coastal ecosystems at Puerto Morelos, Mexico. J. Coast. Res. 2020, 95, 128–132. [Google Scholar] [CrossRef]
- Salazar-Vallejo, S.I. Huracanes y biodiversidad costera tropical. Rev. Biol. Trop. 2002, 50, 2. [Google Scholar]
- Vincent, C.E.; Young, R.A.; Swift, D.J. Bed-load transport under waves and currents. Mar. Geol. 1981, 39, M71–M80. [Google Scholar] [CrossRef]
- Klein, A.H.d.F.; Miot da Silva, G.; Ferreira, O.; Alveirinho-Dias, J. Beach sediment distribution for a headland bay coast. J. Coast. Res. 2005, 42, 285–293. [Google Scholar]
- Murray, G. Constructing paradise: The impacts of big tourism in the Mexican Coastal Zone. Coast. Manag. 2007, 35, 339–355. [Google Scholar] [CrossRef]
- Calva-Benítez, L.G.; Torres-Alvarado, R. Organic carbon and textural characteristics of sediments in areas with turtlegrass Thalassia testudinum in coastal ecosystems of the southeastern gulf of Mexico. Univ. Ciencia. Tróp. Húmed. 2011, 27, 133–144. [Google Scholar]
- Ouillon, S. Why and how do we study sediment transport? Focus on coastal zones and ongoing methods. Water 2018, 10, 390. [Google Scholar] [CrossRef]
- Poizot, E.; Anfuso, G.; Méar, Y.; Bellido, C. Confirmation of beach accretion by grain-size trend analysis: Camposoto beach, Cádiz, SW Spain. Geo-Mar. Lett. 2013, 33, 263–272. [Google Scholar] [CrossRef]
- Guimarais, M.; Zúñiga-Ríos, A.; Cruz-Ramírez, C.J.; Chávez, V.; Odériz, I.; van Tussenbroek, B.I.; Silva, R. The conservational state of coastal ecosystems on the Mexican Caribbean coast: Environmental guidelines for their management. Sustainability 2021, 13, 2738. [Google Scholar] [CrossRef]
- Silva, R.; Martínez, M.L.; van Tussenbroek, B.I.; Guzmán-Rodríguez, L.O.; Mendoza, E.; López-Portillo, J. A framework to manage coastal squeeze. Sustainability 2020, 12, 610. [Google Scholar] [CrossRef]
- Franklin, G.L.; Torres-Freyermuth, A.; Medellin, G.; Allende-Arandia, M.E.; Appendini, C.M. The role of the reef–dune system in coastal protection in Puerto Morelos (Mexico). Nat. Hazards Earth Syst. Sci. 2018, 18, 1247–1260. [Google Scholar] [CrossRef] [Green Version]
- Martell-Dubois, R.; Mendoza, E.; Mariño-Tapia, I.; Odériz, I.; Silva, R. How effective were the beach nourishments at Cancun? J. Mar. Sci. Eng. 2020, 8, 388. [Google Scholar] [CrossRef]
- SEGOB-COESPO. Atlas Sociodemográfico Quintana Roo. Available online: https://qroo.gob.mx/index2.php/segob/coespo/atlas-sociodemografico (accessed on 1 December 2021).
- Jáuregui, E. Climatology of landfalling hurricanes and tropical storms in Mexico. Atmósfera 2003, 16, 193–204. [Google Scholar]
- Ojeda, E.; Appendini, C.M.; Mendoza, E.T. Storm-wave trends in Mexican waters of the Gulf of Mexico and Caribbean Sea. Nat. Hazards Earth Syst. Sci. 2017, 17, 1305–1317. [Google Scholar] [CrossRef] [Green Version]
- Kjerfve, B. Tides of the Caribbean Sea. J. Geophys. Res. 1981, 86, 4243. [Google Scholar] [CrossRef]
- Cetina, P.; Candela, J.; Sheinbaum, J.; Ochoa, J.; Badan, A. Circulation along the Mexican Caribbean coast. J. Geophys. Res. C Ocean. 2006, 111, C8. [Google Scholar] [CrossRef] [Green Version]
- Kjerfve, B. Coastal Oceanographic Characteristics: Cancun-Tulum Corridor, Quintana Roo; ECOMAR-EPOMEX: Campeche, Mexico, 1994. [Google Scholar]
- Rioja-Nieto, R.; Álvarez-Filip, L. Coral reef systems of the Mexican Caribbean: Status, recent trends and conservation. Mar. Pollut. Bull. 2019, 140, 616–625. [Google Scholar] [CrossRef]
- Jordán-Dahlgren, E.; Rodríguez-Martínez, R.E. The Atlantic coral reefs of Mexico. In Latin American Coral Reefs; Cortés, J., Ed.; Elsevier: Amsterdam, The Netherlands, 2003; pp. 131–158. ISBN 9780444513885. [Google Scholar]
- James, R.K.; Silva, R.; van Tussenbroek, B.I.; Escudero-Castillo, M.; Mariño-Tapia, I.; Dijkstra, H.A.; van Westen, R.M.; Pietrzak, J.D.; Candy, A.S.; Katsman, C.A.; et al. Maintaining tropical beaches with seagrass and algae: A promising alternative to engineering solutions. Bioscience 2019, 69, 136–142. [Google Scholar] [CrossRef] [Green Version]
- Mariño-Tapia, I.; Enríquez-Ortiz, C.; Silva, R.; Mendoza, E.; Escalante-Mancera, E.; Ruiz-Renteria, F. Comparative morphodynamics between exposed and reef protected beaches under hurricane conditions. Coast. Eng. Proc. 2014, 1, 55. [Google Scholar] [CrossRef]
- Retsch Technology. Operating Instructions/Manual. Particle Size Analysis System CAMSIZER; Doc.Nr. CA.; Jenoptik Germany: Haan, Germany, 2007. [Google Scholar]
- Anfuso, G.; Pranzini, E.; Vitale, G. An integrated approach to coastal erosion problems in northern Tuscany (Italy): Littoral morphological evolution and cell distribution. Geomorphology 2011, 129, 204–214. [Google Scholar] [CrossRef]
- Frihy, O.E.; Dewidar, K.M. Patterns of erosion/sedimentation, heavy mineral concentration and grain size to interpret boundaries of littoral sub-cells of the Nile Delta, Egypt. Mar. Geol. 2003, 199, 27–43. [Google Scholar] [CrossRef]
- Hersbach, H.; Bell, B.; Berrisford, P.; Biavati, G.; Horányi, A.; Muñoz-Sabater, J.; Nicolas, J.; Peubey, C.; Radu, R.; Rozum, I.; et al. ERA5 Hourly Data on Single Levels from 1979 to Present. Available online: https://cds.climate.copernicus.eu/cdsapp#!/dataset/10.24381/cds.bd0915c6?tab=overview (accessed on 3 January 2022).
- Boccotti, P. Wave Mechanics for Ocean Engineering; Elsevier Science: Amsterdam, The Netherlands, 2000; ISBN 9780080543727. [Google Scholar]
- Cerdeira-Estrada, S.; Martell-Dubois, R.; Heege, T.; Rosique-De La Cruz, L.O.; Blanchon, P.; Ohlendorf, S.; Müller, A.; Silva, R.; Mariño-Tapia, I.J.; Martínez-Clorio, M.I.; et al. Cobertura Bentónica de los Ecosistemas Marinos del Caribe Mexicano: Cabo Catoche—Xcalak 2018; Scale 1:4; Comisi´on Nacional para el Conocimiento y Uso de la Biodiversidad (CONABIO): Mexico City, Mexico, 2018. [Google Scholar]
- CONABIO. Distribución de los Manglares en México en 2020; 1:50000; Comisión Nacional para el Conocimiento y Uso de la Biodiversidad (CONABIO): Mexico City, Mexico, 2020. [Google Scholar]
- Cruz, C.J.; Mendoza, E.; Silva, R.; Chávez, V. Assessing degrees of anthropization on the coast of Mexico from ecosystem conservation and population growth data. J. Coast. Res. 2019, 92, 136. [Google Scholar] [CrossRef]
- INEGI. Mapa de Uso de Suelo y Vegetación; 1:50000; Instituto Nacional de Estadística y Geografía: Mexico City, Mexico, 2017. [Google Scholar]
- Silva, R.; Baquerizo, A.; Losada, M.Á.; Mendoza, E. Hydrodynamics of a headland-bay beach—Nearshore current circulation. Coast. Eng. 2010, 57, 160–175. [Google Scholar] [CrossRef]
- Kirby, J.T.; Dalrymple, R.A. A parabolic equation for the combined refraction–diffraction of Stokes waves by mildly varying topography. J. Fluid Mech. 1983, 136, 453. [Google Scholar] [CrossRef] [Green Version]
- Battalio, B.; Chandrasekera, C.; Divoky, D.; Hatheway, D.; Hull, T.; O’Reilly, B.; Seymour, D.; Srinivas, R. FEMA Coastal Flood Hazard Analysis and Mapping Guidelines—Wave Transformation; Focused Study Report; Federal Emergency Management Agency (FEMA): Washington, DC, USA, 2005.
- Secretaría de Marina. Catálogo de Cartas y Publicaciones Náuticas 2022; Secretaría de Marina: Mexico City, Mexico, 2022. [Google Scholar]
- Koch, E.W.; Ailstock, S.; Stevenson, J.C. Beyond light: Physical, geological and chemical habitat requirements. In Chesapeake Bay Submerged Aquatic Vegetation Water Quality and Habitat-Based Requirements and Restoration Targets: A Second Technical Synthesis; Environmental Protection Agency: Washington, DC, USA, 2000; pp. 71–94. [Google Scholar]
- Madsen, J.D.; Chambers, P.A.; James, W.F.; Koch, E.W.; Westlake, D.F. The interaction between water movement, sediment dynamics and submersed macrophytes. Hydrobiologia 2001, 444, 71–84. [Google Scholar] [CrossRef]
- Adame, M.F.; Zaldívar-Jimenez, A.; Teutli, C.; Caamal, J.P.; Andueza, M.T.; López-Adame, H.; Cano, R.; Hernández-Arana, H.A.; Torres-Lara, R.; Herrera-Silveira, J.A. Drivers of mangrove litterfall within a karstic region affected by frequent hurricanes. Biotropica 2013, 45, 147–154. [Google Scholar] [CrossRef] [Green Version]
- Lowe, R.J. Spectral wave dissipation over a barrier reef. J. Geophys. Res. 2005, 110, C04001. [Google Scholar] [CrossRef]
- Barbier, E.B.; Hacker, S.D.; Kennedy, C.; Koch, E.W.; Stier, A.C.; Silliman, B.R. The value of estuarine and coastal ecosystem services. Ecol. Monogr. 2011, 81, 169–193. [Google Scholar] [CrossRef]
- Koch, E.W.; Barbier, E.B.; Silliman, B.R.; Reed, D.J.; Perillo, G.M.; Hacker, S.D.; Granek, E.F.; Primavera, J.H.; Muthiga, N.; Polasky, S.; et al. Non-linearity in ecosystem services: Temporal and spatial variability in coastal protection. Front. Ecol. Environ. 2009, 7, 29–37. [Google Scholar] [CrossRef]
- Dean, R.G. Equilibrium Beach Profiles: US Atlantic and Gulf Coasts; Department of Civil Engineering and College of Marine Studies, University of Delaware: Newark, NJ, USA, 1977. [Google Scholar]
- van Tussenbroek, B.I.; Cortés, J.; Collin, R.; Fonseca, A.C.; Gayle, P.M.H.; Guzmán, H.M.; Jácome, G.E.; Juman, R.; Koltes, K.H.; Oxenford, H.A.; et al. Caribbean-wide, long-term study of seagrass beds reveals local variations, shifts in community structure and occasional collapse. PLoS ONE 2014, 9, e90600. [Google Scholar] [CrossRef] [Green Version]
- Osorio-Cano, J.D.; Osorio, A.F.; Peláez-Zapata, D.S. Ecosystem management tools to study natural habitats as wave damping structures and coastal protection mechanisms. Ecol. Eng. 2019, 130, 282–295. [Google Scholar] [CrossRef]
- Alcérreca-Huerta, J.C.; Montiel-Hernández, J.R.; Callejas-Jiménez, M.E.; Hernández-Avilés, D.A.; Anfuso, G.; Silva, R. Vulnerability of Subaerial and Submarine Landscapes: The Sand Falls in Cabo San Lucas, Mexico. Land 2020, 10, 27. [Google Scholar] [CrossRef]
- Li, W.; Gong, P. Continuous monitoring of coastline dynamics in western Florida with a 30-year time series of Landsat imagery. Remote Sens. Environ. 2016, 179, 196–209. [Google Scholar] [CrossRef]


| Regional Results | a Case Studies | |||||
|---|---|---|---|---|---|---|
| Variable | Min. | Max. | Mean | Std. Dev. | Cancun | Pto. Morelos |
| Grain size, D10 [mm] | 0.050 | 0.727 | 0.219 | 0.106 | 0.254 | 0.214 |
| Grain size, D50 [mm] | 0.093 | 1.433 | 0.391 | 0.200 | 0.451 | 0.368 |
| Grain size, D90 [mm] | 0.196 | 4.754 | 0.875 | 0.702 | 0.992 | 0.754 |
| Density [kg/m3] | 1632 | 3232 | 2443 | 324 | 2565 | 2393 |
| Shape factor, SF = b/L [-] | 0.653 | 0.744 | 0.692 | 0.018 | 0.693 | 0.693 |
| Sphericity, SPHT [-] | 0.679 | 0.897 | 0.831 | 0.029 | 0.836 | 0.832 |
| Period | Wave Height | Storm Duration [h] | Number of Storms | |||||
|---|---|---|---|---|---|---|---|---|
| HS-AV [m] | a HS-Max [m] | Mean | a Min | a Max | Mean | a Min | a Max | |
| 1980–1985 | 2.03 | 7.43 (1980) | 35.2 | 31.4 (1984) | 39.3 (1981) | 19.8 | 14 (1982) | 25 (1980) |
| 1985–1990 | 2.04 | 11.28 (1988) | 35.5 | 29.0 (1985) | 41.3 (1989) | 19.8 | 14 (1986) | 26 (1988) |
| 1990–1995 | 2.04 | 4.02 (1991) | 39.0 | 31.4 (1992) | 44.0 (1990) | 17.0 | 14 (1992) | 22 (1990) |
| 1995–2000 | 2.06 | 5.69 (1995) | 46.3 | 31.3 (1995) | 55.2 (1999) | 22.0 | 14 (1997) | 28 (1996/1998) |
| 2000–2005 | 2.03 | 7.13 (2004) | 36.6 | 30.5 (2001) | 45.5 (2004) | 21.6 | 19 (2000) | 28 (2001) |
| 2005–2010 | 2.08 | 10.67 (2005) | 38.7 | 31.9 (2007) | 44.1 (2008) | 23.6 | 21 (2006) | 27 (2007) |
| 2010–2015 | 2.02 | 4.28 (2014) | 34.2 | 31.9 (2013) | 37.4 (2012) | 22.2 | 17 (2011/2012) | 33 (2010) |
| 2015–2020 | 2.03 | 3.71 (2018) | 37.7 | 26.7 (2016) | 53.4 (2015) | 21.8 | 17 (2019) | 29 (2016) |
| Average | 37.9 | 30.5 | 45.0 | 21.0 | 16.3 | 27.3 | ||
| a Variable | Northern Region | Anthropized Areas in the Northern Region | |||||
|---|---|---|---|---|---|---|---|
| Cancun | Pto. Morelos | Pl. del Carmen | Akumal | Tulum | |||
| Inhabitants | total | 818,876 | 630,959 | 9188 | 149,923 | 1310 | 18,233 |
| per km | (3276) | (19,842) | (1021) | (17,848) | (293) | (5881) | |
| Human settlements | ha | 17,313 | 11,803 | 186 | 3543 | 36 | 386 |
| ha/km | (69) | (371) | (21) | (422) | (8) | (125) | |
| Mangrove | ha | 22,544 | 3153 | 1055 | 212 | 41 | 29 |
| ha/km | (90) | (99) | (117) | (25) | (9) | (9) | |
| Coastal dune | ha | 1719 | 27 | 15 | 8 | --- | 0.1 |
| ha/km | (7) | (1) | (2) | (1) | --- | (0.0) | |
| Seagrass and macroalgae | ha | 33,327 | 4381 | 1222 | 642 | 203 | 254 |
| ha/km | (133) | (138) | (136) | (76) | (46) | (82) | |
| Coral reefs | ha | 4589 | 123 | 237 | 47 | 51 | 50 |
| ha/km | (18) | (4) | (26) | (6) | (12) | (16) | |
Publisher’s Note: MDPI stays neutral with regard to jurisdictional claims in published maps and institutional affiliations. |
© 2022 by the authors. Licensee MDPI, Basel, Switzerland. This article is an open access article distributed under the terms and conditions of the Creative Commons Attribution (CC BY) license (https://creativecommons.org/licenses/by/4.0/).
Share and Cite
Alcérreca-Huerta, J.C.; Cruz-Ramírez, C.J.; de Almeida, L.R.; Chávez, V.; Silva, R. Interconnections between Coastal Sediments, Hydrodynamics, and Ecosystem Profiles on the Mexican Caribbean Coast. Land 2022, 11, 524. https://doi.org/10.3390/land11040524
Alcérreca-Huerta JC, Cruz-Ramírez CJ, de Almeida LR, Chávez V, Silva R. Interconnections between Coastal Sediments, Hydrodynamics, and Ecosystem Profiles on the Mexican Caribbean Coast. Land. 2022; 11(4):524. https://doi.org/10.3390/land11040524
Chicago/Turabian StyleAlcérreca-Huerta, Juan Carlos, Cesia J. Cruz-Ramírez, Laura R. de Almeida, Valeria Chávez, and Rodolfo Silva. 2022. "Interconnections between Coastal Sediments, Hydrodynamics, and Ecosystem Profiles on the Mexican Caribbean Coast" Land 11, no. 4: 524. https://doi.org/10.3390/land11040524
APA StyleAlcérreca-Huerta, J. C., Cruz-Ramírez, C. J., de Almeida, L. R., Chávez, V., & Silva, R. (2022). Interconnections between Coastal Sediments, Hydrodynamics, and Ecosystem Profiles on the Mexican Caribbean Coast. Land, 11(4), 524. https://doi.org/10.3390/land11040524