
Site Wind Right: Identifying Low-Impact Wind Development Areas in the Central United States


Abstract
:1. Introduction
2. Materials and Methods
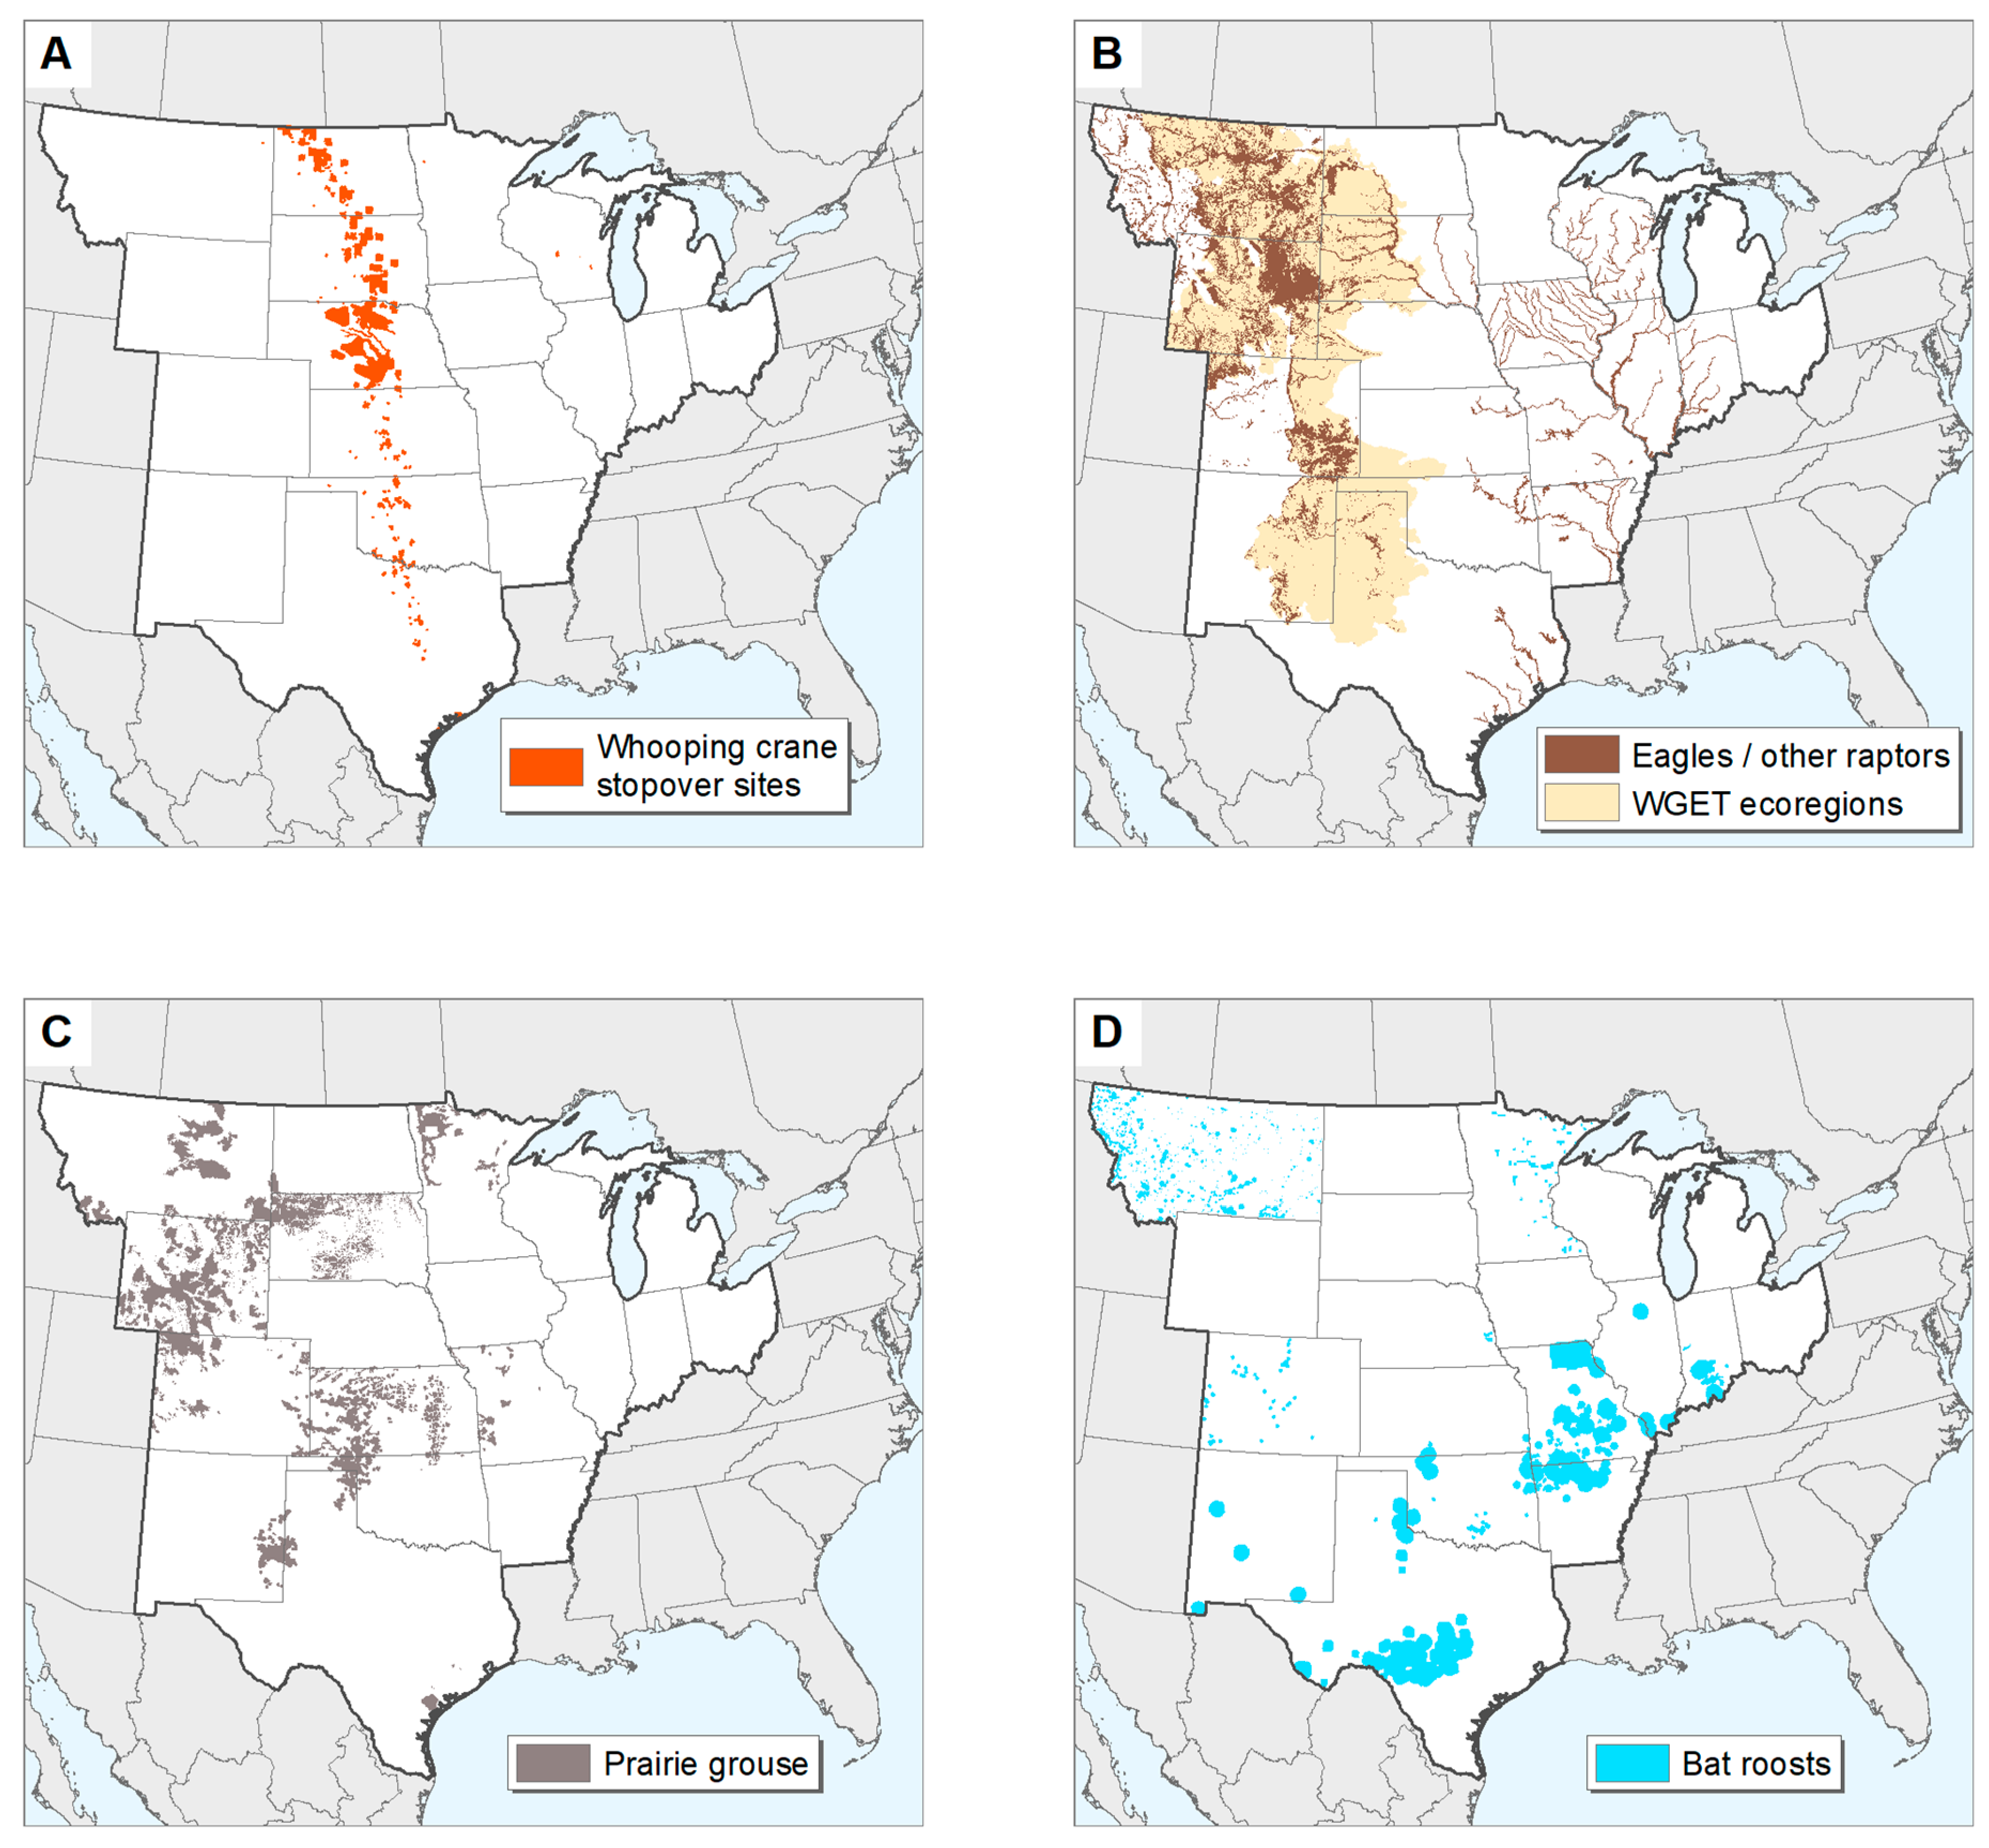
2.1. Whooping Crane Stopover Sites
2.2. Eagles and Other Raptors
2.3. Prairie Grouse
2.4. Bat Roosts
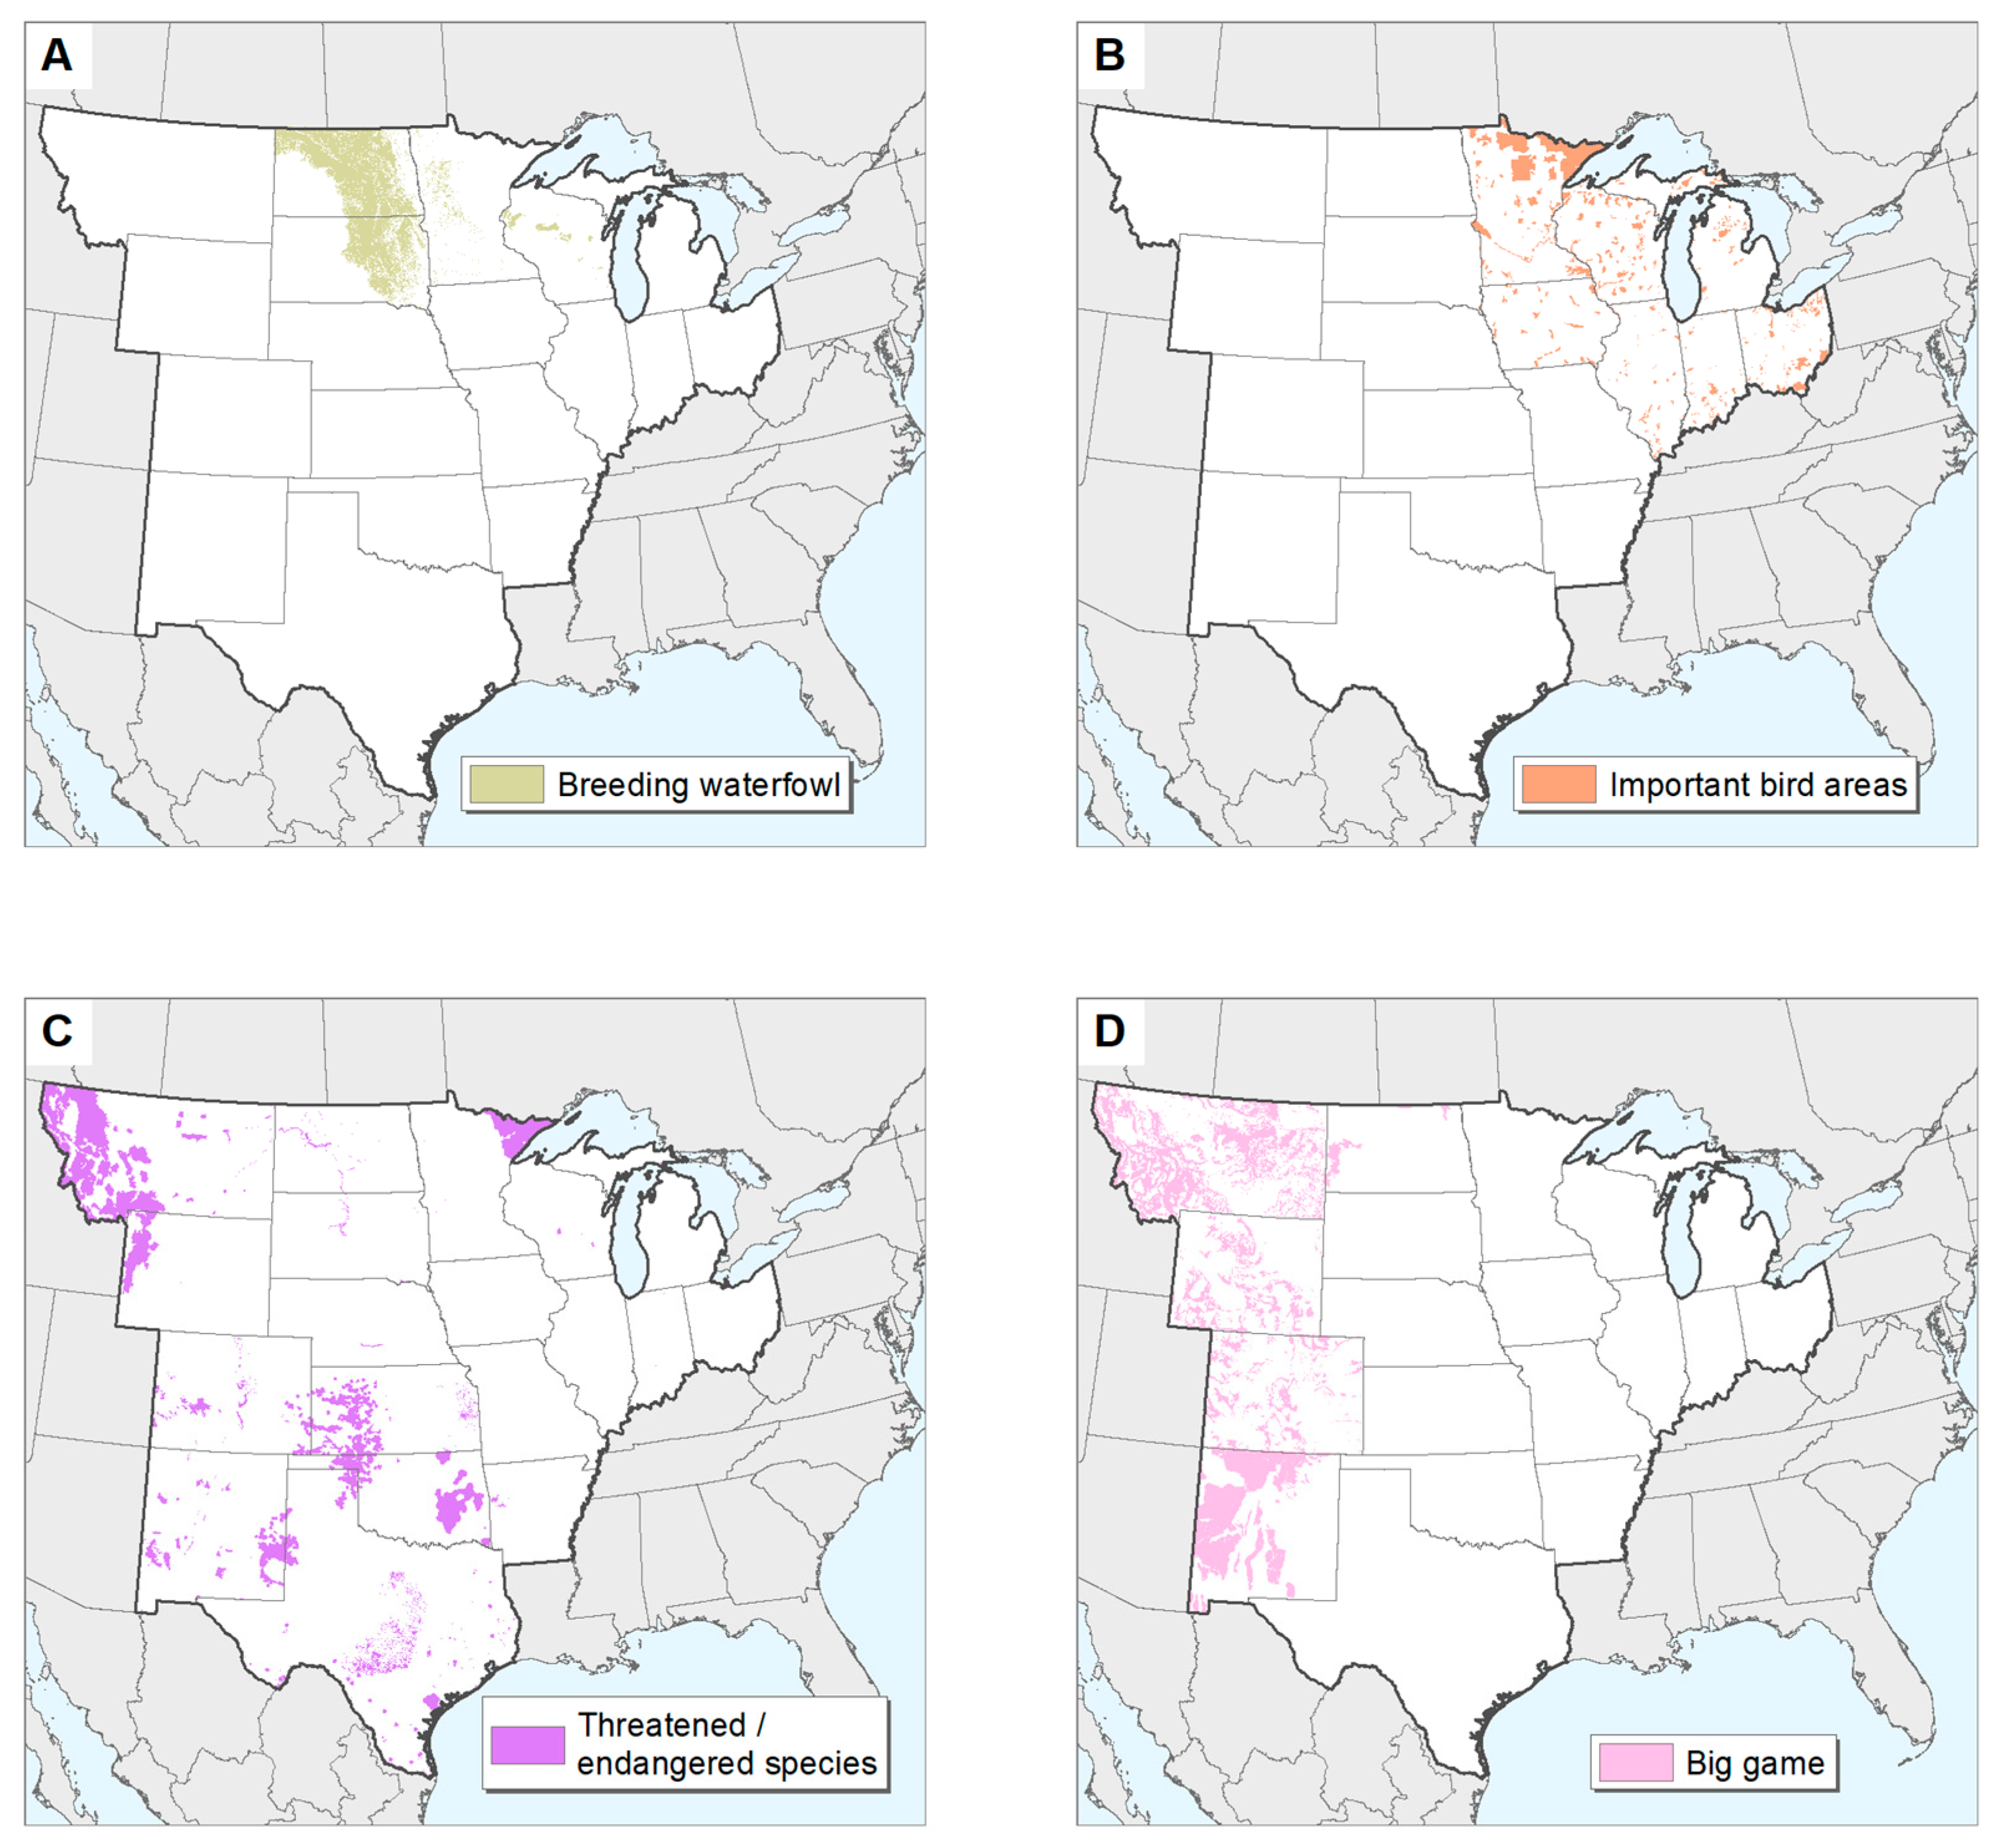
2.5. Breeding Waterfowl
2.6. Important Bird Areas
2.7. Other Terrestrial Threatened and Endangered Species
2.8. Big Game
2.9. Wetlands, Rivers, and Riparian Corridors
2.10. Protected and Managed Lands
2.11. Intact Natural Habitats
2.12. Other Areas of Biodiversity Significance
2.13. Climate Resilient Lands
2.14. Non-Ecological Constraints
2.15. Airfields
2.16. Special Use Airspace
2.17. Radar Stations
2.18. Developed Areas
2.19. Existing Wind Facilities
2.20. Excessive Slope
2.21. Water and Wetlands
2.22. Poor Wind Resource
2.23. Negative Relative Elevation
2.24. Statutory Restrictions
2.25. Data Processing
2.26. Sensitivity Analyses
3. Results
4. Discussion
5. Conclusions
Author Contributions
Funding
Institutional Review Board Statement
Informed Consent Statement
Data Availability Statement
Acknowledgments
Conflicts of Interest
References
- Tallis, H.M.; Hawthorne, P.L.; Polasky, S.; Reid, J.; Beck, M.W.; Brauman, K.; Bielicki, J.M.; Binder, S.; Burgess, M.G.; Cassidy, E.; et al. An attainable global vision for conservation and human well-being. Front. Ecol. Environ. 2018, 16, 563–570. [Google Scholar] [CrossRef] [Green Version]
- Rogelj, J.; Shindell, D.; Jiang, K.; Fifita, S.; Forster, P.; Ginzburg, V.; Handa, C.; Kheshgi, H.; Kobayashi, S.; Kriegler, E.; et al. Mitigation pathways compatible with 1.5°C in the context of sustainable development. In Global Warming of 1.5 °C. An IPCC Special Report on the Impacts of Global Warming of 1.5 °C above Pre-Industrial Levels and Related Global Greenhouse Gas Emission Pathways, in the Context of Sustainable Development; Masson-Delmotte, V., Zhai, P., Pörtner, H.-O., Roberts, D., Skea, J., Shukla, P.R., Pirani, A., Moufouma-Okia, W., Péan, C., Pidcock, R., et al., Eds.; IPCC: Geneva, Switzerland, 2018; pp. 93–174. [Google Scholar]
- Wilsey, C.; Bateman, B.; Taylor, L.; Wu, J.X.; LeBaron, G.; Shepherd, R.; Koseff, C.; Friedman, S.; Stone, R. Survival by Degrees: 389 Species on the Brink; Audubon: New York, NY, USA, 2019; Available online: https://www.audubon.org/climate/survivalbydegrees (accessed on 9 February 2022).
- Hand, M.M.; Baldwin, S.; DeMeo, E.; Reilly, J.M.; Mai, T.; Arent, D.; Porro, G.; Meshek, M.; Sandor, D. Renewable Electricity Futures Study; Technical Report NREL/TP-6A20-52409; NREL: Golden, CO, USA, 2012; Volume 1. [Google Scholar]
- Williams, J.H.; Haley, B.; Kahrl, F.; Moore, J.; Jones, A.D.; Torn, M.S.; McJeon, H. Pathways to deep decarbonization in the United States. In The U.S. Report of the Deep Decarbonization Pathways Project of the Sustainable Development Solutions Network and the Institute for Sustainable Development and International Relations; Sustainable Development Solution Network: Paris, France, 2015. [Google Scholar]
- Haley, B.; Jones, R.; Kwok, G.; Hargreaves, J.; Farbes, J.; Williams, J.H. 350 PPM Pathways for the United States; DDPP: Paris, France, 2019; p. 162. Available online: https://docs.wixstatic.com/ugd/294abc_95dfdf602afe4e11a184ee65ba565e60.pdf (accessed on 7 February 2022).
- Larson, E.; Greig, C.; Jenkins, J.; Mayfield, E.; Pascale, A.; Zhang, C.; Drossman, J.; Williams, R.; Pacala, S.; Socolow, R.; et al. Net-Zero America: Potential Pathways, Infrastructure, and Impacts Report; Princeton University: Princeton, NJ, USA, 2020; Available online: https://netzeroamerica.princeton.edu/?explorer=year&state=national&table=2020&limit=200 (accessed on 8 February 2022).
- National Conference of State Legislatures State Renewable Portfolio Standards and Goals. Available online: https://www.ncsl.org/research/energy/renewable-portfolio-standards.aspx (accessed on 8 February 2022).
- Way, R.; Ives, M.; Mealy, P.; Farmer, J.D. Empirically Grounded Technology Forecasts and the Energy Transition; Institute for New Economic Thinking, University of Oxford: Oxford, UK, 2021; p. 23. Available online: https://www.inet.ox.ac.uk/files/energy_transition_paper-INET-working-paper.pdf (accessed on 8 February 2022).
- McDonald, R.I.; Fargione, J.; Kiesecker, J.; Miller, W.M.; Powell, J. Energy sprawl or energy efficiency: Climate policy impacts on natural habitat for the United States of America. PLoS ONE 2009, 4, e6802. [Google Scholar] [CrossRef] [PubMed] [Green Version]
- Arnett, E.B.; Inkley, D.B.; Johnson, D.H.; Larkin, R.P.; Manes, S.; Manville, A.M.; Mason, J.R.; Morrison, M.L.; Strickland, M.D.; Thresher, R. Impacts of wind energy facilities on wildlife and wildlife habitat. In Wildlife Society Technical Review 07-2; Wildlife Society: Bethesda, MD, USA, 2007. [Google Scholar]
- Allison, T.D.; Diffendorfer, J.E.; Baerwald, E.F.; Beston, J.A.; Drake, D.; Hale, A.M.; Hein, C.D.; Huso, M.M.; Loss, S.R.; Lovich, J.E.; et al. Impacts To wildlife of wind energy siting and operation in the United States. Issues Ecol. 2019, 21, 2–18. [Google Scholar]
- Smallwood, K.S. Comparing bird and bat fatality-rate estimates among North American wind-energy projects. Wildl. Soc. Bull. 2013, 37, 19–33. [Google Scholar] [CrossRef]
- Erickson, W.P.; Wolfe, M.M.; Bay, K.J.; Johnson, D.H.; Gehring, J.L. A comprehensive analysis of small-passerine fatalities from collision with turbines at wind energy facilities. PLoS ONE 2014, 9, e107491. [Google Scholar] [CrossRef]
- Johnson, D.H.; Loss, S.R.; Shawn Smallwood, K.; Erickson, W.P. Avian fatalities at wind energy facilities in North America: A comparison of recent approaches. Hum.-Wildl. Interact. 2016, 10, 7–18. [Google Scholar]
- Loss, S.R.; Will, T.; Marra, P.P. Direct mortality of birds from anthropogenic causes. Annu. Rev. Ecol. Evol. Syst. 2015, 46, 99–120. [Google Scholar] [CrossRef] [Green Version]
- Pagel, J.E.; Kritz, K.J.; Millsap, B.A.; Murphy, R.K.; Kershner, E.L.; Covington, S. Bald eagle and golden eagle mortalities at wind energy facilities in the contiguous United States. J. Raptor Res. 2013, 47, 311–315. [Google Scholar] [CrossRef]
- Frick, W.F.; Baerwald, E.F.; Pollock, J.F.; Barclay, R.M.R.; Szymanski, J.A.; Weller, T.J.; Russell, A.L.; Loeb, S.C.; Medellin, R.A.; McGuire, L.P. Fatalities at wind turbines may threaten population viability of a migratory bat. Biol. Conserv. 2017, 209, 172–177. [Google Scholar] [CrossRef]
- Obermeyer, B.; Manes, R.; Kiesecker, J.; Fargione, J.; Sochi, K. Development by design: Mitigating wind development’s impacts on wildlife in Kansas. PLoS ONE 2011, 6, e26698. [Google Scholar] [CrossRef] [Green Version]
- Shaffer, J.A.; Buhl, D.A. Effects of wind-energy facilities on breeding grassland bird distributions. Conserv. Biol. 2016, 30, 59–71. [Google Scholar] [CrossRef]
- Shaffer, J.A.; Loesch, C.R.; Buhl, D.A. Estimating offsets for avian displacement effects of anthropogenic impacts. Ecol. Appl. 2019, 29, 1–15. [Google Scholar] [CrossRef] [PubMed]
- Rosenberg, K.V.; Dokter, A.M.; Blancher, P.J.; Sauer, J.R.; Smith, A.C.; Smith, P.A.; Stanton, J.C.; Panjabi, A.; Helft, L.; Parr, M.; et al. Decline of the North American avifauna. Science 2019, 366, 120–124. [Google Scholar] [CrossRef]
- Loesch, C.R.; Walker, J.A.; Reynolds, R.E.; Gleason, J.S. Effect of wind energy development on breeding duck densities in the Prairie Pothole Region. J. Wildl. Manag. 2013, 77, 587–598. [Google Scholar] [CrossRef]
- Diffendorfer, J.E.; Dorning, M.A.; Keen, J.R.; Kramer, L.A.; Taylor, R.V. Geographic context affects the landscape change and fragmentation caused by wind energy facilities. PeerJ 2019, 2019, 1–23. [Google Scholar] [CrossRef] [PubMed]
- Kiesecker, J.M.; Evans, J.S.; Fargione, J.; Doherty, K.; Foresman, K.R.; Kunz, T.H.; Naugle, D.; Nibbelink, N.P.; Niemuth, N.D. Win-win for wind and wildlife: A vision to facilitate sustainable development. PLoS ONE 2011, 6, e17566. [Google Scholar] [CrossRef] [Green Version]
- Kiesecker, J.M.; Copeland, H.; Pocewicz, A.; McKenney, B. Development by design: Blending landscape-level planning with the mitigation hierarchy. Front. Ecol. Environ. 2010, 8, 261–266. [Google Scholar] [CrossRef]
- US Fish and Wildlife Service. Land-Based Wind Energy Guidelines; US Fish and Wildlife Service: Falls Church, VA, USA, 2012. [Google Scholar]
- Evans, J.S.; Kiesecker, J.M. Shale gas, wind and water: Assessing the potential cumulative impacts of energy development on ecosystem services within the Marcellus play. PLoS ONE 2014, 9, e89210. [Google Scholar] [CrossRef] [PubMed]
- Fargione, J.; Kiesecker, J.; Slaats, M.J.; Olimb, S. Wind and wildlife in the Northern Great Plains: Identifying low-impact areas for wind development. PLoS ONE 2012, 7, e41468. [Google Scholar] [CrossRef] [Green Version]
- American Wind Energy Association. US Wind Industry Fourth Quarter 2018 Market Report; American Wind Energy Association: Washington, DC, USA, 2019. Available online: https://www.energy.gov/eere/wind/2018-wind-market-reports (accessed on 8 February 2022).
- US Fish and Wildlife Service Species Profile for Whooping Crane. Available online: https://ecos.fws.gov/ecp/species/758#:~:text=The%20whooping%20crane%20adult%20plumage,and%20a%20dark%20gray%2Dblack (accessed on 8 February 2022).
- Pearse, A.T.; Metzger, K.L.; Brandt, D.A.; Shaffer, J.A.; Bidwell, M.T.; Harrell, W.C. Migrating whooping cranes avoid wind-energy infrastructure when selecting stopover habitat. Ecol. Appl. 2021, 31, e02324. [Google Scholar] [CrossRef] [PubMed]
- US Fish and Wildlife Service. Whooping Cranes and Wind Development—An Issue Paper; US Fish and Wildlife Service: Falls Church, VA, USA, 2009. Available online: https://www.fws.gov/southwest/es/Documents/R2ES/Whooping%20Crane%20and%20Wind%20Development%20FWS%20issue%20paper%20-%20final%20%20April%202009.pdf (accessed on 8 February 2022).
- US Fish and Wildlife Service. Cooperative Whooping Crane Tracking Project GIS Database; US Fish and Wildlife Service: Grand Island, NB, USA, 2010. [Google Scholar]
- Austin, J.E.; Richert, A.L. A Comprehensive Review of Observational and Site Evaluation Data of Migrant Whooping Cranes in the United States, 1943–1999; USGS: Jamestown, ND, USA, 2001. [Google Scholar] [CrossRef]
- Belaire, J.A.; Kreakie, B.J.; Keitt, T.; Minor, E. Predicting and mapping potential whooping crane stopover habitat to guide site selection for wind energy projects. Conserv. Biol. 2014, 28, 541–550. [Google Scholar] [CrossRef] [PubMed]
- ESRI. US and Canada Detailed Streets; ESRI: Redlands, CA, USA, 2010. [Google Scholar]
- US Census Bureau. Urban Areas National Shapefile (2010 Census); US Census Bureau: Suitland, MA, USA, 2016. Available online: https://www.census.gov (accessed on 8 February 2022).
- Pearse, A.T.; Brandt, D.A.; Harrell, W.C.; Metzger, K.L.; Baasch, D.M.; Hefley, T.J. Whooping Crane Stopover Site Use Intensity within the Great Plains; Open-File Rep. 2015-1166; US Geological Survey: Reston, VA, USA, 2015; 12p. [Google Scholar] [CrossRef] [Green Version]
- US Fish and Wildlife Service. National Wetlands Inventory Version 2; US Fish and Wildlife Service: Falls Church, VA, USA, 2016. Available online: http://www.fws.gov/wetlands (accessed on 8 February 2022).
- Playa Lakes Joint Venture Playa Lakes Decision Support System. Available online: https://pljv.org/ (accessed on 3 July 2018).
- Homer, C.; Dewitz, J.; Yang, L.; Jin, S.; Danielson, P.; Xian, G.; Coulston, J.; Herold, N.; Wickham, J.; Megown, K. Completion of the 2011 national land cover database for the conterminous United States—Representing a decade of land cover change information. Photogramm. Eng. Remote Sens. 2015, 81, 345–354. [Google Scholar] [CrossRef]
- US Fish and Wildlife Service. Threatened & Endangered Species Critical Habitat Polygons Shapefile; US Fish and Wildlife Service: Falls Church, VA, USA, 2018. Available online: https://ecos.fws.gov (accessed on 7 February 2022).
- The Nebraska Wind and Wildlife Working Group. Guidelines for Avoiding, Minimizing, and Mitigating Impacts of Wind Energy on Biodiversity in Nebraska; The Nebraska Wind and Wildlife Working Group: Lincoln, NE, USA, 2016; Available online: https://wind-energy-wildlife.unl.edu/ (accessed on 7 February 2022).
- Stewart, G.B.; Pullin, A.S.; Coles, C.F. Poor evidence-base for assessment of windfarm impacts on birds. Environ. Conserv. 2007, 34, 1–11. [Google Scholar] [CrossRef] [Green Version]
- Smallwood, K.S.; Thelander, C. Bird mortality in the Altamont Pass wind resource area, California. J. Wildl. Manag. 2008, 72, 215–223. [Google Scholar] [CrossRef]
- Watson, R.T.; Kolar, P.S.; Ferrer, M.; Nygård, T.; Johnston, N.; Hunt, W.G.; Smit-Robinson, H.A.; Farmer, C.J.; Huso, M.; Katzner, T.E. Raptor interactions with wind energy: Case studies from around the world. J. Raptor Res. 2018, 52, 1–18. [Google Scholar] [CrossRef] [Green Version]
- Bedrosian, G.; Carlisle, J.D.; Wallace, Z.P.; Bedrosian, B.; LaPlante, D.W.; Woodbridge, B.; Dunk, J.R. Spatially Explicit Landscape-Scale Risk Assessments for Breeding and Wintering Golden Eagles in the Western United States; US Fish and Wildlife Service report; US Fish and Wildlife Service: Falls Church, VA, USA, 2018. [Google Scholar]
- US Fish and Wildlife Service. Southeastern States Bald Eagle Recovery Plan; US Fish and Wildlife Service: Falls Church, VA, USA, 1989. Available online: http://ecos.fws.gov (accessed on 7 February 2022).
- The Nature Conservancy Oklahoma Chapter Geographic Information System Database; The Nature Conservancy: Tulsa, OK, USA, 2021.
- Colorado Parks and Wildlife. Cooperative Raptor Database; Colorado Parks and Wildlife: Fort Collins, CO, USA, 2013. [Google Scholar]
- Wyoming Game and Fish Department. Occupied Peregrine Falcon Habitat; Wyoming Game and Fish Department: Cheyenne, WY, USA, 2004. [Google Scholar]
- Colorado Parks and Wildlife. Peregrine Falcon Nesting Areas; Colorado Parks and Wildlife: Fort Collins, CO, USA, 2015. [Google Scholar]
- Montana Natural Heritage Program. Species Occurrence Data for Raptors; Montana Natural Heritage Program: Helena, MT, USA, 2018. [Google Scholar]
- Wyoming Game and Fish Department. White-Tailed Prairie Dog Towns; Wyoming Game and Fish Department: Cheyenne, WY, USA, 2006. [Google Scholar]
- Colorado Parks and Wildlife. SPICE Habitat Model for Black-Tailed Prairie Dog; Colorado Parks and Wildlife: Fort Collins, CO, USA, 2009. [Google Scholar]
- Montana Natural Heritage Program. Species Occurrence Data for White-Tailed Prairie Dog and Black-Tailed Prairie Dog; Montana Natural Heritage Program: Helena, MN, USA, 2018. [Google Scholar]
- Texas Natural Diversity Database. Prairie Dog Town Element Occurrence Data Export; Texas Natural Diversity Database: Austin, TX, USA, 2021. [Google Scholar]
- Vodehnal, W.L.; Haufler, J.B. A Grassland Conservation Plan for Prairie Grouse; North American Grouse Partnership: Fruita, CO, USA, 2007. [Google Scholar]
- Pruett, C.L.; Patten, M.A.; Wolfe, D.H. Avoidance behavior by prairie grouse: Implications for development of wind energy. Conserv. Biol. 2009, 23, 1253–1259. [Google Scholar] [CrossRef]
- Val Pelt, W.E.; Kyle, S.; Pitman, J.; Klute, D.; Beauprez, G.; Schoeling, D.; Janus, A.; Haufler, J. The Lesser Prairie-Chicken Range-Wide Conservation Plan; Western Association of Fish and Wildlife Agencies: Cheyenne, WY, USA, 2013. [Google Scholar]
- Hovick, T.J.; Elmore, R.D.; Dahlgren, D.K.; Fuhlendorf, S.D.; Engle, D.M. Evidence of negative effects of anthropogenic structures on wildlife: A review of grouse survival and behaviour. J. Appl. Ecol. 2014, 51, 1680–1689. [Google Scholar] [CrossRef]
- Winder, V.L.; Gregory, A.J.; McNew, L.B.; Sandercock, B.K. Responses of male greater prairie-chickens to wind energy development. Condor 2015, 117, 284–296. [Google Scholar] [CrossRef] [Green Version]
- Lebeau, C.W.; Beck, J.L.; Johnson, G.D.; Nielson, R.M.; Holloran, M.J.; Gerow, K.G.; McDonald, T.L. Greater sage-grouse male lek counts relative to a wind energy development. Wildl. Soc. Bull. 2017, 41, 17–26. [Google Scholar] [CrossRef]
- Texas Natural Diversity Database. Attwater’s Prairie-Chicken Element Occurrence Data Export; Texas Parks & Wildlife: Austin, TX, USA, 2021. [Google Scholar]
- The Nature Conservancy. Conservation Action Plan for the Refugio-Goliad Prairie Conservation Area; The Nature Conservancy: Austin, TX, USA, 2009. [Google Scholar]
- Colorado Parks and Wildlife. Columbian Sharp-Tailed Grouse Production Areas and Winter Range; Colorado Parks and Wildlife: Fort Collins, CO, USA, 2015. [Google Scholar]
- Wyoming Game and Fish Department Columbian Sharp-Tailed Grouse Leks; Wyoming Game and Fish Department: Cheyenne, WY, USA, 2016.
- Runia, T.J.; Solem, A.J.; Niemuth, N.D.; Barnes, K.W. Spatially explicit habitat models for prairie grouse: Implications for improved population monitoring and targeted conservation. Wildl. Soc. Bull. 2021, 45, 35–54. [Google Scholar] [CrossRef]
- Runia, T.J.; Independent Researcher, Pierre, SD, USA. From Travis Runia of South Dakota Game, Fish, and Parks Regarding Greater Prairie Chicken and Sharp-Tailed Grouse Priority Areas in South Dakota. Personal communication, 10 September 2021. [Google Scholar]
- Colorado Parks and Wildlife. Greater Prairie Chicken Production Areas; Colorado Parks and Wildlife: Fort Collins, CO, USA, 2015. [Google Scholar]
- Missouri Department of Conservation. Missouri State Wildlife Action Plan; Missouri Department of Conservation: Jefferson City, MO, USA, 2015. Available online: https://mdc.mo.gov/sites/default/files/2020-04/SWAP.pdf (accessed on 8 February 2022).
- Minnesota Department of Natural Resources. Greater Prairie Chicken and Sharp-Tailed Grouse Priority Habitat; Minnesota Department of Natural Resources: Aitkin, MN, USA, 2021. [Google Scholar]
- Bureau of Land Management. BLM GRSG Western US Biologically Significant Units Maps Service. 2018. Available online: https://landscape.blm.gov (accessed on 8 February 2022).
- Wyoming Game and Fish Department. Sage Grouse Core and Connectivity Areas Version 4. 2015. Available online: https://wgfd.wyo.gov/Habitat/Sage-Grouse-Management/Sage-Grouse-Data (accessed on 8 February 2022).
- Montana Fish Wildlife and Parks. Sage-Grouse Core Areas. 2016. Available online: http://gis-mtfwp.opendata.arcgis.com (accessed on 8 February 2022).
- Wyoming Game and Fish Department. Greater Sage-Grouse Leks (Occupied); Wyoming Game and Fish Department: Cheyenne, WY, USA, 2017. [Google Scholar]
- Colorado Parks and Wildlife. Gunnison Sage-Grouse Production Areas, Brood Areas, Winter Range, and Severe Winter Range; Colorado Parks and Wildlife: Fort Collins, CO, USA, 2011. [Google Scholar]
- US Fish and Wildlife Service. Species Status Assessment Report for the Lesser Prairie-Chicken (Tympanuchus pallidicinctus). 2021. Available online: https://www.fws.gov/southwest/es/documents/R2ES/LEPC_SSA_Report_v2.2.pdf (accessed on 8 February 2022).
- Southern Great Plains Crucial Habitat Assessment Tool. 2021. Available online: https://www.sgpchat.org/ (accessed on 8 February 2022).
- Colorado Parks and Wildlife. Plains Sharp-Tailed Grouse Production Areas; Colorado Parks and Wildlife: Fort Collins, CO, USA, 2015. [Google Scholar]
- Wyoming Game and Fish Department. Plains Sharp-Tailed Grouse Leks; Wyoming Game and Fish Department: Cheyenne, WY, USA, 2017. [Google Scholar]
- Erickson, W.; Johnson, G.; Young, D.; Strickland, D.; Good, R.; Bourassa, M.; Bay, K.; Sernka, K. Synthesis and Comparison of Baseline Avian and Bat Use, Raptor Nesting and Mortality Information from Proposed and Existing Wind Developments; Western EcoSystems Technology, Inc.: Cheyenne, WY, USA, 2002. [Google Scholar]
- US Fish and Wildlife Service. Interim Guidelines to Avoid and Minimize Wildlife Impacts from Wind Turbines. 2003. Available online: http://www.fws.gov/habitatconservation/wind.pdf (accessed on 8 February 2022).
- Arnett, E.; Baerwald, E.F. Impacts of wind energy development on bats: Implications for conservation. In Bat Evolution, Ecology, and Conservation; Springer Science & Business Media: New York, NY, USA, 2013; pp. 435–456. [Google Scholar]
- American Wind Wildlife Institute (AWWI). A Summary of Bat Fatality Data in a Nationwide Database. 2018. Available online: https://rewi.org/wp-content/uploads/2019/02/AWWI-Bat-Technical-Report_07_25_18_FINAL.pdf (accessed on 8 February 2022).
- Kunz, T.H.; Fenton, M.B. Bat Ecology; University of Chicago Press: Chicago, IL, USA, 2003. [Google Scholar]
- Kerlinger, P.; Curry, R.; Culp, L.; Jain, A.; Wilkerson, C.; Fischer, B.; Hasch, A. Post-Construction Avian Monitoring Study for the High Winds Wind Power Project, Solano County, California: Two Year Report; Curry and Kerlinger, LLC: McLean, VA, USA, 2006. [Google Scholar]
- Miller, A. Patterns of Avian and Bat Mortality at a Utility-Scaled Wind Farm on the Southern High Plains. Master’s Thesis, Texas Tech University, Lubbock, TX, USA, 2008. [Google Scholar]
- Piorkowski, M.D.; O’Connell, T.J. Spatial pattern of summer bat mortality from collisions with wind turbines in mixed-grass prairie. Am. Midl. Nat. 2010, 164, 260–269. [Google Scholar] [CrossRef]
- Caire, W.; Tyler, J.D.; Glass, B.P.; Mares, M.A. Mammals of Oklahoma; University of Oklahoma Press: Norman, OK, USA, 1989. [Google Scholar]
- Schmidly, D.J. The Mammals of Texas (Revised Edition); University of Texas Press: Austin, TX, USA, 2004. [Google Scholar]
- Caire, W.; Matlack, R.S.; Ganow, K.B. Population Size Estimations of Mexican Free-Tailed Bat, Tadarida Brasiliensis, at Important Maternity Roosts in Oklahoma; Oklahoma Department of Wildlife Conservation: Oklahoma City, OK, USA, 2013; Volume 00236. [Google Scholar]
- Best, T.L.; Geluso, K.N. Summer foraging range of Mexican free-tailed bats (Tadarida brasiliensis mexicana) from Carlsbad Cavern, New Mexico. Southwest. Nat. 2003, 48, 590–596. [Google Scholar] [CrossRef]
- Texas Speleological Survey. Known Bat Caves in Texas (Generalized to USGS Quadrangle); Texas Speleological Survey: Austin, TX, USA, 2018. [Google Scholar]
- US Fish and Wildlife Service. Midwest Wind Energy Multi-Species Habitat Conservation Plan (Public Review Draft). 2016. Available online: http://www.midwestwindhcp.com/ (accessed on 8 February 2022).
- Kansas State University. Habitat Model for Gray Myotis (Myotis Grisescens). 2002. Available online: http://www.k-state.edu/kansasgap/KS-GAPPhase1/finalreport/SppModels/Mammals/Gray_Myotis.pdf (accessed on 8 February 2022).
- The Nature Conservancy. Ozarks Ecoregional Conservation Assessment; The Nature Conservancy: Minneapolis, MN, USA, 2003. [Google Scholar]
- Graening, G.O.; Harvey, M.J.; Puckette, W.L.; Stark, R.C.; Sasse, D.B.; Hensley, S.L.; Redman, R.K. Conservation status of the endangered Ozark big-eared bat (Corynorhinus Townsendii Ingens)—A 34-Year assessment. Publ. Okla. Biol. Surv. 2011, 11, 1–16. [Google Scholar]
- Indiana Natural Heritage Inventory Data Center. Indiana Natural Heritage Database Element Occurrence Records; Indiana Natural Heritage Inventory Data Center: Indianapolis, IN, USA, 2014. [Google Scholar]
- Kansas Biological Survey. Kansas Natural Resource Planner Occurrence Records for Bat Caves; Kansas Biological Survey: Lawrence, KS, USA, 2015; Available online: http://kars.ku.edu/maps/naturalresourceplanner/ (accessed on 8 February 2020).
- Colorado Natural Heritage Program. Level 3 Element Occurrence Records; Colorado Natural Heritage Program: Fort Collins, CO, USA, 2017. [Google Scholar]
- Montana Natural Heritage Program. Species Occurrence Data for Bats; Montana Natural Heritage Program: Helena, MT, USA, 2018. [Google Scholar]
- Minnesota Department of Natural Resources and US Fish and Wildlife Service. Townships Containing Documented Northern Long-eared Bat Maternity Roost Trees and/or Hibernacula Entrances in Minnesota. 2021. Available online: https://files.dnr.state.mn.us/eco/ereview/minnesota_nleb_township_list_and_map.pdf (accessed on 8 February 2022).
- Cole, J.; Independent Researcher, Jefferson City, MO, USA. Notes from a 7 March 2018 Meeting with US Fish and Wildlife Service Staff (Karen Herrington, Shauna Marquardt, and Jane Ledwin) at the Ecological Services Field Office in Columbia, Missouri. Personal communication, 2018. [Google Scholar]
- The Nature Conservancy and National Audubon Society. Wind Power Development Sensitive Areas in Indiana; The Nature Conservancy: Indianapolis, IN, USA, 2010. [Google Scholar]
- Hötker, H.; Thomsen, K.-M.; Jeromin, H. Impacts on Biodiversity of Exploitation of Renewable Energy Sources: The Example of Birds and Bats—Facts, Gaps in Knowledge, Demands for Further Research, and Ornithological Guidelines for the Development of Renewable Energy Exploitation; Books on Demand: Bergenhusen, Germany, 2006. Available online: https://tethys.pnnl.gov/sites/default/files/publications/Hotker_et_al_Renewable_Energy_on_Biodiversity.pdf (accessed on 8 February 2022).
- Lange, C.J.; Ballard, B.M.; Collins, D.P. Impacts of wind turbines on redheads in the Laguna Madre. J. Wildl. Manag. 2018, 82, 531–537. [Google Scholar] [CrossRef]
- Zhao, S.; Xu, H.; Song, N.; Wang, Z.; Li, B.; Wang, T. Effect of wind farms on wintering ducks at an important wintering ground in China along the East Asian–Australasian Flyway. Ecol. Evol. 2020, 10, 9567–9580. [Google Scholar] [CrossRef]
- US Fish and Wildlife Service. Wetland Duck Pair Density for the Prairie Pothole Region; US Fish and Wildlife Service: Bismark, ND, USA, 2021. Available online: https://data.doi.gov/dataset/upland-accessibility-by-breeding-duck-pairs-in-the-prairie-pothole-joint-venture-area (accessed on 8 February 2020).
- Straub, J.N.; Palumbo, M.; Fleener, J.; Glenzinski, B.; Fowler, D.; Kidd, G.; Waterstradt, K.; Hygnstrom, S. Wisconsin Waterfowl Habitat Conservation Strategy. Project #W-160-P-36; Final Report Submitted to the Wisconsin Department of Natural Resources. 2020. Available online: http://umgljv.org/docs/Wisconsin-Plan-2020.pdf (accessed on 8 February 2022).
- Iowa Department of Natural Resources. Bird Conservation Areas in Iowa. 2017. Available online: https://geodata.iowa.gov (accessed on 8 February 2022).
- National Audubon Society Important Bird Areas. Available online: https://www.audubon.org/important-bird-areas (accessed on 7 July 2018).
- Ewert, D.N. Great Lakes Bird Ecoregional Planning: A Final Report to the Nature Conservancy; Michigan Chapter, The Nature Conservancy: East Lansing, MI, USA, 1999. [Google Scholar]
- Wilcove, D.S.; Rothstein, D.; Dubow, J.; Phillips, A.; Losos, E. Quantifying threats to imperiled species in the United States. Bioscience 1998, 48, 607–615. [Google Scholar] [CrossRef] [Green Version]
- Masters, R.E.; Skeen, J.E.; Garner, J.A. Red-cockaded woodpecker in Oklahoma: An update of Wood’s 1974-77 study. Proc. Okla. Acad. Sci. 1989, 69, 27–31. [Google Scholar]
- Laurencio, L.R.; Fitzgerald, L.A. Atlas of Distribution and Habitat of the Dunes Sagebrush Lizard (Sceloporus arenicolus) in New Mexico; Texas Cooperative Wildlife Collection, Department of Wildlife and Fisheries Sciences, Texas A&M University: College Station, TX, USA, 2010; Available online: http://www.bison-m.org/documents/25024_LaurencioandFitzgerald2010.pdf (accessed on 8 February 2022).
- Colorado Parks and Wildlife. Preble’s Meadow Jumping Mouse Occupied Range; Colorado Parks and Wildlife: Fort Collins, CO, USA, 2011; Available online: https://databasin.org/datasets/06102779385e4d39adc1fe56695397c1/ (accessed on 8 February 2020).
- Kansas Biological Survey. Kansas Natural Resource Planner Occurrence Records for Threatened and Endangered Species; Kansas Biological Survey: Lawrence, KS, USA, 2015; Available online: http://kars.ku.edu/maps/naturalresourceplanner/ (accessed on 8 February 2022).
- Oklahoma Department of Wildlife Conservation Oklahoma’s Threatened and Endangered Species. Available online: https://www.wildlifedepartment.com/wildlife-diversity/threatened-and-endangered (accessed on 8 February 2022).
- Diamond, D. Range-Wide Modeling of Golden-Cheeked Warbler Habitat (Classes 2 and 3); Texas Parks and Wildlife Department: Austin, TX, USA, 2007. Available online: https://tpwd.texas.gov/business/grants/wildlife/section-6/docs/birds/e72_final_report.pdf (accessed on 8 February 2022).
- Colorado Parks and Wildlife. Least Tern Foraging and Production Areas; Colorado Parks and Wildlife: Fort Collins, CO, USA, 2015. [Google Scholar]
- US Fish and Wildlife Service. American Burying Beetle Conservation Priority Areas Shapefile and Metadata. 2014. Available online: https://www.fws.gov/southwest/es/oklahoma/abb_add_info.htm (accessed on 8 February 2022).
- Montana Natural Heritage Program. Occurrence Data for Terrestrial Threatened and Endangered Species; Montana Natural Heritage Program: Helena, MT, USA, 2018; Available online: https://mtnhp.org/ (accessed on 8 February 2020).
- Texas Natural Diversity Database. Element Occurrence Data Exports for Terrestrial USESA-Listed Species; Texas Natural Diversity Database: Austin, TX, USA, 2021. Available online: https://tpwd.texas.gov/huntwild/wild/wildlife_diversity/txndd/ (accessed on 8 February 2020).
- US Fish and Wildlife Service. Endangered and threatened wildlife and plants; lesser prairie-chicken; threatened status with section 4(d) rule for the northern distinct population segment and endangered status for the southern distinct population segment. Fed. Regist. 2021, 86, 29432–29482. [Google Scholar]
- Sawyer, H.; Nielson, R.M.; Lindzey, F.; McDonald, L.L. Winter habitat selection of mule deer before and during development of a natural gas field. J. Wildl. Manag. 2006, 70, 396–403. [Google Scholar] [CrossRef]
- Sawyer, H.; Kauffman, M.J.; Nielson, R.M. Influence of Well Pad Activity on Winter Habitat Selection Patterns of Mule Deer. J. Wildl. Manag. 2009, 73, 1052–1061. [Google Scholar] [CrossRef]
- Wyoming Game and Fish Department. Recommendations for Development of Oil and Gas Resources within Important Wildlife Habitats; Wyoming Game and Fish Department: Cheyenne, WY, USA, 2010. Available online: https://www.nrc.gov/docs/ML1108/ML110810642.pdf (accessed on 8 February 2022).
- Vore, J. Big Game Winter Range Recommendations for Subdivision Development in Montana: Justification and Rationale. 2012. Available online: https://fwp.mt.gov/binaries/content/assets/fwp/conservation/subdivisions-and-big-game-winter-range.final.pdf (accessed on 8 February 2022).
- Taylor, K.L.; Beck, J.L.; Huzurbazar, S.V. Factors influencing winter mortality risk for pronghorn exposed to wind energy development. Rangel. Ecol. Manag. 2016, 69, 108–116. [Google Scholar] [CrossRef]
- Montana Fish Wildlife and Parks. Big Game Winter Range Habitat. 2010. Available online: https://databasin.org/datasets/0eca4ea8f9b34555870599b815946d6e/ (accessed on 8 February 2022).
- Wyoming Game and Fish Department. Mule Deer and Pronghorn Crucial Winter Ranges; Wyoming Game and Fish Department: Cheyenne, WY, USA, 2011. Available online: https://wgfd.wyo.gov/Wildlife-in-Wyoming/Geospatial-Data/Big-Game-GIS-Data (accessed on 8 February 2020).
- Colorado Parks and Wildlife. Mule Deer and Pronghorn Severe Winter Ranges; Colorado Parks and Wildlife: Fort Collins, CO, USA, 2015; Available online: https://hub.arcgis.com/maps/9a845acae8f34d718caf9fd9a0e5e177/about (accessed on 8 February 2020).
- Western Electricity Coordinating Council WECC Environmental Data Viewer. Available online: https://www.wecc.org/SystemAdequacyPlanning/Pages/envrionmental-data-viewer.aspx (accessed on 8 February 2022).
- North Dakota Game and Fish Department. Wind Energy Development in North Dakota Best Management Practices. 2021. Available online: https://gf.nd.gov/sites/default/files/publications/wind-energy-development-bmp.pdf (accessed on 8 February 2022).
- Ewert, D.N.; Cole, J.B.; Grmam, E. Wind Energy: Great Lakes Regional Guidelines. A Report to The Nature Conservancy; The Nature Conservancy: East Lansing, MI, USA, 2011; Available online: https://www.conservationgateway.org/ConservationByGeography/NorthAmerica/UnitedStates/michigan/Documents/Ewert_WindEnergy2011.pdf (accessed on 8 February 2022).
- Grodsky, S.M.; Jennelle, C.S.; Drake, D. Bird mortality at a wind-energy facility near a wetland of international importance. Condor 2013, 115, 700–711. [Google Scholar] [CrossRef] [Green Version]
- Playa Lakes Joint Venture. Energy Development Siting Recommendations for Playas. 2017. Available online: http://pljv.org/documents/PLJV_Energy_Development_Siting_Recommendations_Playas.pdf (accessed on 8 February 2022).
- Minnesota Department of Natural Resources. Wild, Scenic, and Recreational Rivers. 2018. Available online: https://gisdata.mn.gov/dataset/water-wild-and-scenic-rec-rivers (accessed on 8 February 2022).
- Ramsar Convention on Wetlands of International Importance. Ramsar Sites Information Service. Available online: https://rsis.ramsar.org (accessed on 8 February 2022).
- Western Hemisphere Shorebird Reserve Network WHSRN Sites. Available online: http://www.whsrn.org (accessed on 8 February 2022).
- US Geological Survey. Protected Areas Database of the United States Version 1.4. 2016. Available online: https://www.usgs.gov/core-science-systems/science-analytics-and-synthesis/gap (accessed on 8 February 2022).
- Muldavin, E.; Milford, E.; Leonard, J.; Triepke, J.; Elliot, L.; Hanberry, P.; Diamond, D.; Reasner, C.; Chauvin, Y.; Urbanovsky, A.; et al. New Mexico Riparian Habitat Map; New Mexico’s Conservation Information and Research Center: Albuquerque, NM, USA, 2020; Available online: https://nhnm.unm.edu/riparian/nmripmap (accessed on 8 February 2022).
- Battelle Memorial Institute. Great Lakes Coastal Wetlands; Battelle Memorial Institute: Columbus, OH, USA, 2017. [Google Scholar]
- Montana Natural Heritage Program. Wetlands of Special Significance; Montana Natural Heritage Program: Helena, MT, USA, 2016; Available online: https://mtnhp.org/nwi/ (accessed on 8 February 2020).
- Montana Natural Heritage Program. Species Occurrence Data for Trumpter Swan; Montana Natural Heritage Program: Helena, MT, USA, 2018. Available online: https://fieldguide.mt.gov/speciesDetail.aspx?elcode=ABNJB02030 (accessed on 8 February 2020).
- Argonne National Laboratory. West-Wide Wind Mapping Project: BLM-Administered Lands Excluded from Wind Energy Development. 2016. Available online: https://wwmp.anl.gov/ (accessed on 8 February 2022).
- Comer, P.J.; Hak, J.; Kindscher, K.; Muldavin, E. Continent-scale landscape conservation design for temperate grasslands of the Great Plains and Chihuahuan Desert. Nat. Areas J. 2018, 38, 196–211. [Google Scholar] [CrossRef]
- Theobald, D.M. A general model to quantify ecological integrity for landscape assessments and US application. Landsc. Ecol. 2013, 28, 1859–1874. [Google Scholar] [CrossRef]
- Arkansas Oil & Gas Commission. Arkansas Oil and Gas Wells. 2014. Available online: http://www.aogc.state.ar.us/data/default.aspx (accessed on 8 February 2020).
- FracTracker Alliance. US Oil and Gas Activity [for Illinois, Indiana, and Ohio]. 2016. Available online: https://www.fractracker.org (accessed on 8 February 2022).
- Colorado Oil & Gas Conservation Commission. Well Surface Locations. 2018. Available online: https://navigator.blm.gov/data?id=f5aa405f071d5d3eebac5bd50b90f4d1c10f94d4 (accessed on 8 February 2022).
- Kansas Geological Survey. Oil and Gas Wells Shapefile. 2018. Available online: http://www.kgs.ku.edu/PRS/petroDB.html (accessed on 8 February 2022).
- Missouri Department of Natural Resources. Oil and Gas Wells Tabular Data. 2018. Available online: https://dnr.mo.gov/geology/geosrv/oilandgas.htm (accessed on 8 February 2022).
- Montana Department of Natural Resources & Conservation. Oil and Gas Wells Shapefile. 2018. Available online: http://dnrc.mt.gov (accessed on 8 February 2022).
- Nebraska Oil and Gas Conservation Commission. Wells GIS Shapefile. 2018. Available online: http://www.nogcc.ne.gov/NOGCCPublications.aspx (accessed on 8 February 2022).
- New Mexico Energy Minerals and Natural Resources Department. Oil and Gas Shapefile. 2018. Available online: http://www.emnrd.state.nm.us/OCD/ocdgis.html (accessed on 8 February 2022).
- North Dakota Department of Mineral Resources. Wells Shapefile. 2018. Available online: https://www.dmr.nd.gov/oilgas/ (accessed on 8 February 2022).
- South Dakota Department of Environment and Natural Resources. Records of Oil and Gas Drilling. 2018. Available online: http://www.sdgs.usd.edu/SDOIL/oilgas_databases.aspx (accessed on 8 February 2022).
- Texas Railroad Commission. Oil and Gas Wells; Texas Railroad Commission: Austin, TX, USA, 2018. Available online: https://www.rrc.texas.gov/oil-and-gas/research-and-statistics/obtaining-commission-records/oil-and-gas-well-records/ (accessed on 8 February 2022).
- Wyoming Oil and Gas Conservation Commission. All Wells Tabular Data. 2018. Available online: http://pipeline.wyo.gov (accessed on 8 February 2022).
- Ostlie, W. Untilled Landscapes of the Great Plains; The Nature Conservancy: Minneapolis, MN, USA, 2003. [Google Scholar]
- The Conservation Fund. Midwest Wind Energy HCP Green Infrastructure Network; The Conservation Fund: Arlington, VA, USA, 2018. [Google Scholar]
- LANDFIRE project. Existing Vegetation Type. 2016. Available online: https://landfire.gov (accessed on 8 February 2022).
- Minnesota Prairie Plan Working Group. Minnesota Prairie Conservation Plan Core Areas, Corridors, Matirx Habitat Complexes, and Strategic Habitat Complexes; Minnesota Prairie Plan Working Group: St. Paul, MN, USA, 2017. [Google Scholar]
- Minnesota Department of Natural Resources. MBS Sites of Biodiversity Significance. 2015. Available online: https://files.dnr.state.mn.us/eco/mcbs/maps/areas_of_biodiversity_significance.pdf (accessed on 8 February 2022).
- Wisconsin Department of Natural Resources. Wisconsin Conservation Opportunity Areas. 2019. Available online: https://data-wi-dnr.opendata.arcgis.com/ (accessed on 8 February 2022).
- The Nature Conservancy. Ecoregional Conservation in the Osage Plains/Flint Hills Prairie; The Nature Conservancy: Minneapolis, MN, USA, 2000. [Google Scholar]
- Illinois Department of Natural Resources. Illinois Natural Areas Inventory Sites; Illinois Department of Natural Resources: Springfield, IL, USA, 2021. [Google Scholar]
- Colorado Natural Heritage Program. Level 3 Potential Conservation Areas; Colorado Natural Heritage Program: Fort Collins, CO, USA, 2017. [Google Scholar]
- Iowa Department of Natural Resources. Wind Farm Review Layer; Iowa Department of Natural Resources: Des Moines, IA, USA, 2018. [Google Scholar]
- The Nature Conservancy. Terrestrial Conservation Priority Areas; The Nature Conservancy: Arlington, VA, USA, 2013. [Google Scholar]
- Intergovernmental Panel on Climate Change Climate Change 2014: Impacts, Adaptation, and Vulnerability. Part A: Global and Sectoral Impacts. Contribution of Working Group II to the Fifth Assessment Report of the IPCC. 2014. Available online: https://www.ipcc.ch/report/ar5/wg2/ (accessed on 8 February 2022).
- Intergovernmental Science-Policy Platform on Biodiversity and Ecosystem Services and Intergovernmental Panel on Climate Change. IPBES-IPCC Co-Sponsored Workshop Report on Biodiversity and Climate Change. 2019. Available online: https://doi.org/10.5281/zenodo.4659158 (accessed on 8 February 2020).
- The Nature Conservancy. Resilient Land Mapping Tool. Available online: https://maps.tnc.org/resilientland/ (accessed on 8 February 2022).
- Anderson, M.G.; Clark, M.; Sheldon, A.O. Estimating climate resilience for conservation across geophysical settings. Conserv. Biol. 2014, 28, 959–970. [Google Scholar] [CrossRef]
- Anderson, M.G.; Ahlering, M.A.; Clark, M.M.; Hall, K.R.; Olivero Sheldon, A.; Platt, J.; Prince, J. Resilient Sites for Terrestrial Conservation in the Great Plains Region. A Report to The Nature Conservancy; The Nature Conservancy: Boston, MA, USA, 2018; Available online: https://easterndivision.s3.amazonaws.com/Terrestrial/Great_Lakes_Resilience/Great_Lakes_and_Tallgrass_Prairie_Resilience_05_11_18.pdf (accessed on 9 February 2022).
- Anderson, M.G.; Clark, M.; Olivero Sheldon, A.; Hall, K.R.; Platt, J.; Prince, J.; Ahlering, M.A.; Cornett, M. Resilient and Connected Landscapes for Terrestrial Conservation in the Central U.S. A Report to The Nature Conservancy; The Nature Conservancy: Boston, MA, USA, 2019. [Google Scholar]
- Bouffard, F.; Galiana, F.D. Stochastic security for operations planning with significant wind power generation. In Proceedings of the 2008 IEEE Power and Energy Society General Meeting-Conversion and Delivery of Electrical Energy in the 21st Century, Pittsburgh, PA, USA, 20–24 July 2008; Volume 23, pp. 306–316. [Google Scholar] [CrossRef]
- Veers, P.; Dykes, K.; Lantz, E.; Barth, S.; Bottasso, C.L.; Carlson, O.; Clifton, A.; Green, J.; Green, P.; Holttinen, H.; et al. Grand challenges in the science of wind energy. Science 2019, 366, eaau2027. [Google Scholar] [CrossRef] [PubMed] [Green Version]
- Lopez, A.; Roberts, B.; Heimiller, D.; Blair, N.; Porro, G. US Renewable Energy Technical Potentials: A GIS-Based Analysis. Technical Report NREL/TP-6A20-51946; National Renewable Energy Lab.: Golden, CO, USA, 2012. Available online: https://www.nrel.gov/docs/fy12osti/51946.pdf (accessed on 8 February 2022).
- Tegen, S.; Lantz, E.; Mai, T.; Heimiller, D.; Hand, M.; Ibanez, E. An Initial Evaluation of Siting Considerations on Current and Future Wind Deployment; Technical report NREL/TP-5000-61750; National Renewable Energy Lab.: Golden, CO, USA, 2016. Available online: https://www.nrel.gov/docs/fy16osti/61750.pdf (accessed on 8 February 2022).
- US Department of Energy. 20% Wind Energy by 2030: Increasing Wind Energy’s Contribution to US Electricity Supply. 2008. Available online: http://www.nrel.gov/docs/fy08osti/41869.pdf (accessed on 8 February 2022).
- Lantz, E.; Roberts, O.; Nunemaker, J.; Demeo, E.; Dykes, K.; Scott, G. Increasing Wind Turbine Tower Heights: Opportunities and Challenges; Technical report NREL/TP-5000-73629; Office of Energy Efficiency & Renewable Energy: Golden, CO, USA, 2019. Available online: https://www.energy.gov/eere/wind/downloads/increasing-wind-turbine-tower-heights-opportunities-and-challenges (accessed on 8 February 2020).
- US Department of Transportation. National Transportation Atlas Database Airport Runways. 2020. Available online: https://data-usdot.opendata.arcgis.com/datasets/usdot::runway-lines/about (accessed on 8 February 2022).
- Federal Aviation Administration Airspace, Special Use Airspace, and Temporary Flight Restrictions. Available online: https://www.faasafety.gov (accessed on 9 December 2015).
- Natural Resources Defense Council; US Department of Defense. Working with the Department of Defense: Siting Renewable Energy Development. 2013. Available online: https://www.nrdc.org/sites/default/files/nuc_13112001a.pdf (accessed on 8 February 2022).
- Federal Aviation Administration. US Special Use Airspace Shapefile. 2017. Available online: https://adds-faa.opendata.arcgis.com/ (accessed on 8 February 2022).
- Federal Aviation Administration. Visual Flight Reference Raster Charts for Albuquerque, Billings, Brownsville, Cheyenne, Chicago, Cincinnati, Dallas-Ft. Worth, Denver, Detroit, El Paso, Great Falls, Green Bay, Houston, Kansas City, Memphis, Omaha, Salt Lake City, San Antonio, St. Louis. 2017. Available online: https://www.faa.gov/air_traffic/flight_info/aeronav (accessed on 8 February 2022).
- Vogt, R.J.; Ciardi, E.J.; Guenther, R.G. New Criteria for Evaluating Wind Turbine Impacts on NEXRAD Weather Radars; Windpower: Norman, OK, USA, 2013. Available online: https://www.roc.noaa.gov/WSR88D/Publicdocs/WINDPOWER2011_Final.pdf (accessed on 8 February 2022).
- National Oceanic and Atmospheric Administration. Climate Data Online Radar Mapping Tool. 2021. Available online: https://www.ncei.noaa.gov/maps/radar/ (accessed on 8 February 2022).
- Federal Aviation Administration. DoD Preliminary Screening Tool. 2021. Available online: https://oeaaa.faa.gov/oeaaa/downloads/external/content/deskReferenceGuides/DoD%20Preliminary%20Screening%20Tool%20-%20Desk%20Reference%20Guide%20V_2018.2.0.pdf (accessed on 8 February 2022).
- Federal Aviation Administration. Digital Obstacle File. 2021. Available online: https://www.faa.gov/air_traffic_flight_info/digital_products/dof (accessed on 8 February 2022).
- US Geological Survey. National Elevation Dataset. 2017. Available online: http://ned.usgs.gov (accessed on 8 February 2022).
- AWS Truepower and National Renewable Energy Laboratory. Utility-Scale Land-Based 80m Wind Maps for the United States. Available online: http://apps2.eere.energy.gov/wind/windexchange/wind_maps.asp (accessed on 4 December 2013).
- Bailey, B.H.; McDonald, S.L.; Bernadett, D.W.; Markus, M.J.; Elsohlz, K.V. Wind Resource Assessment Handbook: Fundamentals for Conducting a Successful Monitoring Program; National Renewable Energy Lab.: Albany, NY, USA, 1997. Available online: http://www.nrel.gov/docs/legosti/fy97/22223.pdf (accessed on 8 February 2022).
- Tennis, M.W.; Clemmer, S.; Howland, J. Assessing Wind Resources: A Guide for Landowners, Project Developers, and Power Suppliers; Union of Concerned Scientists: Cambridge, MA, USA, 1999; Available online: https://www.ucsusa.org/sites/default/files/2019-09/wind_resource_assessment.pdf (accessed on 8 February 2022).
- Langreder, W. Wind resource and site assessment. In Wind Power Generation and Wind Turbine Design; Tong, W., Ed.; WIT Press: Billerica, MA, USA, 2010; pp. 49–87. [Google Scholar]
- Hau, E.; von Renouard, H. The wind resource. In Wind Turbines: Fundamentals, Technologies, Application, Economics; Springer Science & Business Media: Berlin/Heidelberg, Germany, 2013; pp. 505–548. [Google Scholar]
- White, T.; Kuba, J.; Thomas, J. Data driven generation siting for renewables integration in transmission planning. In Proceedings of the ESRI User Conference, San Diego, CA, USA, 14–18 July 2014. [Google Scholar]
- Oklahoma Legislature. Setback Requirements, Oklahoma Statutes Title 17; § 160.20; Oklahoma Legislature: Oklahoma City, OK, USA, 2015. [Google Scholar]
- Oklahoma State Department of Education. Oklahoma Public Schools 2014–2015 Shapefile. 2015. Available online: https://okmaps.org/ogi/search.aspx (accessed on 8 February 2022).
- US Geological Survey. 2017 Geographic Names Information System Text File for Oklahoma. 2017. Available online: http://viewer.nationalmap.gov (accessed on 8 February 2022).
- Rothschild, S. Flint Hills May Not Get Wind of Power Plan. Lawrence J. World 2005. 1b, 3b. Available online: https://www2.ljworld.com/news/2005/jan/15/flint_hills_may/ (accessed on 8 February 2022).
- Kansas Biological Survey. Kansas Natural Resource Planner Tallgrass Heartland Shapefile. 2015. Available online: https://www.arcgis.com/apps/webappviewer/index.html?id=bac24ffa26ba48d18ac9105b8b95e639 (accessed on 8 February 2022).
- Illinois General Assembly. Illinois General Assembly. Illinois Natural Areas Preservation Act. In Illinois Statutes 525 ILCS 30/1-26; Illinois General Assembly: Springfield, IL, USA, 2018. [Google Scholar]
- Prairie State Conservation Coalition. Illinois Protected Natural Lands (Illinois Nature Preserves Commission, Illinois Natural Areas Inventory, and Illinois Department of Natural Resources Properties); Prairie State Conservation Coalition: Springfield, MA, USA, 2015. [Google Scholar]
- Minnesota Department of Natural Resources. Minnesota Trails: Division of Parks & Trails. 2016. Available online: https://gisdata.mn.gov (accessed on 8 February 2022).
- Minnesota Department of Natural Resources. Guidance for Commercial Wind Energy Projects. 2018. Available online: https://tethys.pnnl.gov/publications/minnesota-department-natural-resources-guidance-commercial-wind-energy-projects (accessed on 8 February 2022).
- Denholm, P.; Jackson, M.; Ong, S.; Hand, M. Land-USE Requirements of Modern Wind Power Plants in the United States; Technical Report NREL/TP-6A2-45834; National Renewable Energy Lab.: Golden, CO, USA, 2009. Available online: https://www.nrel.gov/docs/fy09osti/45834.pdf (accessed on 8 February 2022).
- American Wind Energy Association. US Wind Industry Third Quarter 2019 Market Report; American Wind Energy Association: Washington, DC, USA, 2019; Available online: https://cleanpower.org/news/american-wind-power-posts-record-third-quarter-2/ (accessed on 8 February 2022).
- American Clean Power Institute. ACP Market Report Fourth Quarter 2020; American Clean Power Institute: Washington, DC, USA, 2020; Available online: https://cleanpower.org/resources/american-clean-power-market-report-q4-2020/ (accessed on 8 February 2020).
- US Geological Survey. National Hydrography Dataset. Available online: https://www.usgs.gov/national-hydrography (accessed on 8 February 2022).
- US Department of Energy. 2017 Wind Technologies Market Report. 2018. Available online: https://eta-publications.lbl.gov/publications/2017-wind-technologies-market-report (accessed on 8 February 2022).
- Oteri, F.; Baranowski, R.; Baring-gould, I.; Tegen, S. 2017 State of Wind Development in the United States by Region; Technical Report NREL/TP-5000-70738; National Renewable Energy Lab.: Golden, CO, USA, 2018. Available online: https://www.osti.gov/biblio/1433800-state-wind-development-united-states-region (accessed on 8 February 2022).
- Janke, A.K.; Anteau, M.J.; Stafford, J.D. Prairie wetlands confer consistent migrant refueling conditions across a gradient of agricultural land use intensities. Biol. Conserv. 2019, 229, 99–112. [Google Scholar] [CrossRef] [Green Version]
- Hayes, M.A.; Cryan, P.M.; Wunder, M.B. Seasonally-dynamic presence-only species distribution models for a cryptic migratory bat impacted by wind energy development. PLoS ONE 2015, 10, e0132599. [Google Scholar] [CrossRef] [Green Version]
- Arnett, E.B.; Johnson, G.D.; Erickson, W.P.; Hein, C.D. A Synthesis of Operational Mitigation Studies to Reduce Bat Fatalities at Wind Energy Facilities in North America. 2013. Available online: http://www.batsandwind.org (accessed on 8 February 2022).
- Arnett, E.B.; Baerwald, E.F.; Mathews, F.; Rodrigues, L.; Rodríguez-Durán, A.; Rydell, J.; Villegas-Patraca, R.; Voigt, C.C. Impacts of wind energy development on bats: A global perspective. In Bats in the Anthropocene: Conservation of Bats in a Changing World; Voigt, C.C., Kingston, T., Eds.; Springer International Publishing: Cham, Switzerland, 2015; pp. 295–323. [Google Scholar]
- Cryan, P.M.; Gorresen, P.M.; Hein, C.D.; Schirmacher, M.R.; Diehl, R.H.; Huso, M.M.; Hayman, D.T.S.; Fricker, P.D.; Bonaccorso, F.J.; Johnson, D.H.; et al. Behavior of bats at wind turbines. Proc. Natl. Acad. Sci. USA 2014, 111, 15126–15131. [Google Scholar] [CrossRef] [Green Version]
- Hayes, M.A.; Hooton, L.A.; Gilland, K.L.; Grandgent, C.; Smith, R.L.; Lindsay, S.R.; Collins, J.D.; Schumacher, S.M.; Rabie, P.A.; Gruver, J.C.; et al. A smart curtailment approach for reducing bat fatalities and curtailment time at wind energy facilities. Ecol. Appl. 2019, 29, 1–18. [Google Scholar] [CrossRef]
- Arnett, E.B.; Huso, M.M.P.; Schirmacher, M.R.; Hayes, J.P. Altering turbine speed reduces bat mortality at wind-energy facilities. Front. Ecol. Environ. 2011, 9, 209–214. [Google Scholar] [CrossRef] [Green Version]
- Martin, C.M.; Arnett, E.B.; Stevens, R.D.; Wallace, M.C. Reducing bat fatalities at wind facilities while improving the economic efficiency of operational mitigation. J. Mammal. 2017, 98, 378–385. [Google Scholar] [CrossRef]
- Arnett, E.B.; Hein, C.D.; Schirmacher, M.R.; Huso, M.M.P.; Szewczak, J.M. Evaluating the effectiveness of an ultrasonic acoustic deterrent for reducing bat fatalities at wind turbines. PLoS ONE 2013, 8, e065794. [Google Scholar] [CrossRef]
- Weller, T.J.; Castle, K.T.; Liechti, F.; Hein, C.D.; Schirmacher, M.R.; Cryan, P.M. First direct evidence of long-distance seasonal movements and hibernation in a migratory bat. Sci. Rep. 2016, 6, 1–7. [Google Scholar] [CrossRef] [PubMed] [Green Version]


| State | Suitable Land (ha) | Percent of Region | Capacity on Suitable Land (GW) | Low-Impact Suitable Land (ha) | Percent of Region | Capacity on Low-Impact Suitable Land (GW) |
|---|---|---|---|---|---|---|
| Texas | 15,945,276 | 23% | 478–797 | 4,271,796 | 6% | 128–214 |
| Iowa | 4,916,534 | 34% | 147–246 | 4,179,950 | 29% | 125–209 |
| Kansas | 7,583,374 | 36% | 228–379 | 3,961,889 | 19% | 119–198 |
| Nebraska | 7,868,623 | 39% | 236–393 | 2,202,613 | 11% | 66–110 |
| Minnesota | 3,503,389 | 16% | 105–175 | 2,178,075 | 10% | 65–109 |
| Montana | 8,059,881 | 21% | 242–403 | 2,117,624 | 6% | 64–106 |
| Illinois | 2,119,363 | 15% | 64–106 | 1,924,567 | 13% | 58–96 |
| Oklahoma | 3,595,162 | 20% | 108–180 | 1,652,421 | 9% | 50–83 |
| South Dakota | 6,878,777 | 34% | 206–344 | 1,646,761 | 8% | 49–82 |
| Indiana | 1,623,297 | 17% | 49–81 | 1,534,308 | 16% | 46–77 |
| Missouri | 2,318,808 | 13% | 70–116 | 1,413,602 | 8% | 42–71 |
| Colorado | 3,916,351 | 15% | 117–196 | 1,059,786 | 4% | 32–53 |
| N. Dakota | 6,071,688 | 33% | 182–304 | 950,010 | 5% | 29–48 |
| Wisconsin | 1,172,347 | 8% | 35–59 | 735,803 | 5% | 22–37 |
| Ohio | 544,898 | 5% | 16–27 | 434,145 | 4% | 13–22 |
| New Mexico | 5,075,241 | 16% | 152–254 | 420,152 | 1% | 13–21 |
| Wyoming | 8,392,647 | 33% | 252–420 | 178,785 | 1% | 5–9 |
| Michigan | 620,168 | 4% | 19–31 | 147,634 | 1% | 4–7 |
| Arkansas | 34,834 | 0% | 1–2 | 0 | 0% | 0–0 |
| combined area | 90,240,658 | 21% | 2707–4512 | 31,009,920 | 7% | 930–1550 |
| Description | Low-Impact Suitable Land (ha) | Capacity on Low-Impact Suitable Land (GW) | Percent Change |
|---|---|---|---|
| Alternate 1 (includes previously tilled areas [163]) | 27,279,925 | 818–1364 | −13.67% |
| Site Wind Right modeled | 31,009,920 | 930–1550 | - |
| Alternate 2 (excludes core wetland/forest [164]) | 31,069,695 | 932–1553 | +0.19% |
| Alternate 3 (reduced HM [150] selection threshold to 0.0625; excludes core wetland/forest [164]) | 31,744,143 | 952–1587 | +2.31% |
| Layer excluded | 38,279,562 | 1148–1914 | +18.99% |
| Description | Low-Impact Suitable Land (ha) | Capacity on Low-Impact Suitable Land (GW) | Percent Change |
|---|---|---|---|
| Alternate 1 (includes 1.6 km avoidance of all named rivers [214]) | 29,503,241 | 885–1475 | −5.11% |
| Site Wind Right modeled | 31,009,920 | 930–1550 | - |
| Alternate 2 (excludes playa clusters [38]) | 34,655,694 | 1040–1733 | +10.52% |
| Alternate 3 (excludes playa clusters [38]; reduced buffers of Ramsar Convention wetlands [141] and Western Hemisphere Shorebird Reserve Network sites [142] to 8 km) | 34,993,178 | 1050–1750 | +11.38% |
| Alternate 4 (excludes playa clusters [38] and important rivers [29,44,50,140]; reduced buffers of Ramsar Convention wetlands [141] and Western Hemisphere Shorebird Reserve Network sites [142] to 8 km) | 35,221,939 | 1057–1761 | +11.96% |
| Layer excluded | 36,013,609 | 1080–1801 | +13.89% |
| Description | Low-Impact Suitable Land (ha) | Capacity on Low-Impact Suitable Land (GW) | Percent Change |
|---|---|---|---|
| Alternate 1 (reduced Prairie Pothole region breeding ducks [110] threshold to 50 pairs) | 29,665,317 | 890–1483 | −4.53% |
| Site Wind Right modeled | 31,009,920 | 930–1550 | - |
| Layer excluded | 32,692,170 | 981–1635 | +5.15% |
| Description | Low-Impact Suitable Land (ha) | Capacity on Low-Impact Suitable Land (GW) | Percent Change |
|---|---|---|---|
| Alternate 1 (T. brasiliensis roost [50,95] buffers increased to 56 km) | 30,630,953 | 919–1532 | −1.24% |
| Site Wind Right modeled | 31,009,920 | 930–1550 | - |
| Alternate 2 (excludes generalized roost areas mapped by counties [105] and townships [104]) | 31,435,770 | 943–1572 | +1.35% |
| Layer excluded | 32,349,200 | 970–1617 | +4.14% |
| Description | Low-Impact Suitable Land (ha) | Capacity on Low-ImPact Suitable Land (GW) | Percent Change |
|---|---|---|---|
| Most conservative | 24,379,549 | 731–1219 | −27.20% |
| Site Wind Right modeled | 31,009,920 | 930–1550 | - |
| Least conservative | 36,428,816 | 1093–1821 | +14.88% |
Publisher’s Note: MDPI stays neutral with regard to jurisdictional claims in published maps and institutional affiliations. |
© 2022 by the authors. Licensee MDPI, Basel, Switzerland. This article is an open access article distributed under the terms and conditions of the Creative Commons Attribution (CC BY) license (https://creativecommons.org/licenses/by/4.0/).
Share and Cite
Hise, C.; Obermeyer, B.; Ahlering, M.; Wilkinson, J.; Fargione, J. Site Wind Right: Identifying Low-Impact Wind Development Areas in the Central United States. Land 2022, 11, 462. https://doi.org/10.3390/land11040462
Hise C, Obermeyer B, Ahlering M, Wilkinson J, Fargione J. Site Wind Right: Identifying Low-Impact Wind Development Areas in the Central United States. Land. 2022; 11(4):462. https://doi.org/10.3390/land11040462
Chicago/Turabian StyleHise, Chris, Brian Obermeyer, Marissa Ahlering, Jessica Wilkinson, and Joseph Fargione. 2022. "Site Wind Right: Identifying Low-Impact Wind Development Areas in the Central United States" Land 11, no. 4: 462. https://doi.org/10.3390/land11040462
APA StyleHise, C., Obermeyer, B., Ahlering, M., Wilkinson, J., & Fargione, J. (2022). Site Wind Right: Identifying Low-Impact Wind Development Areas in the Central United States. Land, 11(4), 462. https://doi.org/10.3390/land11040462