Article

Urban Infill Development: A Strategy for Saving Peri-Urban Areas in Developing Countries (the Case Study of Ardabil, Iran)

by
Somayeh Mohammadi-Hamidi
1,
Hadi Beygi Heidarlou
2,3,
Christine Fürst
1,4,* and
Hossein Nazmfar
5
1
Institute for Geosciences and Geography, Department Sustainable Landscape Development, Martin Luther University Halle-Wittenberg, Von-Seckendorff-Platz 4, 06120 Halle (Saale), Germany
2
Forestry Department, Faculty of Natural Resources, Urmia University, Urmia P.O. Box 165, Iran
3
Department of Forest Engineering, Forest Management Planning and Terrestrial Measurements, Faculty of Silviculture and Forest Engineering, Transilvania University of Brasov, Şirul Beethoven 1, 500123 Brasov, Romania
4
German Centre for Integrative Biodiversity Research (iDiv) Halle-Jena-Leipzig, Puschstr. 4, 04103 Leipzig, Germany
5
Department of Geography and Urban Planning, University of Mohaghegh Ardabili, Daneshgah Street, Ardabil 56199-11367, Iran
*
Author to whom correspondence should be addressed.
Land 2022, 11(4), 454; https://doi.org/10.3390/land11040454
Submission received: 30 January 2022 / Revised: 16 March 2022 / Accepted: 17 March 2022 / Published: 22 March 2022
(This article belongs to the Special Issue Ecosystem Services and Biodiversity of Peri-Urban Landscapes)

Abstract

:
The overall objective of this study was to investigate urban infill development policies as a good solution to counteract urban sprawl and protect the peri-urban area of Ardabil in Northwestern Iran. In this context, we used a mixed methodology (two quantitative methods). Landsat imagery, including a patchy Landsat ETM+ for the year 2000 and a Landsat 8 for the year 2020, was used to map and assess land use to investigate sprawl and land-use change, and ArcGIS was used to investigate the potential for infill development in this city. The results show that between 2000 and 2020, 967 hectares of peri-urban land was lost to urban expansion. CA-Markov projections also showed that 452 hectares will be lost by 2030. The assessment of the city’s internal capacity for infill development showed that more than 999 hectares of land within the city are suitable to support this strategy and provide the land needed for urban expansion over the next decade. Finally, the study of the city’s master plan, which applies to all Iranian cities, discovered that there is a lack of adequate outlook regarding the amount of land available for future urban development, leading to misuse of urban land and urban sprawl in Iranian cities, suggesting that an infill development strategy could be a good way to address this issue.

1. Introduction

Today, about half of the world’s population lives in urban areas, and in the next 30 years, the world’s population is expected to grow to more than 2 billion people in developing countries [1]. With the expansion of urban areas, the environment is affected at various spatial and temporal scales [2]. The rapid growth of urban areas has led to complex problems such as traffic congestion, pollution, the decline of open spaces, the desolation of old urban centers, and unplanned or inappropriate land development [3,4]. Policymakers and urban planners have identified infill development as a potential expansion solution that both increases density and revitalizes disadvantaged neighborhoods [5,6,7]. Concurrent with urbanization, peri-urbanization (PU) (development of mixed land uses outside city limits) is occurring, affecting a variety of landscapes and posing several policy challenges [5]. However, the concept of peri-urban is somewhat fluid. It refers to the urban fringe and the geographic edge of cities as a place and the movement of goods and services between physical spaces and to the transition from rural to urban contexts as a process and an interface between rural and urban activities, institutions, and perspectives [6,7]. After the 1970s, there were strong reactions to the uncontrolled growth of cities. These reactions led to the emergence of movements such as smart growth, new urbanism, and compact cities. On a smaller scale, these movements advocated a variety of developments, including transit-oriented development, mixed use, and infill development [1].
In most communities, there is significant vacant land within the city limits that has been overlooked by the urbanization process for a variety of reasons. Generally, infill development means new development on these vacant, abandoned, allocated, or smaller lots in built-up areas in indirect communities where infrastructure already exists [8,9]. In other words, the infill approach within already developed areas is an effective approach to sustainable urban development (i.e., full compatibility with the goals and intentions of modern urban planning) [10]. This can be accomplished by (1) filling vacant land, (2) reusing unused land, or (3) repurposing existing buildings and land for new uses [11]. An important goal of sustainability is to limit the spread of urban land use. To this end, infill development is a first strategy [2]. The infill development which implies the filling of vacant land is a tactic of the regional smart growth strategy [12]. Although planners have recognized in recent years that higher density, more diverse environments, better signage, and better access to destinations can reduce vehicle dependence [13], the effects of specific planning actions such as permitting certain developments, increasing density in certain locations, or increasing combinations of vehicles in certain activity centers have rarely been studied [14].
In recent years, Iranian cities have experienced a trend of unsustainable growth and urbanization that has overtaken urbanity (the fact or quality of being urbane). Abedini and Khalili [1] pointed out that the percentage of urbanization in Iran, which is becoming a developing country with rapid urbanization, has increased from 28% in 1921 to 74% in 2015. In this regard, development-oriented governments can play an important role in solving the problems of growth and urbanization. These problems are mainly in the areas of socioeconomics, urban planning, and urban ecology. The rapid growth of urbanization in Iran (74% in 2015) has led to the emergence of metropolitan areas that are unsustainable. Moreover, environmental and ecological threats, rural–urban migration, and marginalization have led to serious national, regional, and local challenges in Iranian metropolitan areas [15].
The development of urbanization and urbanism in Iran has created a great social and economic disparity in urban areas. Rapid population growth and lack of socio-economic growth programs and urban development strategies have led to an increase in unemployment, inflation, housing prices, traffic congestion, marginalization, and reduction in garden plots, forests, and agricultural lands in cities [16], especially in metropolitan areas of Iran [17]. Given the uncontrolled expansion of Iranian cities which left much-undeveloped land, infill development is an effective approach. Studies on urban growth in Iran mostly focus on large cities and metropolitan areas, such as Mirmoghtadaee [16] in Tehran, Abedini and Khalili [1] in Urmia, Razavian and Samadi [18], and Rahimi [4] in Tabriz. Nevertheless, medium and small urban regions such as Ardabil (an ancient city in Northwestern Iran) can show maximum urban growth rates from the time of their establishment [19].
To make this urbanization into a boom for, rather than a burden on, societies, urban planners need to work toward more effective strategies and plans for the large-scale urbanization process [20] that is taking place in developing countries such as Iran. Among the many other tools and techniques used by urban planners worldwide, GISs and remote sensing are the most efficient and widely used [21]. Geotechnologies and land-use analysis are increasingly being used to monitor, model, and predict urban landscapes, such as in the study of land-use change [12,13].
As noted above, a policy of infill development may be a desirable strategy to reduce the adverse effects of urban sprawl. In the context of implementing infill development, Mustafa, et al. [15] pointed out that density mainly occurs in areas with dense neighborhoods, while areas with low density maintain their low density over time. Mirmoghtadaee [16] also points out that the selection of indices is significant for the implementation of infill development and that the application of infill development in the cities of Iran is also significant. Sharma and Joshi [20] used Landsat satellite data and Urban Landscape Analysis Tool to quantify urban expansion in Delhi. The land cover maps produced were compared in order to qualitatively and quantitatively capture the dynamics of urban expansion. New development areas consisted of three main categories of developments: infill, extension, and leapfrog (development of lands in a manner requiring the extension of public facilities). These studies have shown that GIS and remote sensing techniques, as well as land-use change analysis, do not adequately address infill development. Regarding the importance of uses of GISs and RS in urban studies and land use, Chrysochoou, et al. [17] emphasized that the GIS could play a crucial role in identifying suitable sites for this development. Kamal [22] also continued the integration of multi-criteria analysis methods with the GIS and completed previous research. He also concluded that using more indicators and integrating multi-criteria methods with GISs can be beneficial in identifying suitable sites for urban infill development (building on vacant parcels in built-up areas). Cegielska, et al. [19] show that the use of GIS tools in research greatly speeds up data processing, lowers analysis costs, and improves the precision of results. These results are also shown in Wang, et al. [23] regarding the city of Thimphu in China in Dey, et al. [24] regarding Rajshahi City, Bangladesh.
Accordingly, the study of urban structure and land-use change has received increasing attention from managers and planners concerned with urban and environmental issues as one of the new paradigms for sustainable development [25]. Moreover, serious environmental and social risks that reduce the quality of life in urban and non-urban communities, as well as uncontrollable changes in the spatial structure of cities, are mainly due to the increasing unplanned physical development of cities, the economic growth of overpopulation, and rural–urban migration [
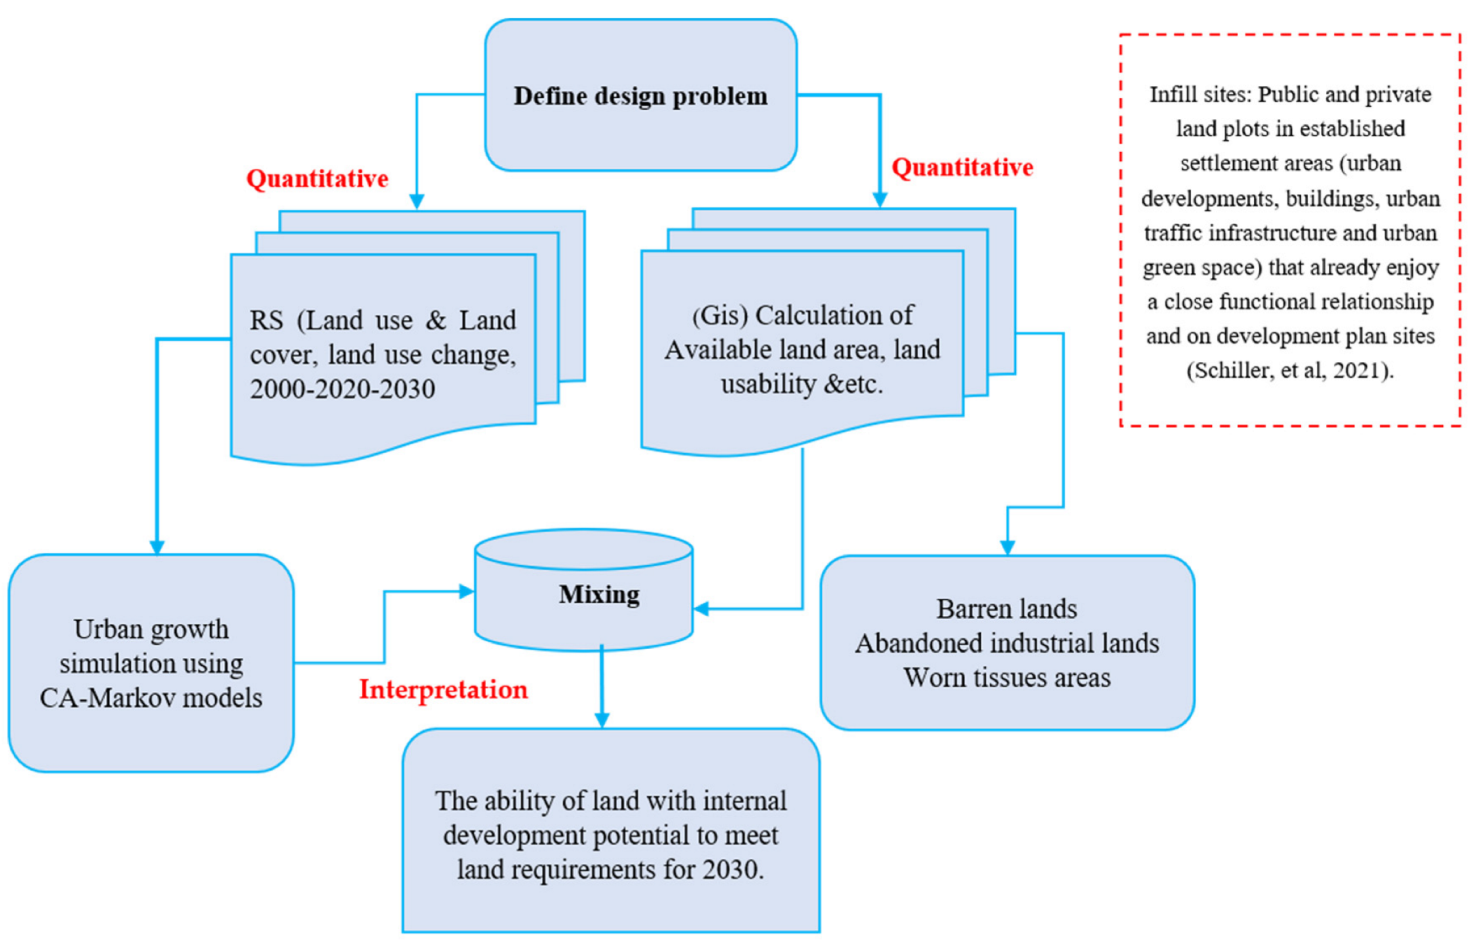
26]. Therefore, this work used both GIS and remote sensing data as well as land-use change analysis tools as inputs in order to help fill this knowledge gap with the following research objectives: (1) monitoring urban sprawl over the past decade, (2) identifying and assessing infill development capacity, (3) forecasting land demand for the next 10 years (due to population growth and migrant influx), and (4) a comparative study of infill development capacities within Ardabil and land requirements for the next 10 years (Figure 1).

2. Materials and Methods

2.1. Study Area

Ardabil is located between 38°15′ N and 48°17′ E in Northwestern Iran (Figure 2). Ardabil province was separated from the Iranian province of East Azerbaijan and declared its independence in 1993, and the city of Ardabil became the capital. The city of Ardabil has grown rapidly in recent decades, which is unprecedented in terms of both population and size. The population of this city has increased from 65,742 inhabitants in 1956 to 482,632 inhabitants in 2011 (Figure 3), and its area has increased from 5753 hectares in 1956 to 65,712 hectares in 2011. Over the past 55 years, the city’s population has grown by 81,579 people annually [27]. The overtaking of the growth rate of the developed area by the growth rate of the population is one of the most important characteristics of high spatial development.
The city of Ardabil, like other cities in Iran, has undergone serious changes in urban planning following recent developments. The role of this city in the 1980s was a dual one. On the one hand, it was a center for various social and personal services; on the other hand, it was a large market for agricultural products and a center for their collection and export outside the city. As the political center of Ardabil Province, the city has experienced significant population growth and a corresponding physical environment, such that the population of the city was 83,596 in 1966 and quadrupled to 340,386 in 1996 (Figure 3) [27].
This trend of population growth was caused by the scattered growth of cities, the incorporation of villages, and the change in croplands in the outskirts of the city. Thus, the area of the city increased from 1390 ha in 1966 to 1580 ha in 1978 and 60,000 ha in 2006 [27]. In addition to population growth, other factors have caused the spatial structure of Ardabil to change, including the distribution of people’s jobs and activities in the city. The formation of population centers and activities around the main core of the city promised the emergence of a new form of spatial structure in the city; however, it is not yet clear to what extent such a spatial distribution of population, followed by the redistribution of activity centers, could lead to the formation of sub-cores in different parts of the city. These changes make it increasingly necessary to pay attention to the future development of the city and the need to guide and manage it.

2.2. Methodology

In this work, we used a mixed-methods design that combines two quantitative and statistical research methods [28,29] to gain comprehensive insights (Figure 4). To characterize spatial phenomena, planners and policymakers have relied heavily on techniques such as GISs and remote sensing [30]. For the spatiotemporal dimension, GISs and remote sensing are used to observe, monitor, analyze, evaluate, and measure urban growth trends and urban landscapes, e.g., to study land-use changes and model urban expansion [31,32]. In this study, Landsat imagery was used as remote sensing data and land-use change analysis tools (Land Change Modeler) to investigate urban fill development in spatial and temporal domains from 2000 to 2020 with land use/cover maps and in Ardabil.

2.2.1. Land-Use Mapping and Accuracy Assessment

We used Landsat imagery to map land use/land cover, assess its changes, and examine urban sprawl over 20 years in Ardabil. The two images used for the study area are a patchy Landsat ETM+ for 2000 and a Landsat 8 for 2020 (Table 1). Prior to image classification, we converted the images into surface reflectance values (the amount of light reflected by the surface of the earth) using the FLAASH tool [33] in ENVI 5.3. In addition to using ground control points, the vector layers of roads and rivers in the city of Ardabil were used to reduce geometric errors [34,35].
In this study, we used training data [36] (200 points for each land-use type) obtained from an intensive field study, the 2018 inventory, and available 1:50,000 scale topographic maps. We also collected additional training data and ground control points for image classification throughout the period by visually linking the desired Landsat imagery and confirming the land cover assignment of each point with high-resolution imagery in Google Earth [37,38] whenever possible. Then, using the EnMAP-Box software [39] and prepared training data, the Landsat images were classified into five classes using a nonparametric random forest classifier [40] in five classes: (1) water bodies, (2) bare lands (areas with no dominant vegetation cover), (3) green lands (all parks and green areas inside the city), (4) croplands, and (5) built-up areas. In addition, for image classification post processing (CPP), the majority filter was applied to eliminate single pixels derived from misclassifications of the images [37,41] to enhance the classification accuracy [42].
The accuracy of the classified images was assessed using a random sample of 50 points for each class. For this, we collected ground control points (GCPs) by interpreting the Landsat images and using high-resolution imagery in Google Earth, where their land-use types had not changed over time [43]. Based on this, we performed error matrix analysis and then derived the overall accuracy, kappa coefficient, producer’s and user’s accuracies, and commission and omission errors [13].

2.2.2. Change Analysis

The Land Change Modeler (LCM) in the TerrSet 2020 software was used to quantify land-use changes [44] in Ardabil. Then, change analysis was conducted for the 2000–2020 time period using land change modeling. These changes included losses, gains, and net changes for each land-use class and transition from one class to another. The spatial trend of physical development and peri-urban areas in Ardabil was calculated using the results obtained from the change analysis. For a visual understanding of the change patterns, spatial distribution of land uses to other uses was extracted. The spatial change pattern of the surface was created by coding areas of change with 1 and areas of no change with 0 while treating the values in a manner similar to that for quantitative values and then interpolating them by using a 3rd polynomial order function (Equation (1)). This method enables identification and understanding of the spatial trends of the transition, which can provide a better comprehension of the sites of different changes at different spatial locations [44].
Z = b 00 + b i x + b i y + b i x 2 + b i x y + b i y 2 + b i x 3 + b i x 2 y + b i x y 2 + b i y 3

2.2.3. Land-Use Change Prediction

Analyzing the stability or instability of land use and identifying areas that have changed during the study period (20 years) can be used by planners to better plan and prevent further land-use changes. In this step, land uses that have fundamentally changed and are directly or indirectly associated with areas near urban areas were examined using the criteria of lost or changed areas, persistent areas with no changes, and areas added to previous land uses. This stability and instability was achieved in order to plan future forecasts and planning and to prevent their destruction and disappearance. In this study, the CA-Markov model was selected for simulating and predicting land use/land cover (LULC) changes [45]. This model can be used to analyze the changes in LULC based on the number of transition area probabilities from one land-use class to another ([46]). One of the most important advantages of using this model is that prediction of changes and spatial trends (e.g., urban development) can be carried out using limited data [47]. The suitability map extracted from the Markov chain model provides information on the inherent suitability of each land-use class [48]. This procedure involved: (a) performing Markov chain analysis of the 2000 and 2020 LULC maps to create transition area matrices; (b) creating LULC transition area maps; (c) evaluating model accuracy in simulating future changes using kappa indices of agreement and disagreement (using the method described by Mondal, et al. [49]); and (d) predicting the spatial distribution of LULC in 2030.

2.2.4. Cellular Automata Markov (CA-Markov) Model

In this study, the cellular automata Markov (CA-Markov) model was used to predict LULC status for 2030. The CA-Markov model predicts LULC by combining the Markov model with cellular automata and adding the element of spatial distribution and potential LULC transitions and distributions [50,51].
The four aspects of a CA system are the unit, state, proximity range, and transition rules [52]. The following is the expression:
S ( t + 1 ) = f [ S ( t ) · N ]
where S represents the state set of discrete and finite cells, N represents the cell’s neighborhood, T and T + 1 represent two unique moments, and f represents the cellular state transition rule [53].
The Markov model can be used to predict the trend of land use/land cover change and is an excellent tool for land-use change prediction and scenario analysis. The transition probability Pij at time m [54], which is written as follows, is the key to using the Markov model to predict land use/land cover.
[ p 11 p 12 p 1 n p 21 p 22 p 2 n p m 1 p m 2 p m n ]
Based on this probability, the Markov model for predicting the change in land use/land cover is built, which is as follows:
S ( T ) = p i j + S ( T 0 )
where S(T) and S(T0) denote the state of the land-use structure at times T and T0, respectively, and Pij denotes the state transition matrix [53].

3. Results

3.1. Land Use/Cover Maps and Accuracy Assessment

The overall accuracy of the maps produced for 2000 and 2020 with kappa coefficients of 0.84 and 0.86 was 82.5% and 91.3%, respectively. Producer and user accuracy and commission and omission errors are shown in Table 2. Producer and user accuracy exceeded 75% for most land-use classes.
Figure 5 displays the spatial patterns related to the five main types of land use/cover in Ardabil. LULC analysis shows that the extent of land use/cover classes varied over the studied years. As shown in Table 3, bare lands and croplands covered 22.18% and 47.73% of the total region in 2000, but they declined to 16.88% and 39.12% in 2020, respectively. On the other hand, the built-up areas, green lands, and water bodies increased from 26.13%, 1.99%, and 1.96% to 39.18%, 2.63%, and 2.20%, respectively, during the same period (2000–2020).

3.2. LULC Analysis

After land-use maps were prepared, the changes that occurred in each land use/cover class during the period studied (2000–2020) were determined. The results of gains, losses, and net changes in land-use types are shown in Figure 6.
As shown in Figure 6, the comparison of the net change of croplands during the studied period indicates that the area covered by croplands decreased by 950 ha. The net changes in the built-up areas were +1457 ha during 2000–2020.
We created comprehensive land-use change matrices for the period 2000–2020 to better understand the changing nature of LULC types in the city. The details of land cover transitions among the five mapped land-use types are shown in Table 4. In terms of urban sprawl, the peri-urban areas are most at risk. During the period (2000–2020), about 648 hectares of cropland areas were converted to built-up areas, and 1323 hectares were converted to bare land.
The results of the spatial trend in land-use changes from cropland to other land uses (Figure 7) showed that the densely populated areas in the south and southwest of Ardabil and the activities of people in this area to carry out agricultural activities are the main centers of land-use changes and land use and land cover conversion.

3.3. Land Use/Cover Change Prediction

For model validation, the simulated land use/land cover map for the year 2020 was compared to the actual satellite-derived land use/land cover map based on the kappa statistics with GIS software using the land-use map for the year 2000 and the land-use change maps between 2000 and 2020. The overall success of the simulation using Markov cellular automata was 0.87% in 2020. The developed Markov model was also tested for its ability to predict land-use change in 2030. A 2030 land-use map was predicted based on the changes in 2000 and 2020. The results showed that built-up areas (5084.19 ha) will be the most important land use in Ardabil and that cropland, bare lands, green lands, and water bodies will cover 3939.48, 1604.88, 351.45, and 246.06 ha of Ardabil, respectively, in 2030 (Table 5). The results also show that built-up areas and green areas will increase by 15.59% and 18.95%, respectively, by 2030 compared to 2020, while undeveloped areas, cropland, and water bodies will decrease by 15.30%, 10.30%, and 0.41%, respectively. The largest increase in built-up areas in Ardabil in 2030 compared to 2020 will occur in the southern part of the city.

3.4. Infill Development Potential Capacities

This study examined four types of land use, including barren land, worn-out land, military land, and unused and abandoned warehouses that have the potential to be used as land for built-up development. As Ardabil has only recently become the central city of Ardabil Province, rapid urban development has left many brownfields in the city. Moreover, like other cities in Iran, this city has a central structure with an old and traditional structure that is evolving. Figure 8 shows the distribution of land uses with potential for infill development.
Due to rapid urbanization, small villages, military sites, and industrial areas that used to be outside the city are gradually surrounded by built-up areas and absorbed by the rapidly growing city. The area of all land uses is shown in Table 6.
According to the calculations and comparisons of the above results, a total of 999.9 hectares of land within the projected development limits has the potential for infill development, which is also more than the amount of land needed for urban development in the next 10 years (685.76). Among these lands, barren lands and worn-out urban texture lands have the largest area in the city.

4. Discussion

Since most cities in Iran are located in the lowlands, where land is very important for agriculture, the value of land around the city is many times higher, especially in the northern cities of the country, which are located in mountainous areas. Therefore, policymakers need to manage urban growth based on a sustainable development approach that takes into account various socioeconomic, cultural, and geographic aspects. Effective strategies should be developed by policymakers and urban planners in different parts of the world depending on the context.
From the results, it can be concluded that urban sprawl in Ardabil during the study period (2000–2020) occurred mainly and increasingly outside the city, especially in the peri-urban area adjacent to the current development. During this period, the area closes to the city shrank from 5358.75 hectares in 2000 to 4391.72 hectares in 2020. The government’s failure to preemptively control the city through laws and regulations, inappropriate policies in the land and housing sector [1], and disregard for land management principles in determining land use are some of the most important reasons for Ardabil’s rapid urban expansion beyond its borders and the destruction of the areas close to the city. It is also important to compare our data on urban expansion with the reality of urban planning in Ardabil.

4.1. Master Plans

Master plans are the basis of the Iranian urban planning system [55]. In Iran, master planning emerged from the mid-1970s when the first wave of modernization began [56]. These master plans contain maps of proposed land uses as well as legally binding provisions on how land should be used in practice. In addition, depending on population growth rates and per capita land-use values (hectares per person), the plans determine future urban expansion and development patterns [57]. In this case, the plans define the boundaries between developed and undeveloped areas. In undeveloped areas, all development is prohibited. However, these boundaries are rarely respected, and virtually all Iranian cities expand beyond the boundaries of the master plans [1,16]. In Ardabil, according to the 1991–2004 Master Plan forecast (Table 7), approximately 3332.93 hectares of land were estimated for future development in the city. These miscalculations have resulted in numerous land-use changes in the suburbs, especially in peri-urban areas, and many of these areas have been destroyed by these urban development policies. The results of this study (Table 4) show that 648 and 1323 hectares of cropland were converted to built-up areas and bare lands, respectively.
Considering the land-use conditions and the distribution of villages within the urban area, the southern areas of the city of Ardabil were proposed as potentially the best areas for future development of the city. The results of change prediction for 2030 (Figure 9) also indicated that the largest increase in built-up areas in Ardabil will occur in the southern portions of the city. One of the most important factors in determining these development priorities was the quality of land for agriculture, which is consistent with the main objectives of this project and Ardabil’s future projects. However, at present, it can be observed that the city of Ardabil is scattered in all directions, especially on the entrance and exit axes of the city (such as Astara-Ardabil, Tabriz-Ardabil, Khalkhal-Ardabil, and Meshkinshahr-Ardabil) (Figure 10). In 2010, the old master plan of the city was revised, and the future of Ardabil’s urban development for the next 20 years (i.e., until 2030) was replanned according to the current situation.
Since the old city plan (referring to 1991) allocated much land within the city for future development, the 2010 plan does not include land for development within the city, and the revised master plan (2016) for development of the city was focused on the southern parts, which consist mainly of grasslands. The study results of Karimi, et al. [58] in Shiraz city, Rahimi [4] in Tabriz city, and Rozati, et al. [59] in Isfahan city show that master plans are the main driver of urban sprawl in Iran. Tian and Shen [60], Han, et al. [61], and Wang, et al. [62] also show the effects of implementing the master plans for Guangzhou and Beijing and find that the actual urban development in both cities differs greatly from the original master plans.

4.2. Urban Land Development Policies

Urbanization in Iran was influenced by several important indicators, which can be divided into six categories (Figure 11) [63,64].
The Iranian government has attempted to address this rapid urbanization with some policy, such as new satellite towns around cities and housing for low-income people (Mehr housing) [65] but the rapid increase in suburban land prices has again limited the effectiveness of these measures [66]. The results of Karji, et al. [67] also show that these policies have not been successful in Iranian cities, especially in Ardabil. The main problems in this policy are the function of housing cooperatives, the function of Maskan Bank, access to the city center, lack of facilities outside the housing unit, lack of space for parking cars, and cost [68]. The township-level government and the land joint management company are also at a core position with high-level control over contact and information, according to the findings of Zhou, et al. [52], and both play important brokerage roles.
Land use, planning, and management through infill development policies are more consistent with the sustainability framework and closer to sustainability goals than other outside and perimeter growth policies. Van der Krabben and Jacobs [69], particularly in the case of brownfield redevelopment, believe that public sector land development can be and is proving to be an effective tool for American planning. In combination with public sector interventions, such as reducing liability risks related to clean-up costs, property-tax forgiveness, tax-increment financing, and development bonds.

5. Conclusions

From the founding history of Iranian cities (especially in the northwest and Ardabil), most cities have suffered from land shortages over time and continue to expand (for food supply and urban development). Currently, the interaction and competition for land between urban development and the protection of the integrity of cultivable land in these cities has become much more intense.
In this study, we investigated Urban Infill development in the city of Ardabil in order to save the peri-urban areas in this city. The key findings of this study are as follows: The results show that a considerable number of peri-urban areas have been lost due to urban expansion in the last two decades. According to the calculations, 999.9 hectares of land within the projected development limits have the potential for infill development, which is also more than the amount of land needed for urban development in the next 10 years (685.76). Therefore, this strategy can be used to protect peri-urban areas in the Ardabil by providing land for future expansion. The urban master plan and population growth in Ardabil, as in other cities in Iran, have been the driving force behind the disappearance of peri-urban areas. To counteract this, the infill development strategy can mitigate the drawbacks of this plan to some extent.
Infill development policy, however, is multi-faceted and complex, not only because of the breadth of the concept and the inclusion of a wide range of urban property and land or the variety of objectives and implementation methods, but also because of the multi-faceted and fundamentally contentious nature of planning due to the presence of numerous stakeholders in this urban growth policy. Therefore, any planning for an action plan for densification should be based on knowledge of the social and cultural characteristics of the population, observation of the demographic trends of urban residents, the size of available land, and prioritization (priority elimination and relocation of disruptive activities and uses), incompatibilities, priority regeneration of worn textures and activities with pollution or social degradation), taking into account the dynamics of natural environmental influences (area of faults, channels and other natural features) and, above all, respecting the urban zoning system, which is the guiding criterion of the policy. For future research in this area, we propose study of the following thematic axes: assessment of the tolerable capacity of the urban environment for infill development; the role of infill capacities in adjusting the inequality of urban areas; and the relationship between space rent (or urban space rent) management and endogenous growth policies.

Author Contributions

Conceptualization, S.M.-H.; methodology, S.M.-H., H.N. and H.B.H.; software, S.M.-H. and H.B.H.; validation, H.B.H., C.F.; data curation, S.M.-H.; writing—original draft preparation, S.M.-H. and H.B.H.; writing—review and editing, H.B.H., C.F. and H.N. All authors have read and agreed to the published version of the manuscript.

Funding

This research received no external funding. The APC was funded by the Department Sustainable Landscape Development, Martin Luther University Halle-Wittenberg, Halle (Saale), Germany.

Institutional Review Board Statement

Not applicable.

Informed Consent Statement

Not applicable.

Data Availability Statement

Not applicable.

Acknowledgments

The authors would like to thank their colleagues in the Department of Geosciences and Geography, Martin-Luther-University Halle-Wittenberg, Germany, for their support. The authors would like to thank the editor and three anonymous referees who kindly reviewed the earlier version of this manuscript and provided valuable suggestions and comments.

Conflicts of Interest

The authors declare no conflict of interest. The views expressed are strictly those of the authors and do not necessarily represent the positions or policies of their respective institutions.

References

  1. Abedini, A.; Khalili, A. Determining the capacity infill development in growing metropolitans: A case study of Urmia city. J. Urban Manag. 2019, 8, 316–327. [Google Scholar] [CrossRef]
  2. Schiller, G.; Blum, A.; Hecht, R.; Oertel, H.; Ferber, U.; Meinel, G. Urban infill development potential in Germany: Comparing survey and GIS data. Build. Cities 2021, 2, 36–54. [Google Scholar] [CrossRef]
  3. Lee, H. An analysis on development capacity of an urbanized area for urban growth management. J. Korean Urban Geogr. Soc. 2008, 11, 1–18. [Google Scholar]
  4. Rahimi, A. A methodological approach to urban land-use change modeling using infill development pattern—A case study in Tabriz, Iran. Ecol. Process. 2016, 5, 1–15. [Google Scholar] [CrossRef] [Green Version]
  5. Spyra, M.; Kleemann, J.; Calò, N.C.; Schürmann, A.; Fürst, C. Protection of peri-urban open spaces at the level of regional policy-making: Examples from six European regions. Land Use Policy 2021, 107, 105480. [Google Scholar] [CrossRef]
  6. Marshall, F.; Waldman, L.; MacGregor, H.; Mehta, L.; Randhawa, P. On the Edge of Sustainability: Perspectives on Peri-Urban Dynamics; STEPS Working Paper 35; STEPS Centre: Brighton, UK, 2009. [Google Scholar]
  7. Matthew, R.; Chiotha, S.; Orbinski, J.; Talukder, B. Research note: Climate change, peri-urban space and emerging infectious disease. Landsc. Urban Plan. 2022, 218, 104298. [Google Scholar] [CrossRef]
  8. Felt, E. Patching the Fabric of the Neighborhood: The Practical Challenges of Infill Housing Development for CDCs; Citeseer: State College, PA, USA, 2007. [Google Scholar]
  9. Aly, S.; Attwa, Y. Infill Development as an Approach for Promoting Compactness of Urban Form; WIT Press: Southampton, UK, 2013; Volume 173, pp. 455–466. [Google Scholar]
  10. Eichhorn, S.; Rusche, K.; Weith, T. Integrative governance processes towards sustainable spatial development—Solving conflicts between urban infill development and climate change adaptation. J. Environ. Plan. Manag. 2021, 64, 2233–2256. [Google Scholar] [CrossRef]
  11. Ghodsi, N.; Nastaran, M.; Izadi, A. Infill development approach: A smart transition way to the sustainable future urban development. Sustain. Comput. Informatics Syst. 2021, 32, 100614. [Google Scholar] [CrossRef]
  12. Khorrami, B.; Beygi Heidarlou, H.; Feizizadeh, B. Evaluation of the environmental impacts of urbanization from the viewpoint of increased skin temperatures: A case study from Istanbul, Turkey. Appl. Geomatics 2021, 13, 311–324. [Google Scholar] [CrossRef]
  13. Beygi Heidarlou, H.; Shafiei, A.B.; Erfanian, M.; Tayyebi, A.; Alijanpour, A. Land Cover Changes in Northern Zagros Forests (Nw Iran) Before and During Implementation of Energy Policies. J. Sustain. For. 2020, 40, 234–248. [Google Scholar] [CrossRef]
  14. Merlin, L.A. The influence of infill development on travel behavior. Res. Transp. Econ. 2018, 67, 54–67. [Google Scholar] [CrossRef]
  15. Mustafa, A.; Van Rompaey, A.; Cools, M.; Saadi, I.; Teller, J. Addressing the determinants of built-up expansion and densification processes at the regional scale. Urban Stud. 2018, 55, 3279–3298. [Google Scholar] [CrossRef] [Green Version]
  16. Mirmoghtadaee, M. Demands and Feasibilities of Infill Development in Iranian Urban Areas-the Case Study of Tehran. In Proceedings of the W101-Special Track 18th CIB World Building Congress, Salford, UK, 10–13 May 2010; p. 1. [Google Scholar]
  17. Chrysochoou, M.; Brown, K.; Dahal, G.; Granda-Carvajal, C.; Segerson, K.; Garrick, N.; Bagtzoglou, A. A GIS and indexing scheme to screen brownfields for area-wide redevelopment planning. Landsc. Urban Plan. 2012, 105, 187–198. [Google Scholar] [CrossRef]
  18. Razavian, M.; Samadi, R. Evaluation of Infill Development Potential in Zone 8 of Tabriz by Analysis Network Process Method. Curr. Urban Stud. 2016, 4, 125–139. [Google Scholar] [CrossRef] [Green Version]
  19. Cegielska, K.; Noszczyk, T.; Kukulska, A.; Szylar, M.; Hernik, J.; Dixon-Gough, R.; Jombach, S.; Valánszki, I.; Kovács, K.F. Land use and land cover changes in post-socialist countries: Some observations from Hungary and Poland. Land Use Policy 2018, 78, 1–18. [Google Scholar] [CrossRef]
  20. Sharma, R.; Joshi, P.K. Monitoring Urban Landscape Dynamics over Delhi (India) Using Remote Sensing (1998–2011) Inputs. J. Indian Soc. Remote Sens. 2013, 41, 641–650. [Google Scholar] [CrossRef]
  21. Carlson, T. Applications of remote sensing to urban problems. Remote Sens. Environ. 2003, 86, 273–274. [Google Scholar] [CrossRef]
  22. Kamal, A. Suitability for Infill Development: A multi-criteria and Spatial Assessment Approach. In Proceedings of the ARCC Conference Repository, Manoa, HI, USA, 12–15 February 2014; pp. 336–345. [Google Scholar]
  23. Wang, S.W.; Munkhnasan, L.; Lee, W.-K. Land use and land cover change detection and prediction in Bhutan’s high altitude city of Thimphu, using cellular automata and Markov chain. Environ. Challenges 2021, 2, 100017. [Google Scholar] [CrossRef]
  24. Dey, N.N.; Al Rakib, A.; Kafy, A.A.; Raikwar, V. Geospatial modelling of changes in land use/land cover dynamics using Multi-layer perception Markov chain model in Rajshahi City, Bangladesh. Environ. Challenges 2021, 4, 100148. [Google Scholar] [CrossRef]
  25. Nouri, J.; Gharagozlou, A.; Arjmandi, R.; Faryadi, S.; Adl, M. Predicting Urban Land Use Changes Using a CA–Markov Model. Arab. J. Sci. Eng. 2014, 39, 5565–5573. [Google Scholar] [CrossRef]
  26. Bryan, B.A.; Crossman, N. Systematic regional planning for multiple objective natural resource management. J. Environ. Manag. 2008, 88, 1175–1189. [Google Scholar] [CrossRef] [PubMed]
  27. Statistical Center of Iran. Population and Housing Censuses. Available online: https://www.amar.org.ir/english (accessed on 4 June 2020).
  28. Cheng, X.; Su, L.; Luo, X.; Benitez, J.; Cai, S. The good, the bad, and the ugly: Impact of analytics and artificial intelligence-enabled personal information collection on privacy and participation in ridesharing. Eur. J. Inf. Syst. 2021, 1–25. [Google Scholar] [CrossRef]
  29. Hou, T.; Luo, X.R.; Ke, D.; Cheng, X. Exploring different appraisals in deviant sharing behaviors: A mixed-methods study. J. Bus. Res. 2021, 139, 496–509. [Google Scholar] [CrossRef]
  30. Liu, F.; Shi, L.; Zhang, Z.; Zhao, X. Evaluating Urban Expansion of Beijing during 1973–2013, by Using GIS and Remote Sensing. In Proceedings of the International Conference on Geo-Informatics in Resource Management and Sustainable Ecosystem, Ypsilanti, MI, USA, 2–5 October 2014; pp. 635–642. [Google Scholar]
  31. Ramachandra, T.; Bharath, H.; Sowmyashree, M. Analysis of spatial patterns of urbanisation using geoinformatics and spatial metrics. Theor. Empir. Res. Urban Manag. 2013, 8, 5–24. [Google Scholar]
  32. Manesha, E.; Jayasinghe, A.; Kalpana, H.N. Measuring urban sprawl of small and medium towns using GIS and remote sensing techniques: A case study of Sri Lanka. Egypt. J. Remote Sens. Space Sci. 2021, 24, 1051–1060. [Google Scholar] [CrossRef]
  33. Cooley, T.; Anderson, G.P.; Felde, G.W.; Hoke, M.L.; Ratkowski, A.J.; Chetwynd, J.H.; Gardner, J.A.; Adler-Golden, S.M.; Matthew, M.W.; Berk, A. FLAASH, a MODTRAN4-based atmospheric correction algorithm, its application and validation. In Proceedings of the IEEE International Geoscience and Remote Sensing Symposium, Toronto, ON, Canada, 24–28 June 2002; pp. 1414–1418. [Google Scholar]
  34. Nguyen, T. Optimal Ground Control Points for Geometric Correction Using Genetic Algorithm with Global Accuracy. Eur. J. Remote Sens. 2015, 48, 101–120. [Google Scholar] [CrossRef] [Green Version]
  35. Pehani, P.; Čotar, K.; Marsetič, A.; Zaletelj, J.; Oštir, K. Automatic geometric processing for very high resolution optical satellite data based on vector roads and orthophotos. Remote Sens. 2016, 8, 343. [Google Scholar] [CrossRef] [Green Version]
  36. Eastman, J.R. IDRISI Andes Tutorial; Clark Labs., Clark University: Worcester, MA, USA, 2006. [Google Scholar]
  37. Baumann, M.; Radeloff, V.C.; Avedian, V.; Kuemmerle, T. Land-use change in the Caucasus during and after the Nagorno-Karabakh conflict. Reg. Environ. Chang. 2015, 15, 1703–1716. [Google Scholar] [CrossRef]
  38. Beygi Heidarlou, H.B.; Banj Shafiei, A.; Erfanian, M.; Tayyebi, A.; Alijanpour, A. Underlying driving forces of forest cover changes due to the implementation of preservation policies in Iranian northern Zagros forests. Int. For. Rev. 2020, 22, 241–256. [Google Scholar] [CrossRef]
  39. Van der Linden, S.; Rabe, A.; Held, M.; Jakimow, B.; Leitão, P.J.; Okujeni, A.; Schwieder, M.; Suess, S.; Hostert, P. The EnMAP-Box—A toolbox and application programming interface for EnMAP data processing. Remote Sens. 2015, 7, 11249–11266. [Google Scholar] [CrossRef] [Green Version]
  40. Breiman, L. Random Forests—Random Features; Technical Report 567; Statistics Department, University of California: Berkeley, CA, USA, 1999. [Google Scholar]
  41. Beygi Heidarlou, H.B.; Banj Shafiei, A.; Erfanian, M.; Tayyebi, A.; Alijanpour, A. Armed conflict and land-use changes: Insights from Iraq-Iran war in Zagros forests. For. Policy Econ. 2020, 118, 102246. [Google Scholar] [CrossRef]
  42. Huang, X.; Lu, Q.; Zhang, L.; Plaza, A. New Postprocessing Methods for Remote Sensing Image Classification: A Systematic Study. IEEE Trans. Geosci. Remote Sens. 2014, 52, 7140–7159. [Google Scholar] [CrossRef]
  43. Schulz, J.J.; Cayuela, L.; Echeverria, C.; Salas, J.; Rey Benayas, J.M. Monitoring land cover change of the dryland forest landscape of Central Chile (1975–2008). Appl. Geogr. 2010, 30, 436–447. [Google Scholar] [CrossRef] [Green Version]
  44. Eastman, J. TerrSet: Geospatial Monitoring and Modeling Software; Clark Labs, Clark University: Worcester, MA, USA, 2015. [Google Scholar]
  45. Sang, L.; Zhang, C.; Yang, J.; Zhu, D.; Yun, W. Simulation of land use spatial pattern of towns and villages based on CA–Markov model. Math. Comput. Model. 2011, 54, 938–943. [Google Scholar] [CrossRef]
  46. Coppedge, B.R.; Engle, D.M.; Fuhlendorf, S.D. Markov models of land cover dynamics in a southern Great Plains grassland region. Landsc. Ecol. 2007, 22, 1383–1393. [Google Scholar] [CrossRef]
  47. Aburas, M.M.; Ho, Y.M.; Pradhan, B.; Salleh, A.H.; Alazaiza, M.Y. Spatio-temporal simulation of future urban growth trends using an integrated CA-Markov model. Arab. J. Geosci. 2021, 14, 1–12. [Google Scholar] [CrossRef]
  48. Beygi Heidarlou, H.B.; Banj Shafiei, A.; Erfanian, M.; Tayyebi, A.; Alijanpour, A. Effects of preservation policy on land use changes in Iranian Northern Zagros forests. Land Use Policy 2019, 81, 76–90. [Google Scholar] [CrossRef]
  49. Mondal, S.; Sharma, N.; Garg, P.; Kappas, M. Statistical independence test and validation of CA Markov land use land cover (LULC) prediction results. Egypt. J. Remote Sens. Space Sci. 2016, 19, 259–272. [Google Scholar] [CrossRef] [Green Version]
  50. Myint, S.W.; Wang, L. Multicriteria decision approach for land use land cover change using Markov chain analysis and a cellular automata approach. Can. J. Remote Sens. 2006, 32, 390–404. [Google Scholar] [CrossRef]
  51. Mwabumba, M.; Yadav, B.K.; Rwiza, M.J.; Larbi, I.; Twisa, S. Analysis of land use and land-cover pattern to monitor dynamics of Ngorongoro world heritage site (Tanzania) using hybrid cellular automata-Markov model. Curr. Res. Environ. Sustain. 2022, 4, 100126. [Google Scholar] [CrossRef]
  52. Zhou, C.; Ou, Y.; Ma, T.; Qin, B. Theoretical perspectives of CA-based geographical system modeling. Progress Geogr. 2009, 28, 833–838. [Google Scholar]
  53. Zhang, Z.; Hu, B.; Jiang, W.; Qiu, H. Identification and scenario prediction of degree of wetland damage in Guangxi based on the CA-Markov model. Ecol. Indic. 2021, 127, 107764. [Google Scholar] [CrossRef]
  54. Li, X.-G.; Liang, C.-H.; Wang, Y.-S.; Lv, J.-J. Predicting landscape patterns of Lianhe Delta Wetland by CA–Markov model. Environ. Sci. Technol. 2013, 36, 188–192. [Google Scholar]
  55. Mohammadi, J.; Zarabi, A.; Mobarak, O. Urban sprawl pattern and effective factors on them: The case of Urmia city, Iran. J. Urban Reg. Anal. 2012, 4, 77–89. [Google Scholar] [CrossRef]
  56. Madanipour, A. The limits of scientific planning: Doxiadis and the Tehran Action Plan. Plan. Perspect. 2010, 25, 485–504. [Google Scholar] [CrossRef] [PubMed]
  57. Soltani, A.; Hosseinpour, M.; Hajizadeh, A. Urban Sprawl in Iranian Medium-sized Cities; Investigating the Role of Masterplans. J. Sustain. Dev. 2017, 10, 122–131. [Google Scholar] [CrossRef]
  58. Karimi, B.; Peyvasteghar, Y.; Taghvaei, M. The analysis of the spatial development trend of Shiraz metropolitan area in the 1410 horizons using Land transformation model and Holderen technique. J. Res. Urban Plan. 2020, 11, 123–136. [Google Scholar]
  59. Rozati, S.H.; Kazemzadeh, M.; Vaseghi, A. Sustainable Urban Development with Emphasis on Worn Out Texture Regeneration (Case Study: Isfahan, Iran). Curr. Urban Stud. 2015, 3, 241–246. [Google Scholar] [CrossRef] [Green Version]
  60. Tian, L.; Shen, T. Evaluation of plan implementation in the transitional China: A case of Guangzhou city master plan. Cities 2011, 28, 11–27. [Google Scholar] [CrossRef]
  61. Han, H.-Y.; Lai, S.-K.; Dang, A.-R.; Tan, Z.-B.; Wu, C.-F. Effectiveness of urban construction boundaries in Beijing: An assessment. J. Zhejiang Univ. A 2009, 10, 1285–1295. [Google Scholar] [CrossRef]
  62. Wang, L.-G.; Han, H.; Lai, S.-K. Do plans contain urban sprawl? A comparison of Beijing and Taipei. Habitat Int. 2014, 42, 121–130. [Google Scholar] [CrossRef]
  63. Ghanbari, M.; Ajza Shokuhi, M.; Rahnama, M.R.; Kharazmi, O.A. An Analysis on the Price of Urban Land in Iran’s Provinces during 2001 to 2011. J. Urban Econ. Manag. 2016, 4, 77–99. [Google Scholar]
  64. Pilehvar, A.A. Spatial-geographical analysis of urbanization in Iran. Humanit. Soc. Sci. Commun. 2021, 8, 63. [Google Scholar] [CrossRef]
  65. Zanganeh Shahraki, S.; Ahmadifard, N.; Farhadikhah, H.; Fotouhi Mehrabani, B.; Haydari, A.; Abdali, Y.; Abbasi Fallah, V.; Farhadi, E.; Cividino, S.; Vinci, S. Spatial planning, urban governance and the economic context: The case of ‘mehr’housing plan, Iran. Land 2020, 9, 169. [Google Scholar] [CrossRef]
  66. Pourmohammadi, M.; Sadr Mousavi, M.; Abedini, A. Analytical consideration on policies of housing supply by government with respect to the cultural and socioeconomic development plans in Iran. Urban Stud. 2012, 1, 34–43. [Google Scholar]
  67. Karji, A.; Woldesenbet, A.; Khanzadi, M.; Tafazzoli, M. Assessment of Social Sustainability Indicators in Mass Housing Construction: A Case Study of Mehr Housing Project. Sustain. Cities Soc. 2019, 50, 101697. [Google Scholar] [CrossRef]
  68. Azemati, H.; Pourbagher, S.; Rostami, V. Evaluating the Satisfaction Rate in Affordable Housing Case Study: Ardabil Mehr Housing in Ardabil Province of Iran. J. Arch. Eng. Technol. 2017, 6, 199–205. [Google Scholar] [CrossRef]
  69. Van der Krabben, E.; Jacobs, H.M. Public land development as a strategic tool for redevelopment: Reflections on the Dutch experience. Land Use Policy 2013, 30, 774–783. [Google Scholar] [CrossRef]
Figure 1. Infill development strategy conceptual framework.
Land 11 00454 g001
Figure 2. Geographical location of study area. The study area is 1 km around the urban area, affected by the urban extension.
Land 11 00454 g002
Figure 3. Population of Ardabil city according to the national census [27].
Land 11 00454 g003
Figure 4. Methodology flowchart of this study.
Land 11 00454 g004
Figure 5. Ardabil city expansion over 20 years (2000–2020).
Land 11 00454 g005
Figure 6. Gains (+), losses (−) and net changes for each land use/cover class (ha) for the period of 2000−2020.
Land 11 00454 g006
Figure 7. The trend of croplands to be changed to other land-use types (bare lands, built-up areas, and all land uses).
Land 11 00454 g007
Figure 8. Distribution of potential infill development land uses in Ardabil city.
Land 11 00454 g008
Figure 9. Changes in built-up areas of Ardabil in 2030 compared to 2020.
Land 11 00454 g009
Figure 10. City area in the revised 2010 master plan and the projected area for 2020.
Land 11 00454 g010
Figure 11. Indicators affecting the rapid growth and development of urbanization in Iran.
Land 11 00454 g011
Table 1. Details of imagery used in the study area.
YearData TypeSensorAcquisition DatePathRow
2000Landsat 7ETM+5 June 200016733
2020Landsat 8OLI7 July 202016733
Table 2. Accuracy assessment of image classifications for the years 2000 and 2020.
Land-Use ClassesPAUACeOe
20002020200020202000202020002020
Built-up area81.310095.595.218.28.14.523.2
Bare lands90.297.58973.89.32.6032.2
Croplands9092.110092.7111821.816.7
Green lands82.379.587.583.921.1107.23.7
Water bodies76.581.569.996.32011.310.27.1
PA: producer’s accuracy, UA: user’s accuracy, Ce: commission error, and Oe: omission error.
Table 3. Area of land cover classes and their percentage change during studied time periods.
Land-Use Classes20002020Change Area (ha)
Area (ha)Area (%)Area (ha)Area (%)
Built-up area2933.8726.134398.4339.181464.56
Bare lands2490.6122.181894.7816.88−595.83
Croplands5358.7547.734391.7239.12−967.03
Green lands223.511.99295.382.6371.87
Water bodies220.471.96247.072.2026.60
Table 4. Matrix of land-use class changes from 2000 to 2020.
Land-Use Classes2000Total
Built-Up AreaBare LandsCroplandsGreen LandsWater Bodies
2020Built-up area2633.05793.41648.7392.060.691464.562633.05
Bare lands165.32505.46132361.732.54−595.83165.32
Croplands64.981105.533277.786.632.64−967.0364.98
Green lands69.2371.4494.5161.2071.8769.23
Water bodies2.9816.9511.11.62214.4926.602.98
Total2935.562492.795355.12223.24220.362935.56
Table 5. Land-use areas in 2030 and their change rate (%) compared to 2020.
Land-Use ClassesArea (ha)Change Rate (%)
20302020–2030
Built-up area5084.1915.59
Bare lands1604.88−15.30
Croplands3939.48−10.30
Green lands351.4518.98
Water bodies246.06−0.41
Table 6. The calculated brownfield sites that have the potential to be used as infill development.
Infill Development PotentialArea (ha)Area (%)Land Demand (2030)
Military land use118.811.88685.76
Worn-out urban textures220.922.09
Abandoned warehouse40.14.01
Barren lands *620.162.02
Total999.9
* Areas located inside urban boundaries.
Table 7. Area and population of the of the Ardabil city in the Master Plan and this research results for 2020 and 2030.
Data SourceArea (ha)Population
Master planPlanning year, 19912780.47334,251
Projected year, 20046113.4599,059
Research findingsStudy year, 20204398.43529,374
Projected year, 20305084.19611,544
Publisher’s Note: MDPI stays neutral with regard to jurisdictional claims in published maps and institutional affiliations.

