
Quantitative Evaluation of Urban Style at Street Level: A Case Study of Hengyang County, China

Abstract
:1. Introduction
- Appropriate evaluation indicators. Giving the urban style evaluation framework a solid theoretical grounding implies that indicators should be selected to ensure that the theoretical features of the urban space are comprehensively covered.
- Quantitative evaluation process. The process of evaluation methods should focus on quantitative methods to improve the scientificity and objectivity of the evaluation results;
- Evaluation results with high reference value. The evaluation results should be able to express the overall performance of the urban style and the performance of various indicators, and reflect their geospatial features, so that practical and effective planning strategies can be formulated.
2. Methodology
2.1. Theoretical Analysis
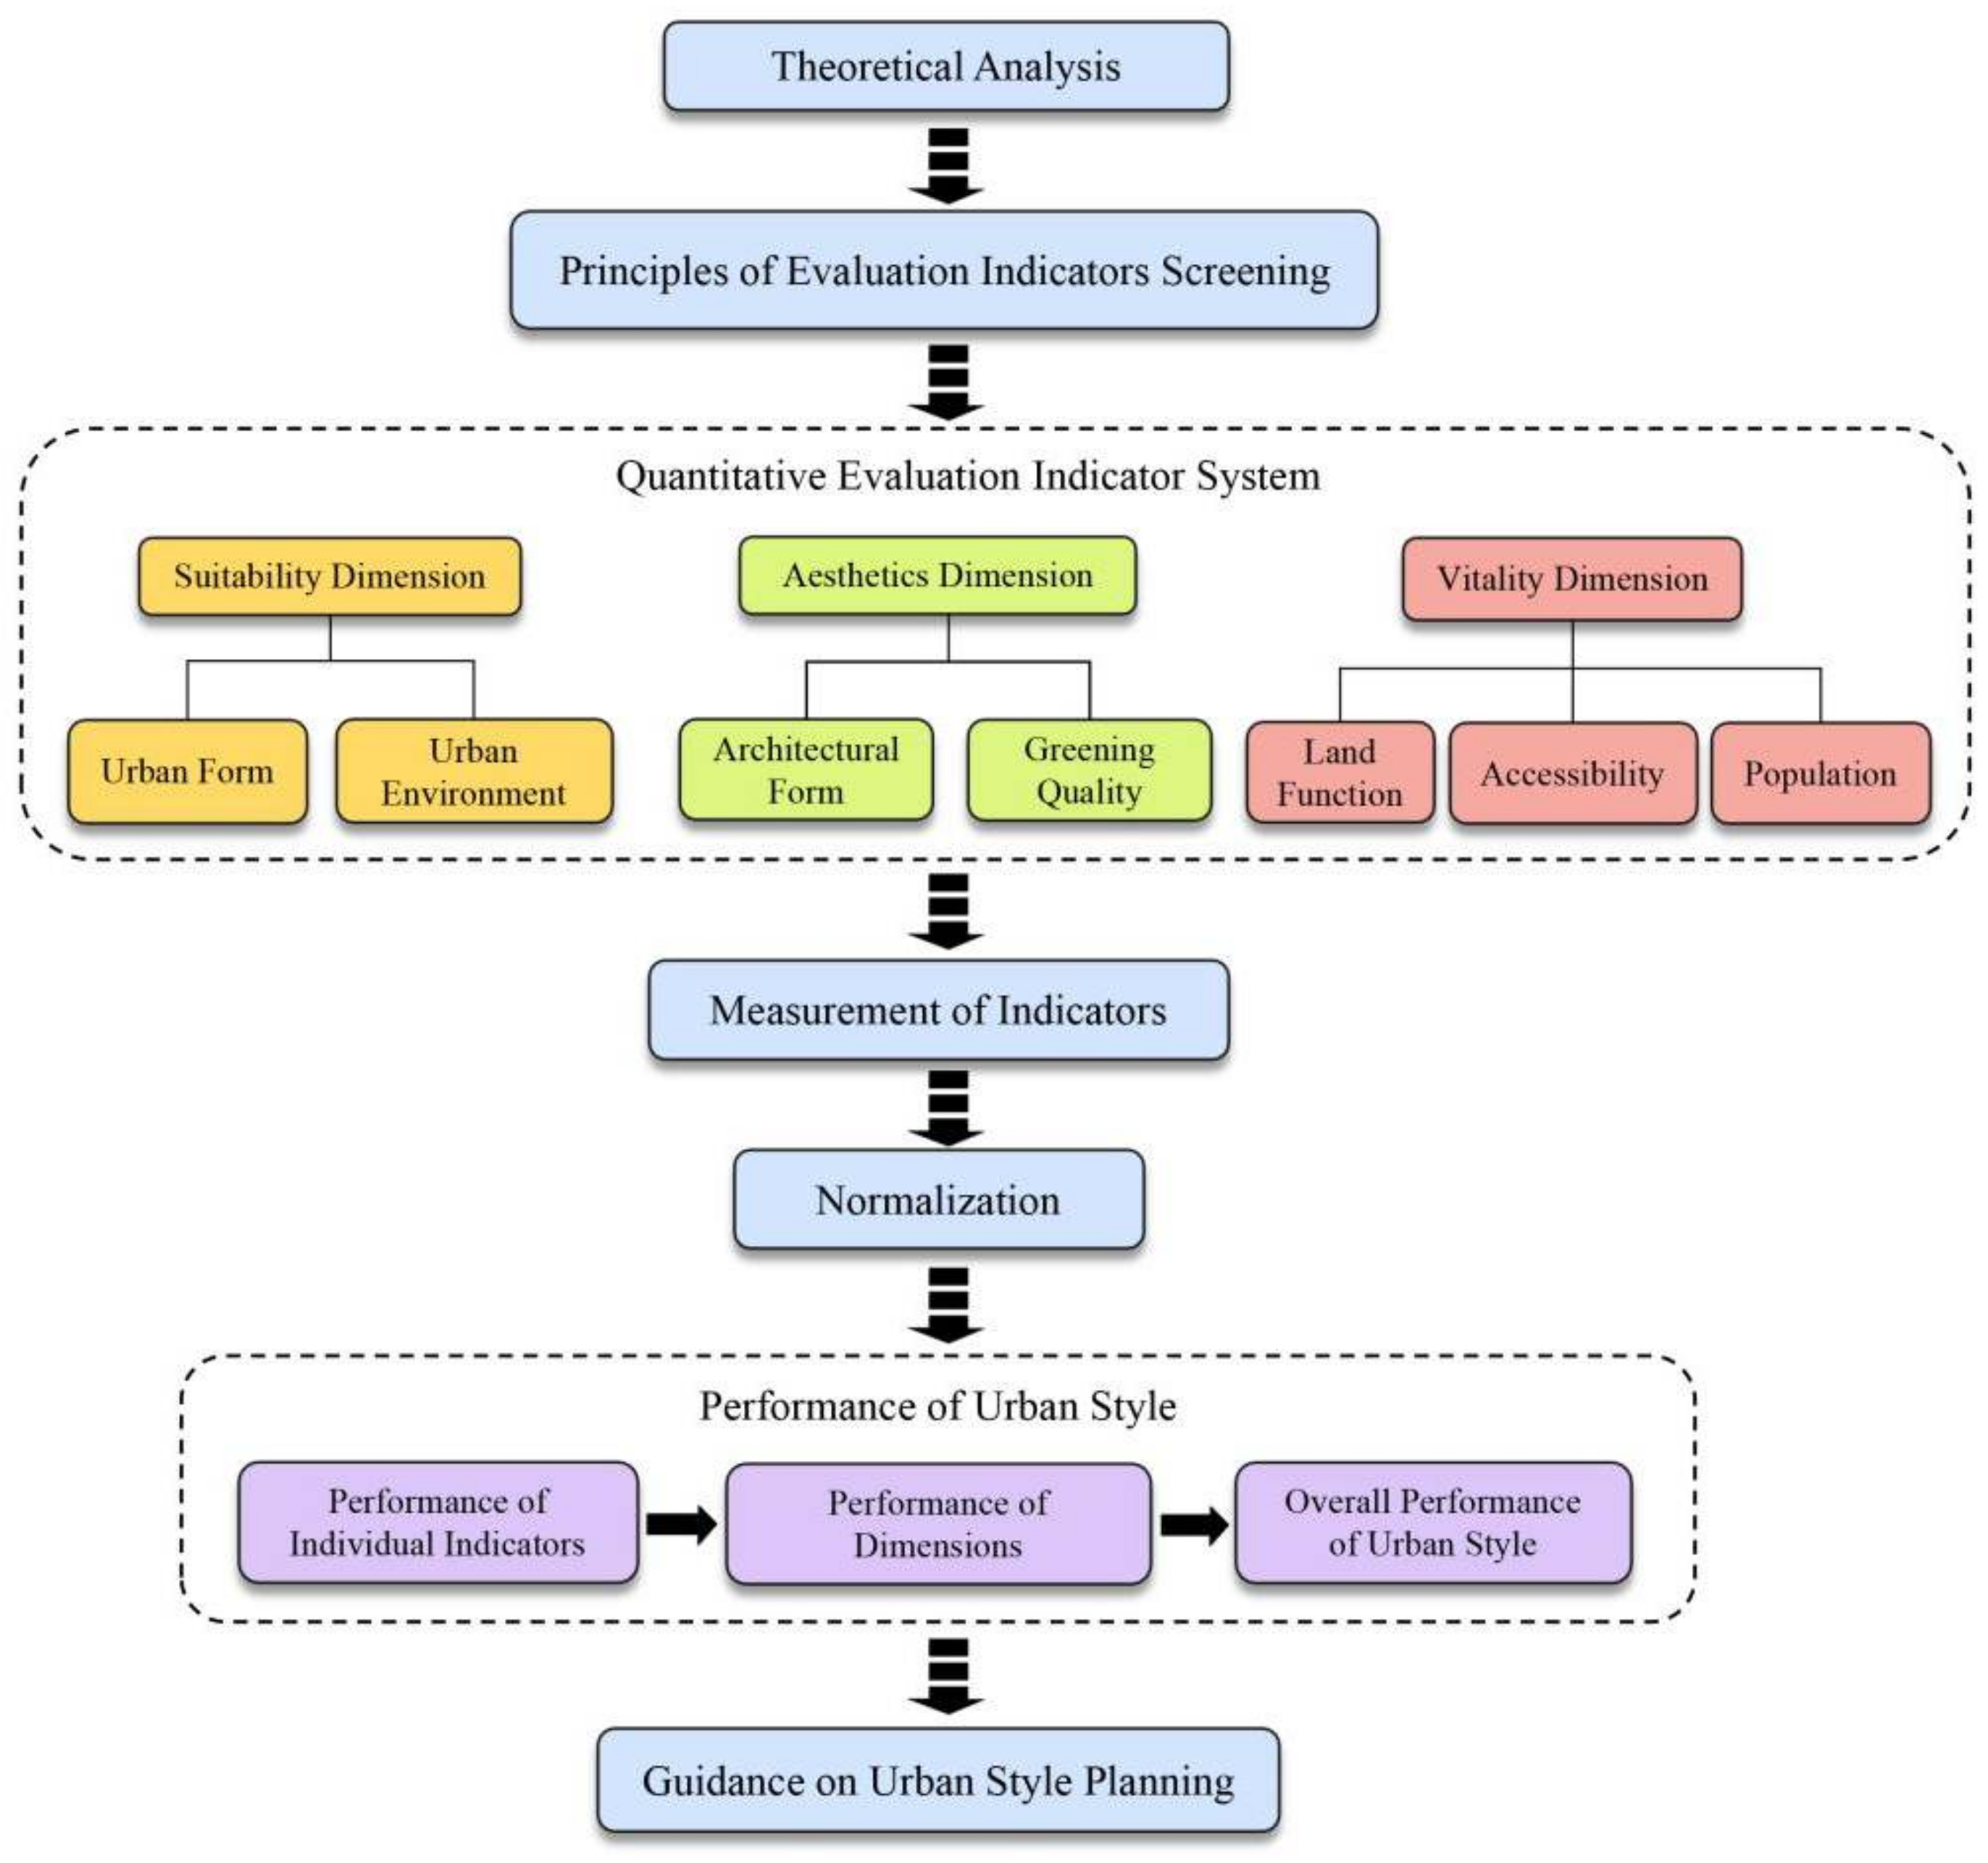
2.2. Research Framework
2.3. Criteria for Evaluation Indicator Screening
2.4. Indicator System for Quantitative Evaluation of Urban Style
2.4.1. Suitability
2.4.2. Aesthetics
2.4.3. Vitality
2.5. Main Data Types
2.6. Measurement of Indicators
2.6.1. Measurement of Suitability Indicators
2.6.2. Measurement of Aesthetics Indicators
2.6.3. Measurement of Vitality Indicators
2.7. Normalization
2.7.1. Relationship between Indicator Value and Its Performance Value
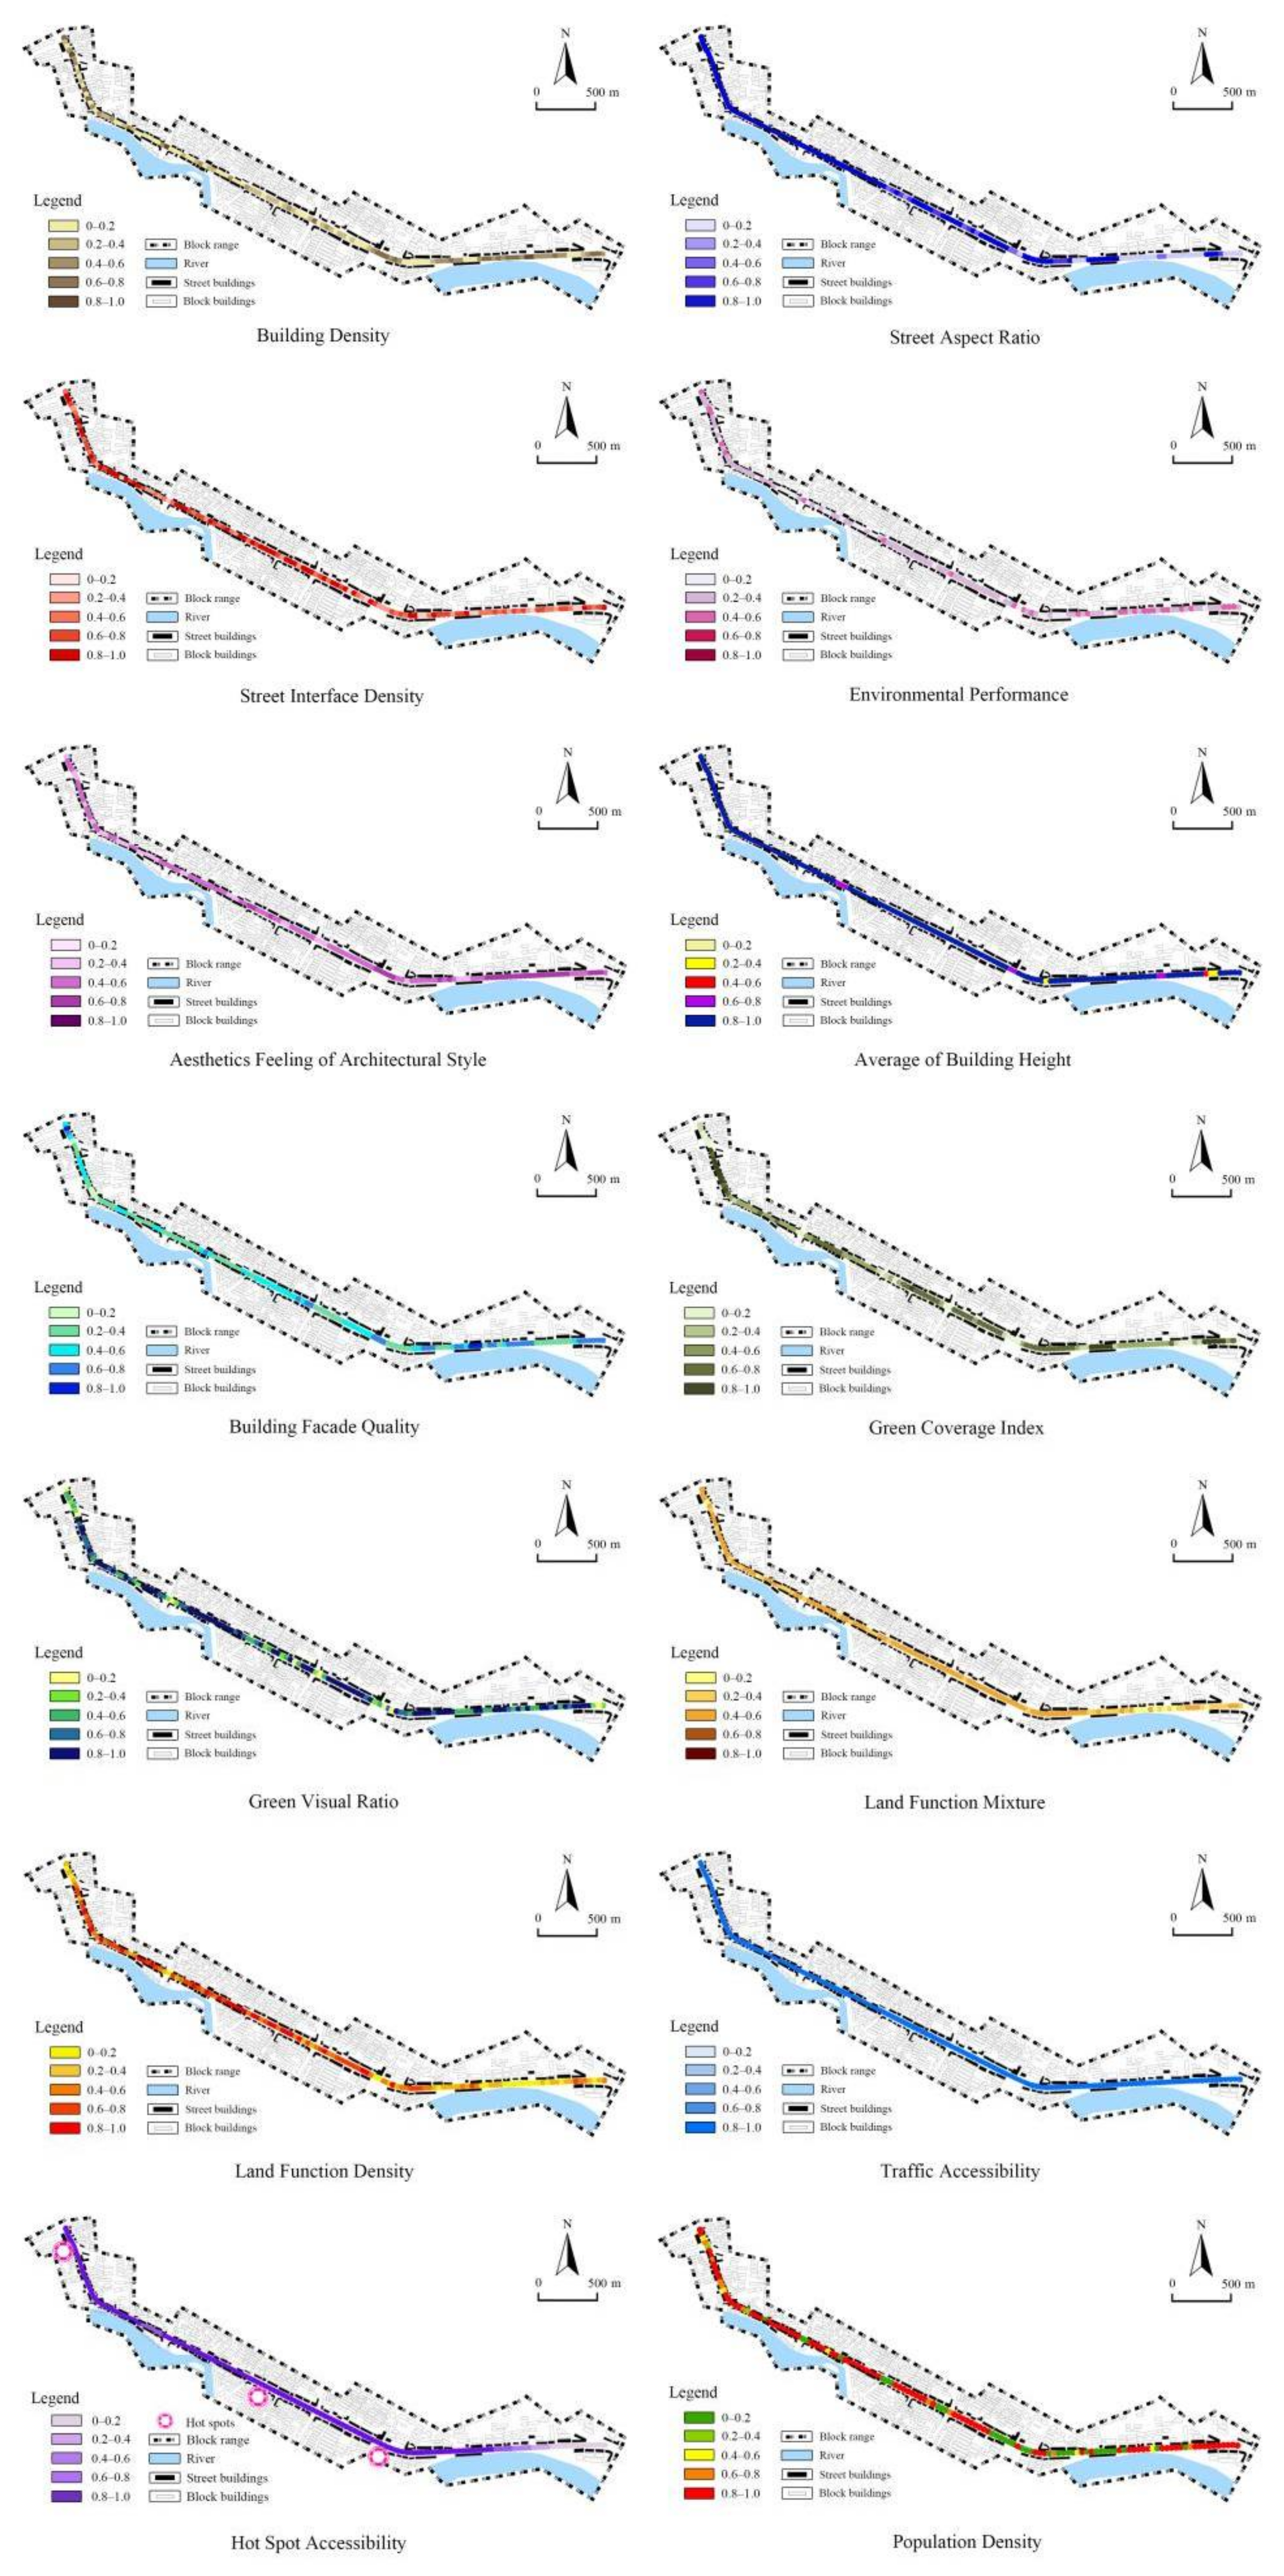
- Building Density
- Street Aspect Ratio
- Street Interface Density
- Environmental Performance
- Aesthetics of Architectural Style and Building Facade Quality
- Average of Building Height
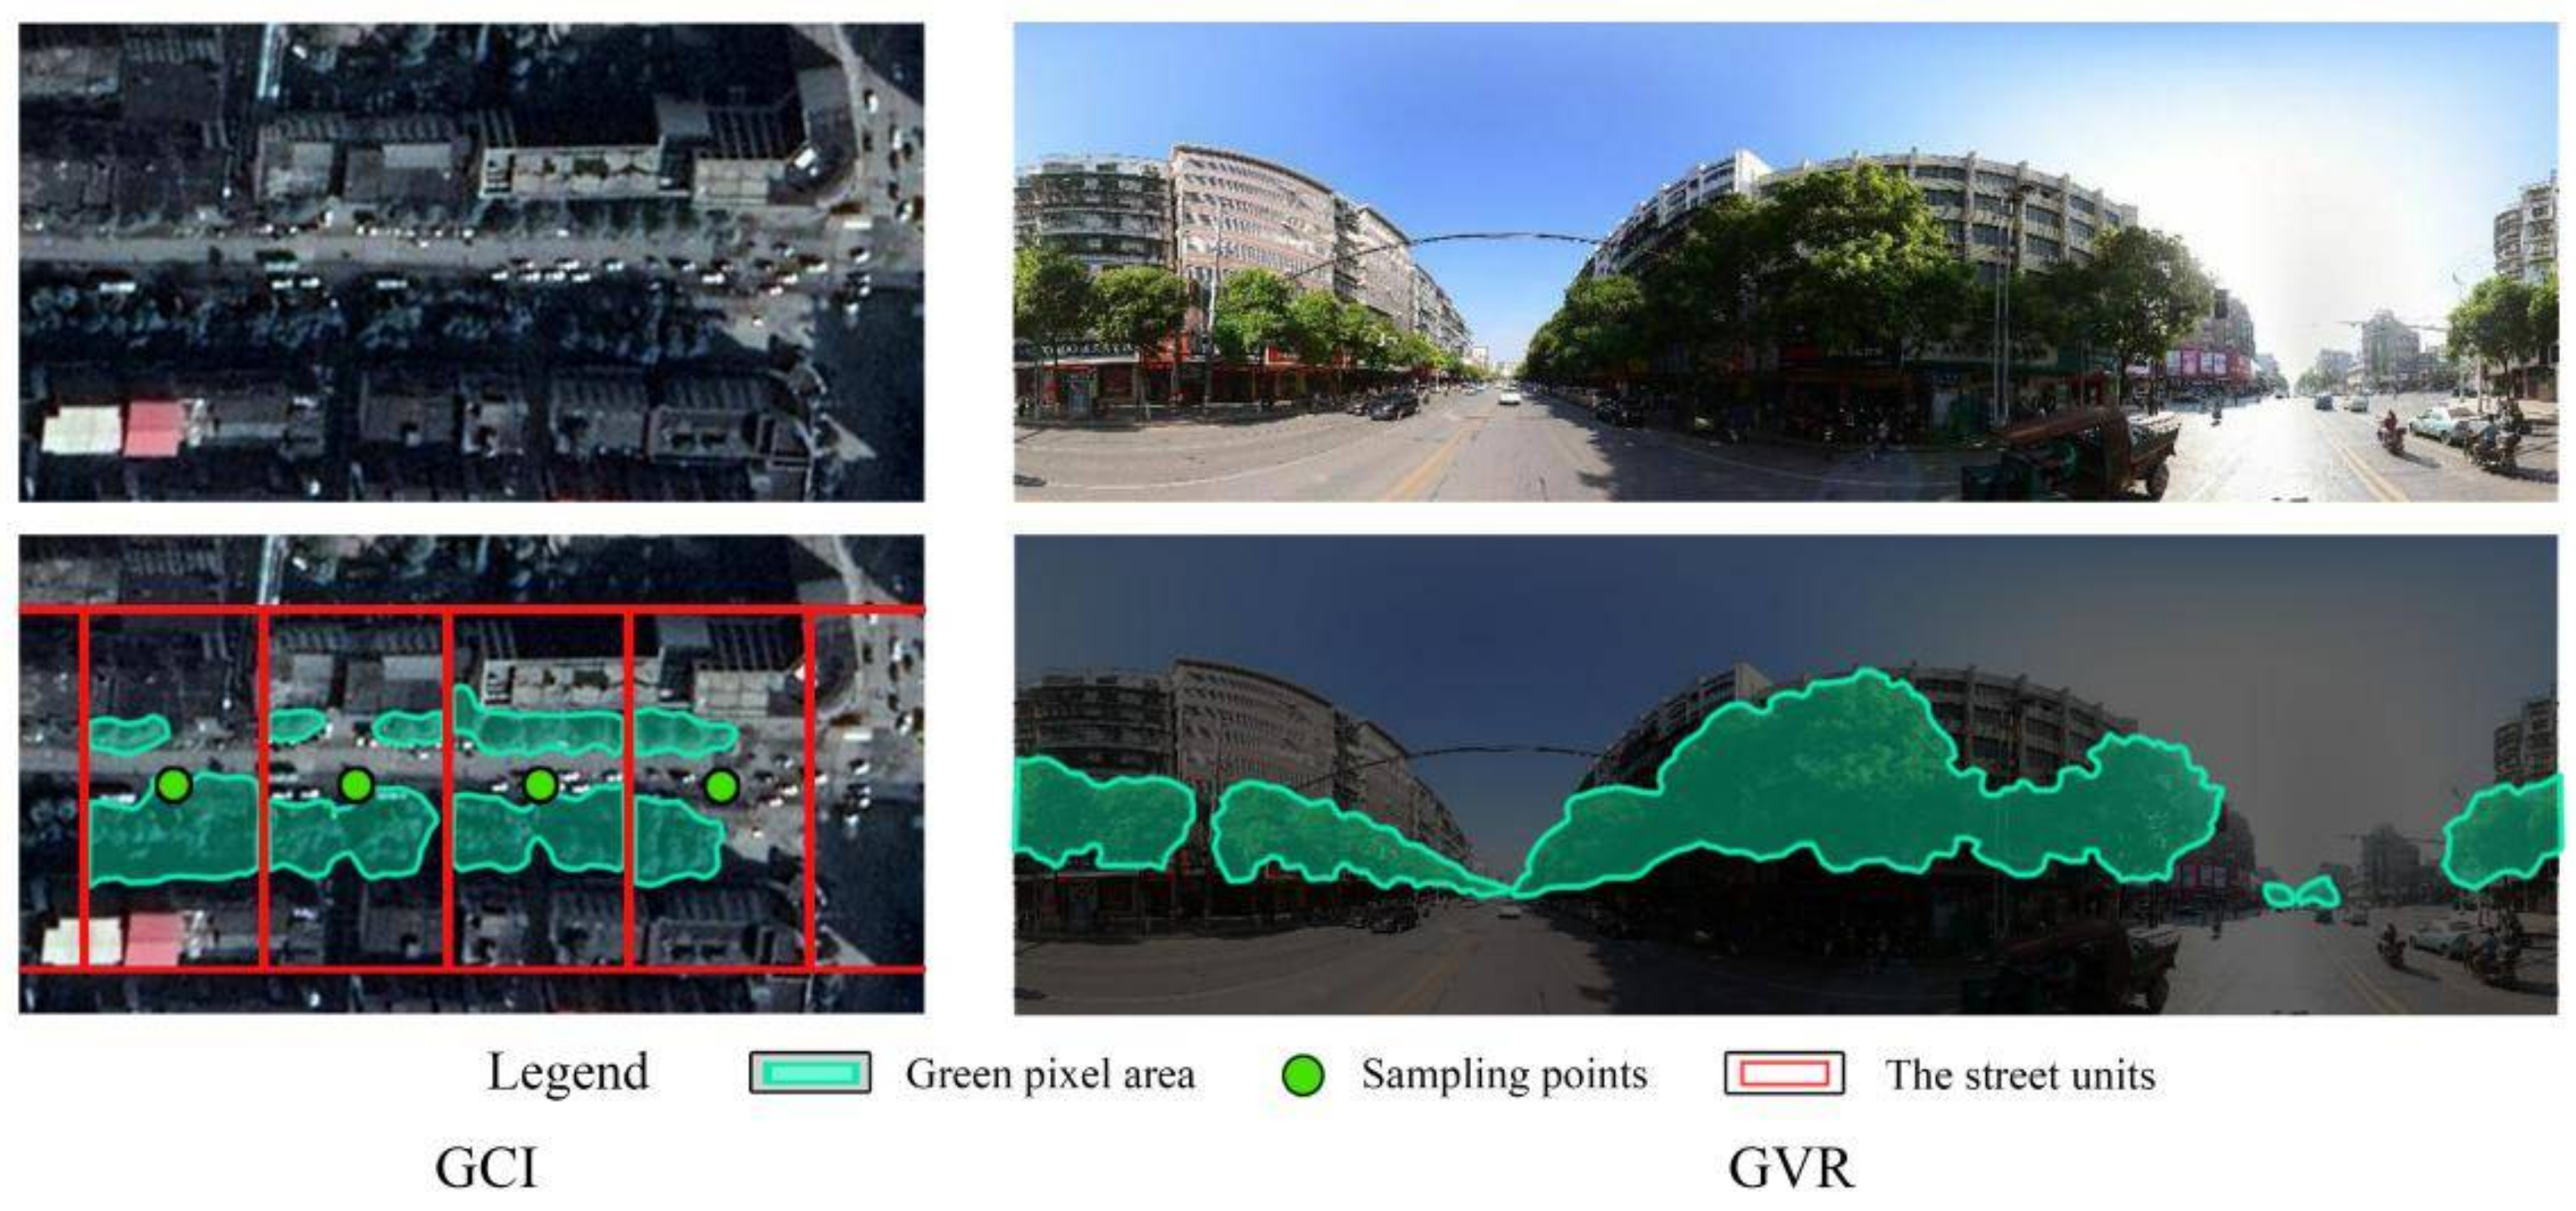
- Green Coverage Index
- Green Visual Ratio
- Land Fuction Mixture and Land Function Density
- Traffic Accessibility and Activity Accessibility
- Population Density
2.7.2. Normalization Method
2.8. Overlay Analysis
2.9. Application of Research Methods
2.10. Limitations
3. Study Area and Data Sources
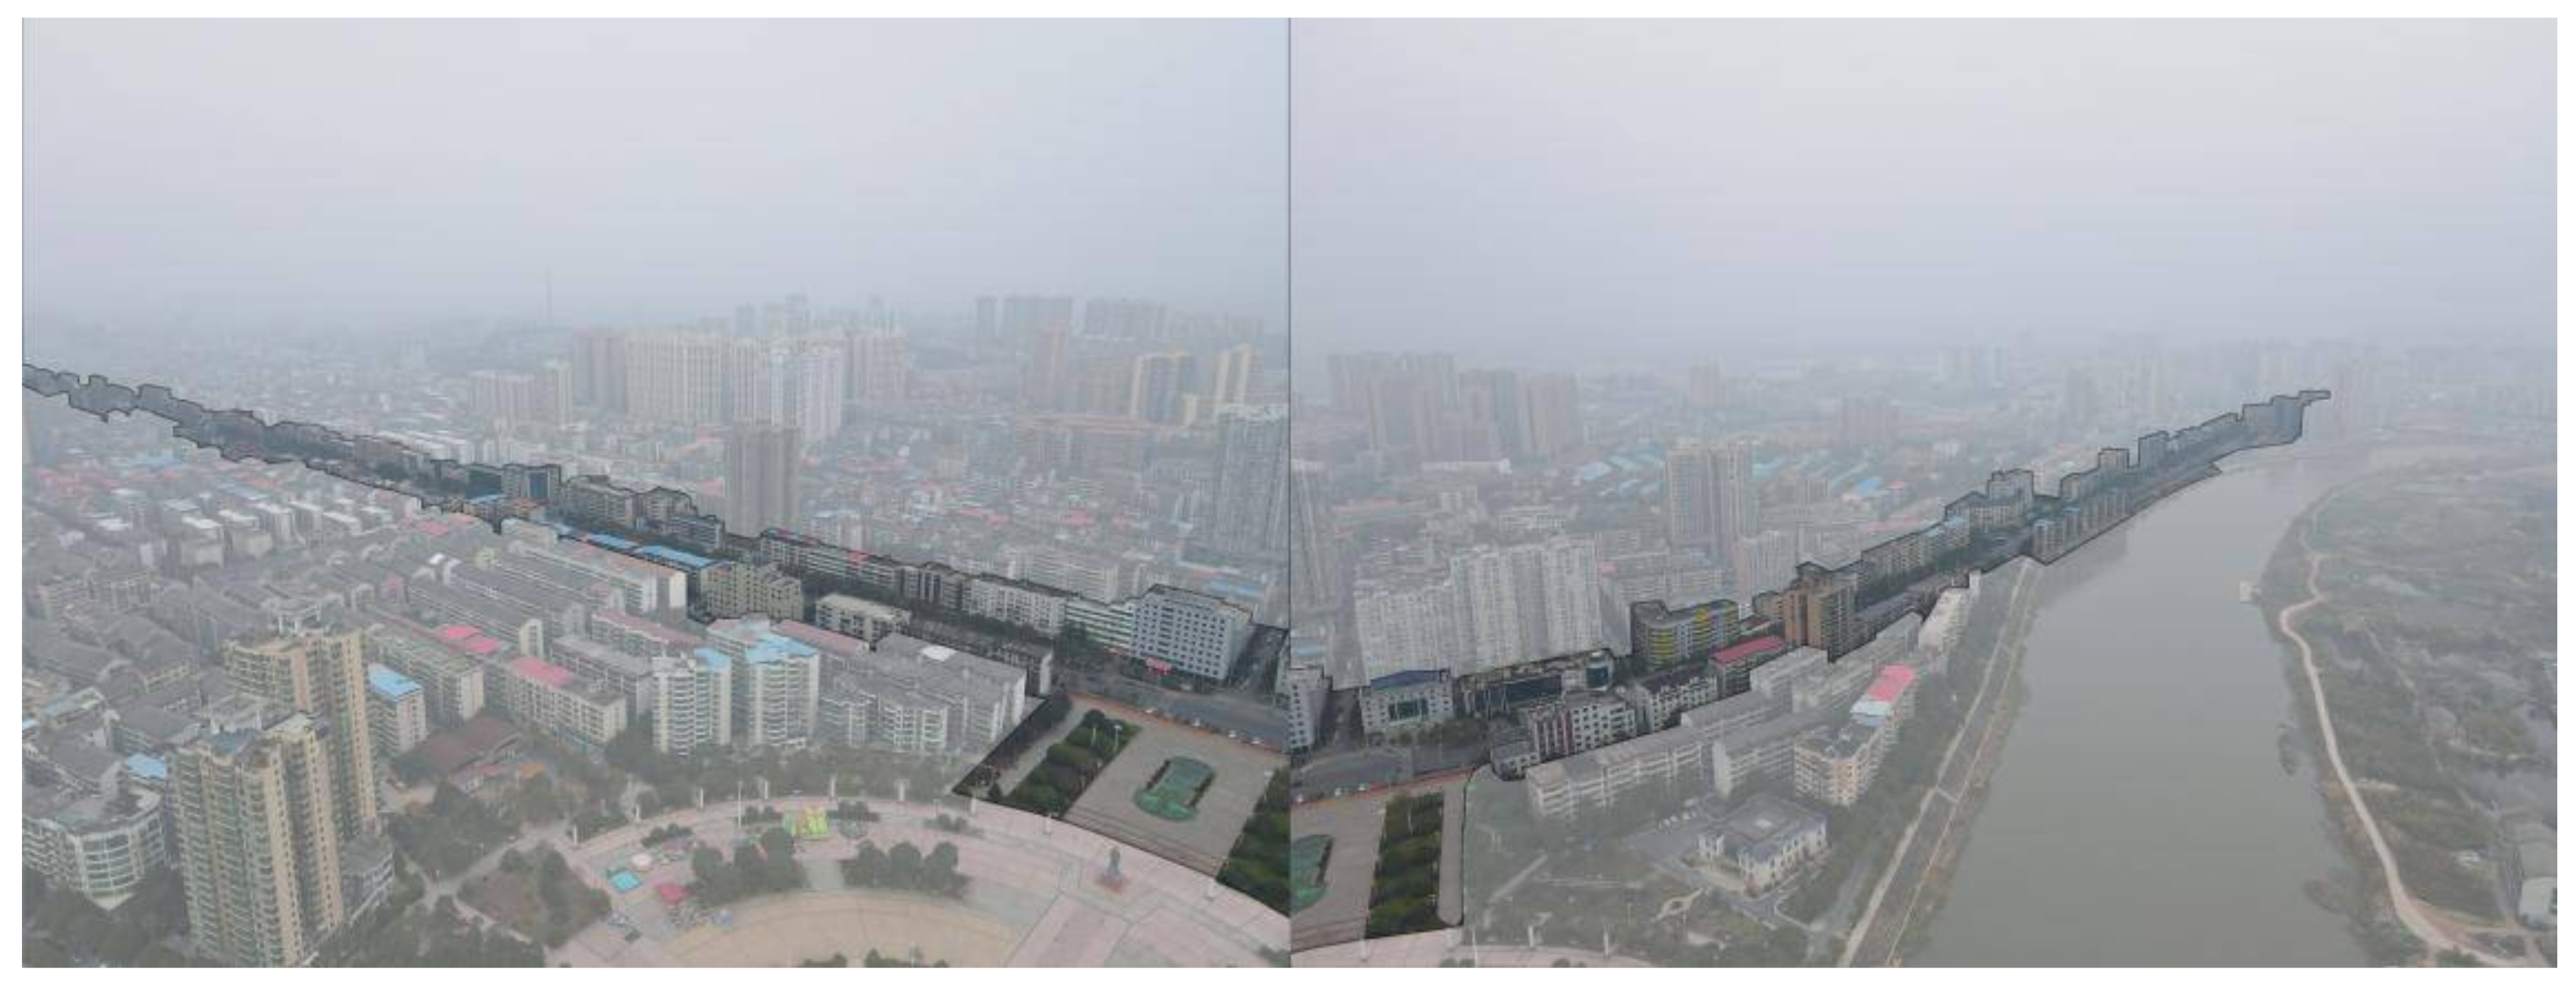
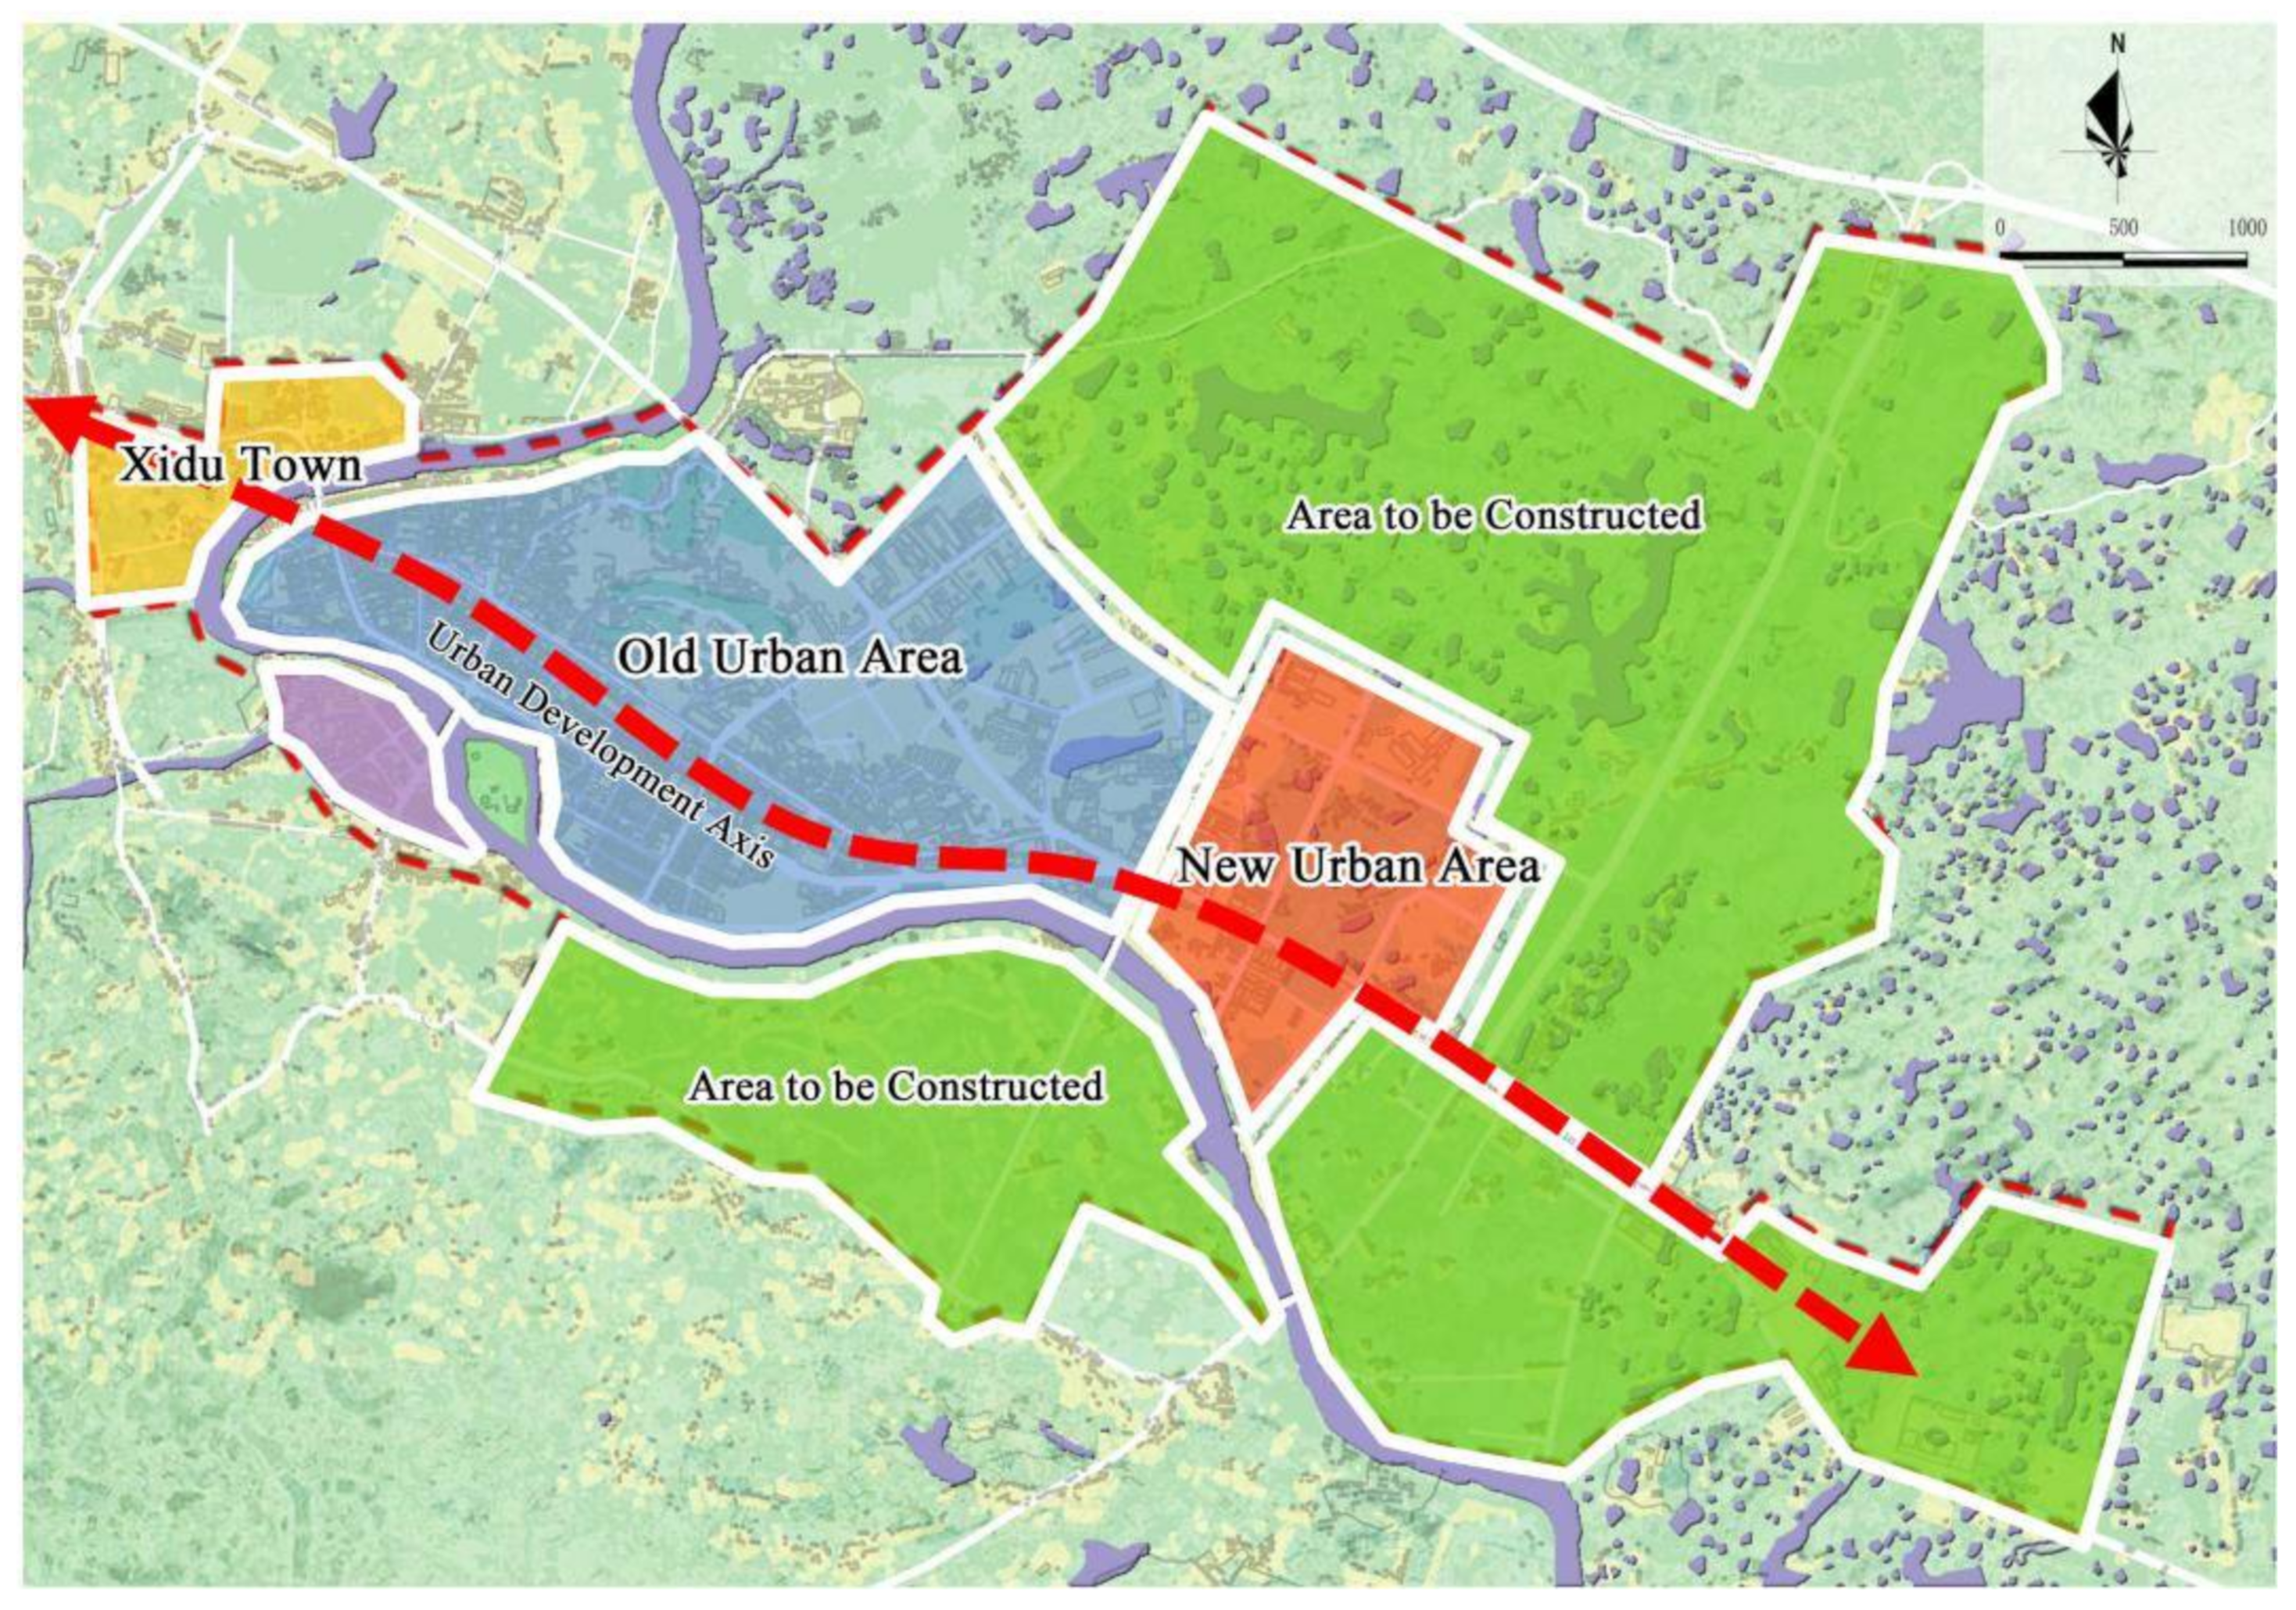
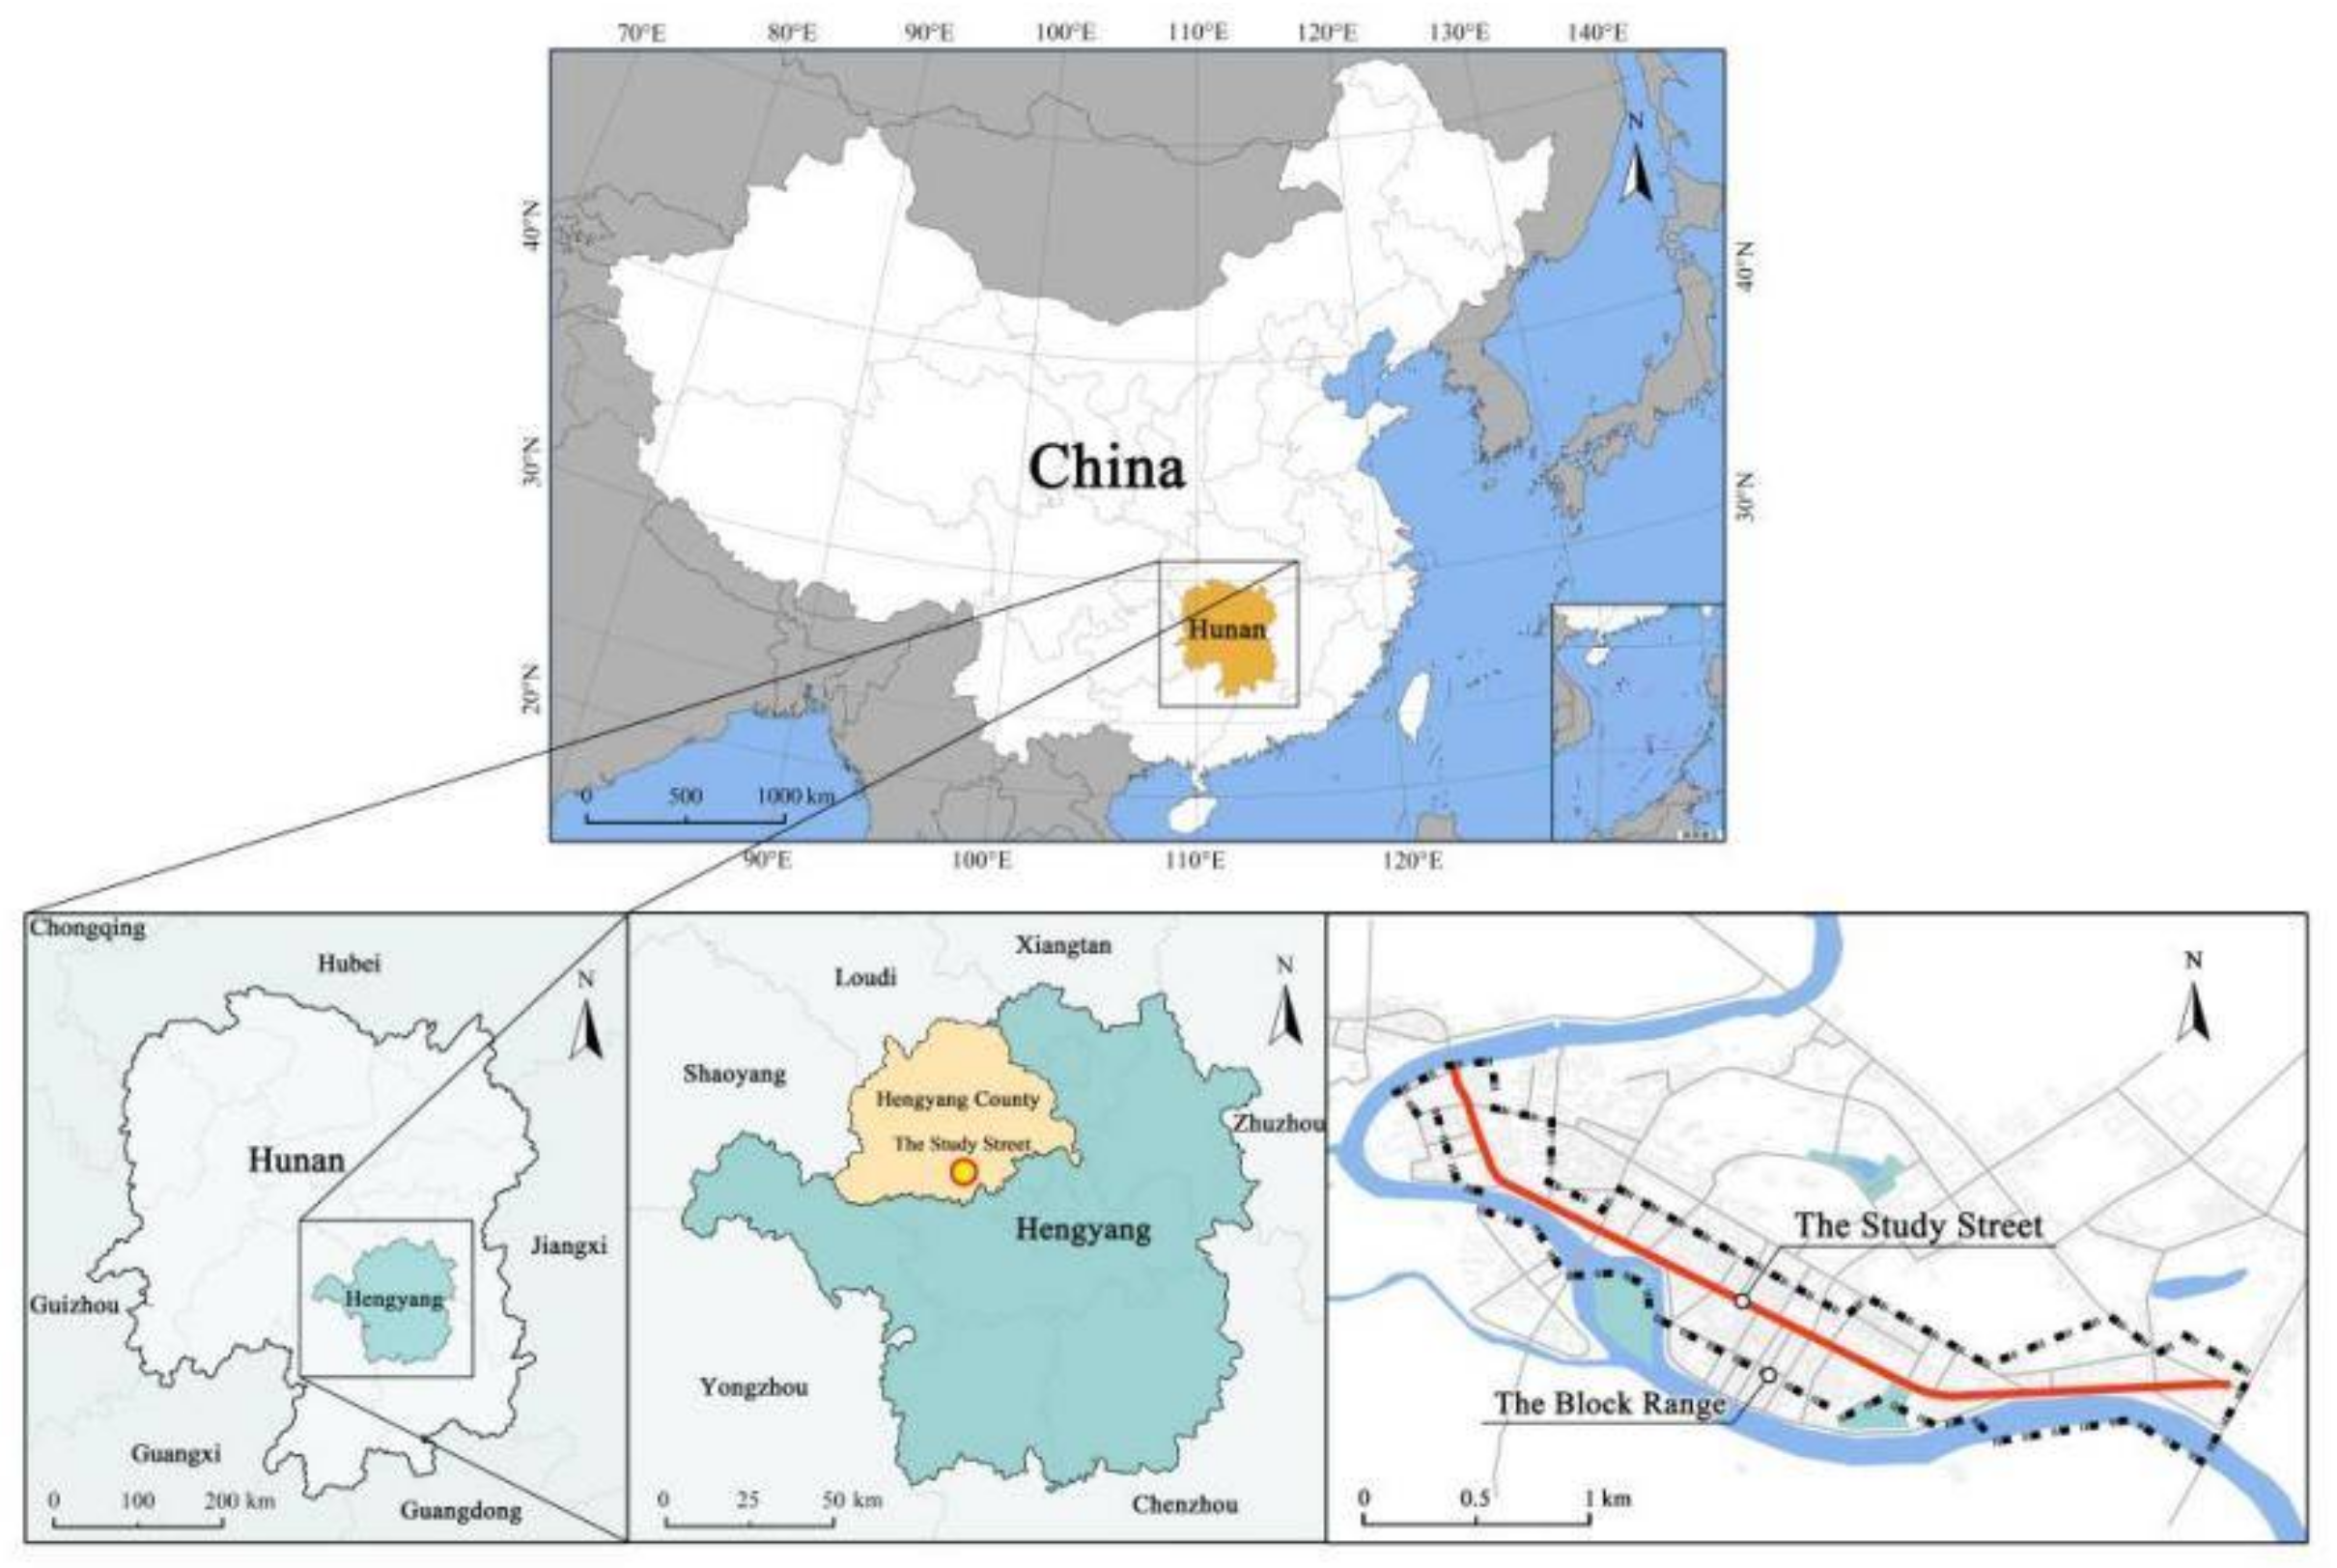
3.1. Study Area
3.2. Data Sources
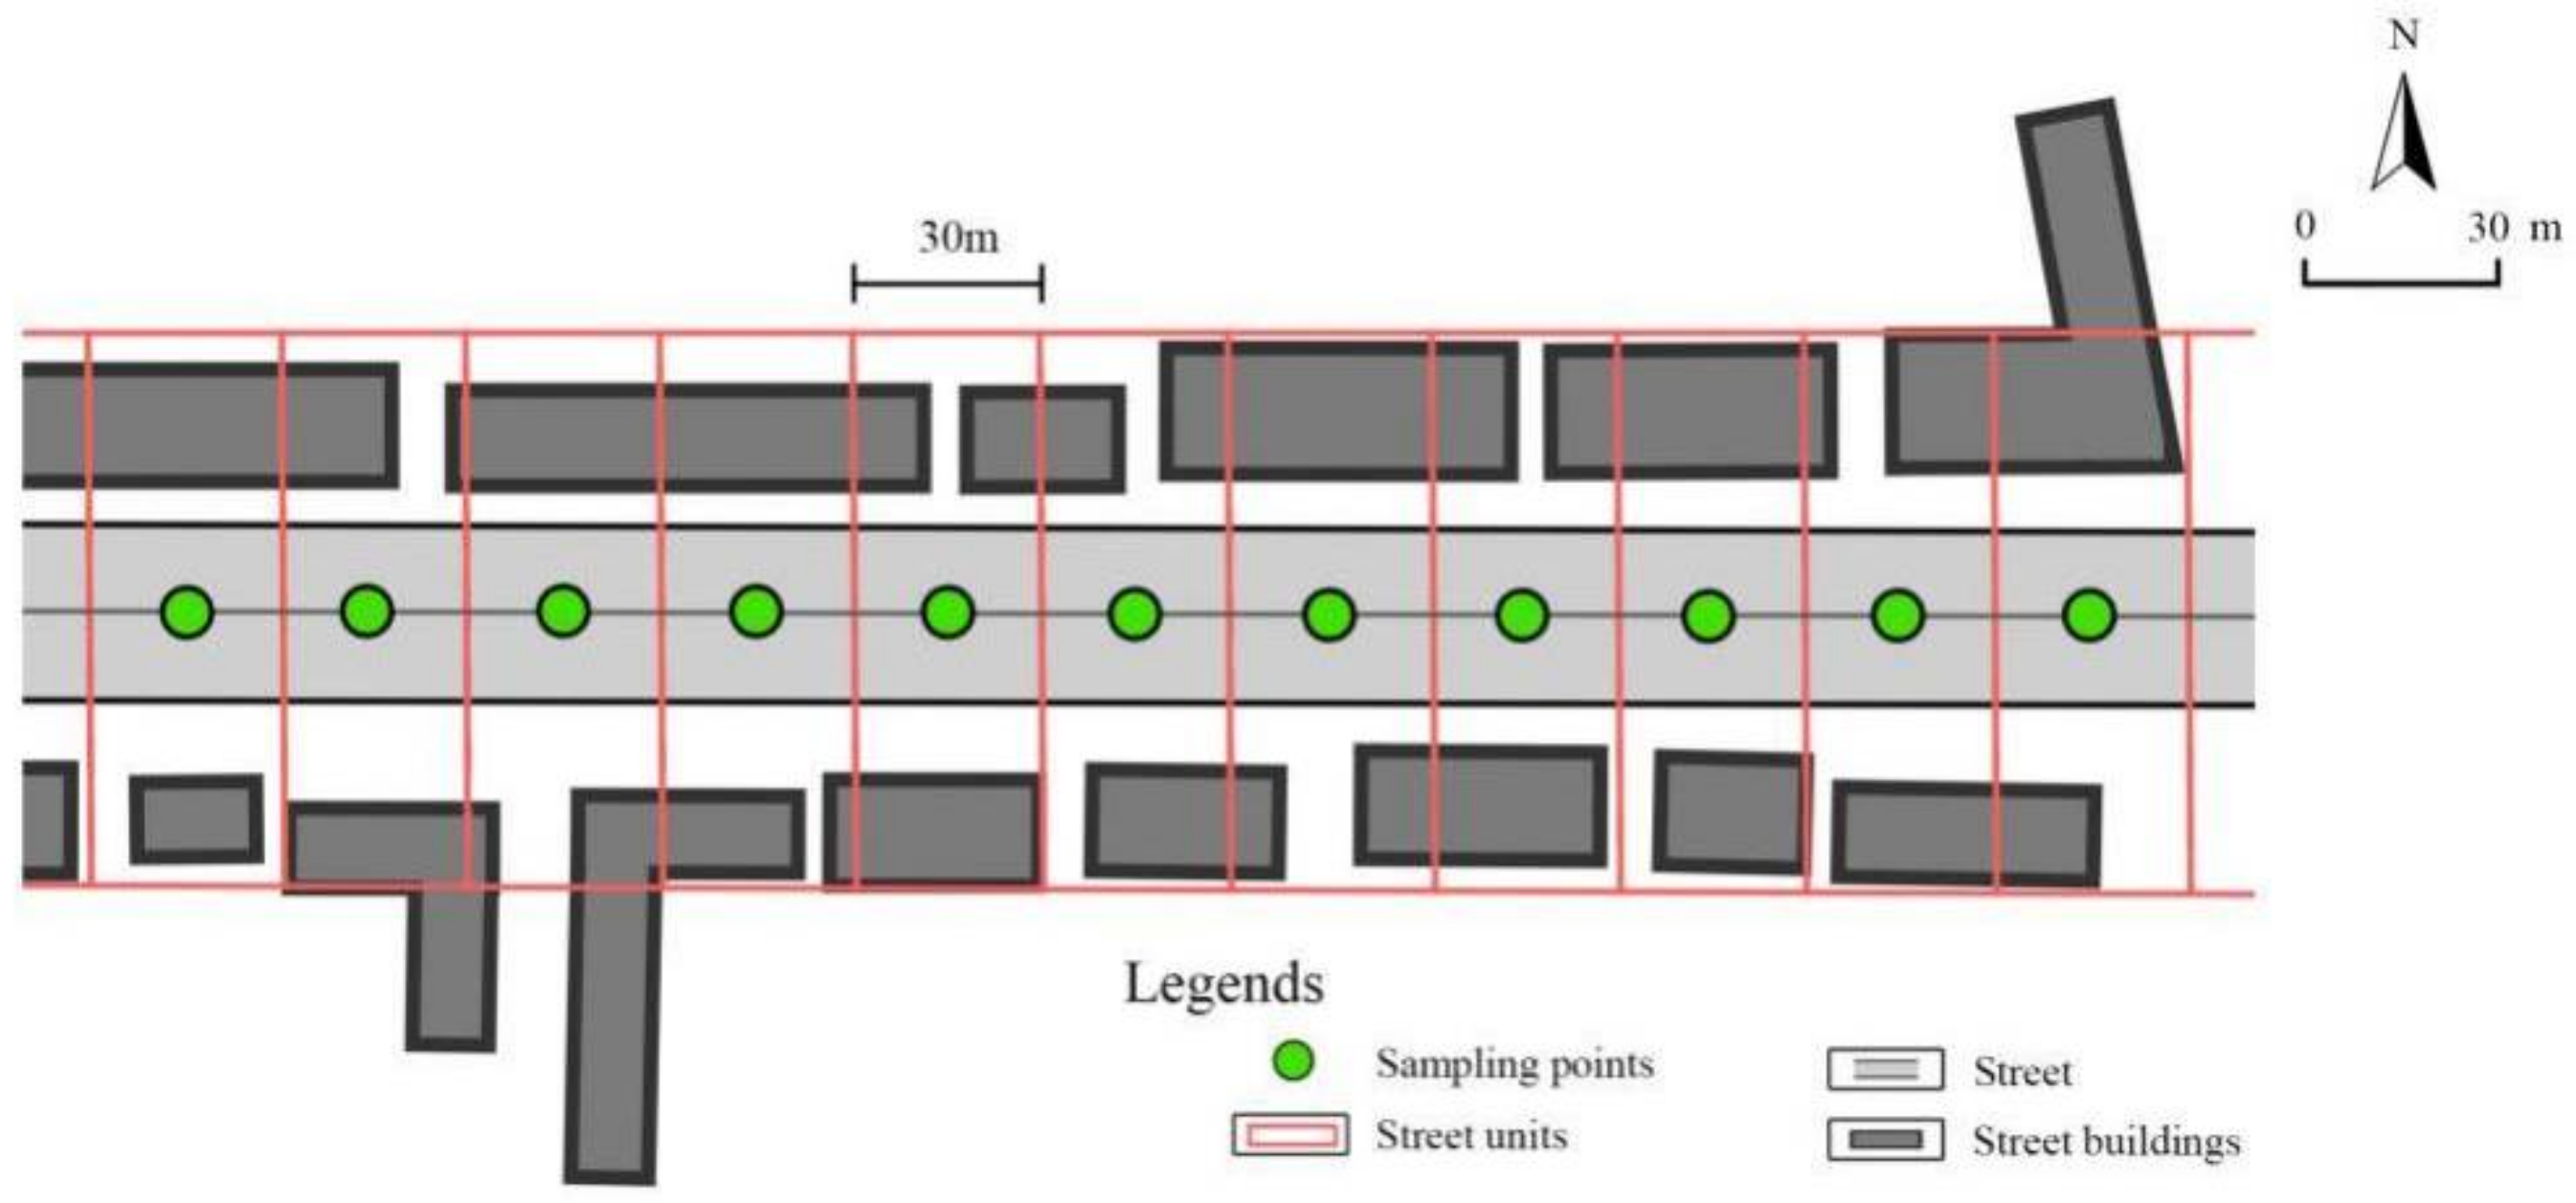
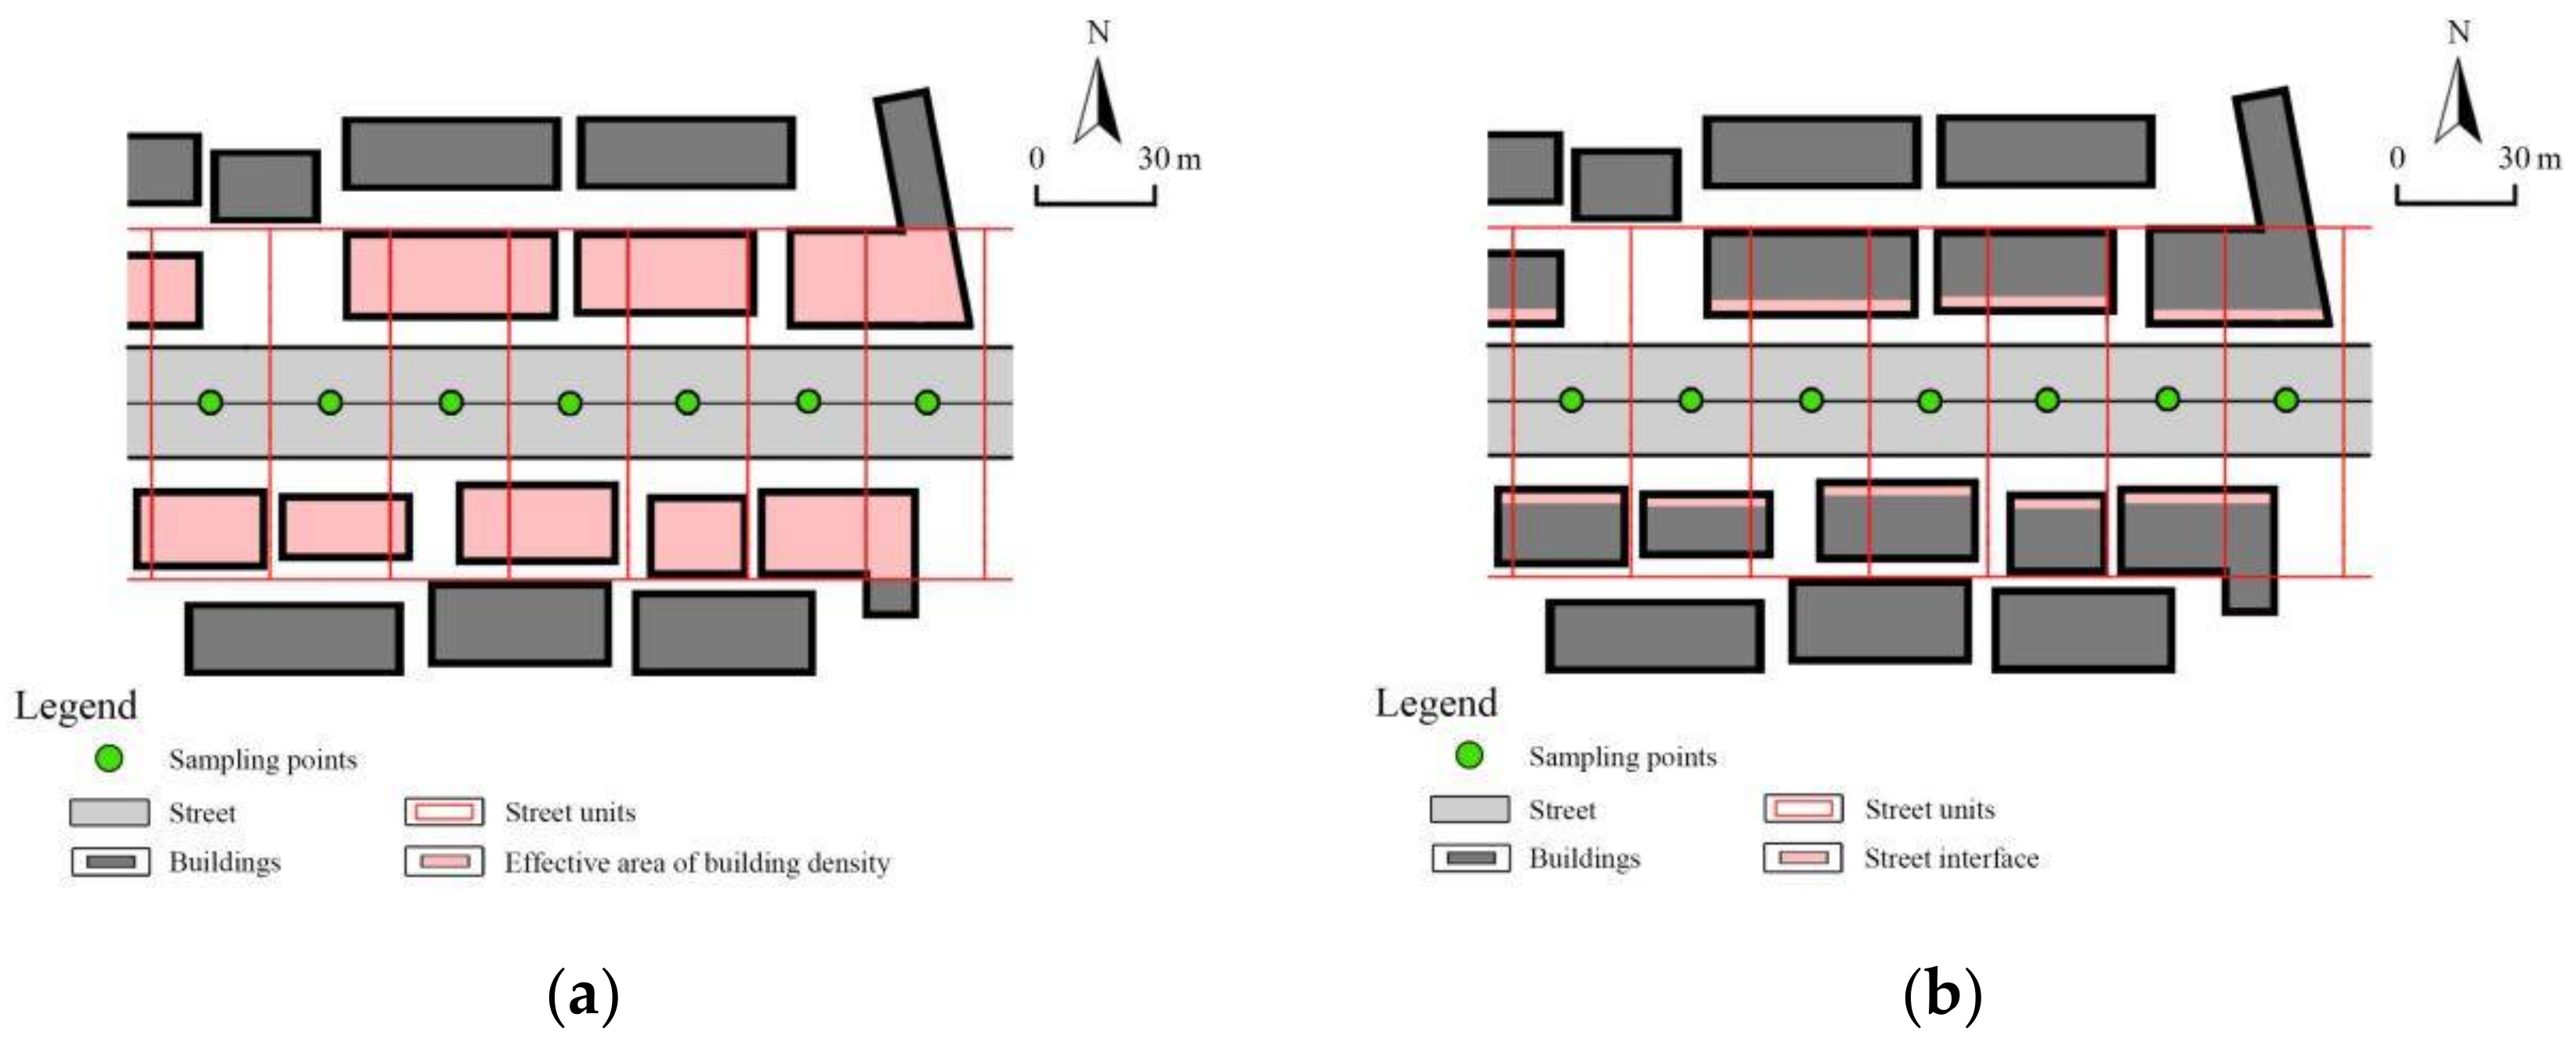
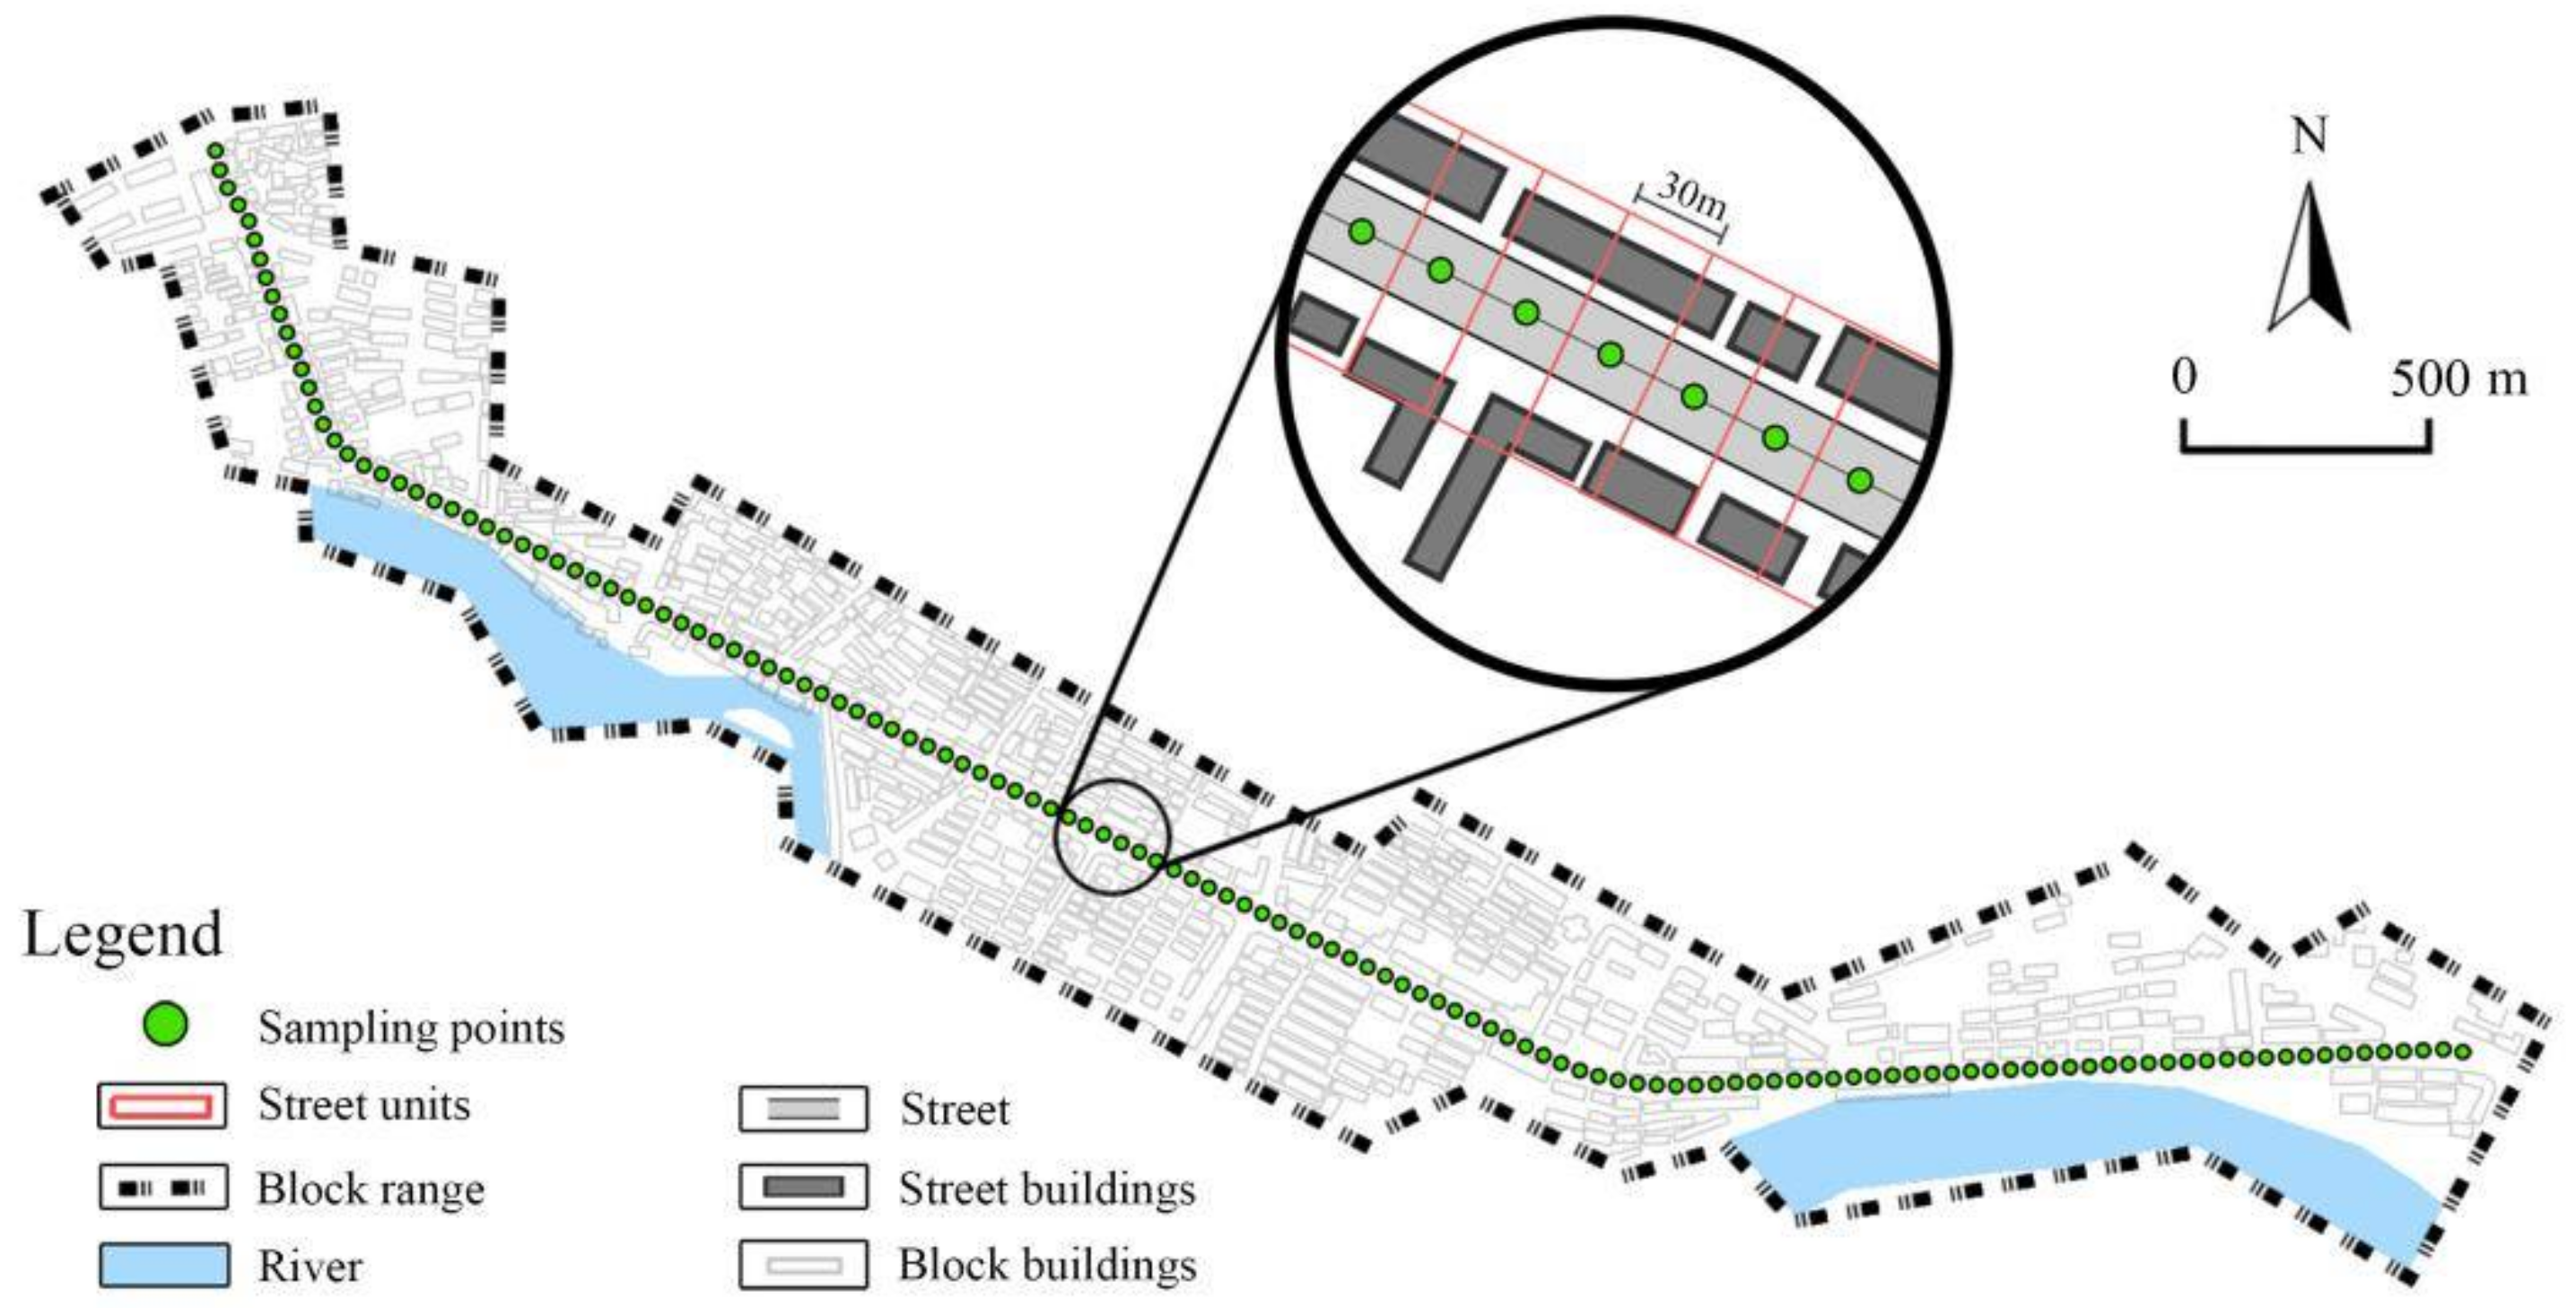
3.3. Sampling Points and Street Units
4. Results
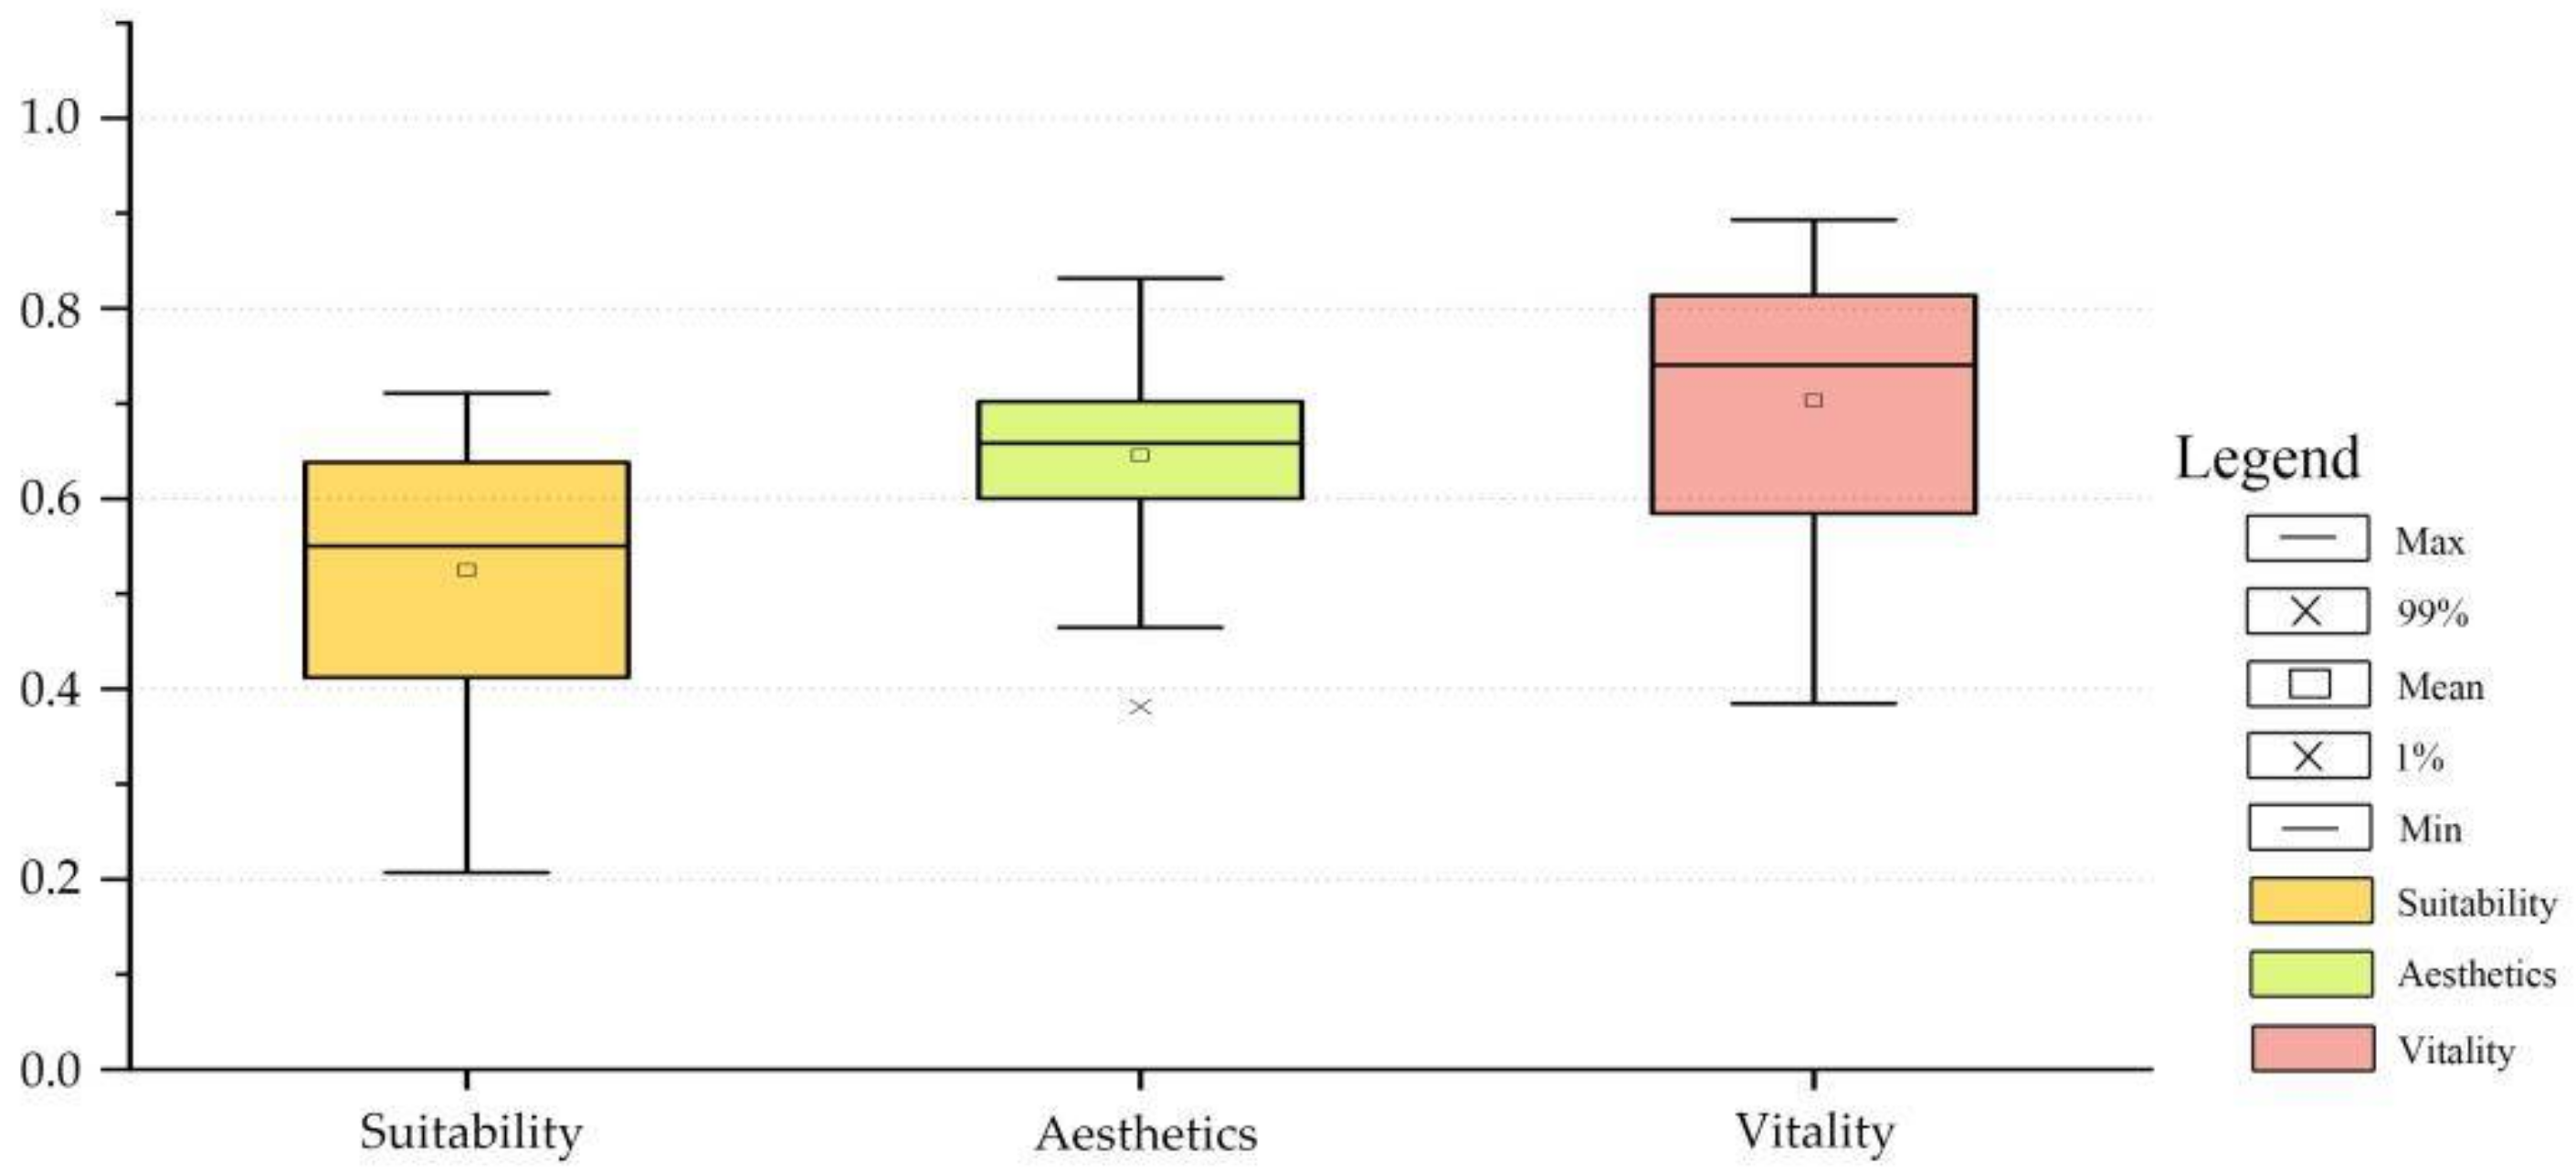
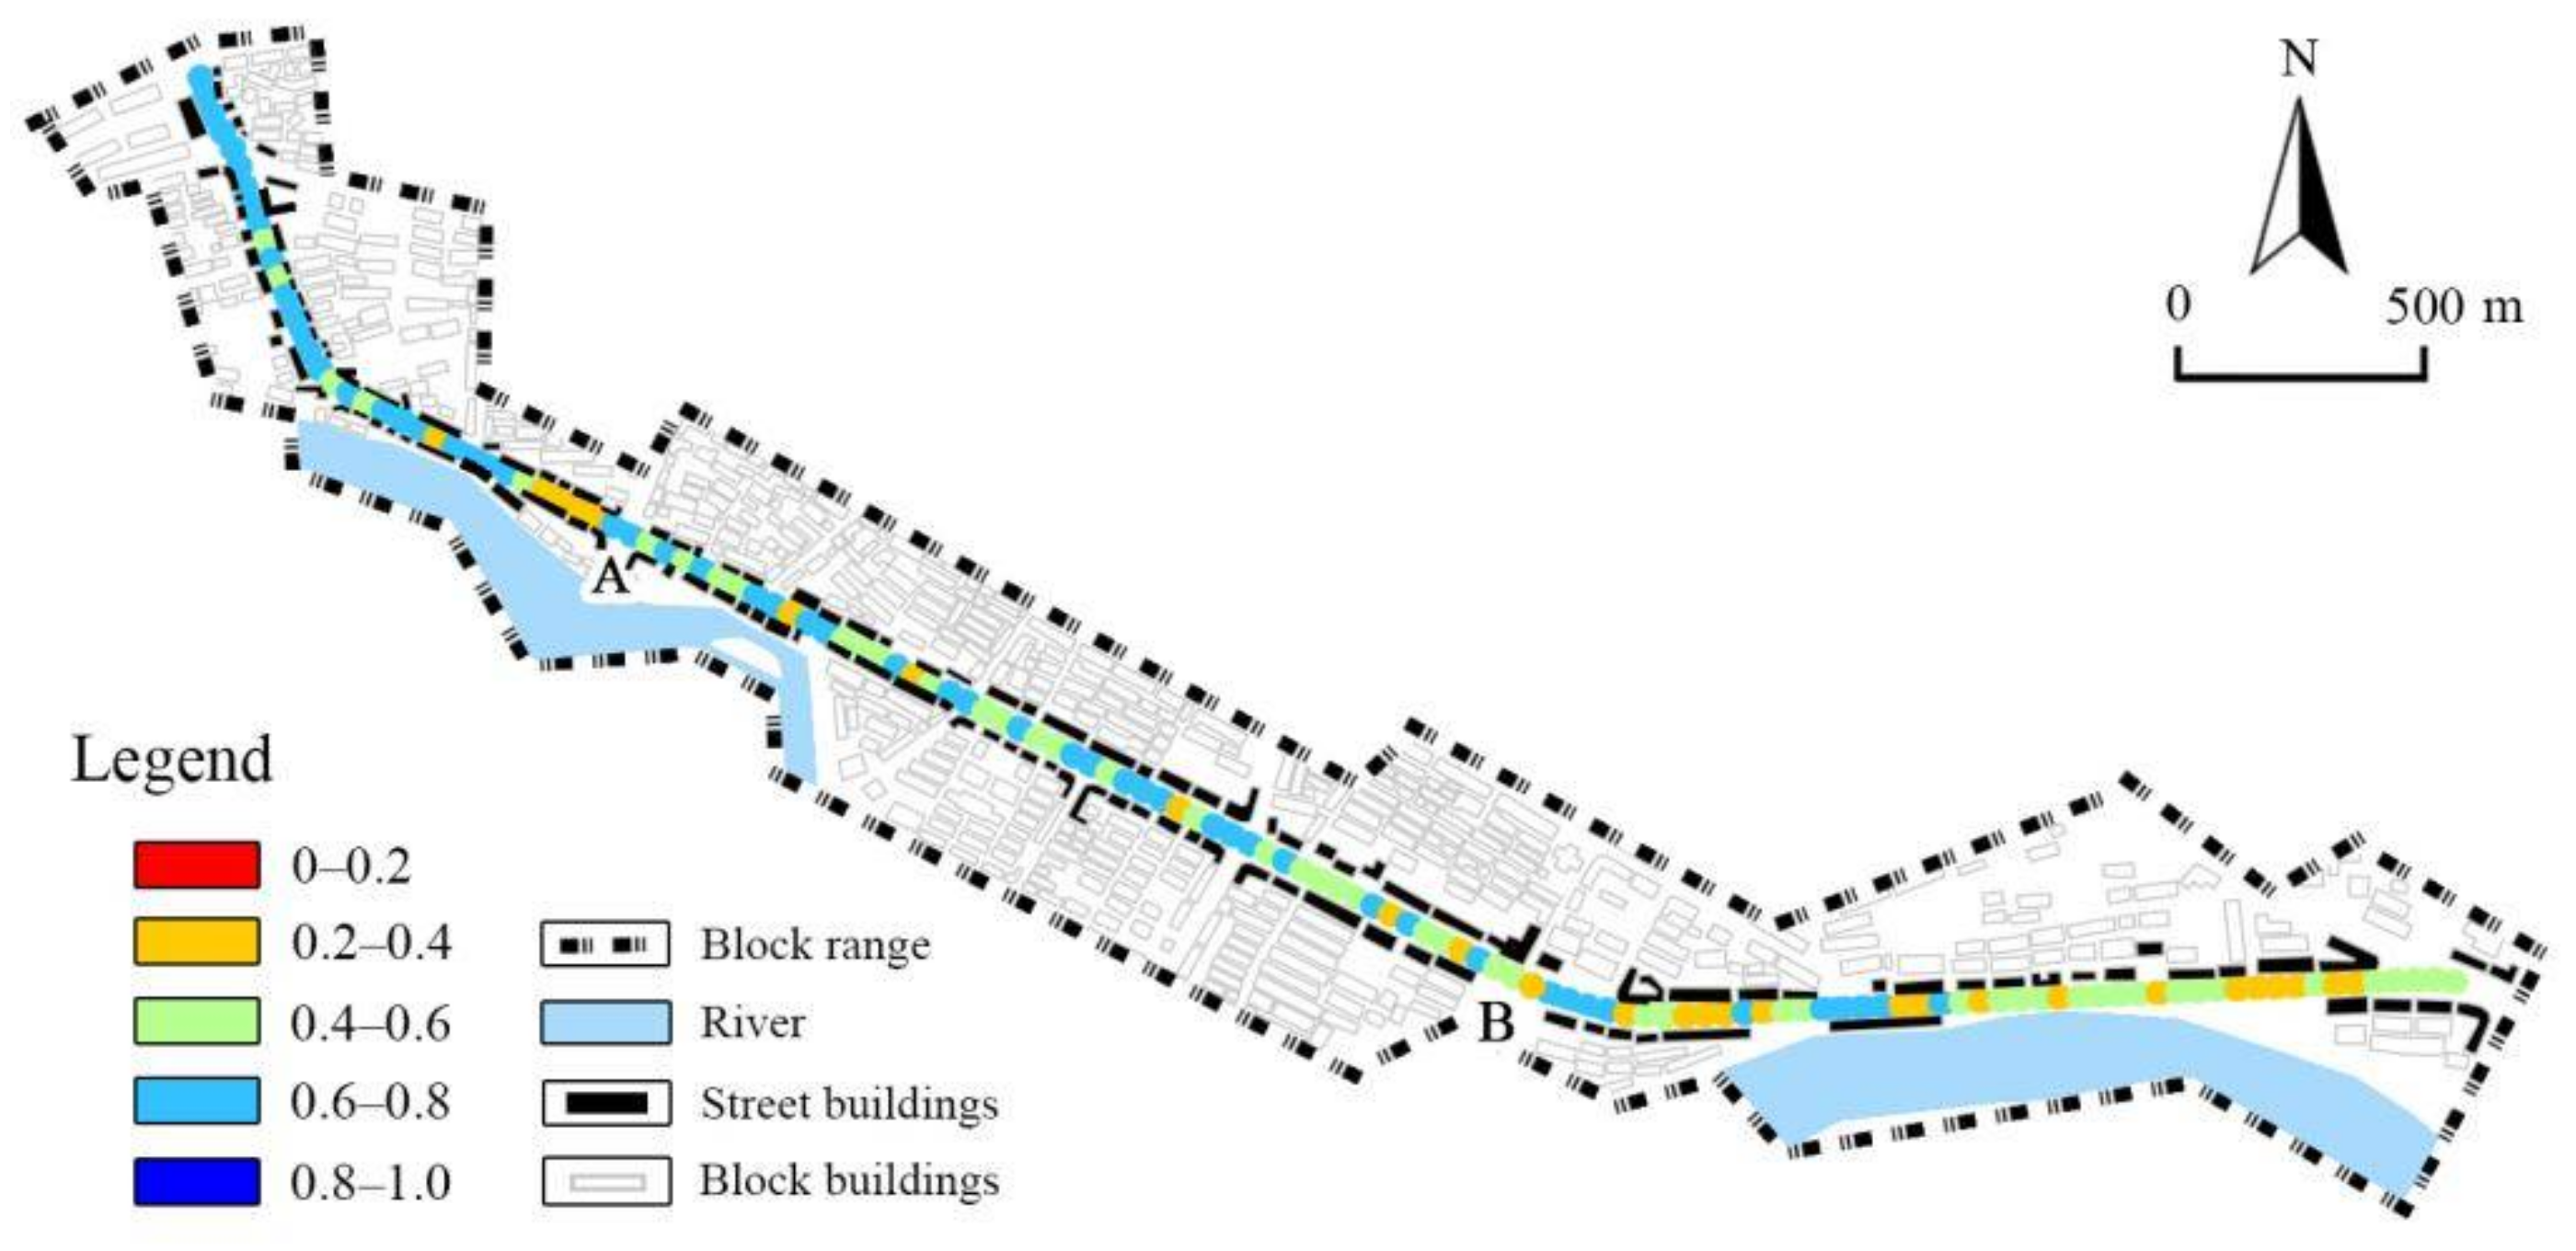
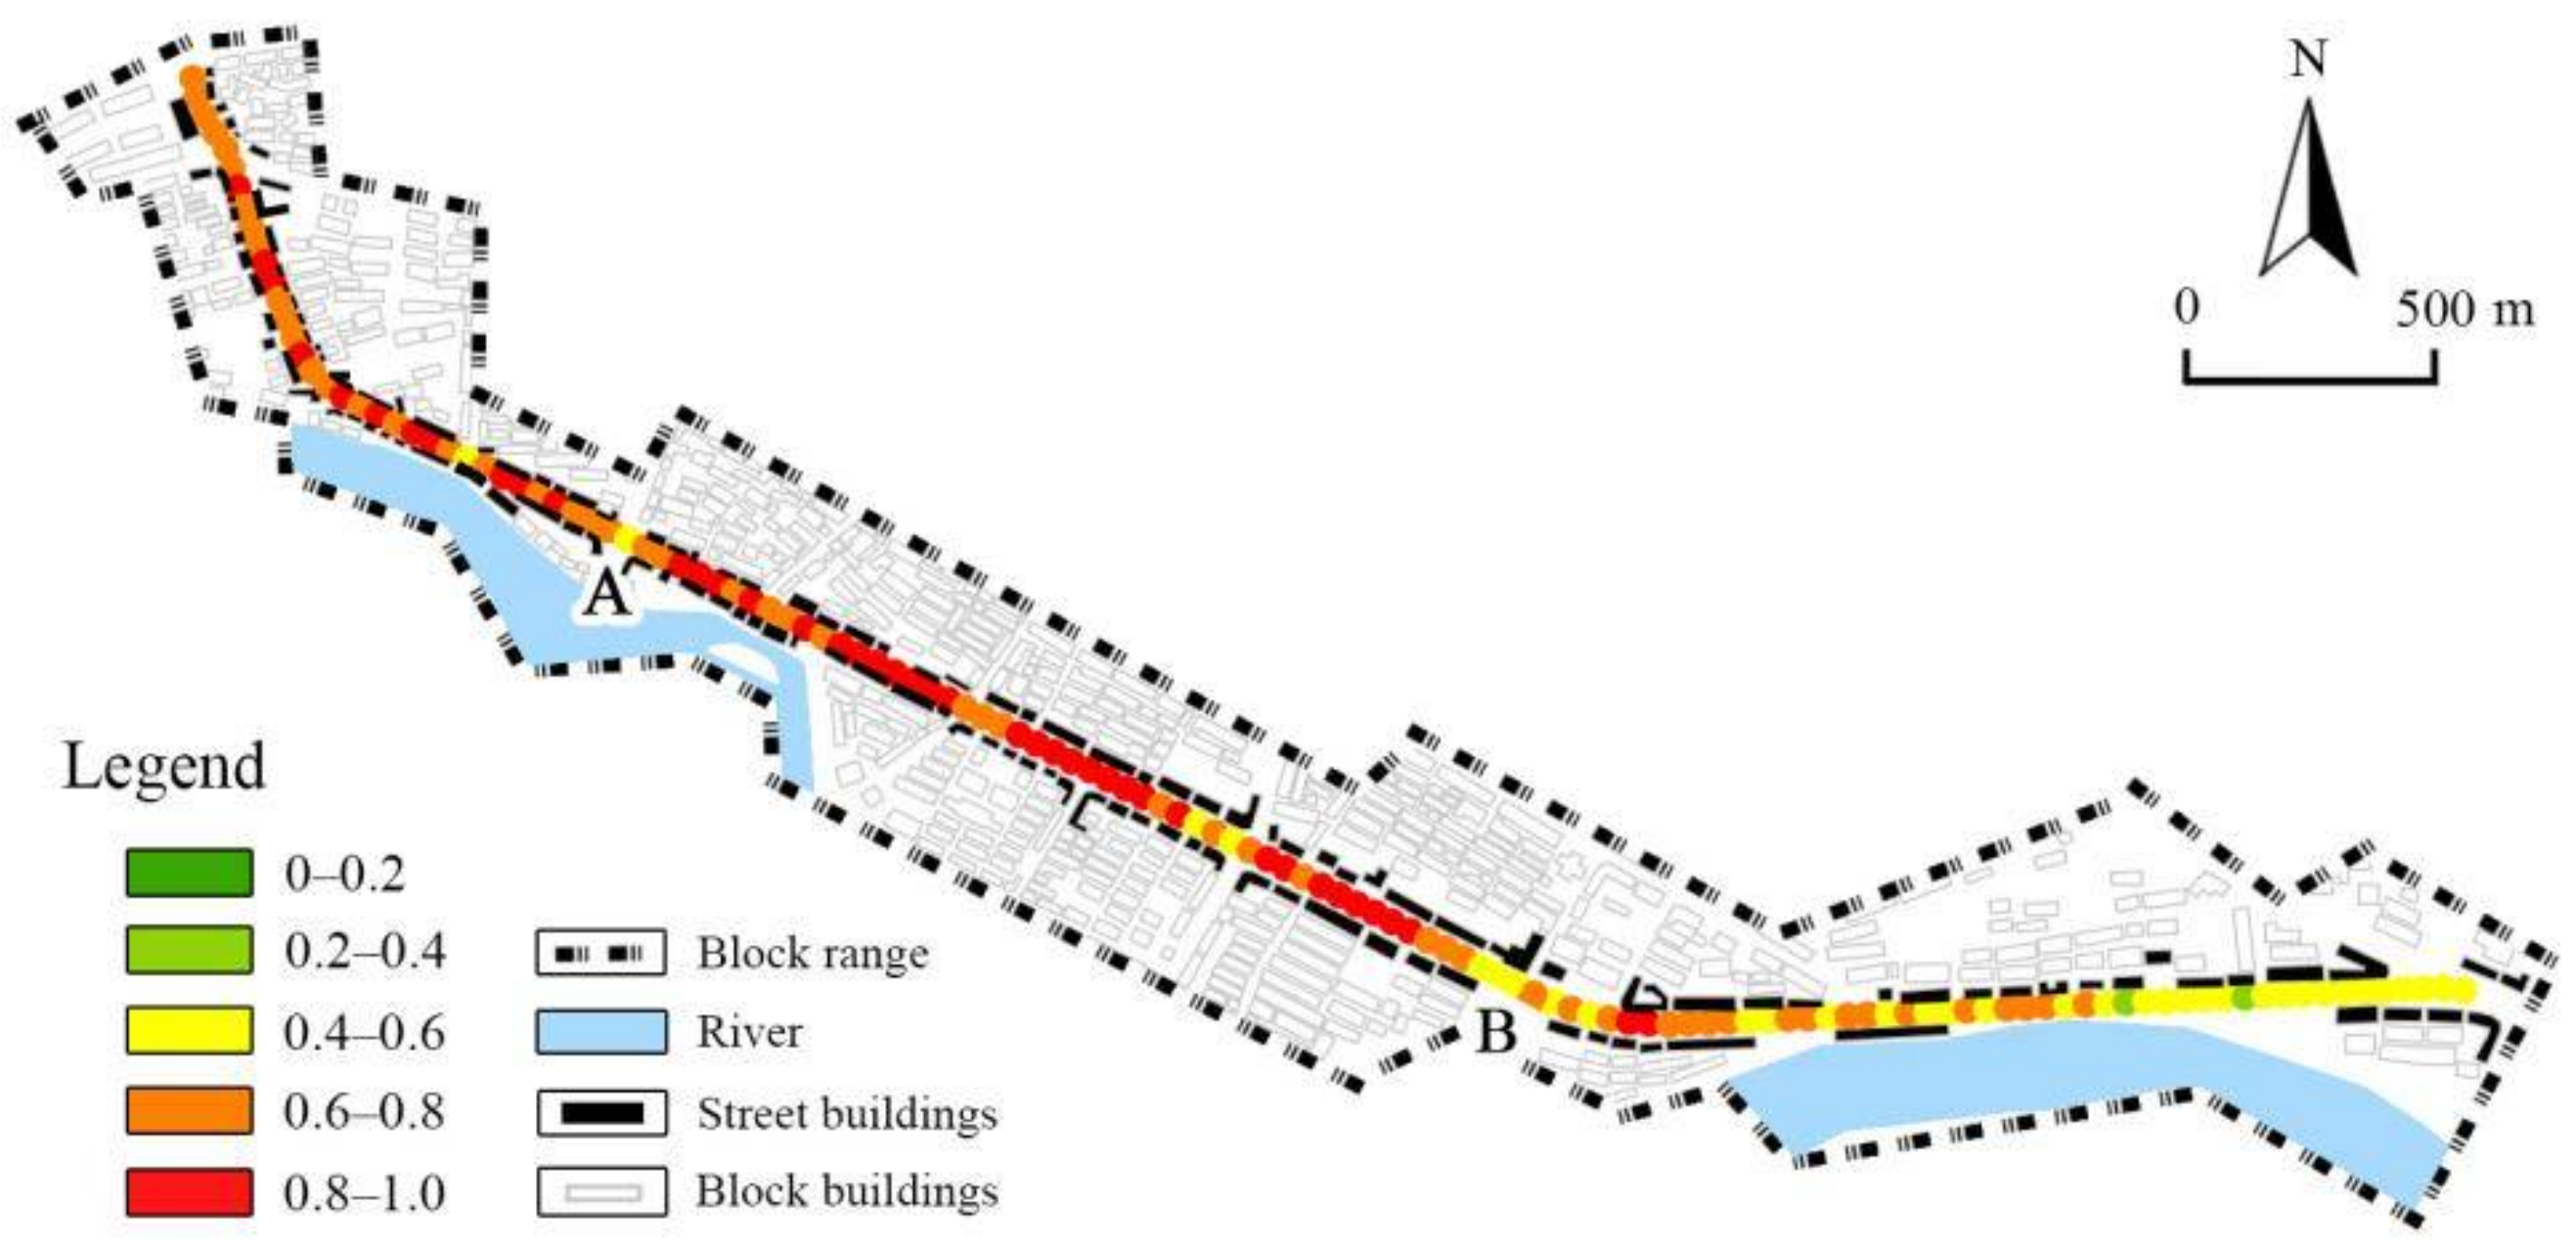
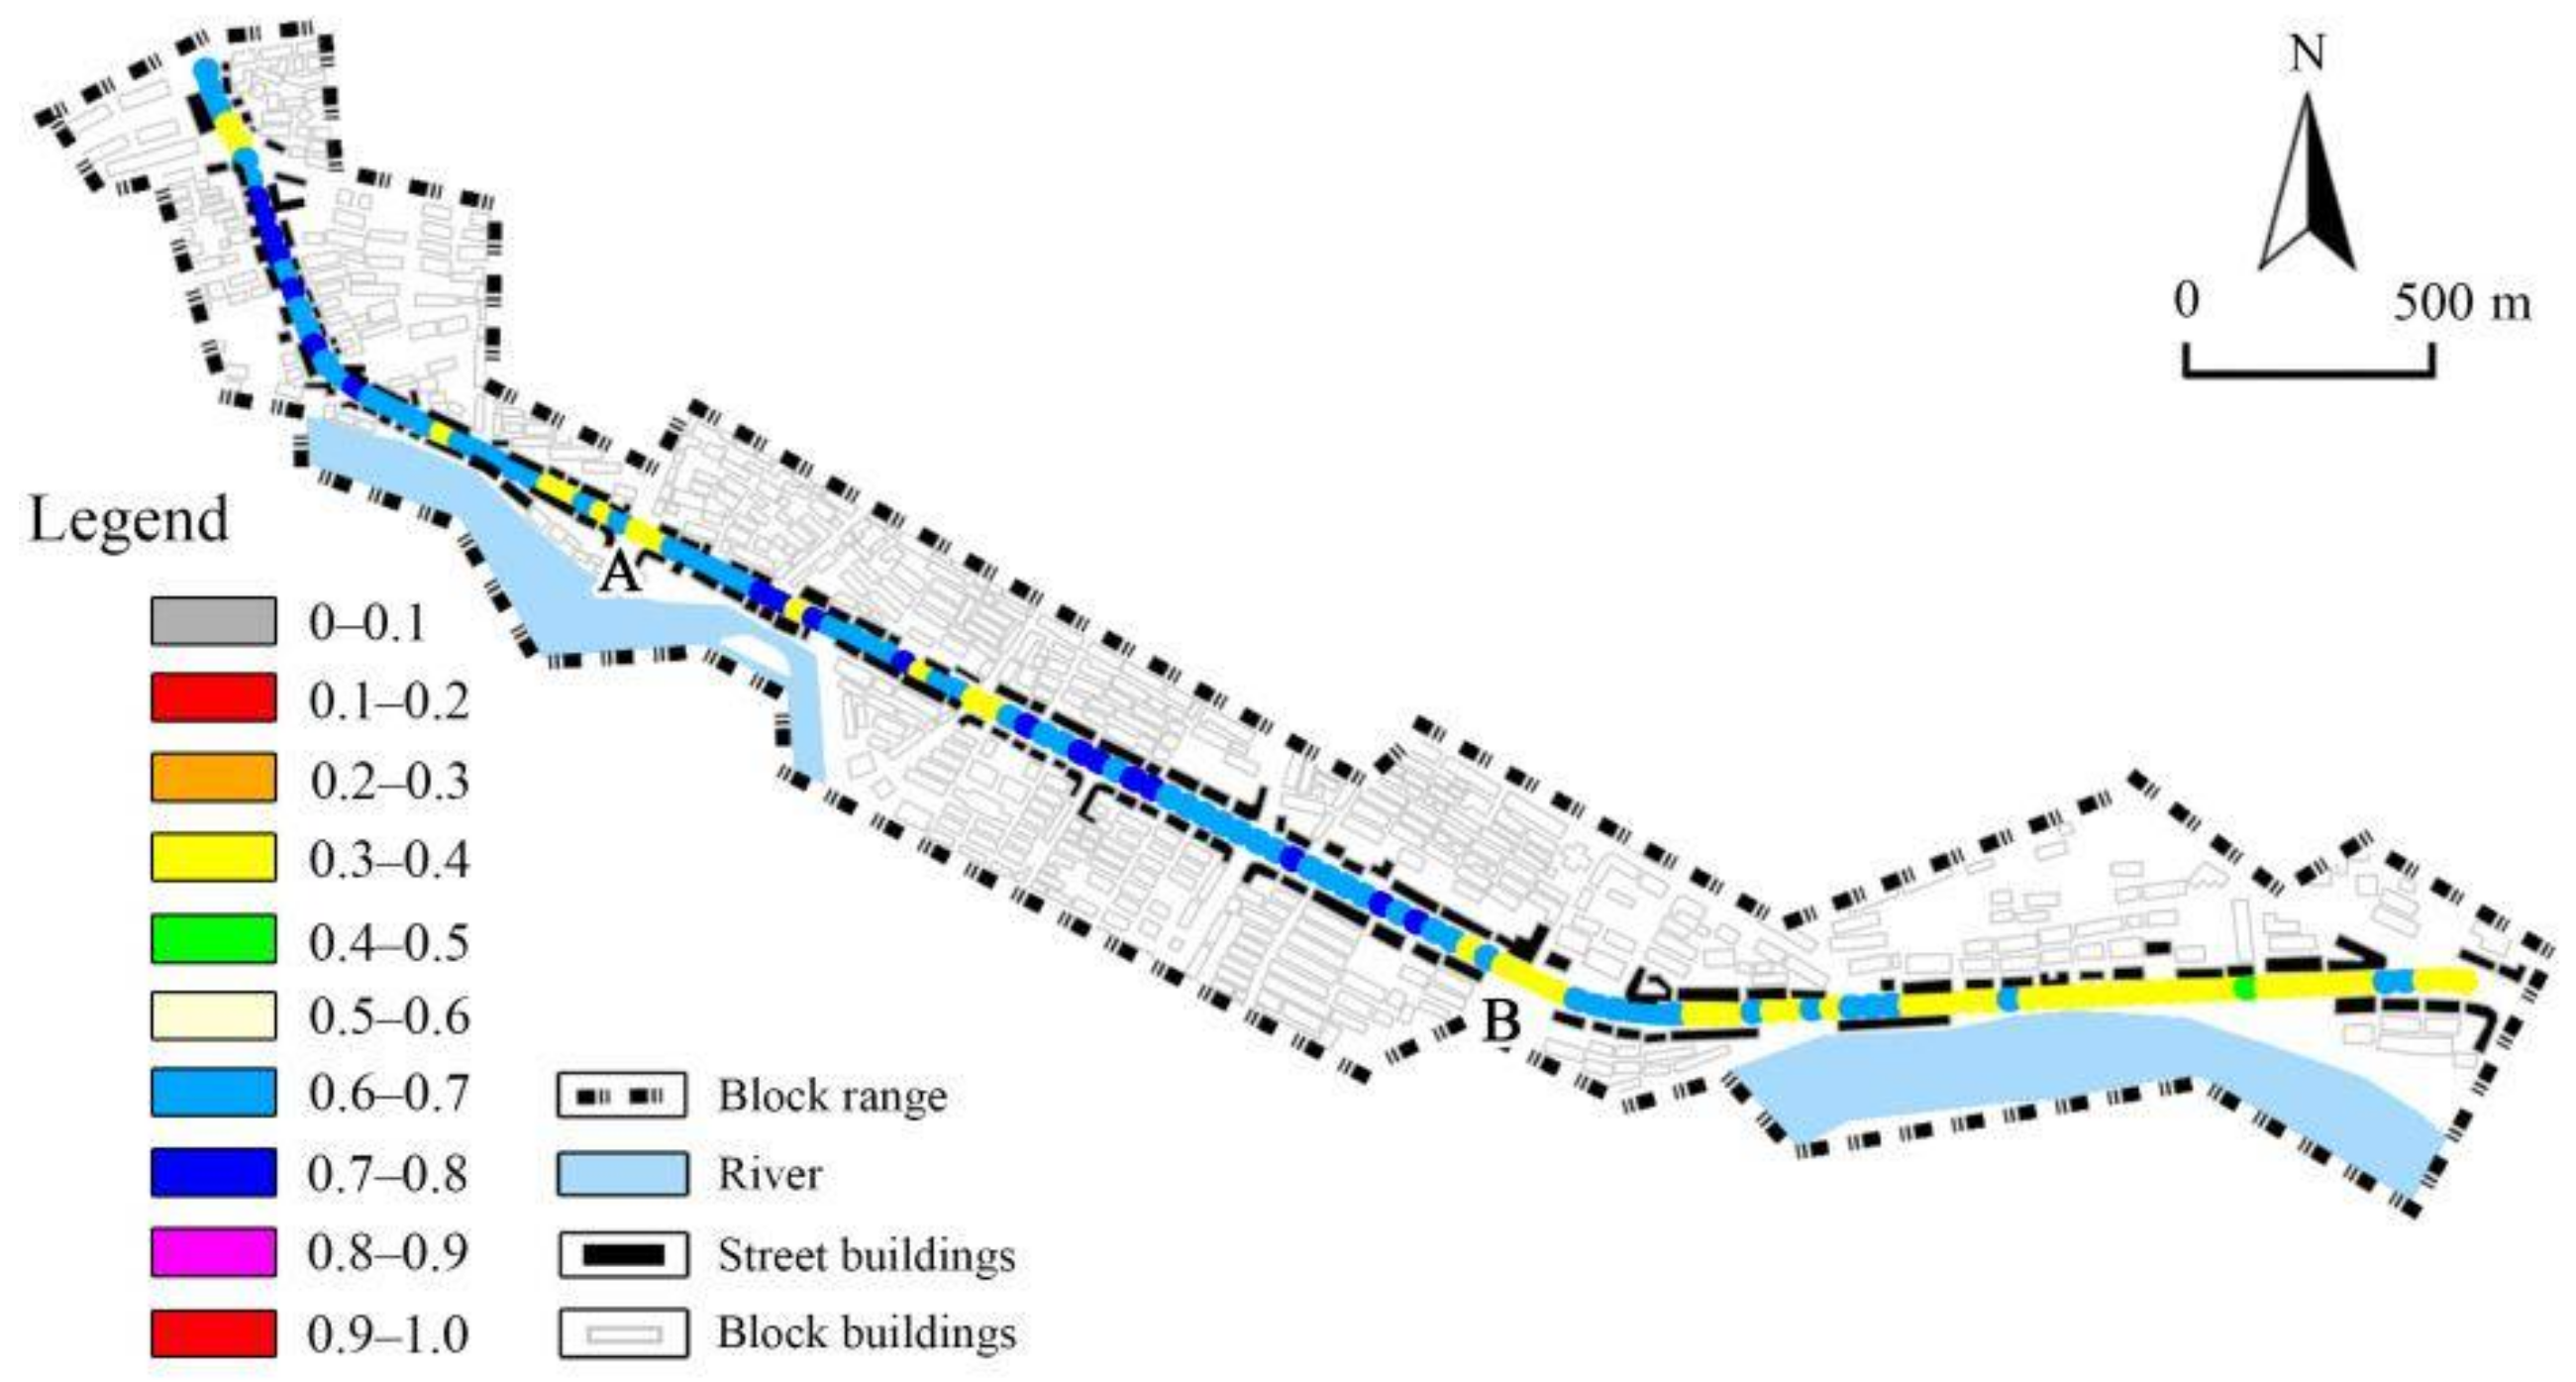
4.1. Performance of Individual Indicators
4.2. Performance of Urban Style Dimensions
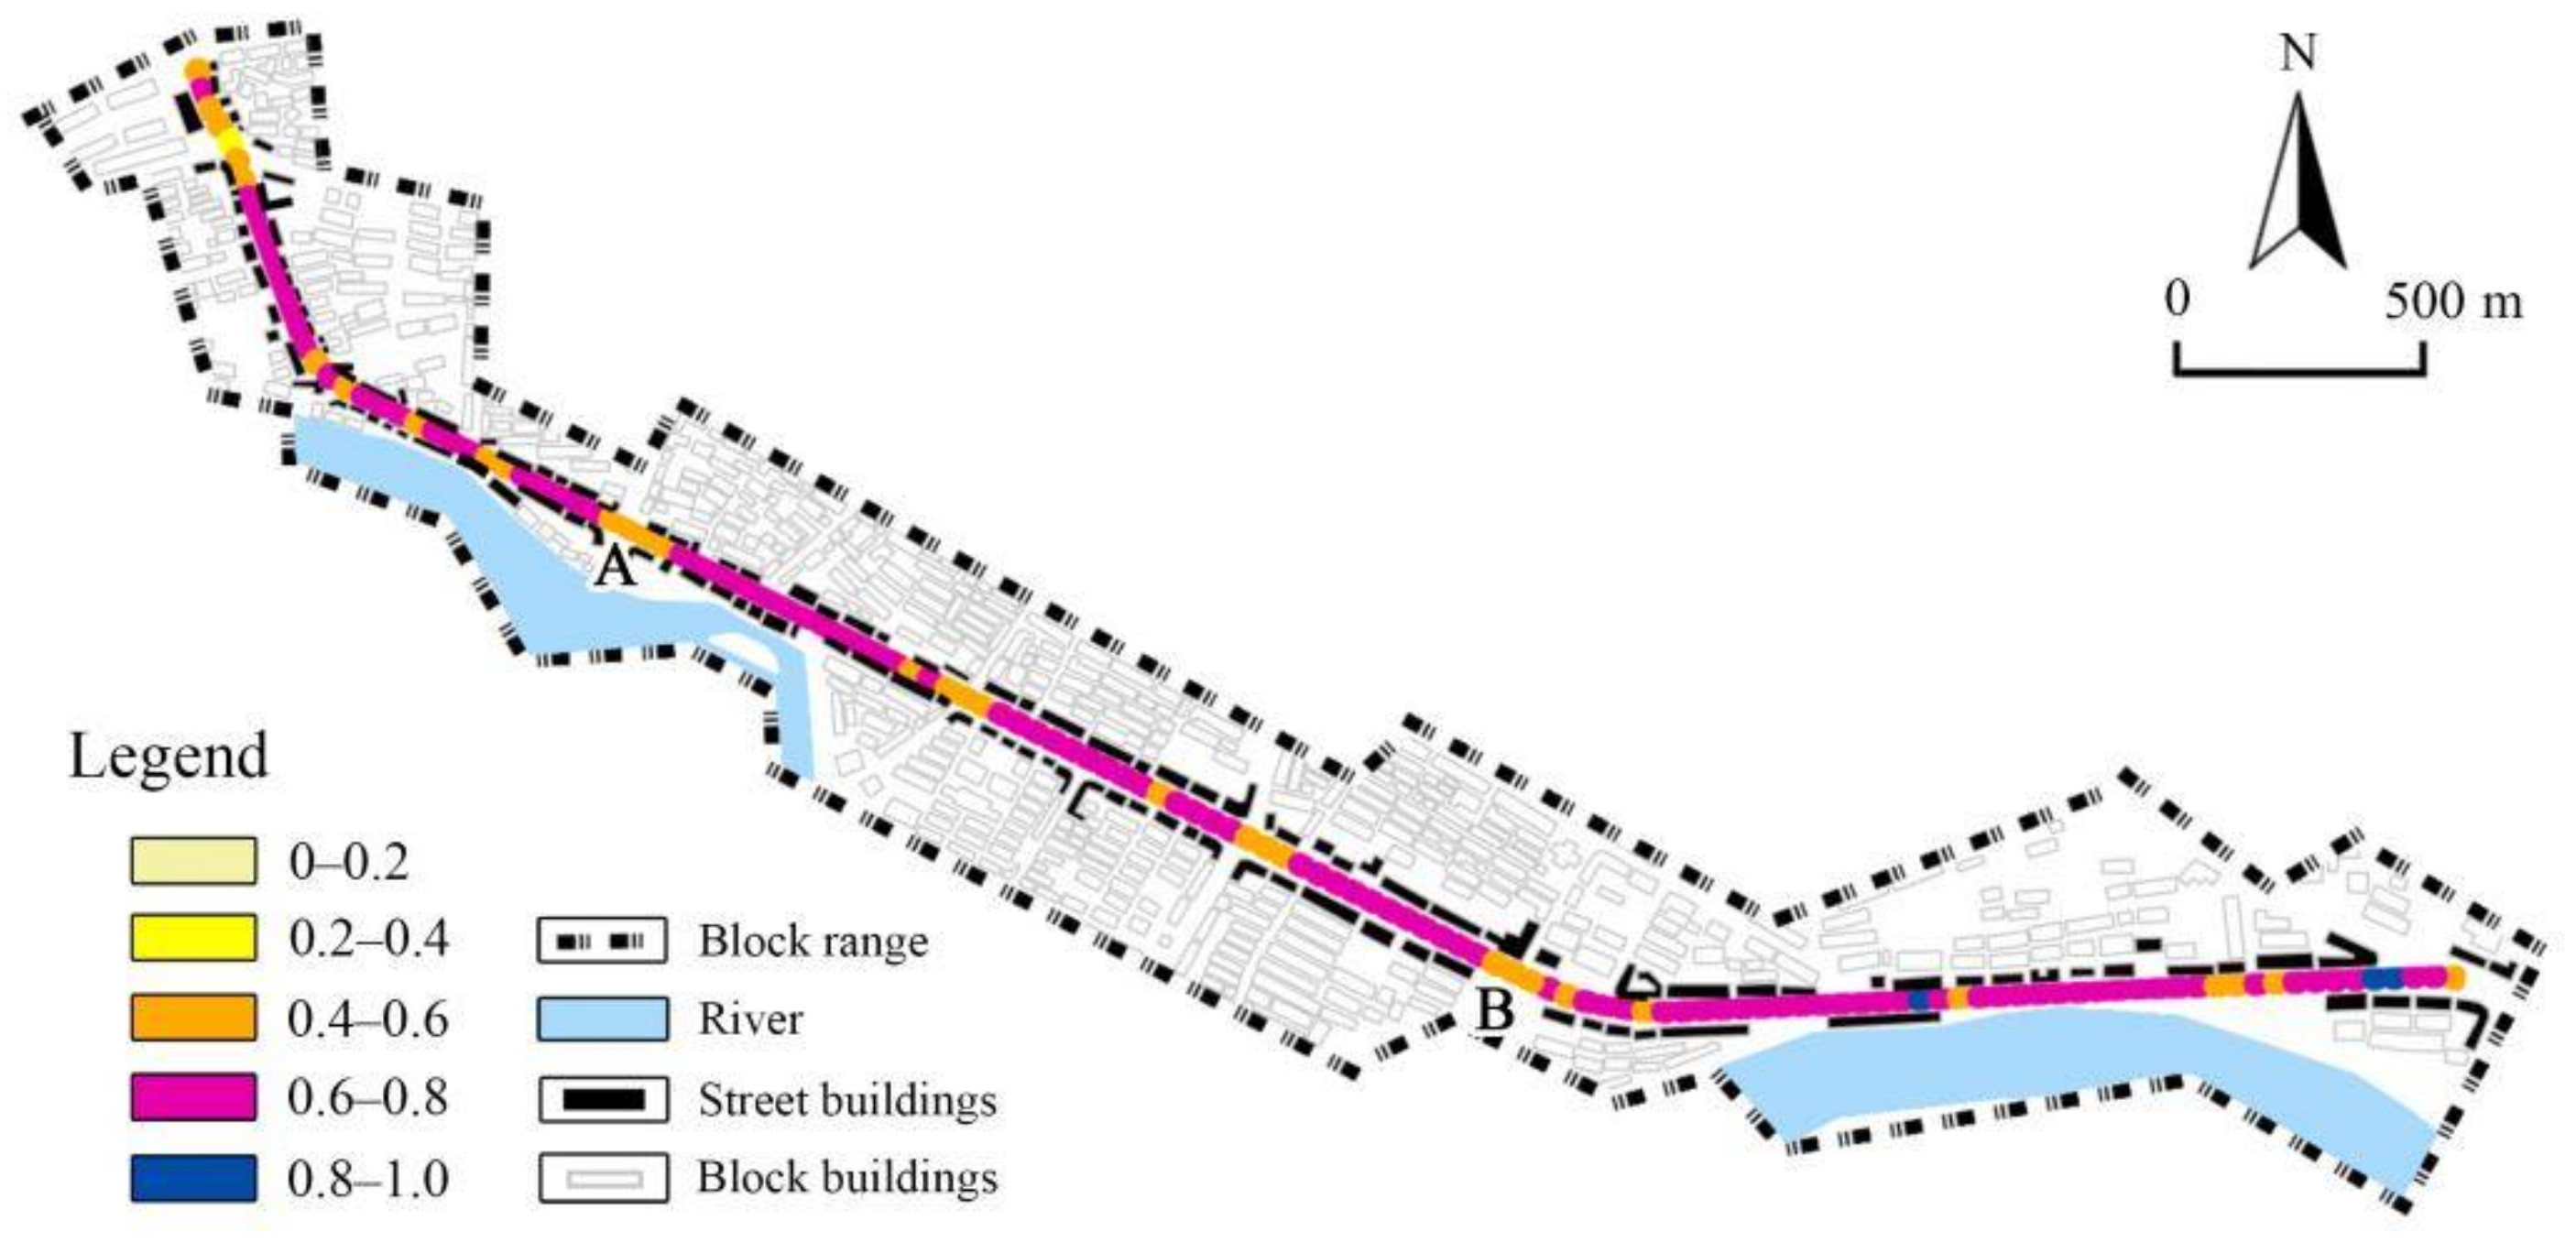
4.3. Overall Performance of Urban Style
5. Discussion
5.1. Guidance of the Research Results in Planning
5.2. Implications in Urban Planning and Design
6. Conclusions
Author Contributions
Funding
Data Availability Statement
Acknowledgments
Conflicts of Interest
Appendix A

References
- Wang, X.; Wang, C.; Wang, B.; Liu, S.; Song, J. Protection of Urban Features during Urbanization based on the Roles of Springs in Jinan. Chin. J. Popul. Resour. Environ. 2017, 15, 93–102. [Google Scholar] [CrossRef]
- Li, X.; Zhao, W. Formation, Declination and Rebuilding of City Features. In Advanced Materials Research, Proceedings of the International Conference on Civil Engineering and Building Materials (CEBM), Kunming, China, 29–31 July 2011; Trans Tech Publications: Bäch, Switzerland, 2011; pp. 1527–1531. [Google Scholar] [CrossRef]
- Feng, D. Study on the Inheritance of Modern Architecture to Urban History Humanities by Taking Museums as Cases. In Proceedings of the International Conference on Arts, Management, Education and Innovation (ICAMEI), Seoul, Korea, 12–14 January 2019; pp. 271–278. [Google Scholar] [CrossRef]
- Yuan, Q.; Leng, H.; Shi, T. Research on Style-Shaping Strategies of Small Towns based on Style Symbol. In Advanced Materials Research, Proceedings of the 2nd International Conference on Structures and Building Materials (ICSBM), Hangzhou, China, 9–11 March 2012; Trans Tech Publications: Bäch, Switzerland, 2012; pp. 1112–1117. [Google Scholar] [CrossRef]
- Garnham, H.L. Maintaining the Spirit of Place: A Process for the Preservation of Town Character; PDA Publishers Corp: Mesa, AZ, USA, 1995. [Google Scholar]
- Romero, A.D. City is Style: An Aesthetic Definition of the Urban. Kult.-Rev. Interdiscip. Sobre Cult. Ciutat 2019, 6, 63–81. [Google Scholar] [CrossRef]
- Zhang, L.; Pei, T.; Wang, X.; Wu, M.; Song, C.; Guo, S.; Chen, Y. Quantifying the Urban Visual Perception of Chinese Traditional-Style Building with Street View Images. Appl. Sci. 2020, 10, 5963. [Google Scholar] [CrossRef]
- Bloom, B.S.; Englehart, M.D.; Furst, E.J.; Hill, W.H.; Krathwohl, D.R. The Taxonomy of Educational Objectives, Handbook I: The Cognitive Domain; Longman Group Ltd.: London, UK, 1956. [Google Scholar]
- Luque-Martinez, T.; Barrio-Garcia, S.D.; Ibanez-Zapata, J.A.; Molina, M.A.R. Modeling a City’s Image: The Caseof Granada. Cities 2007, 24, 335–352. [Google Scholar] [CrossRef]
- Su, T. Research on Urban Style Evaluation Based on Multi-source data: Taking the Central Urban Area of Guangzhou as an Example. In Proceedings of the 2021 China Urban Planning Annual Conference, Chengdu, China, 25 September 2021; China Architecture & Building Press: Beijing, China, 2021; pp. 1135–1150, (In Chinese). [Google Scholar] [CrossRef]
- Rui, G.; Wang, S.; Zhao, M. IPA Method Based Cityscape Renovation Evaluation. Planners 2014, 30, 95–100. (In Chinese) [Google Scholar]
- Lu, S.; Shi, C.; Yang, X. Impacts of Built Environment on Urban Vitality: Regression Analyses of Beijing and Chengdu, China. Int. J. Environ. Res. Public Health 2019, 16, 4592. [Google Scholar] [CrossRef] [Green Version]
- Glanz, K.; Handy, S.L.; Henderson, K.E.; Slater, S.J.; Davis, E.L.; Powell, L.M. Built Environment Assessment: Multidisciplinary Perspectives. SSM-Popul. Health 2016, 2, 24–31. [Google Scholar] [CrossRef] [Green Version]
- Kroeger, G.L.; Messer, L.; Edwards, S.E.; Miranda, M.L. A Novel Tool for Assessing and Summarizing the Built Environment. Int. J. Health Geogr. 2012, 11, 46. [Google Scholar] [CrossRef] [Green Version]
- Long, Y.; Huang, C. Does Block Size Matter? The Impact of Urban Design on Economic Vitality for Chinese Cities. Urban Anal. City Sci. 2019, 46, 406–422. [Google Scholar] [CrossRef] [Green Version]
- Wang, D.; Lin, T. Built Environments, Social Environments, and Activity-travel Behavior: A Case Study of Hong Kong. J. Transp. Geogr. 2013, 31, 286–295. [Google Scholar] [CrossRef]
- Gibberd, J. Measuring Capability for Sustainability: The Built Environment Sustainability Tool (BEST). Build. Res. Inf. 2015, 41, 49–61. [Google Scholar] [CrossRef] [Green Version]
- Zeng, C.; Song, Y.; He, Q.; Shen, F. Spatially Explicit Assessment on Urban Vitality: Case Studies in Chicago and Wuhan. Sustain. Cities Soc. 2018, 40, 296–306. [Google Scholar] [CrossRef]
- Zhang, A.; Xia, C.; Chu, J.; Lin, J.; Li, W.; Wu, J. Portraying Urban Landscape: A Quantitative Analysis System Applied in Fifteen Metropolises in China. Sustain. Cities Soc. 2019, 46, 101396. [Google Scholar] [CrossRef]
- Mao, D.; Zhang, Y.; Kong, D.; He, S.; Li, X. Evaluation of Urban Multi-scale Landscape Ecological Pattern based on Open Space Classification: A Case Study in Xinxiang, China. Appl. Ecol. Environ. Res. 2018, 16, 6787–6799. [Google Scholar] [CrossRef]
- Gospodini, A. Portraying, Classifying and Understanding the Emerging Landscapes in the Post-Industrial City. Cities 2006, 23, 311–330. [Google Scholar] [CrossRef]
- Sakieh, Y.; Salmanmahiny, A.; Mirkarimi, S.; Saeidi, S. Measuring the Relationships between Landscape Aesthetics Suitability and Spatial Patterns of Urbanized Lands: An Informed Modelling Framework for Developing Urban Growth Scenarios. Geocarto Int. 2017, 32, 853–873. [Google Scholar] [CrossRef]
- Wang, F.; Qu, X. The Study of Urban Landscape Visual Sensitivity Assessments: A Case Study in the Zhongshan District of Dalian. J. Spat. Sci. 2018, 63, 325–340. [Google Scholar] [CrossRef]
- Gavrilidis, A.; Ciocănea, C.; Niță, M.; Onose, D.; Năstase, I. Urban Landscape Quality Index– Planning Tool for Evaluating Urban Landscapes and Improving the Quality of Life. In Proceedings of the 25th International Conference on Environment at Crossroads-SMART Approaches for a Sustainable Future, Bucharest, Romania, 12–15 November 2015; pp. 155–167. [Google Scholar] [CrossRef] [Green Version]
- Shi, Y.; Wang, N.; Li, T.; Wang, H.; Kang, H.; Shi, X. Evaluation of Landscape Ecological Integrity in the Yulin Region, China. Sustainablility 2018, 10, 4300. [Google Scholar] [CrossRef] [Green Version]
- Yoffe, H.; Plaut, P.; Grobman, Y. Towards Sustainability Evaluation of Urban Landscapes Using Big Data: A Case Study of Israel’s Architecture, Engineering and Construction Industry. Landsc. Res. 2022, 47, 49–67. [Google Scholar] [CrossRef]
- Oumelkheir, B.; Nadia, D. Assessment Process in the Delimitation of Historic Urban Landscape of Algiers by AHP. Misc. Geogr. 2021, 25, 110–126. [Google Scholar] [CrossRef]
- Chen, S.; Lei, J. Urban Arterial Road Landscape Evaluation Concerning Dynamic Variation of Road Service Quality Impact Factors. Arab. J. Geosci. 2021, 14, 1200. [Google Scholar] [CrossRef]
- Li, C.; Shen, S.; Ding, L. Evaluation of the Winter Landscape of the Plant Community of Urban Park Green Spaces based on the Scenic Beauty Esitimation Method in Yangzhou, China. PLoS ONE 2020, 15, e0239849. [Google Scholar] [CrossRef] [PubMed]
- Li, X.; Li, L.; Wang, X.; Lin, Q.; Wu, D.; Dong, Y.; Han, S. Visual Quality Evaluation Model of An Urban River Landscape based on Random Forest. Ecol. Indic. 2021, 133, 108381. [Google Scholar] [CrossRef]
- Liu, L.; Silva, E.A.; Wu, C.; Wang, H. A Machine Learning-based Method for the Large-scale Evaluation of the Qualities of the Urban Environment. Comput. Environ. Urban Syst. 2017, 65, 113–125. [Google Scholar] [CrossRef]
- Xiao, C.; Shi, Q.; Gu, C. Assessing the Spatial Distribution Pattern of Street Greenery and Its Relationship with Socioeconomic Status and the Built Environment in Shanghai, China. Land 2021, 10, 871. [Google Scholar] [CrossRef]
- Ishikawa, N.; Fukushige, M. Effects of Street Landscape Planting and Urban Public Parks on Dwelling Environment Evaluation in Japan. Urban For. Urban Green. 2012, 11, 390–395. [Google Scholar] [CrossRef]
- Tong, M.; She, J.; Tan, J.; Li, M.; Ge, R.; Gao, Y. Evaluating Street Greenery by Multiple Indicators Using Street-Level Imagery and Satellite Images: A Case Study in Nanjing, China. Forests 2020, 11, 1347. [Google Scholar] [CrossRef]
- Ma, X.; Chau, C.K.; Lai, J.H.K. Critical Factors Influencing the Comfort Evaluation for Recreational Walking in Urban Street Environments. Cities 2021, 116, 103286. [Google Scholar] [CrossRef]
- Wu, B.; Yu, B.; Shu, S.; Liang, H.; Zhao, Y.; Wu, J. Mapping Fine-scale Visual Quality Distribution inside Urban Streets Using Mobile LiDAR Data. Build. Environ. 2021, 206, 108323. [Google Scholar] [CrossRef]
- Liu, M.; Jiang, Y.; He, J. Quantitative Evaluation on Street Vitality: A Case Study of Zhoujiadu Community in Shanghai. Sustainability 2021, 13, 3027. [Google Scholar] [CrossRef]
- Ye, Y.; Zeng, W.; Shen, Q.; Zhang, X.; Lu, Y. The Visual Quality of Streets: A Human-centred Continuous Measurement based on Machine Learning Algorithms and Street View Images. EPB Urban Anal. City Sci. 2019, 46, 1439–1457. [Google Scholar] [CrossRef]
- Jacobs, J. The Death and Life of Great American Cities; Random House: New York, NY, USA, 1961. [Google Scholar]
- Montgomery, J. Making a City: Urbanity, Vitality and Urban Design. J. Urban Des. 2007, 3, 93–116. [Google Scholar] [CrossRef]
- Lynch, K. A Theory of Good City Form; The MIT Press: Cambridge, MA, USA; London, UK, 1981; 118p. [Google Scholar]
- Greene, S. Cityshape Communicating and Evaluating Community Design. J. Am. Plan. Assoc. 1992, 58, 177–189. [Google Scholar] [CrossRef]
- Gehl, J. Cities for People; Island Press: Saint Louis, MO, USA, 2010. [Google Scholar]
- Taylor, N. The Elements of Townscape and the Art of Urban Design. J. Urban Des. 1999, 4, 195–209. [Google Scholar] [CrossRef]
- Davoudi, S.; Crowford, J. Mehmood, A. Planning for Climate Change: Strategies for Mitigation and Adaptation for Spatial Planners. Eur. Plan. Stud. 2010, 18, 1543–1544. [Google Scholar] [CrossRef]
- Frew, T.; Baker, D.; Donghue, P. Performance based Planning in Queensland: A Case of Unintended Plan-making Outcomes. Land Use Policy 2016, 50, 239–251. [Google Scholar] [CrossRef]
- Santamouris, M.; Haddad, S.; Fiorito, F.; Osmond, P.; Ding, L.; Prasad, D.; Zhai, X.; Wang, R. Urban Heat Island and Overheating Characteristics in Sydney, Australia. AnAnalysis of Multiyear Measurements. Sustainability 2017, 9, 712. [Google Scholar] [CrossRef]
- He, B.-J.; Zhao, D.; Xiong, K.; Qi, J.; Ulpiani, G.; Pignatta, G.; Prasad, D.; Jones, P. A Framework for Addressing Urban Heatchallenges and Associated Adaptive Behavior by the Public and the Issue of Willingness to Pay for Heat Resilient Infrastructure in Chongqing, China. Sustain. Cities Soc. 2021, 75, 103361. [Google Scholar] [CrossRef]
- He, B.-J.; Ding, L.; Prasad, D. Relationships among Local-scale Urban Morphology, Urban Ventilation, Urban Heat Island and Outdoor Thermal Comfort under Sea Breeze Influence. Sustain. Cities Soc. 2020, 60, 102289. [Google Scholar] [CrossRef]
- Adolphe, L. A Simplified Model of Urban Morphology: Application to An Analysis of the Environmental Performance of Cities. Environ. Plan. B Plan. Des. 2001, 28, 183–200. [Google Scholar] [CrossRef]
- Kleerekoper, L.; Esch, M.J.; Salcedo, T.B. How to Make a City Climate-proof, Addressing the Urban Heat Island Effect. Resour. Conserv. Recycl. 2012, 64, 30–38. [Google Scholar] [CrossRef]
- Feng, Q.; Chaubey, I.; Engel, B.; Cibin, R.; Sudheer, K.P.; Volenec, J. Marginal Land Suitability for Switchgrass, Miscanthus and Hybrid Poplar in the Upper Mississippi River Basin (UMRB). Environ. Model. Softw. 2017, 93, 356–365. [Google Scholar] [CrossRef] [Green Version]
- Wang, Y.; Jin, C.; Lu, M.; Lu, Y. Assessing the Suitability of Regional Human Settlements Environment from a Different Preferences Perspective: A Case Study of Zhejiang Province, China. Habitat Int. 2017, 70, 1–12. [Google Scholar] [CrossRef]
- Yang, T.; Wang, X.R. Evaluation of the Plant Landscape Suitability in Mountain Parks Based on Principal Component Analysis: A Case Study of Guiyang City. Agron. J. 2021, 113, 760–773. [Google Scholar] [CrossRef]
- Huang, H.; Li, Q.; Zhang, Y. Urban Residential Land Suitability Analysis Combining Remote Sensing and Social Sensing Data: A Case Study in Beijing, China. Sustainability 2019, 11, 2255. [Google Scholar] [CrossRef] [Green Version]
- Mercader-Moyano, P.; Flores-Garcia, M.; Serrano-Jimenez, A. Housing and Neighbourhood Diagnosis for Ageing in Place: Multidimensional Assessment System of the Built Environment (MASBE). Sustain. Cities Soc. 2020, 62, 102422. [Google Scholar] [CrossRef]
- Gao, Y.; Shahab, S.; Ahmadpoor, N. Morphology of Urban Villages in China: A Case Study of Dayuan Village in Guangzhou. Urban Sci. 2020, 4, 23. [Google Scholar] [CrossRef]
- Meng, L.; Wen, K.H.; Zeng, Z.; Brewin, R.; Fan, X.; Wu, Q. The Impact of Street Space Perception Factors on Elderly Health in High-Density Cities in Macau—Analysis Based on Street View Images and Deep Learning Technology. Sustainability 2020, 12, 1799. [Google Scholar] [CrossRef] [Green Version]
- He, B.-J.; Ding, L.; Prasad, D. Enhancing Urban Ventilation Performance through the Development of Precinct Ventilation Zones: A case study based on the Greater Sydney, Australia. Sustain. Cities Soc. 2019, 47, 101472. [Google Scholar] [CrossRef]
- Ren, J.; Yang, J.; Zhang, Y.; Xiao, X.; Xia, J.C.; Li, X.; Wang, S. Exploring Thermal Comfort of Urban Buildings based on Local Climate Zones. J. Clean. Prod. 2022, 340, 130744. [Google Scholar] [CrossRef]
- Stewart, I.D.; Oke, T.R. Local climate zones for urban temperature studies. Bull. Am. Meteorol. Soc. 2012, 93, 1879–1900. [Google Scholar] [CrossRef]
- Zhao, Z.; Sharifi, A.; Dong, X.; Shen, L.; He, B.-J. Spatial Variability and Temporal Heterogeneity of Surface Urban Heat Island Patterns and the Suitability of Local Climate Zones for Land Surface T emperature Characterization. Remote Sens. 2021, 13, 4338. [Google Scholar] [CrossRef]
- Xing, H.; Meng, Y. Measuring Urban Landscapes for Urban Function Classification Using Spatial Metrics. Ecol. Indic. 2020, 108, 105722. [Google Scholar] [CrossRef]
- Yang, J.; Zhao, L.; McBride, J.; Gong, P. Can you See Green? Assessing the Visibility of Urban Forests in Cities. Landsc. Urban Plan. 2009, 91, 97–104. [Google Scholar] [CrossRef]
- Li, X.; Zhang, C.; Li, W.; Ricard, R.; Meng, Q.; Zhang, W. Assessing Street-level Urban Greenery Using Google Street View and a Modified Green View Index. Urban For. Urban Green. 2015, 14, 675–685. [Google Scholar] [CrossRef]
- Stessens, P.; Canters, F.; Huysmans, M.; Khan, A.Z. Urban Green Space Qualities: An Integrated Approach towards GIS-based Assessment Reflecting User Perception. Land Use Policy 2020, 91, 104319. [Google Scholar] [CrossRef]
- Chen, S.S.; Jim, C.Y. Quantitative Assessment of the Treescape and Cityscape of Nanjing, China. Landsc. Ecol. 2003, 18, 811–828. [Google Scholar] [CrossRef]
- Liu, S.; Zhang, L.; Long, Y. Urban Vitality Area Identification and Pattern Analysis from the Perspective of Time and Space Fusion. Sustainability 2019, 11, 4032. [Google Scholar] [CrossRef] [Green Version]
- Yue, Y.; Zhuang, Y.; Yeh, A.G.O.; Xie, J.Y.; Ma, C.L.; Li, Q.Q. Measurements of POI-based Mixed Use and Their Relationships with Neighbourhood Vibrancy. Int. J. Geogr. Inf. Sci. 2016, 31, 658–675. [Google Scholar] [CrossRef] [Green Version]
- Ou, G.; Zhou, M.; Zeng, Z.; He, Q.; Yin, C. Is There an Equality in the Spatial Distribution of Urban Vitality: A Case Study of Wuhan in China. Open Geosci. 2021, 13, 469–481. [Google Scholar] [CrossRef]
- Yue, W.; Chen, Y.; Zhang, Q.; Liu, Y. Spatial Explicit Assessment of Urban Vitality Using Multi-Source Data: A Case of Shanghai, China. Sustainability 2019, 11, 638. [Google Scholar] [CrossRef] [Green Version]
- Lynch, K. The Image of the City; The MIT Press: Cambridge, MA, USA; London, UK, 1960. [Google Scholar]
- Hu, C.B.; Zhang, F.; Gong, F.Y.; Ratti, C.; Li, X. Classification and Mapping of Urban Canyon Geometry Using Google Street View Images and Deep Multitask Learning. Build. Environ. 2020, 167, 106424. [Google Scholar] [CrossRef]
- Zhou, Y.; Zhao, J.; Zhang, Y. Street Interface Density and Planning Control of Urban Form. City Plan. Rev. 2012, 36, 28–32. (In Chinese) [Google Scholar]
- Song, Y.; Merlin, L.; Rodriguez, D. Comparing Measures of Urban Land Use Mix. Comput. Environ. Urban Syst. 2013, 42, 1–13. [Google Scholar] [CrossRef]
- Qian, C.; Zhu, D.; Zhou, Y.; Chen, J. Measurements of Pedestrian Friendliness of Residential Area: A Case Study in Hexi District of Nanjing. Sustainability 2018, 10, 1993. [Google Scholar] [CrossRef] [Green Version]
- Qi, Y.; Drolma, S.C.; Zhang, X.; Liang, J.; Jiang, H.; Xu, J.; Ni, T. An Investigation of the Visual Features of Urban Street Vitality Using a Convolutional Neural Network. Geo-Spat. Inf. Sci. 2020, 23, 341–351. [Google Scholar] [CrossRef]
- Zhong, T.; Ye, C.; Wang, Z.; Tang, G.; Zhang, W.; Ye, Y. City-Scale Mapping of Urban Façade Color Using Street-View Imagery. Remote Sens. 2021, 13, 1591. [Google Scholar] [CrossRef]
- Chen, Y.; Zheng, B.; Hu, Y. Mapping Local Climate Zones Using ArcGIS-Based Method and Exploring Land Surface Temperature Characteristics in Chenzhou, China. Sustainability 2020, 12, 2974. [Google Scholar] [CrossRef] [Green Version]
- Nasar, J.L. Adult Viewers’ Preferences in Residential Scenes a Study of the Relationship of Environmental Attributes to Preference. Environ. Behav. 1983, 15, 589–614. [Google Scholar] [CrossRef]
- Wohlwill, J.F. Environmental Aesthetics: The Environment as a Source of Affect. In Human Behavior and Environment: Advances in Theory and Research; Springer: Boston, MA, USA, 1976; Volume 1, pp. 37–86. [Google Scholar]
- Yoshinabu, A. The Aesthetic Townscape; The MIT Press: Cambridge, MA, USA, 1984. [Google Scholar]
- Zarghami, E.; Karimimoshaver, M.; Ghanbaran, A.; Saadati Vaghar, P. Assessing the Oppressive Impact of the Form of Tall Buildings on Citizens: Height, Width, and Height-to-width Ratio. Environ. Impact Assess. Rev. 2019, 79, 106287. [Google Scholar] [CrossRef]
- Liu, C.; Qi, T.; Ma, X. The Research on the Impact Assessment of Visual Landscape of Country Parks in Beijing. J. Environ. Eng. Landsc. Manag. 2016, 24, 37–47. [Google Scholar] [CrossRef]
- Sun, Y.; Lu, W.; Sun, P. Optimization of Walk Score Based on Street Greening—A Case Study of Zhongshan Road in Qingdao. Int. J. Environ. Res. Public Health 2021, 18, 1277. [Google Scholar] [CrossRef] [PubMed]
- Wu, J.; Ta, N.; Song, Y.; Lin, J.; Chai, Y. Urban Form Breeds Neighborhood Vibrancy: A Case Study Using a GPS-based Activity Survey in Suburban Beijing. Cities 2018, 74, 100–108. [Google Scholar] [CrossRef]
- Zhu, J.; Lu, H.; Zheng, T.; Rong, Y.; Wang, C.; Zhang, W.; Yan, Y.; Tang, L. Vitality of Urban Parks and Its Influencing Factors from the Perspective of Recreational Service Supply, Demand, and Spatial Links. Int. J. Environ. Res. Public Health 2020, 17, 1615. [Google Scholar] [CrossRef] [Green Version]
- Sung, H.; Lee, S. Residential Built Environment and Walking Activity: Empirical Evidence of Jane Jacobs’ Urban Vitality. Transp. Res. Part D 2015, 41, 318–329. [Google Scholar] [CrossRef]
- Saghapour, T.; Moridpour, S.; Thompson, R. Sustainable Transport in Neighbourhoods: Effect of Accessibility on Walking and Bicycling. Transp. A Transp. Sci. 2018, 15, 849–871. [Google Scholar] [CrossRef]
- Li, Q.; Cui, C.; Liu, F.; Wu, Q.; Run, Y.; Han, Z. Multidimensional Urban Vitality on Streets: Spatial Patterns and Influence Factor Identification Using Multisource Urban Data. Int. J. Geo-Inf. 2022, 11, 2. [Google Scholar] [CrossRef]
- Na, T.; Zeng, Y.; Zhu, Q.; Wu, J. Relationship between Built Environment and Urban Vitality in Shanghai Downtown Area based on Big Data. Sci. Geogr. Sin. 2020, 40, 60–68. (In Chinese) [Google Scholar] [CrossRef]
- Singh, D.; Singh, B. Investigating the Impact of Data Normalization on Classification Performance. Appl. Soft Comput. 2020, 97, 105524. [Google Scholar] [CrossRef]
- Han, J.; Pei, J.; Kamber, M. Data Mining: Concepts and Techniques; Elsevier: Amsterdam, The Netherlands, 2011. [Google Scholar]
- Cai, G.; Zhang, J.; Du, M.; Li, C.; Peng, S. Identification of Urban Land Use Efficiency by Indicator-SDG 11.3. PLoS ONE 2020, 15, e0244318. [Google Scholar] [CrossRef]
- Yong, Y.; Zhang, H.; Wang, X.; Schubert, U. Urban Land-Use Zoning Based on Ecological Evaluation for Large Conurbations in Less Developed Regions: Case Study in Foshan, China. J. Urban Plan. Dev. 2010, 136, 116–124. [Google Scholar] [CrossRef]
- Central South University. Research on the Landscape Planning of Hengyang County (Planning Project); Central South University: Changsha, China, 2015. [Google Scholar]
- Zhang, J.; Jiang, Y.; Zhao, G.; Chen, J.; Wu, X. Example for the Vague Evaluation of City Landscape. Huazhong Archit. 2001, 19, 18–21. (In Chinese) [Google Scholar] [CrossRef]


| Dimensions | Aspects | Indicators | Description | Formula or Explanation |
|---|---|---|---|---|
| Suitability | Urban Form | Building Density (BD) | Ratio of the total base area of all buildings within the land scope to the planned construction land area | where Su and Sb are the area of the street unit and the total building base area within its scope |
| Street Aspect Ratio (SAR) | Ratio of street width to interface height of street buildings | where D is the width of the street and H is the average of building interface height in the street unit | ||
| Street Interface Density (SID) | Continuity and enclosure degree of street interface | where Wi is the projected length of the interface of building i in the street unit, Lu is the length of the street unit | ||
| Urban Environment | Environmental Performance (EP) | Quality or comfort level produced by the built environment | 0 to 10 score based on LST and LCZs classifications | |
| Aesthetics | Architectural Form | Aesthetics Feeling of Architectural Style (AFAS) | Aesthetic feeling provided by different architectural styles | where Ai is the aesthetic feeling of building i in the street unit, and n is the number of building in the street unit |
| Average Building Height (ABH) | Average height of buildings | where Hi is the height of building i in the street unit, n is the number of buildings in the street unit | ||
| Building Facade Quality (BFQ) | Construction and maintenance quality grade of building facade | where Qi is the facade quality of building i in the street unit, n is the number of buildings in the street unit | ||
| Greening Quality | Green Coverage Index (GCI) | Proportion of green coverage area in the site to the total area | where Sg is the area of green projection in the street unit, Su is the area of the street unit | |
| Green Visual Ratio (GVR) | Proportion of green area seen in pedestrian field of vision to total field of vision | where Au is the pixel area of the pedestrian perspective image of the street unit, and Ag is the green pixel area of the image | ||
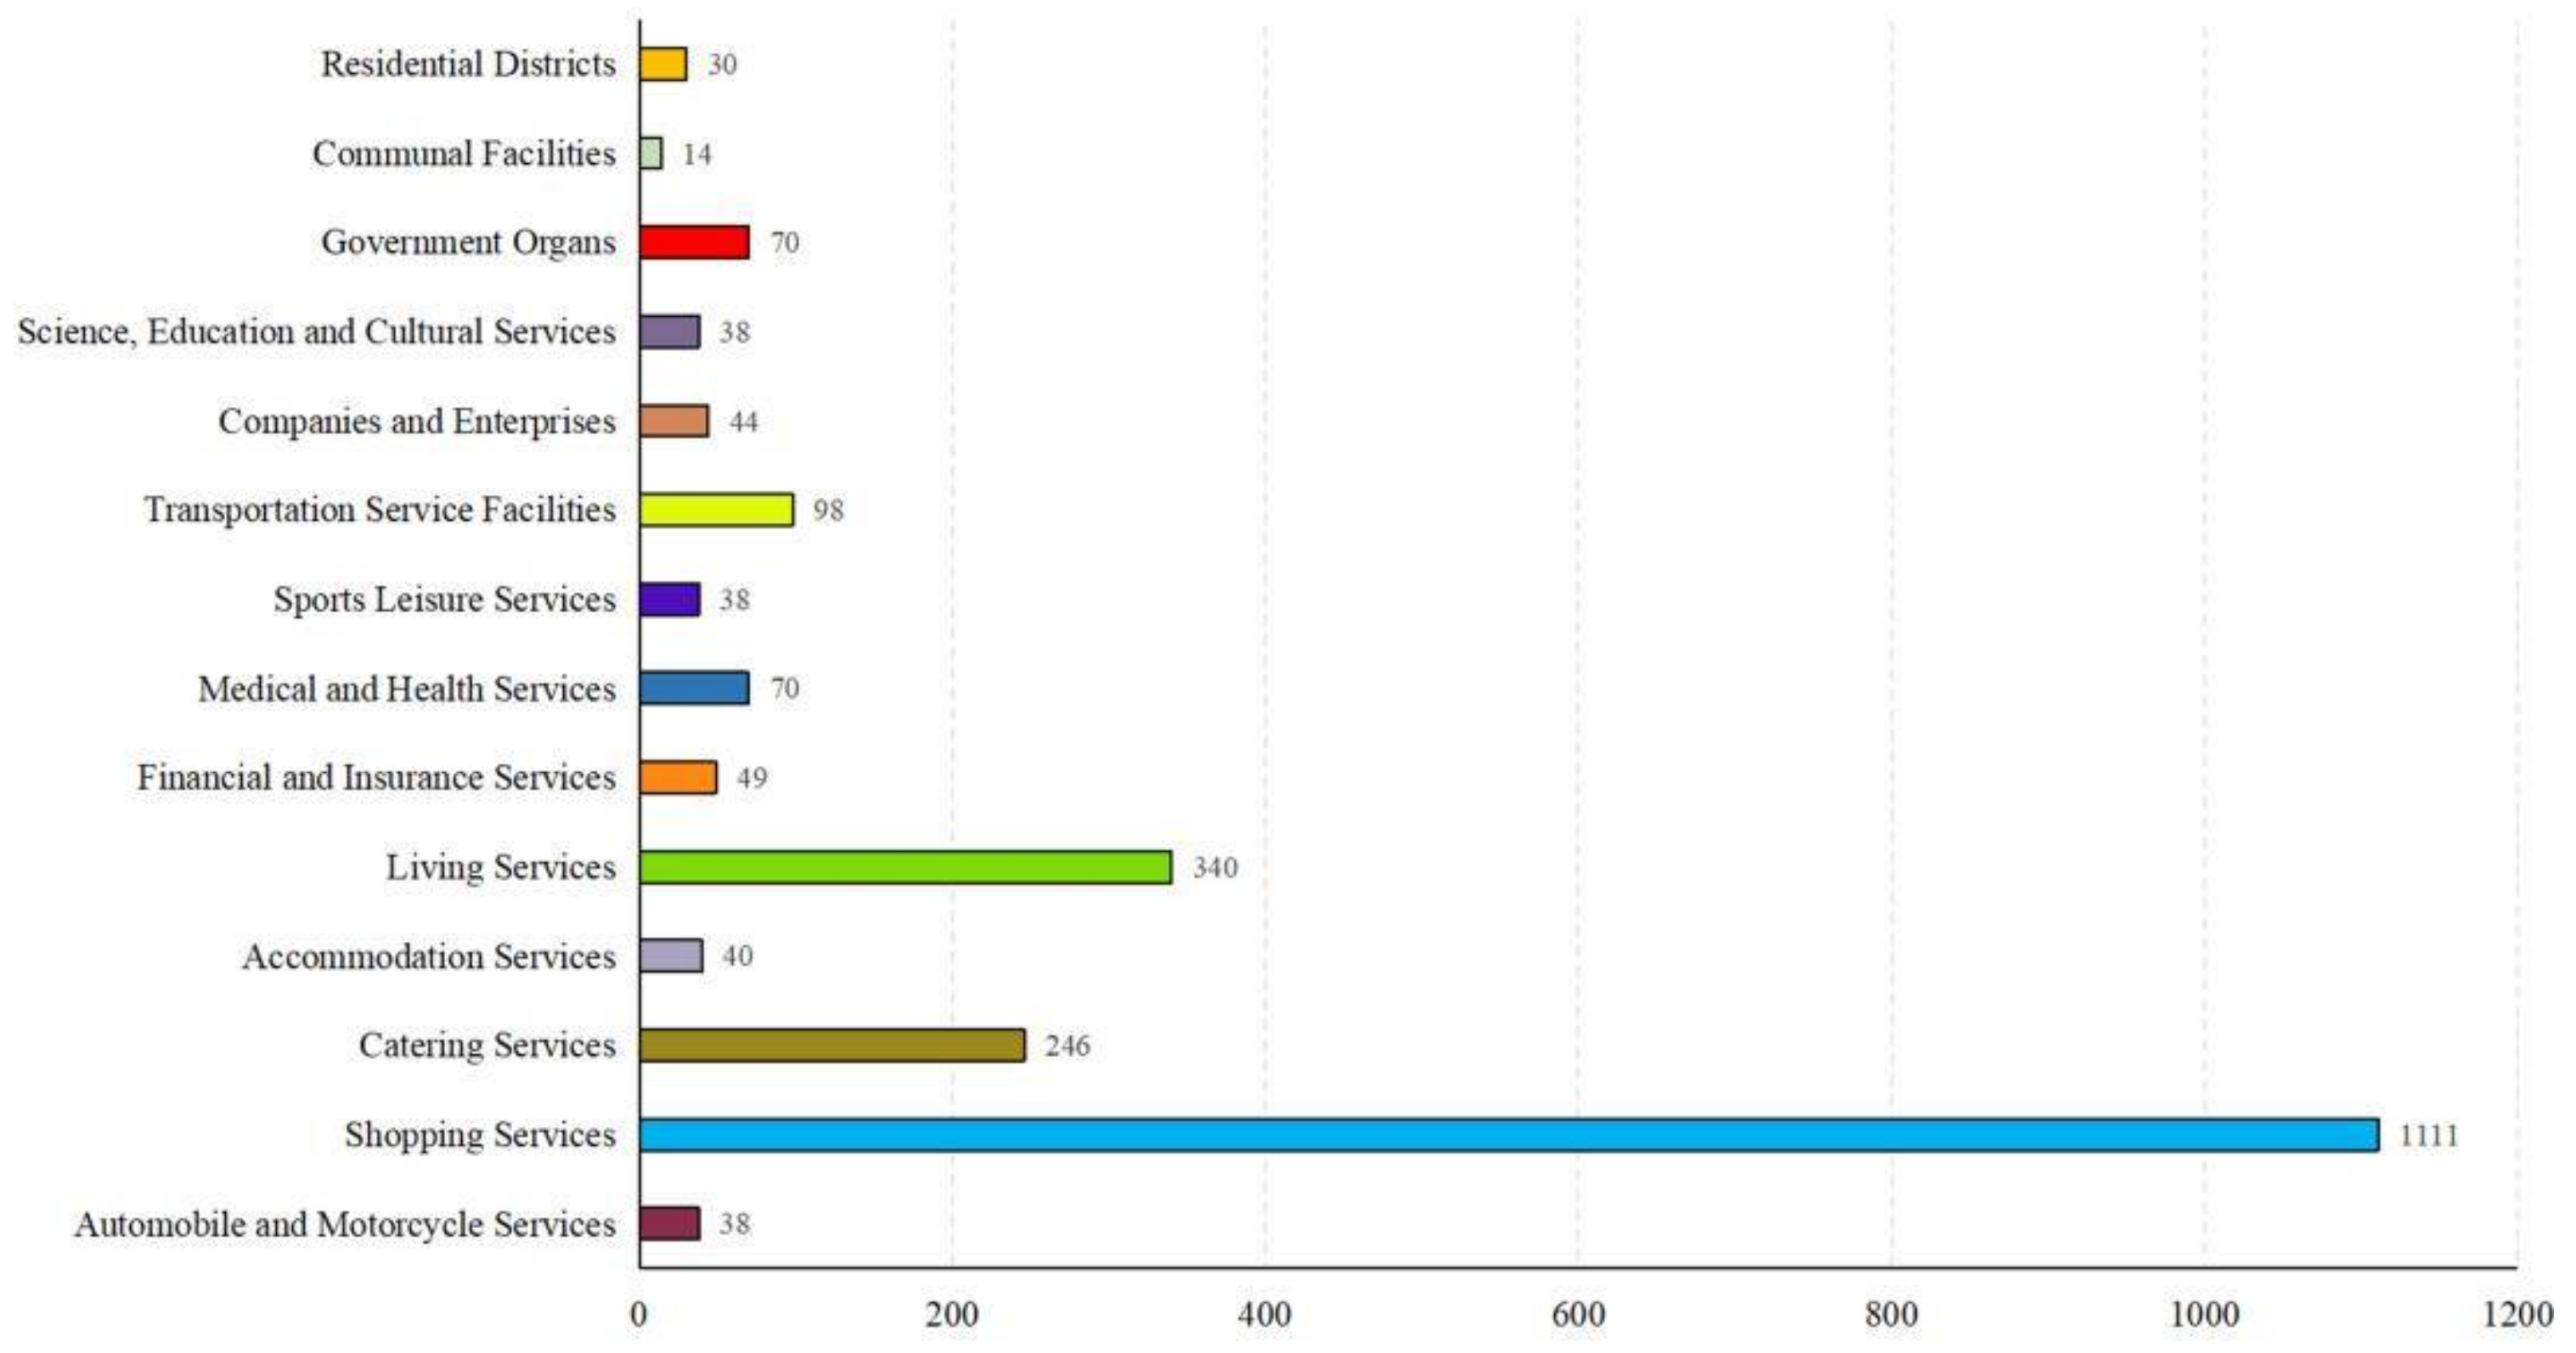
| Vitality | Street Function | Land Function Mixture (LFM) | Relative percentage of two or more land use types in the area | where P is the proportion of the number of class i POIs to the number of all POIs in the street unit. M is the number of POI types in the street unit |
| Land Function Density (LFD) | Density of various POI points around the street | where Np is the number of POIs in the street unit, Lu is the length of the street unit | ||
| Accessibility | Traffic Accessibility (TA) | Walking time from the edge of the road to the nearest bus station and subway entrance | Origin–Destination Cost Matrix Network Analysis based on ArcGIS software | |
| Hot Spot Accessibility (HSA) | Walking time from the edge of the road to the nearest activity hot spot | Origin–Destination Cost Matrix Network Analysis based on ArcGIS software | ||
| Population | Population Density (PD) | Ratio of population to area in the region | where S is the residential building area in the street unit, P is the per capita residential building area of the city, and Su is the area of the street unit |
| Data Types | Data Subtypes |
|---|---|
| Urban Spatial Data | urban road network GIS data, urban road network CAD data |
| Building Data | building GIS data, building height data |
| Image Data | street view images, remote sensing images, site photos |
| POI Data | POI data containing name, type, location, longitude, and latitude, etc. |
| Official Report Data | data of per capita residential building area of the city |
| Building LCZs | Explanation | EP | Nature LCZs | Explanation | EP |
|---|---|---|---|---|---|
| LCZ 1 | Compact high-rise | 4 | LCZ 11 | Dense trees | 6 |
| LCZ 2 | Compact multi-floor | 1 | LCZ 12 | Scattered trees | 6 |
| LCZ 3 | Compact mid-rise | 1 | LCZ 13 | Scrub | 5 |
| LCZ 4 | Compact low-rise | 1 | LCZ 14 | Low plants | 5 |
| LCZ 5 | Compact low-middle-rise mixed | 2 | LCZ 15 | Bare paved | 3 |
| LCZ 6 | Open high-rise | 2 | LCZ 16 | Bare soil | 3 |
| LCZ 7 | Open mid-rise | 4 | LCZ 17 | Water | 10 |
| LCZ 8 | Open low-rise | 1 | |||
| LCZ 9 | Lightweight low-rise | 5 | |||
| LCZ 10 | Large low-rise | 0 | |||
| LCZ 11 | Large low-rise mixed with plant | 3 | |||
| LCZ 12 | Sparsely built | 5 |
| Type | Subtype | Score |
|---|---|---|
| Residence | Multi-Story Residential | 4 |
| High-Rise Residential | 5 | |
| Villa | 6 | |
| Commercial Buildings | Commercial Street | 6 |
| Shopping Mall | 7 | |
| Hotel | 7 | |
| Public Buildings | School | 7 |
| Hospital | 4 | |
| Service Building | 5 | |
| Office Building | 6 | |
| Traditional Style Architecture | Traditional Style Architecture | 8 |
| Industrial Building | Industrial Building | 2 |
| Public Squares/Parks | Public Squares/Parks | 10 |
| Undeveloped Land | Undeveloped Land | 0 |
| Grade | Title 2 |
|---|---|
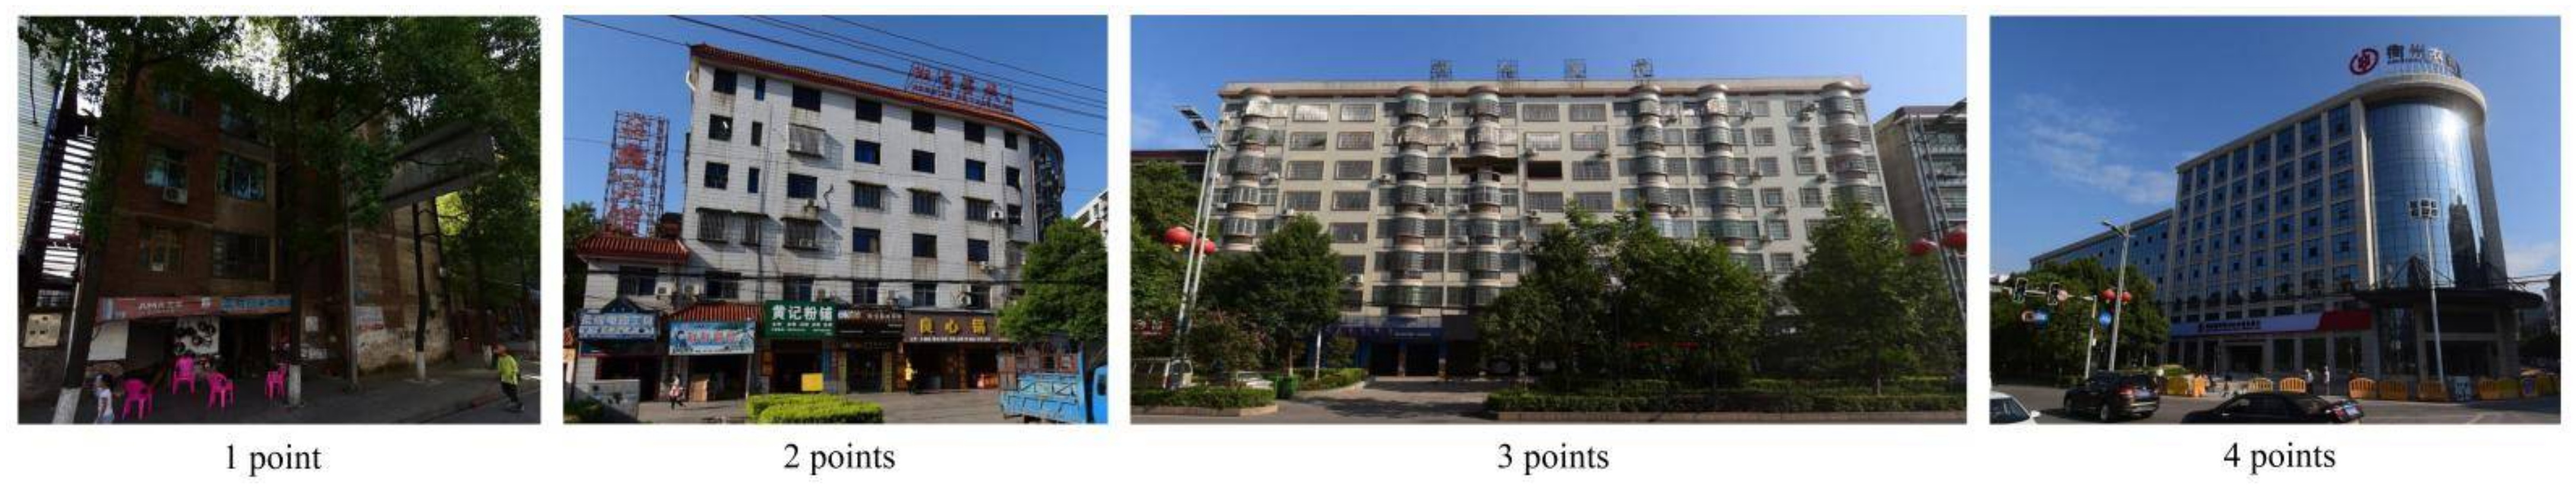
| 1 Point | The exterior wall of the building is made of exposed cement or brick; The architectural form and construction technology are backward; The walls and building components show obvious fading, corrosion, aging, and even damage and deformity; It is difficult for the building to meet the requirements of use. |
| 2 Points | The architectural form and construction technology are relatively old; There is a small amount of corrosion and aging on the building walls and components; The building can still meet the requirements of normal use. |
| 3 Points | The building facade is clean and tidy; The architectural form and construction technology are relatively new, and some parts have certain modeling characteristics; The building wall materials are of high quality and various colors. |
| 4 Points | The architectural form and construction technology are novel; The building wall materials are of high quality and various colors; The building possesses characteristics of fashionable and beautiful urban architecture. |
| Positive Correlation | Negative Correlation | Constant Value | |
|---|---|---|---|
| Calculation Formula | |||
| Explanation | where Xmax and Xmin are the maximum and minimum values of indicator data in this interval | where Xmax and Xmin are the maximum and minimum values of indicator data in this interval | where a is the fixed value of X’ in this interval, which is 0 or 1 in this study, indicating the worst or the best level |
Publisher’s Note: MDPI stays neutral with regard to jurisdictional claims in published maps and institutional affiliations. |
© 2022 by the authors. Licensee MDPI, Basel, Switzerland. This article is an open access article distributed under the terms and conditions of the Creative Commons Attribution (CC BY) license (https://creativecommons.org/licenses/by/4.0/).
Share and Cite
Zheng, B.; Guo, R.; Bedra, K.B.; Xiang, Y. Quantitative Evaluation of Urban Style at Street Level: A Case Study of Hengyang County, China. Land 2022, 11, 453. https://doi.org/10.3390/land11040453
Zheng B, Guo R, Bedra KB, Xiang Y. Quantitative Evaluation of Urban Style at Street Level: A Case Study of Hengyang County, China. Land. 2022; 11(4):453. https://doi.org/10.3390/land11040453
Chicago/Turabian StyleZheng, Bohong, Rui Guo, Komi Bernard Bedra, and Yanfen Xiang. 2022. "Quantitative Evaluation of Urban Style at Street Level: A Case Study of Hengyang County, China" Land 11, no. 4: 453. https://doi.org/10.3390/land11040453
APA StyleZheng, B., Guo, R., Bedra, K. B., & Xiang, Y. (2022). Quantitative Evaluation of Urban Style at Street Level: A Case Study of Hengyang County, China. Land, 11(4), 453. https://doi.org/10.3390/land11040453