
Analysis of Effects of Sponge City Projects Applying the Geodesign Framework

Abstract
:1. Introduction
1.1. Background and Goals
1.2. Concept of Sponge City
1.3. Literature Reviews
2. Methodology
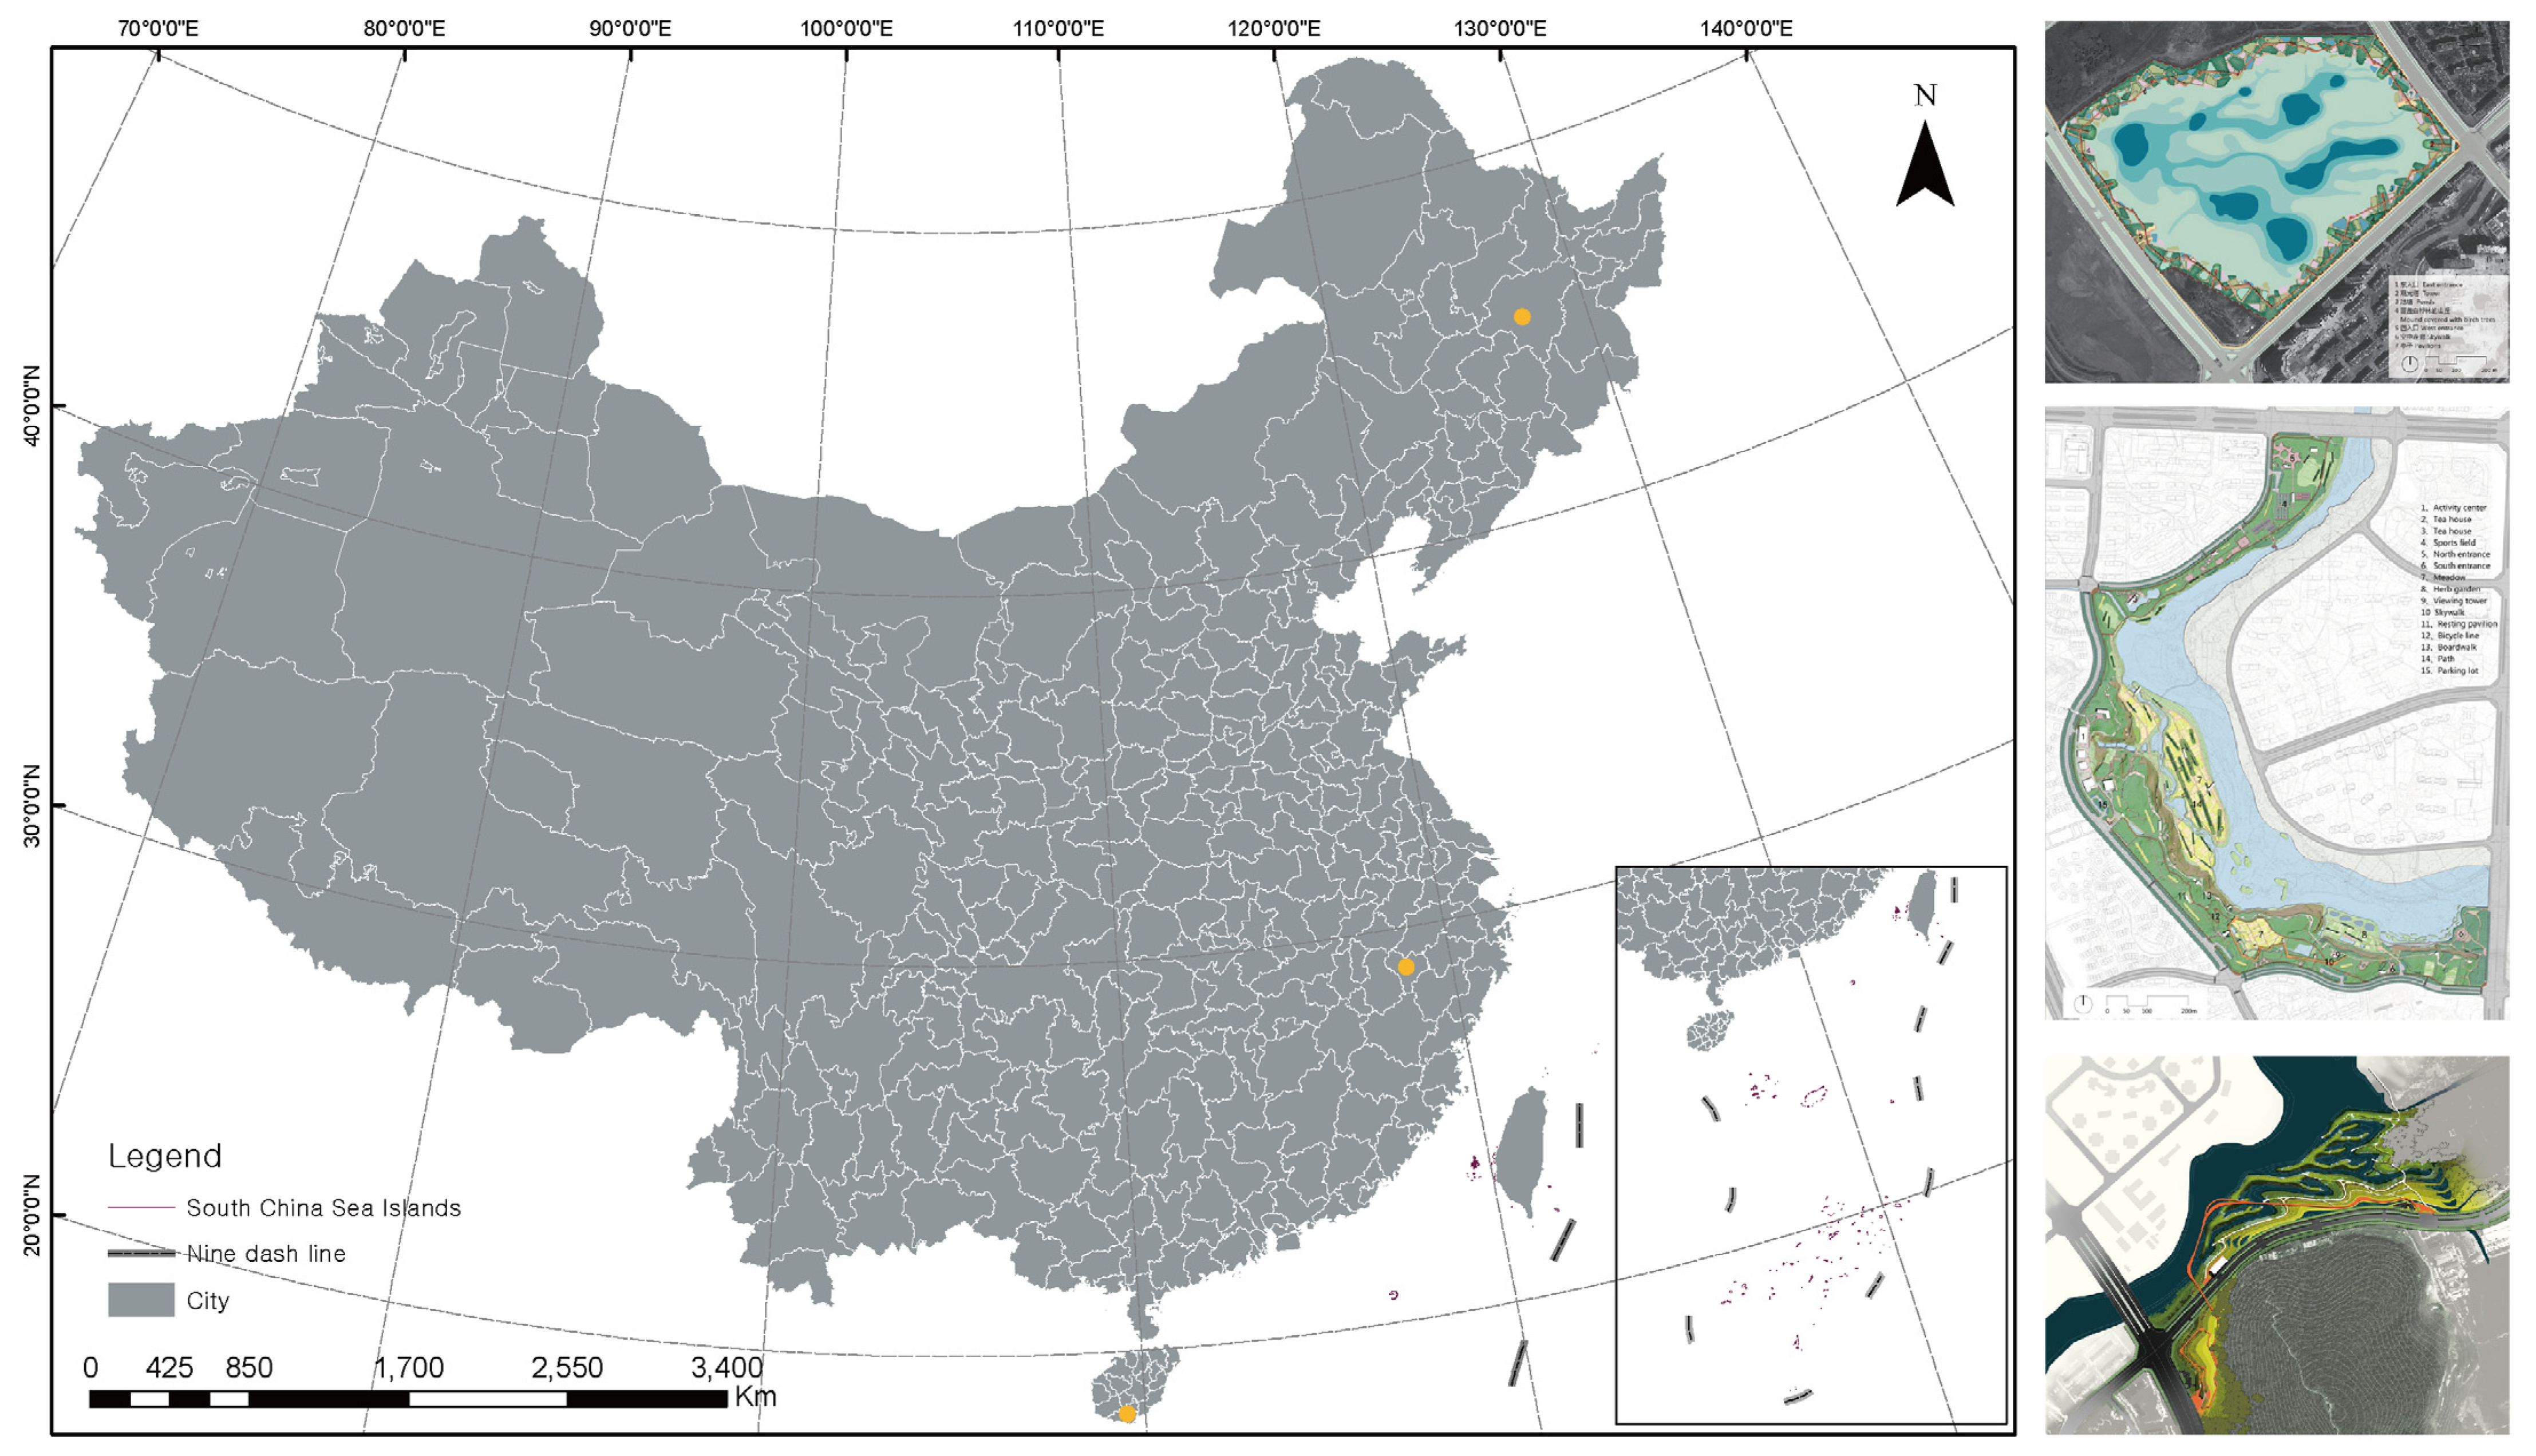
2.1. Study Area
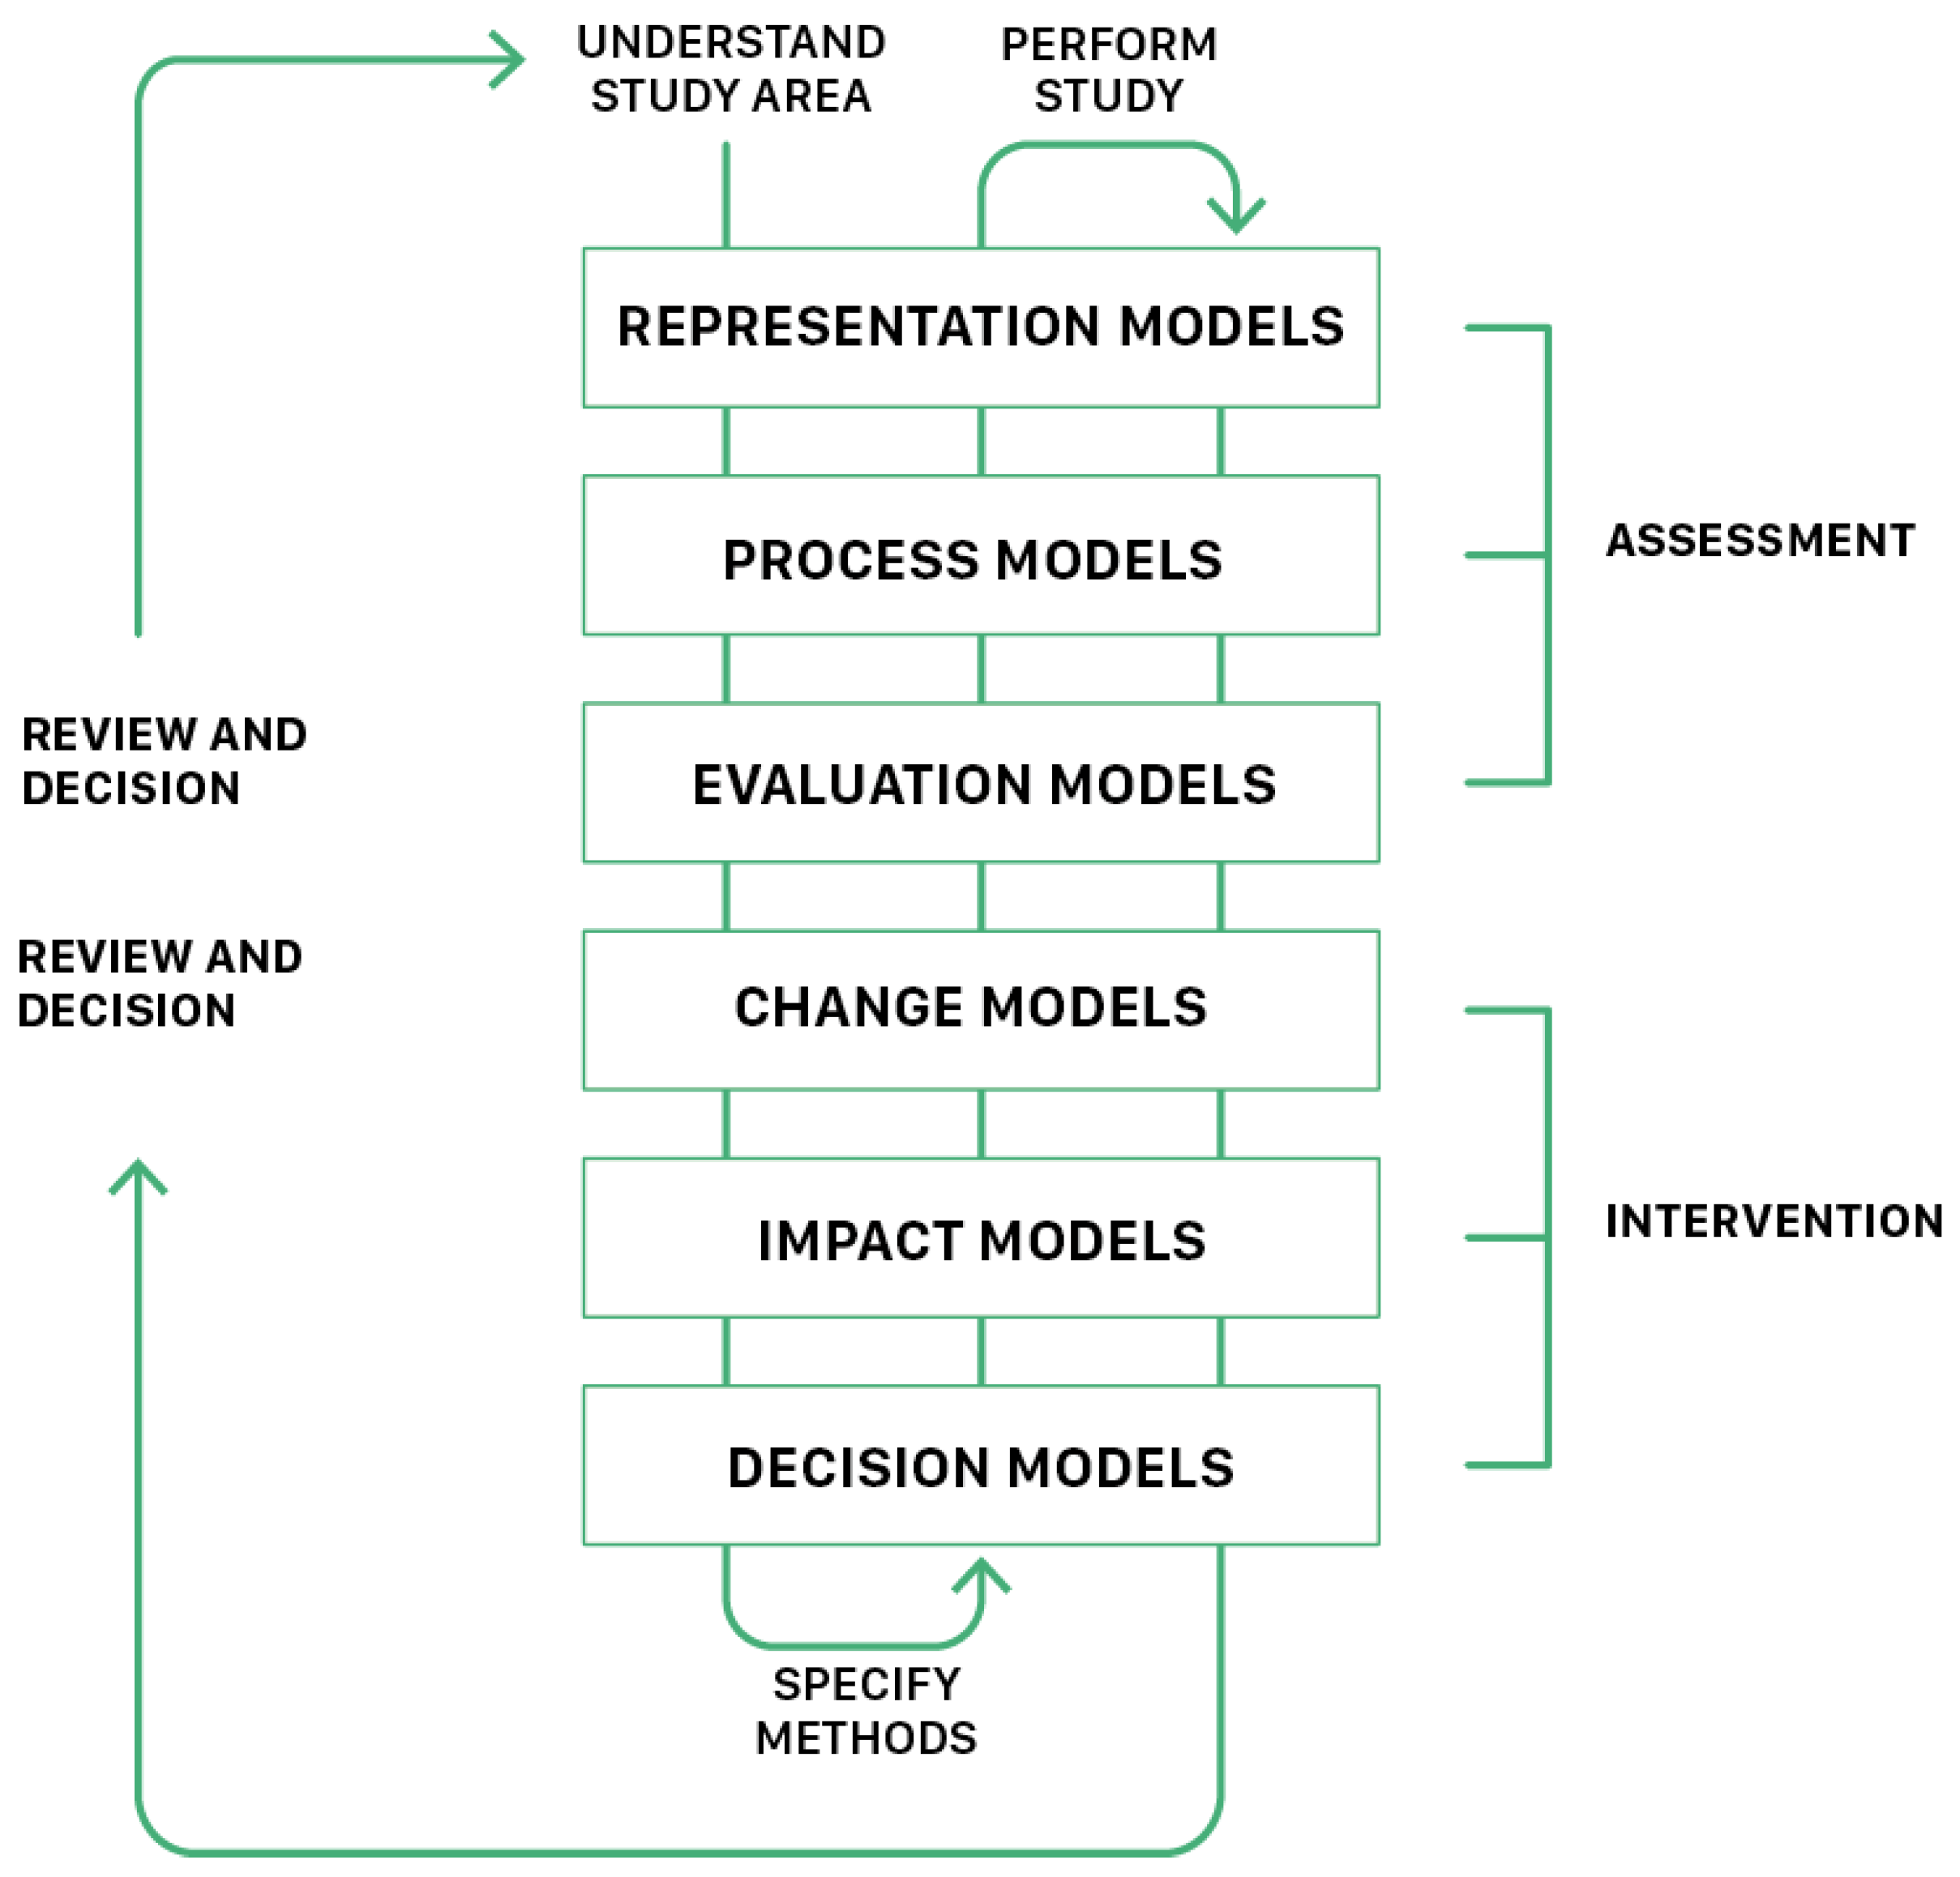
2.2. Method of Geodesign Framework
2.3. Scenario Design
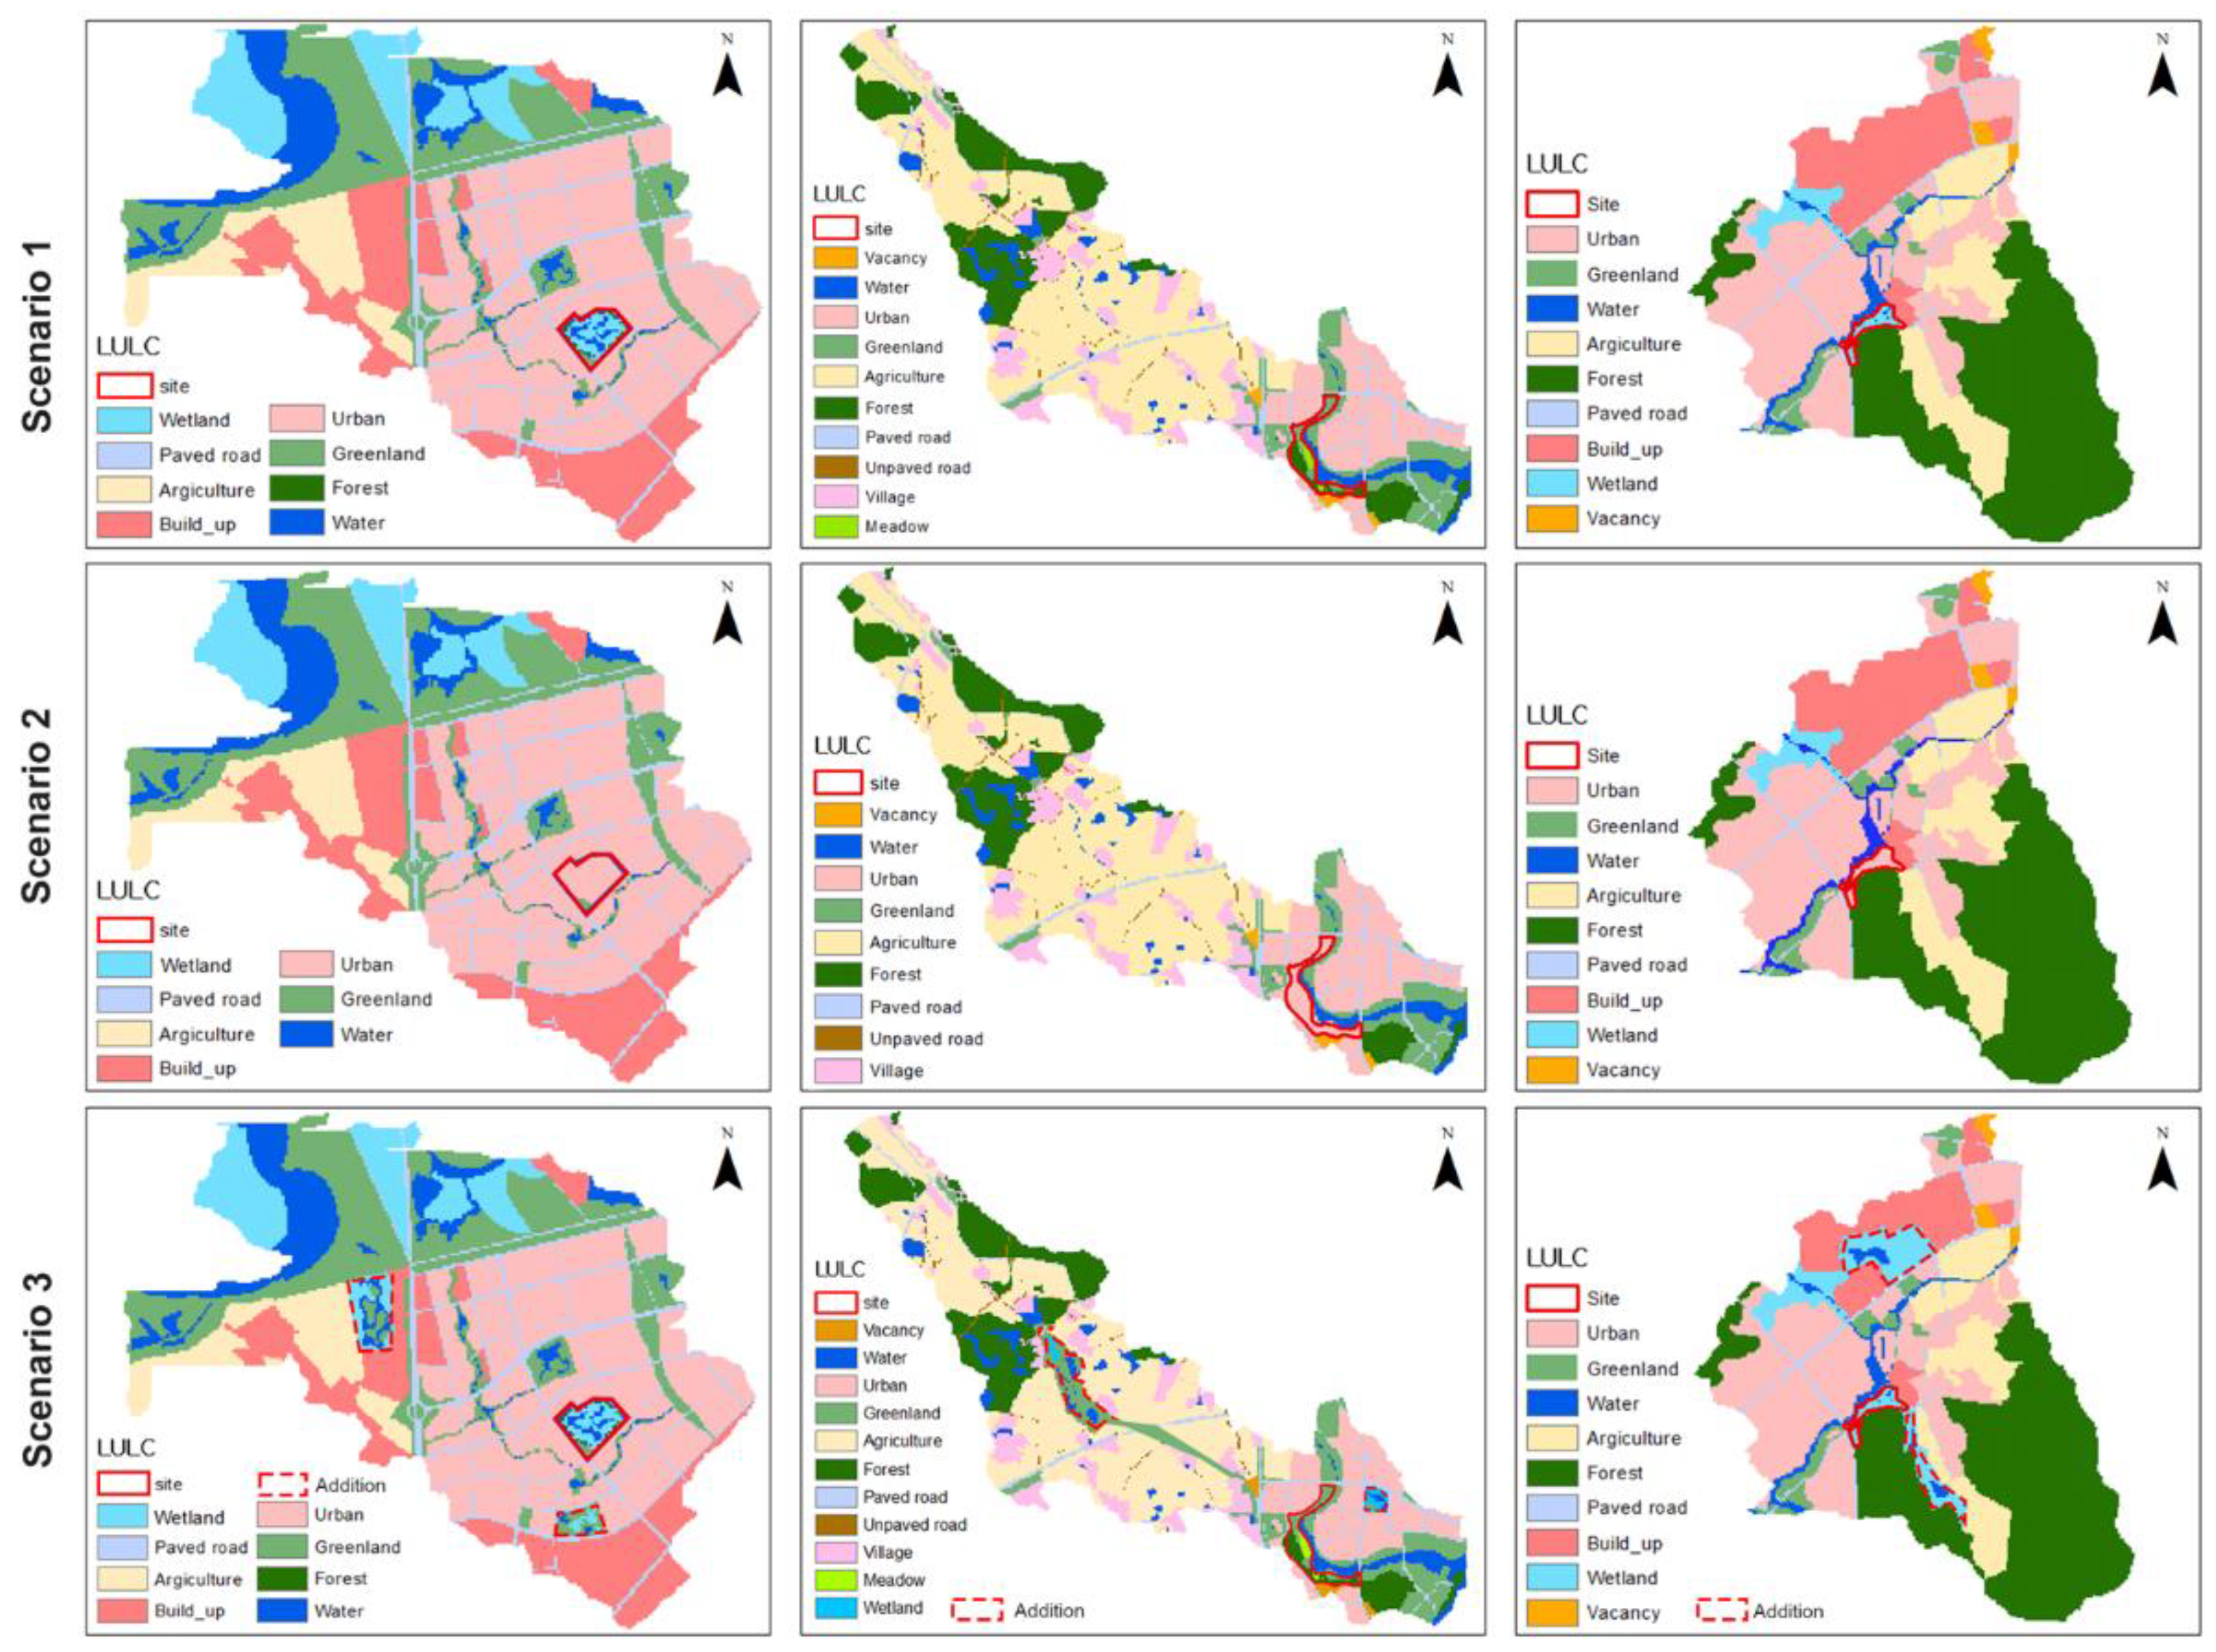
- Scenario 1 (Existing project): Scenario 1 represents the current sponge project. It is equivalent to the current condition of the study area following the original plan.
- Scenario 2 (Maximization of development): Scenario 2 assumes the maximum development condition replacing the current sponge project, of which land use is designated to park or green space, and to other land use more suitable for urban development, for instance, residential or commercial areas.
- Scenario 3 (Maximization of sponge city): Scenario 3 assumes maximizing sponge projects in the urban area replacing selected developments to wetlands or parks located at proper sites to enhance sponge city performance. Scenario 3 adds more sponge projects in addition to the existing project.
2.4. InVEST Model Analysis
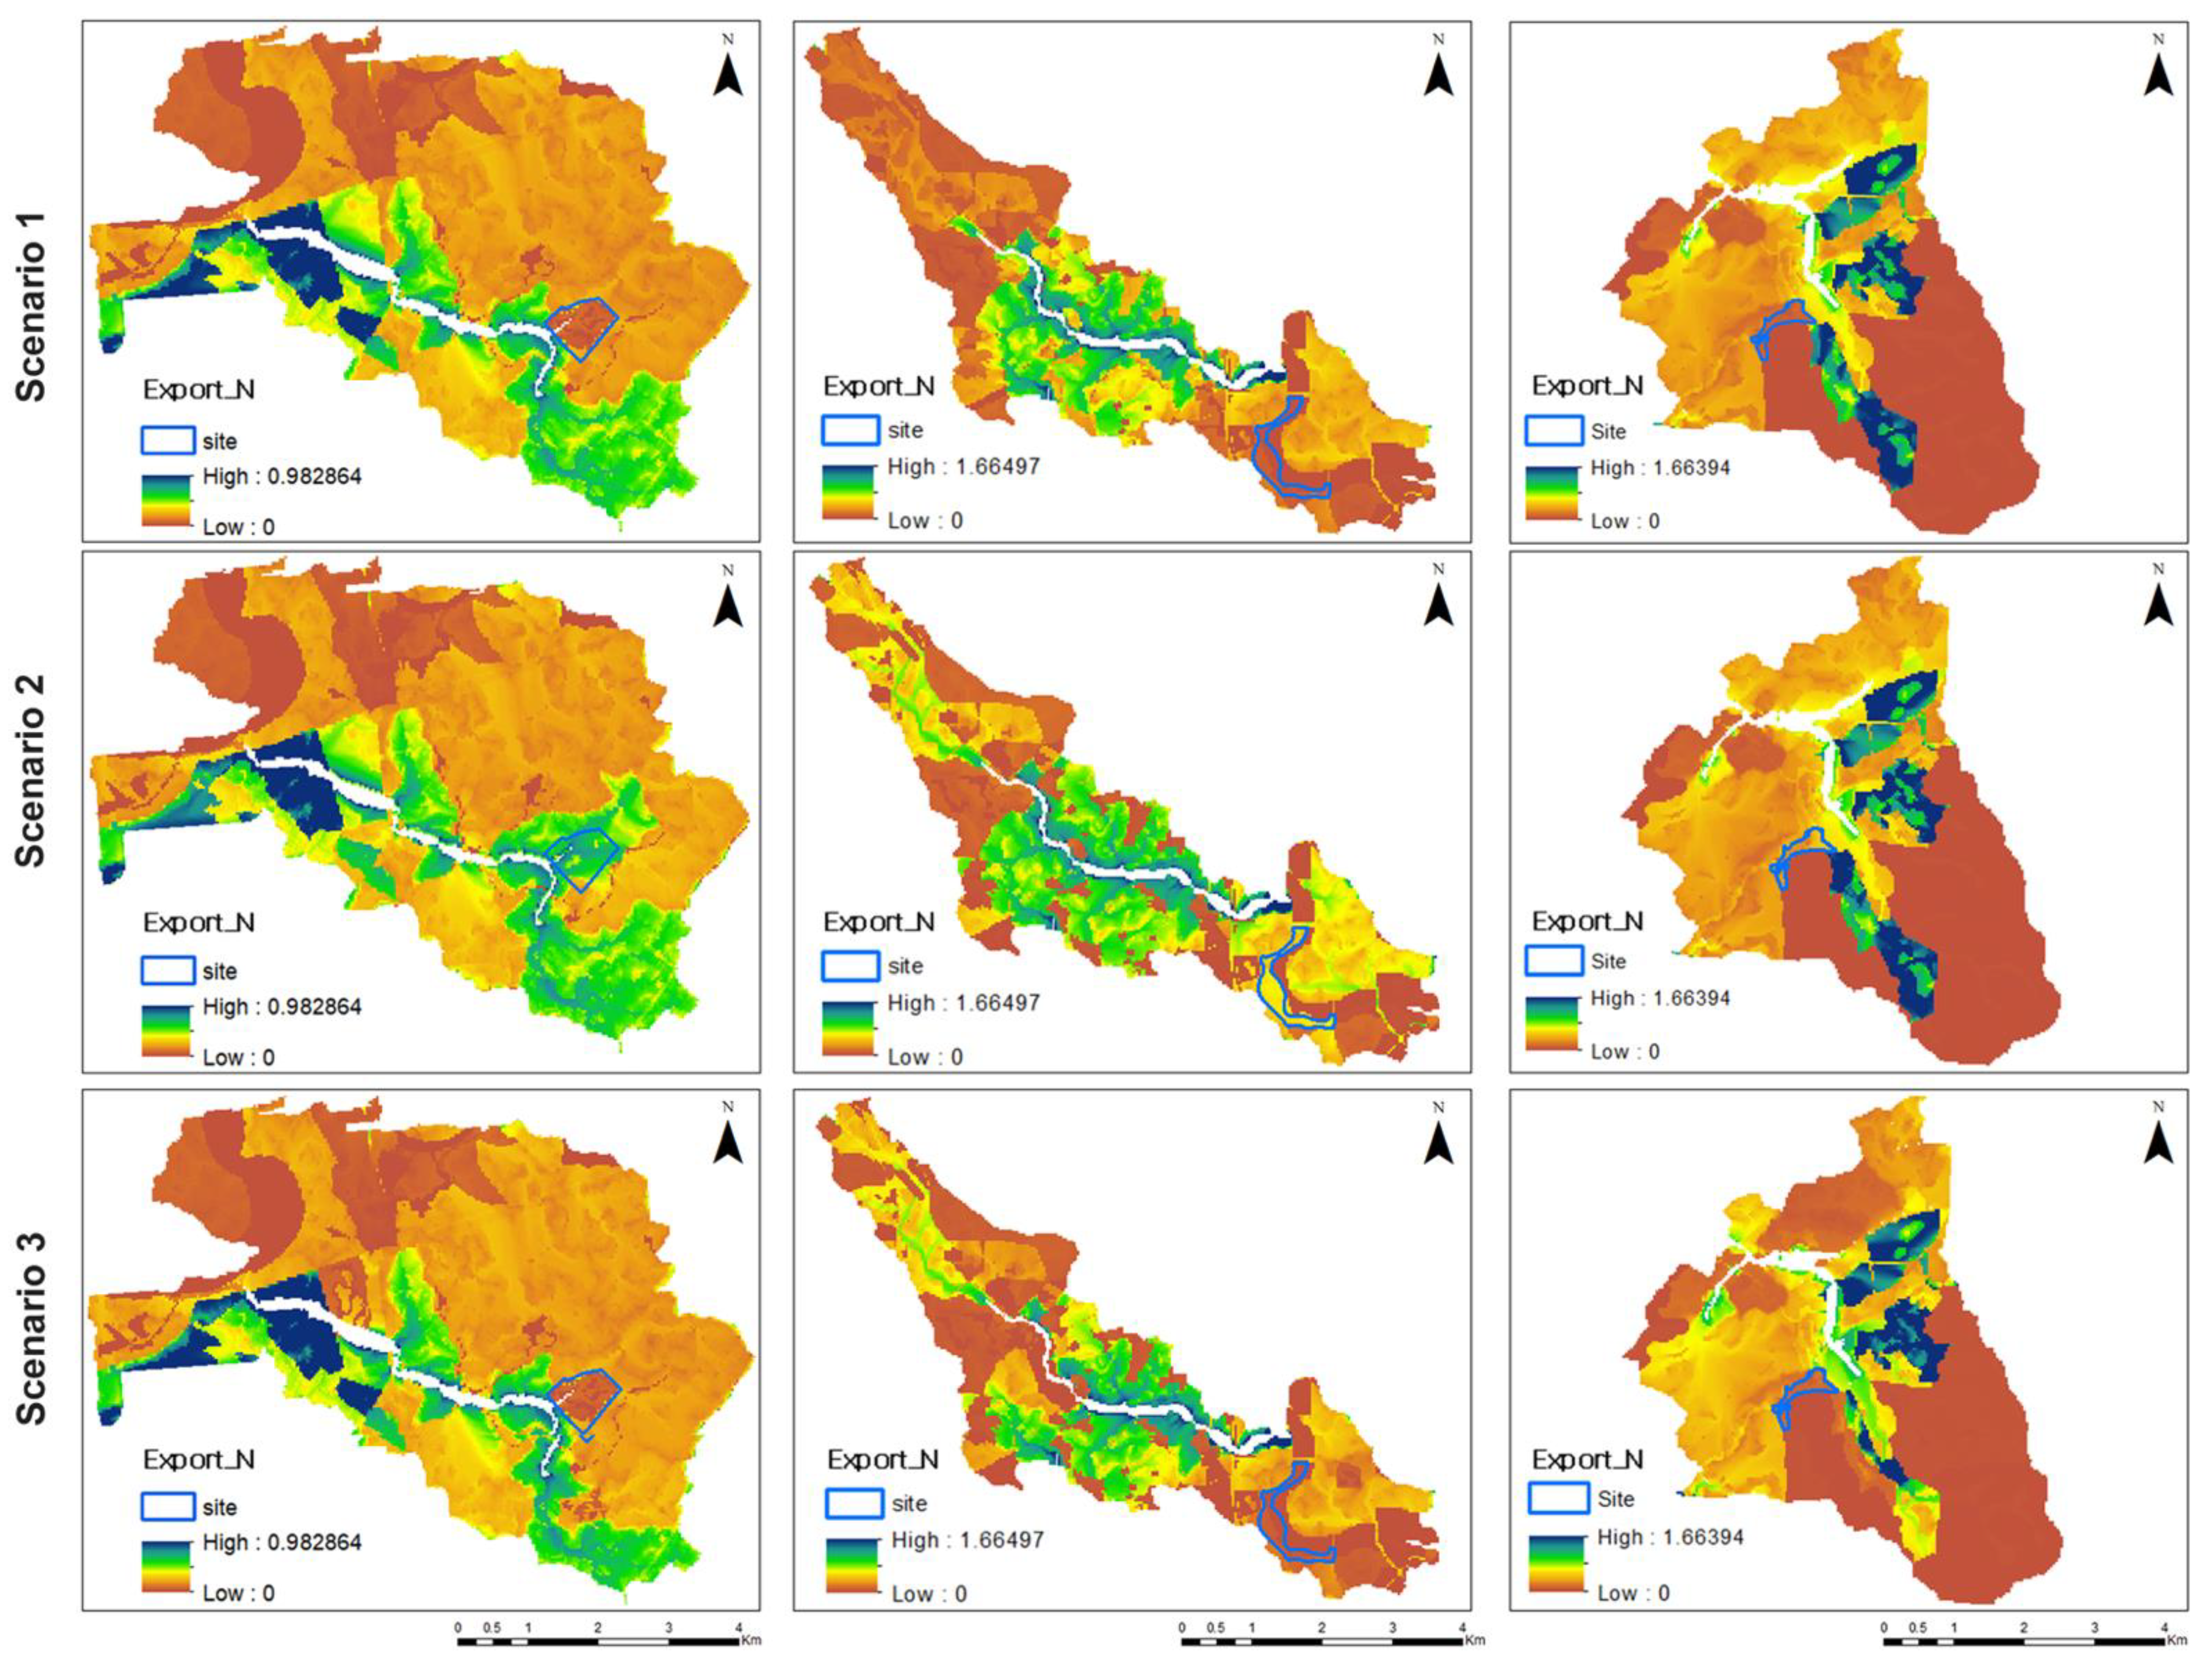
2.4.1. Nutrient Delivery Ratio Model
- DEM data downloaded from Geospatial Data Cloud (http://www.gscloud.cn/ (accessed on 3 November 2020)). were transformed into the raster data with a spatial resolution of 30 × 30 m, using ArcGIS.
- LULC data of 2019 was collected from the database of the USGS. Using the high-resolution remote sensing ground survey results, the input data required to analyze scenarios were made in the resolution of 30 × 30 m using ArcGIS.
- The nutrient runoff proxy data were made from the precipitation data of 2019, collected from the Greenhouse database (http://data.sheshiyuanyi.com (accessed on 15 November 2020)), and obtained by processing the inverse distance weighted (IDW).
- The watershed was extracted through the hydrological analyst tool provided in ArcGIS using DEM as the primary data for the sub-basin including the study area.
- The maximum retention efficiency (EFF) data indicates the retention efficiency of vegetation for pollutants. Since there is no fixed value for the retention efficiency in the InVEST model, the study defined the values from reviewing the related literature [42]. The value of retention efficiency varied between 0 and 1, and the higher value yielded the greater retention efficiency of the pollutant.
- The critical length (critlen) indicates the retention distance of LULC against contaminants at maximum capacity [43].
2.4.2. Urban Flood Risk Mitigation Model
- The soil hydrologic group in a raster data is downloaded from the ORNL (https://daac.ornl.gov/SOILS/guides/Global_Hydrologic_Soil_Group.html (accessed on 7 December 2020)).
- The curve number (CN) data are recommended in the literature review to analyze values specific to the study area.
3. Results
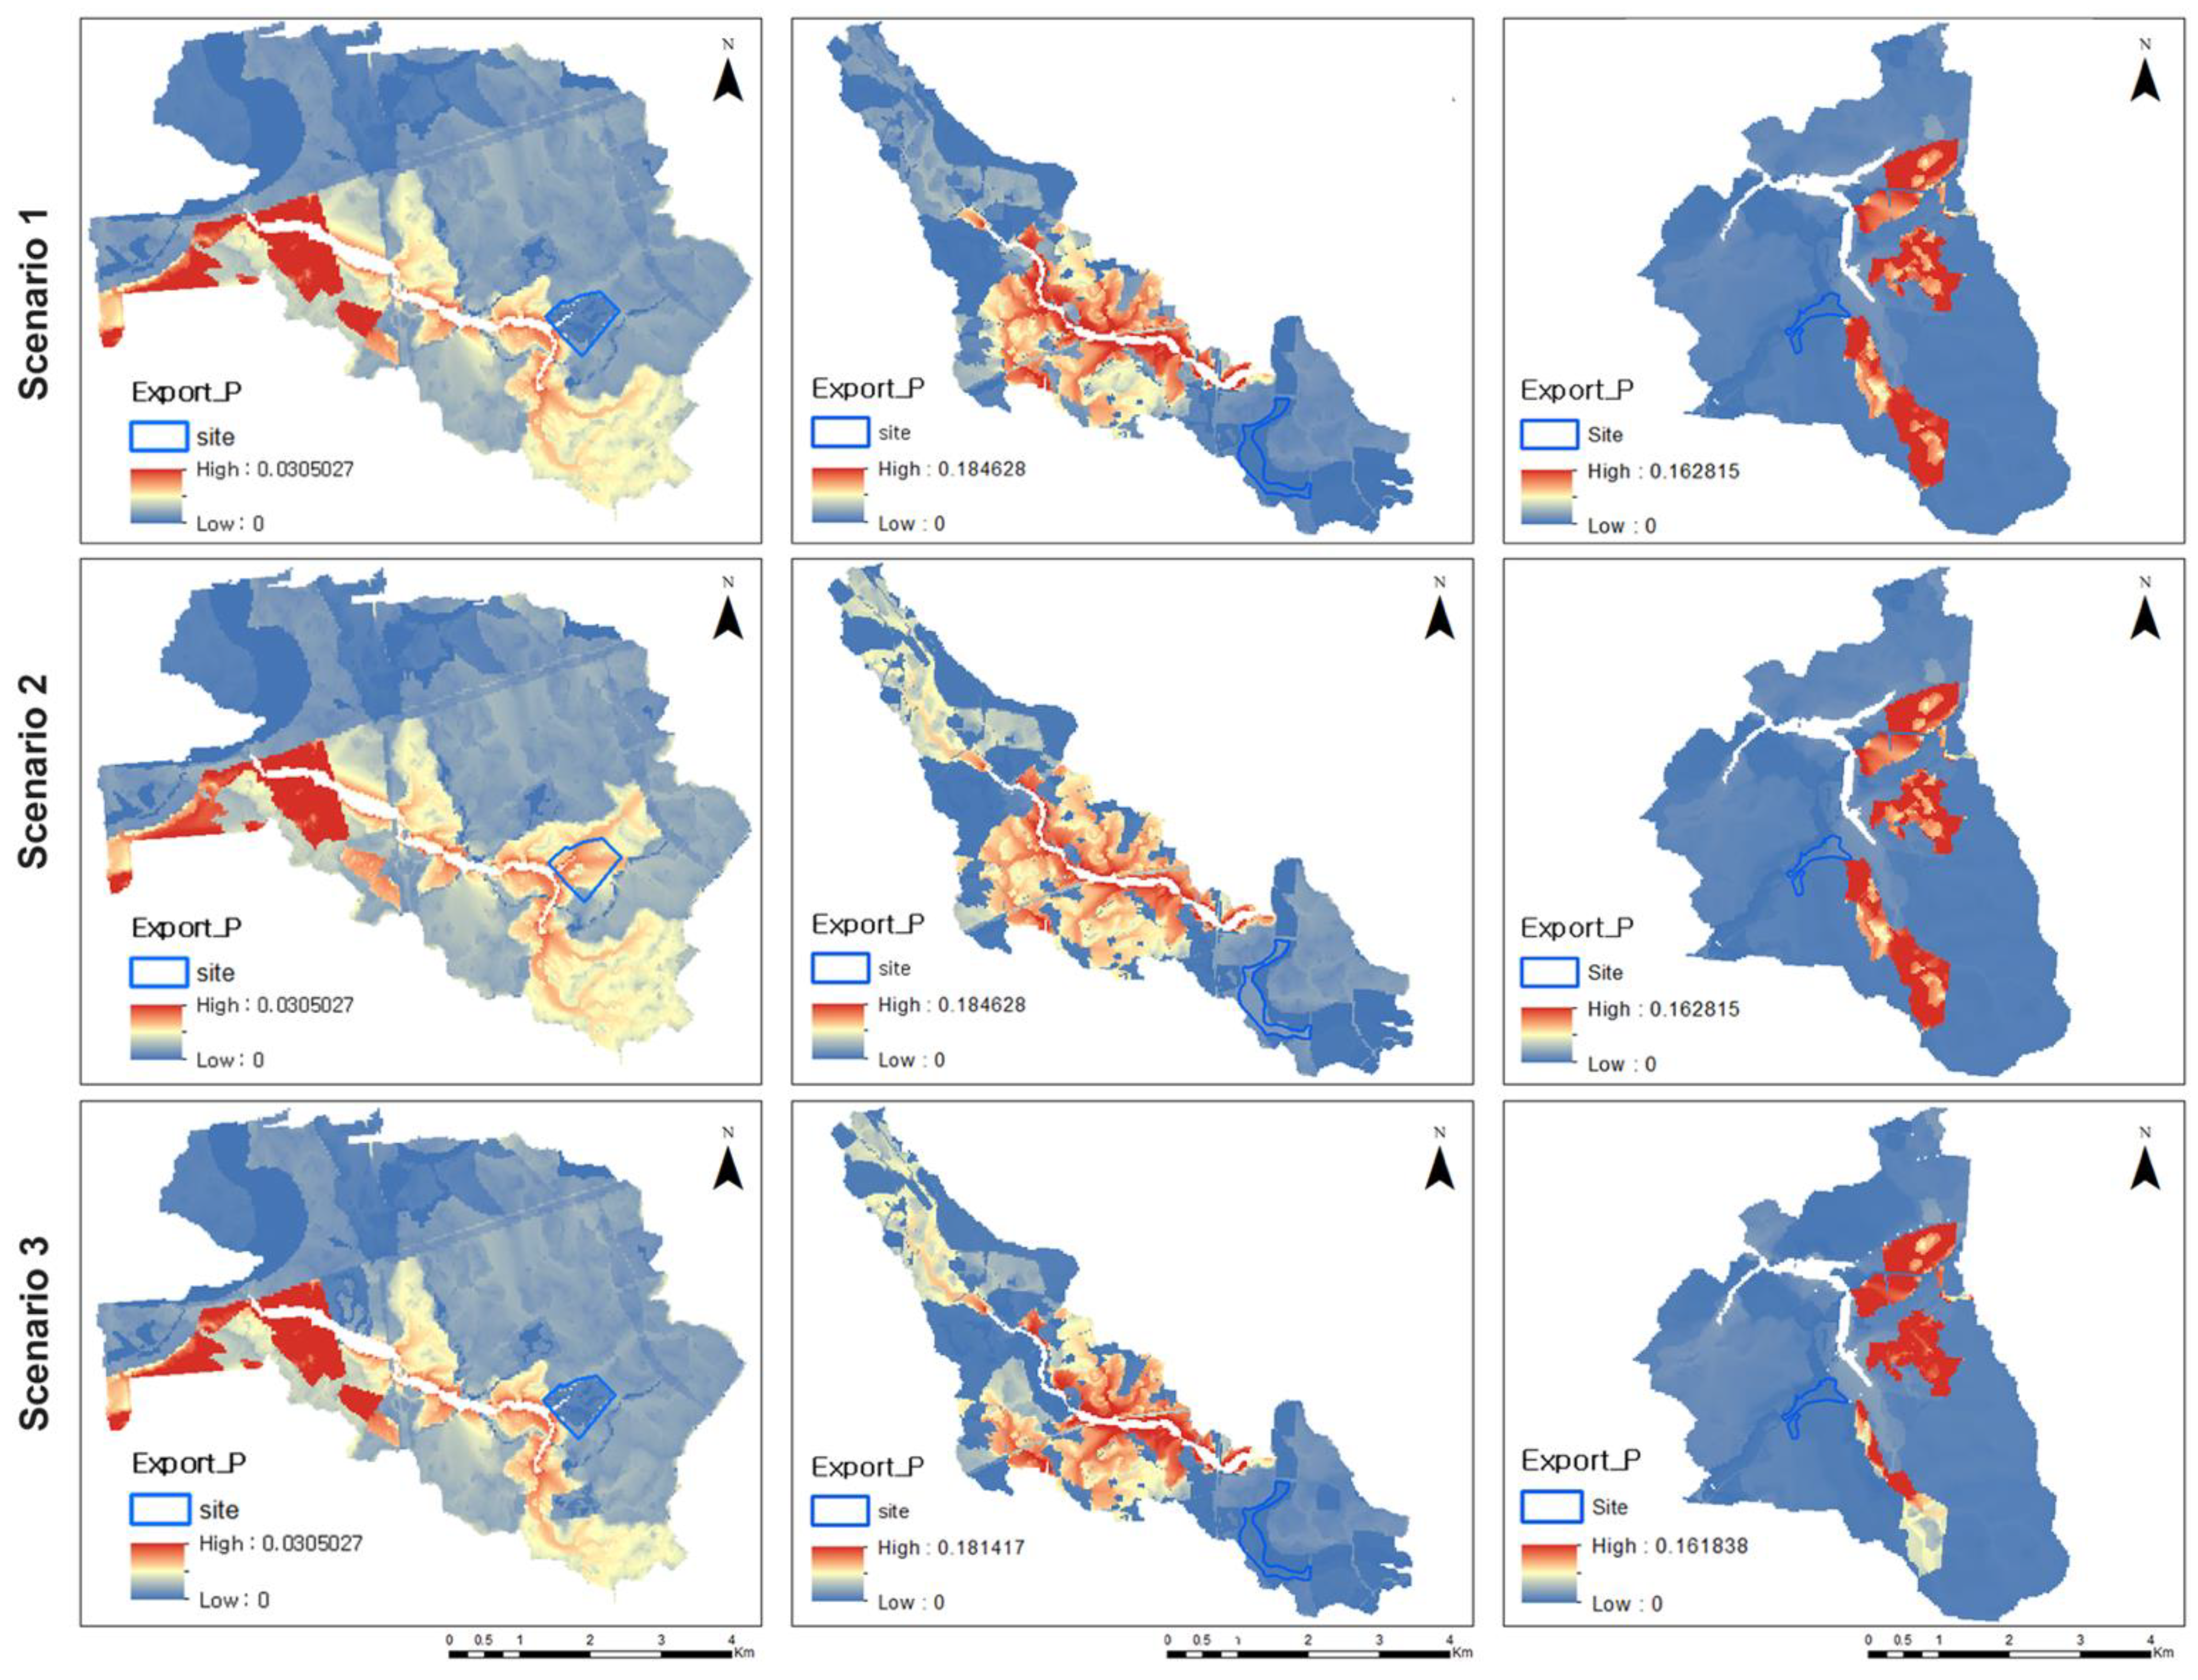
3.1. Pollutant Export Using the NDR Model
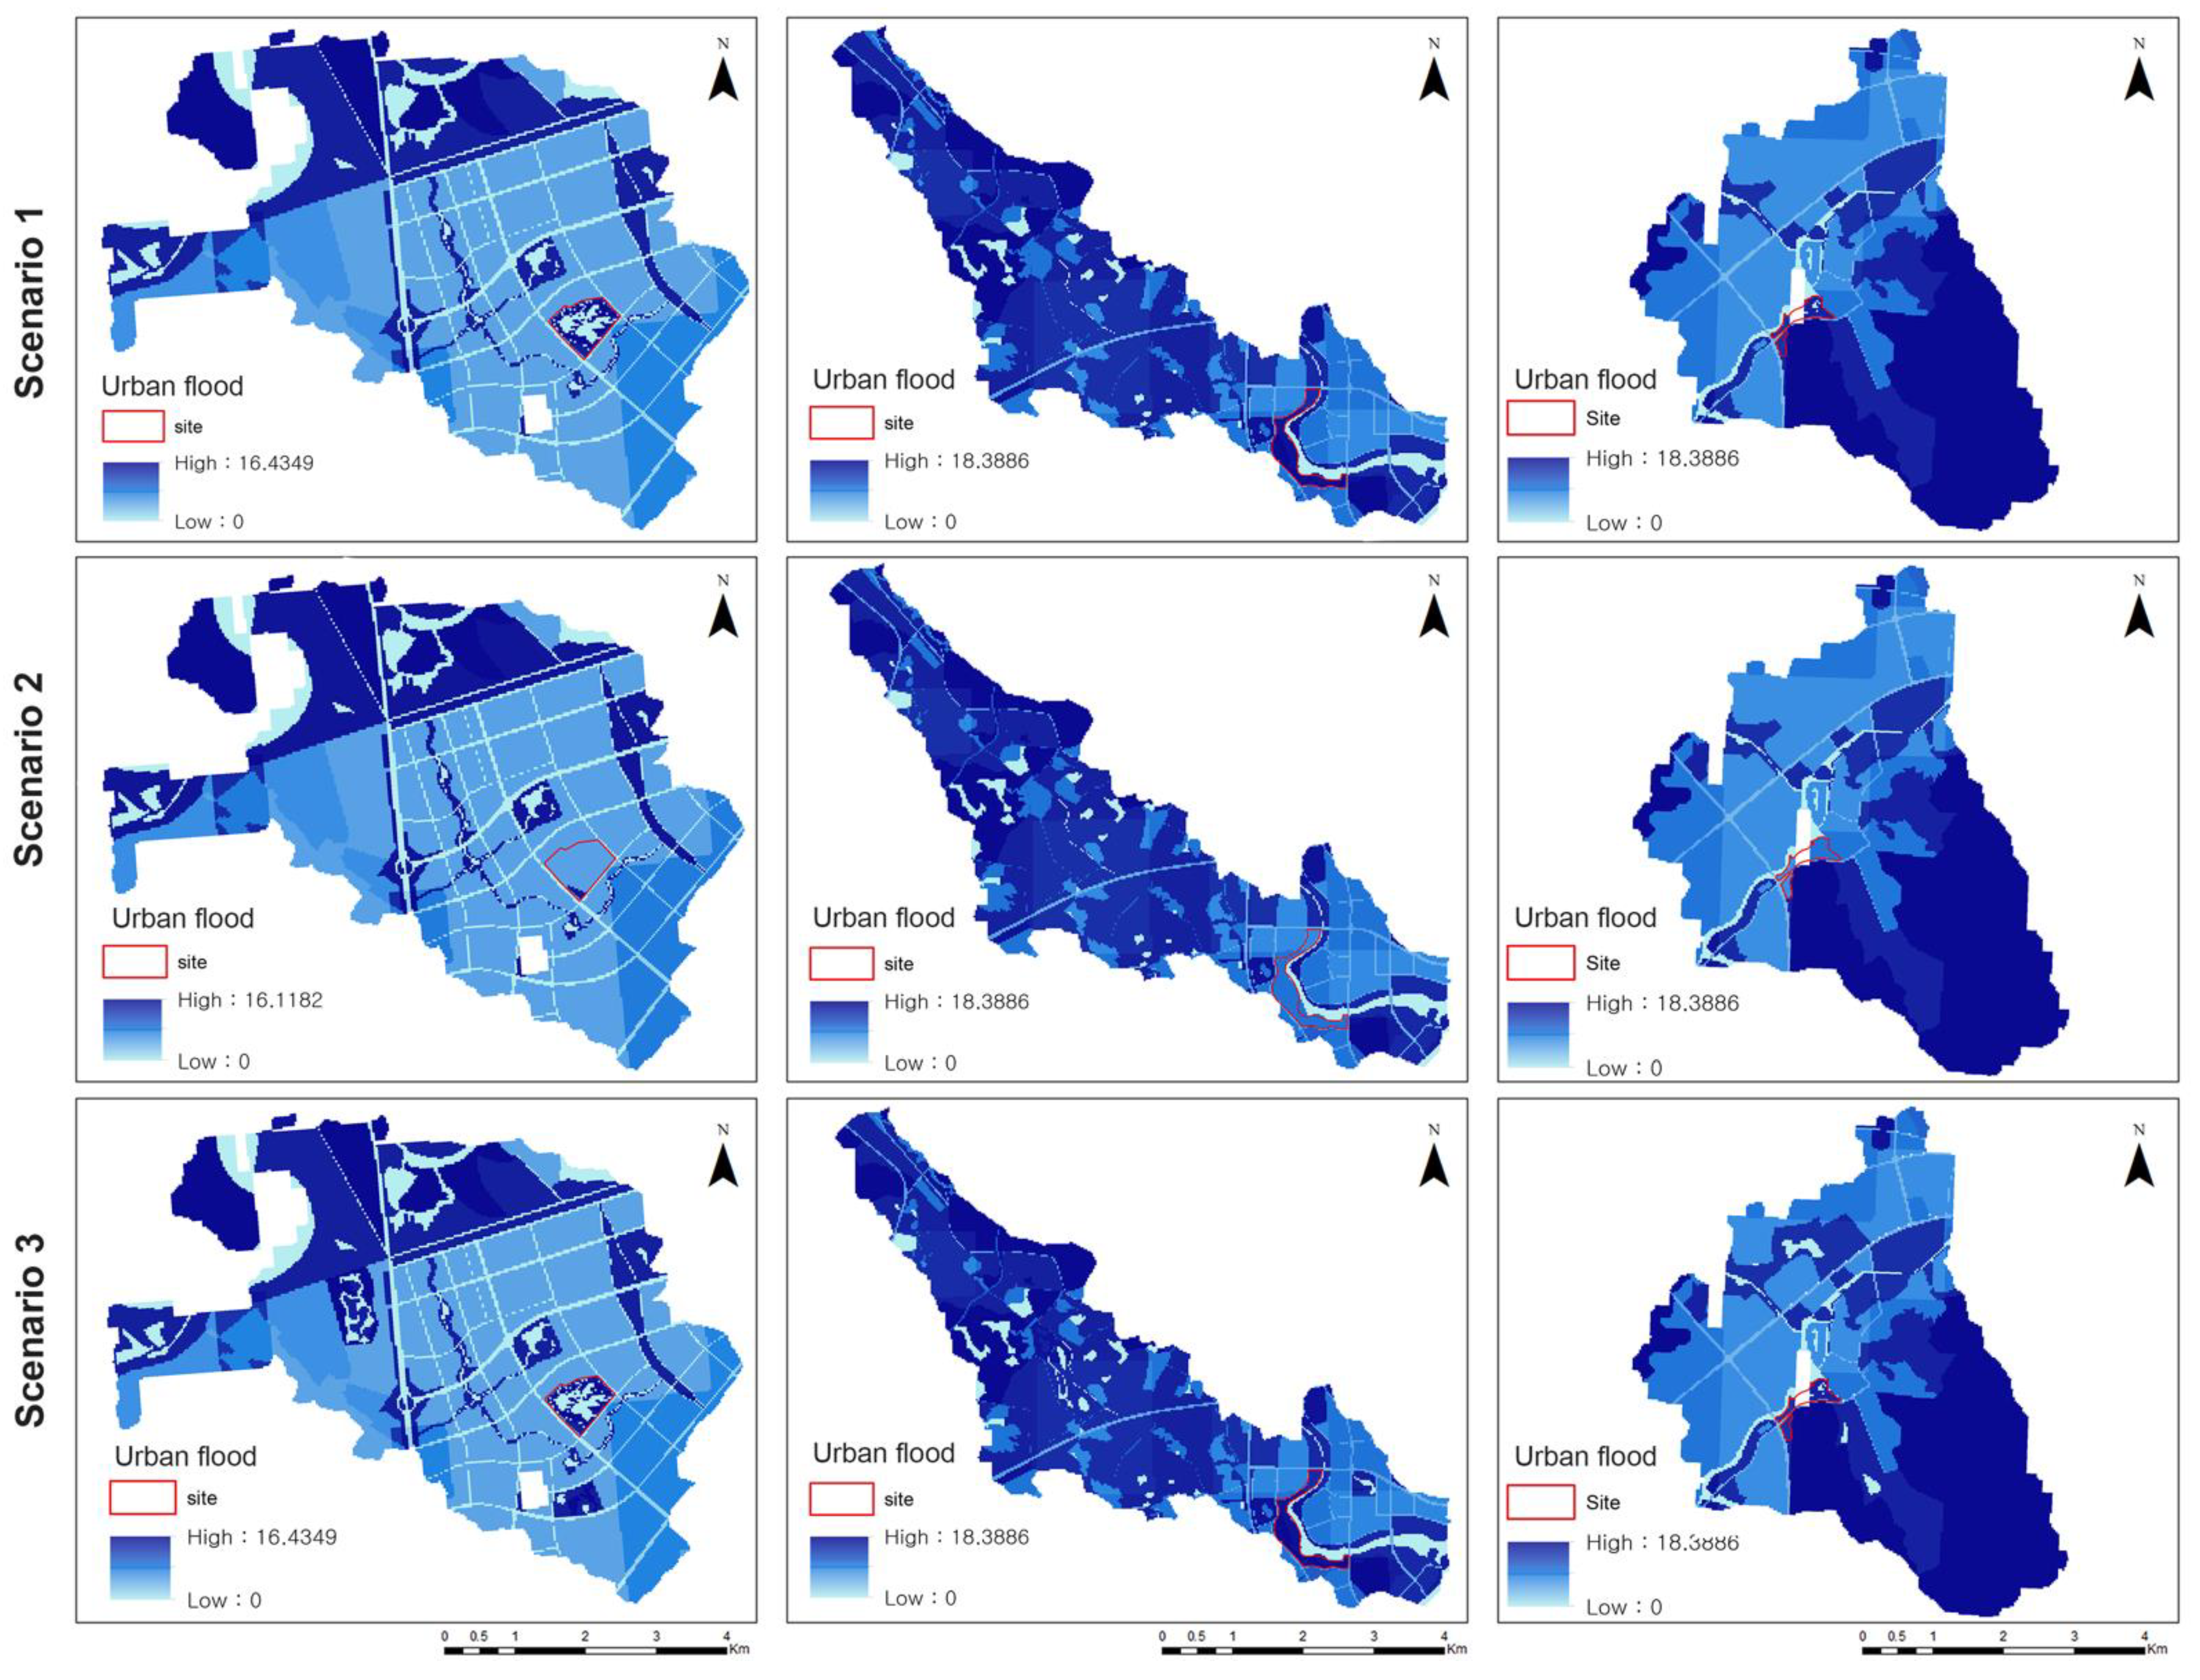
3.2. Urban Flood Export
4. Discussion
4.1. Pollutant Load Conrorl
4.2. Urban Flood Reduction
4.3. Limitations of the Model
5. Conclusions
Author Contributions
Funding
Institutional Review Board Statement
Informed Consent Statement
Data Availability Statement
Conflicts of Interest
References
- Ahiablame, L.M.; Engel, B.A.; Chaubey, I. Effectiveness of Low Impact Development Practices: Literature Review and Suggestions for Future Research. Water Air Soil Pollut. 2012, 223, 4253–4273. [Google Scholar] [CrossRef]
- Wang, J.; Banzhaf, E. Towards a better understanding of Green Infrastructure: A critical review. Ecol. Indic. 2018, 85, 758–772. [Google Scholar] [CrossRef]
- Sohn, W.; Kim, J.-H.; Li, M.-H.; Brown, R. The influence of climate on the effectiveness of low impact development: A systematic review. J. Environ. Manag. 2019, 236, 365–379. [Google Scholar] [CrossRef]
- Fletcher, T.D.; Shuster, W.; Hunt, W.F.; Ashley, R.; Butler, D.; Arthur, S.; Trowsdale, S.; Barraud, S.; Semadeni-Davies, A.; Bertrand-Krajewski, J.-L.; et al. SUDS, LID, BMPs, WSUD and more—The evolution and application of terminology surrounding urban drainage. Urban Water J. 2015, 12, 525–542. [Google Scholar] [CrossRef]
- Zhang, J. Discussion and views on some issues of the sponge city construction in China. Adv. Water Sci. 2016, 27, 793–799. [Google Scholar]
- Wang, H.; Mei, C.; Liu, J.; Shao, W. A new strategy for integrated urban water management in China: Sponge city. Sci. China Technol. Sci. 2018, 61, 317–329. [Google Scholar] [CrossRef]
- Ministry of Housing and Urban-Rural Development. The Construction Guideline of Sponge City in China. Low Impact Development of Storm Water System; Ministry of Housing and Urban-Rural Development of the People’s Republic of China: Beijing, China, 2014. [Google Scholar]
- Chan, F.K.S.; Griffiths, J.A.; Higgitt, D.; Xu, S.; Zhu, F.; Tang, Y.-T.; Xu, Y.; Thorne, C.R. “Sponge City” in China—A breakthrough of planning and flood risk management in the urban context. Land Use Policy 2018, 76, 772–778. [Google Scholar] [CrossRef]
- Bedan, E.S.; Clausen, J.C. Stormwater runoff quality and quantity from traditional and low impact development watersheds. J. Am. Water Resour. Assoc. 2009, 45, 998–1008. [Google Scholar] [CrossRef]
- Liu, H.; Jia, Y.; Niu, C. “Sponge city” concept helps solve China’s urban water problems. Environ. Earth Sci. 2017, 76, 473. [Google Scholar] [CrossRef]
- Nie, L.; Jia, H.; Zhang, K.; Fu, G. Assessment Standard for Sponge City Effects; IWA Publishing: London, UK, 2020. [Google Scholar]
- Zhou, H.; Li, H.; Zhao, X.; Ding, Y. Emergy ecological model for sponge cities: A case study of China. J. Clean. Prod. 2021, 296, 126530. [Google Scholar] [CrossRef]
- Wu, D.; Zhan, S.; Li, Y.; Tu, M.; Zhen, J.; Guo, Y.; Peng, H. New trends and practical research on the sponge cities with Chinese characteristics. China Soft Sci. 2016, 1, 79–97. [Google Scholar]
- Golden, H.E.; Hoghooghi, N. Green infrastructure and its catchment-scale effects: An emerging science. Wiley Interdiscip. Rev. Water 2018, 5, e1254. [Google Scholar] [CrossRef] [Green Version]
- Zhang, K.; Chui, T.F.M. Linking hydrological and bioecological benefits of green infrastructures across spatial scales—A literature review. Sci. Total Environ. 2019, 646, 1219–1231. [Google Scholar] [CrossRef]
- Nguyen, T.T.; Ngo, H.H.; Guo, W.; Wang, X.C.; Ren, N.; Li, G.; Ding, J.; Liang, H. Implementation of a specific urban water management—Sponge City. Sci. Total Environ. 2019, 652, 147–162. [Google Scholar] [CrossRef]
- Kongjian, Y.; Dihua, L.; Hong, Y.; Wei, F.; Qing, Q.; Sisi, W. “Sponge City”: Theory and Practice. City Plan. Rev. 2015, 39, 26–36. [Google Scholar]
- Zhai, J.; Ren, J.; Xi, M.; Tang, X.; Zhang, Y. Multiscale watershed landscape infrastructure: Integrated system design for sponge city development. Urban For. Urban Green. 2021, 60, 127060. [Google Scholar] [CrossRef]
- Xia, J.; Zhang, Y.; Xiong, L.; He, S.; Wang, L.; Yu, Z. Opportunities and challenges of the Sponge City construction related to urban water issues in China. Sci. China Earth Sci. 2017, 60, 652–658. [Google Scholar] [CrossRef]
- Li, Q.; Wang, F.; Yu, Y.; Huang, Z.; Li, M.; Guan, Y. Comprehensive performance evaluation of LID practices for the sponge city construction: A case study in Guangxi, China. J. Environ. Manag. 2019, 231, 10–20. [Google Scholar] [CrossRef]
- Mei, C.; Liu, J.; Wang, H.; Yang, Z.; Ding, X.; Shao, W. Integrated assessments of green infrastructure for flood mitigation to support robust decision-making for sponge city construction in an urbanized watershed. Sci. Total Environ. 2018, 639, 1394–1407. [Google Scholar] [CrossRef]
- Luo, K.; Wang, Z.; Sha, W.; Wu, J.; Wang, H.; Zhu, Q. Integrating Sponge City Concept and Neural Network into Land Suitability Assessment: Evidence from a Satellite Town of Shenzhen Metropolitan Area. Land 2021, 10, 872. [Google Scholar] [CrossRef]
- Wang, X.; Yu, Y.; Zheng, Y.; Liu, S.; Deng, Y. Layout Optimization of Sponge Facilities Based on Suitability Evaluation of Sponge City; Springer: Singapore, 2020; pp. 1537–1546. [Google Scholar]
- Newman, G.; Malecha, M.; Yu, S.; Qiao, Z.; Horney, J.A.; Lee, J.; Kim, Y.J.; Lee, R.J.; Berke, P. Integrating a resilience scorecard and landscape performance tools into a Geodesign process. Landsc. Res. 2020, 45, 63–80. [Google Scholar] [CrossRef]
- Pettit, C.J.; Hawken, S.; Ticzon, C.; Leao, S.Z.; Afrooz, A.E.; Lieske, S.N.; Canfield, T.; Ballal, H.; Steinitz, C. Breaking down the silos through geodesign—Envisioning Sydney’s urban future. Environ. Plan. B Urban Anal. City Sci. 2019, 46, 1387–1404. [Google Scholar] [CrossRef]
- Reynolds, K.M.; Murphy, P.J.; Paplanus, S. Toward Geodesign for Watershed Restoration on the Fremont-Winema National Forest, Pacific Northwest, USA. Sustainability 2017, 9, 678. [Google Scholar] [CrossRef] [Green Version]
- Gottwald, S.; Brenner, J.; Janssen, R.; Albert, C. Using Geodesign as a boundary management process for planning nature-based solutions in river landscapes. Ambio 2021, 50, 1477–1496. [Google Scholar] [CrossRef]
- Moreno Marimbaldo, F.J.; Manso-Callejo, M.-Á.; Alcarria, R. A Methodological Approach to Using Geodesign in Transmission Line Projects. Sustainability 2018, 10, 2757. [Google Scholar] [CrossRef] [Green Version]
- Kuby, M.; Bailey, K.; Wei, F.; Fowler, J.; Tong, D.; Zhong, Q.; Lopez, O.; Sheaffer, W. Collaborative Geodesign for Alternative-Fuel Station Location using “Collablocation” Software. Transp. Res. Rec. 2018, 2672, 98–108. [Google Scholar] [CrossRef]
- Gleyzer, A.; Denisyuk, M.; Rimmer, A.; Salingar, Y. A fast recursive GIS algorithm for computing strahler stream order in braided and nonbraided networks. J. Am. Water Resour. Assoc. 2004, 40, 937–946. [Google Scholar] [CrossRef]
- Steinitz, C. A Framework for Geodesign: Changing Geography by Design; Esri: Redlands, CA, USA, 2012. [Google Scholar]
- Kim, Y. Limits and Potentials of Geodesign Framework in Theory and Practice. Urban Des. Inst. Korea 2019, 20, 57–74. [Google Scholar] [CrossRef]
- Ministry of Land and Resources. Current Land Use Classification; Ministry of Land and Resources of the People’s Republic of China: Beijing, China, 2017. [Google Scholar]
- Choi, J.; Lee, S. Evaluation of Ecosystem Service for Distribution of Korean fir using InVEST Model. J. Environ. Impact Assess. 2018, 27, 181–193. [Google Scholar]
- Cong, W.; Sun, X.; Guo, H.; Shan, R. Comparison of the SWAT and InVEST models to determine hydrological ecosystem service spatial patterns, priorities and trade-offs in a complex basin. Ecol. Indic. 2020, 112, 106089. [Google Scholar] [CrossRef]
- Yan, Y.; Guan, Q.; Wang, M.; Su, X.; Wu, G.; Chiang, P.; Cao, W. Assessment of nitrogen reduction by constructed wetland based on InVEST: A case study of the Jiulong River Watershed, China. Mar. Pollut. Bull. 2018, 133, 349–356. [Google Scholar] [CrossRef]
- Redhead, J.W.; Stratford, C.; Sharps, K.; Jones, L.; Ziv, G.; Clarke, D.; Oliver, T.H.; Bullock, J.M. Empirical validation of the InVEST water yield ecosystem service model at a national scale. Sci. Total Environ. 2016, 569–570, 1418–1426. [Google Scholar] [CrossRef] [Green Version]
- Redhead, J.W.; May, L.; Oliver, T.H.; Hamel, P.; Sharp, R.; Bullock, J.M. National scale evaluation of the InVEST nutrient retention model in the United Kingdom. Sci. Total Environ. 2018, 610–611, 666–677. [Google Scholar] [CrossRef] [PubMed]
- Gashaw, T.; Bantider, A.; Zeleke, G.; Alamirew, T.; Jemberu, W.; Worqlul, A.W.; Dile, Y.T.; Bewket, W.; Meshesha, D.T.; Adem, A.A.; et al. Evaluating InVEST model for estimating soil loss and sediment export in data scarce regions of the Abbay (Upper Blue Nile) Basin: Implications for land managers. Environ. Chall. 2021, 5, 100381. [Google Scholar] [CrossRef]
- Mei, Y.; Kong, X.; Ke, X.; Yang, B. The Impact of Cropland Balance Policy on Ecosystem Service of Water Purification—A Case Study of Wuhan, China. Water 2017, 9, 620. [Google Scholar] [CrossRef] [Green Version]
- Yang, X.; Ji, G.; Wang, C.; Zuo, J.; Yang, H.; Xu, J.; Chen, R. Modeling nitrogen and phosphorus export with InVEST model in Bosten Lake basin of Northwest China. PLoS ONE 2019, 14, e0220299. [Google Scholar] [CrossRef] [PubMed]
- Zhe, W.; Xin, C.; Beibei, L.; Jinfeng, C.; Lixu, P. Risk Assessment of Nitrogen and Phosphorus Loads in Hainan Island Based on InVEST Model. Chin. J. Trop. Crop. 2013, 34, 1791–1797. [Google Scholar] [CrossRef]
- Zhang, X.; Liu, X.; Zhang, M.; Dahlgren, R.A.; Eitzel, M. A review of vegetated buffers and a meta-analysis of their mitigation efficacy in reducing nonpoint source pollution. J. Environ. Qual. 2010, 39, 76–84. [Google Scholar] [CrossRef]
- Han, B.; Reidy, A.; Li, A. Modeling nutrient release with compiled data in a typical Midwest watershed. Ecol. Indic. 2021, 121, 107213. [Google Scholar] [CrossRef]
- Kovacic, D.A.; David, M.B.; Gentry, L.E.; Starks, K.M.; Cooke, R.A. Effectiveness of constructed wetlands in reducing nitrogen and phosphorus export from agricultural tile drainage. J. Environ. Qual. 2000, 29, 1262–1274. [Google Scholar] [CrossRef] [Green Version]
- Lee, C.G.; Fletcher, T.D.; Sun, G. Nitrogen removal in constructed wetland systems. Eng. Life Sci. 2009, 9, 11–22. [Google Scholar] [CrossRef]
- RAO, V.G.; Surinaidu, L. Rain Gardens–A New Ecosystem in City Landscape for in situ Harvesting of Rain Water. Mem. Geol. Soc. India 2012, 80, 89–96. [Google Scholar]
- Wang, X. Evaluation on ecological effects under the sponge city construction at the Chuanzi River catchment in the Changde city, China. Acta Geogr. Sin. 2019, 74, 2123–2135. [Google Scholar] [CrossRef]
- Yuchao, S. Based on SWMM Sponge Urban Flood Control and Drainage Effect Evalution. Master’s Thesis, Dalian University of Technology, Dalian, China, 2016. [Google Scholar]


| Project | Location | Coordinate | Area | Year | Climate Class |
|---|---|---|---|---|---|
| Qunli Park | Harbin, China | 45.7296, 126.5563 | 34 ha | 2011 | Dwa |
| Luming Park | Quzhou, China | 28.9695, 118.8367 | 32 ha | 2016 | Cfa |
| Mangrove Park | Sanya, China | 18.2715, 109.5246 | 28 ha | 2015 | Aw |
| LULC Type | Scenario 1 | Scenario 2 | Scenario 3 | |||
|---|---|---|---|---|---|---|
| Area (ha) | Percent | Area (ha) | Percent | Area (ha) | Percent | |
| Wetland | 218.41 | 8.90 | 201.69 | 8.22 | 244.54 | 9.97 |
| Paved road | 174.91 | 7.13 | 173.66 | 7.08 | 174.91 | 7.13 |
| Agriculture | 163.40 | 6.66 | 163.40 | 6.66 | 163.40 | 6.66 |
| Build up | 399.85 | 16.30 | 399.85 | 16.30 | 358.05 | 14.60 |
| Urban | 792.11 | 32.29 | 822.03 | 33.52 | 773.61 | 31.54 |
| Greenland | 499.28 | 20.36 | 499.27 | 20.36 | 521.32 | 21.25 |
| Forest | 3.60 | 0.15 | 0.00 | 0.00 | 3.60 | 0.15 |
| Water | 201.16 | 8.20 | 192.80 | 7.86 | 213.47 | 8.70 |
| Total | 2452.7 | 100.0 | 2452.7 | 100.0 | 2452.9 | 100.0 |
| LULC Type | Scenario 1 | Scenario 2 | Scenario 3 | |||
|---|---|---|---|---|---|---|
| Area (ha) | Percent | Area (ha) | Percent | Area (ha) | Percent | |
| Wetland | 0 | 0 | 0 | 0 | 12.61 | 0.69 |
| Paved road | 79.89 | 4.41 | 79.89 | 4.41 | 79.90 | 4.40 |
| Agriculture | 754.01 | 41.63 | 754.01 | 41.63 | 717.10 | 39.48 |
| Urban | 228.16 | 12.60 | 264.30 | 14.59 | 217.65 | 11.98 |
| Greenland | 160.58 | 8.86 | 145.18 | 8.01 | 202.60 | 11.15 |
| Forest | 285.68 | 15.77 | 270.74 | 14.95 | 285.68 | 15.73 |
| Water | 93.09 | 5.14 | 91.21 | 5.04 | 102.49 | 5.64 |
| Unpaved road | 17.11 | 0.94 | 17.11 | 0.94 | 17.11 | 0.94 |
| Village | 179.20 | 9.89 | 179.20 | 9.89 | 167.47 | 9.22 |
| Meadow | 3.92 | 0.22 | 0 | 0 | 3.92 | 0.22 |
| Vacancy | 9.76 | 0.54 | 9.76 | 0.54 | 9.76 | 0.54 |
| Total | 1811.41 | 100 | 1811.41 | 100 | 1816.29 | 100 |
| LULC Type | Scenario 1 | Scenario 2 | Scenario 3 | |||
|---|---|---|---|---|---|---|
| Area (ha) | Percent | Area (ha) | Percent | Area (ha) | Percent | |
| Wetland | 51.85 | 2.904 | 38.35 | 2.156 | 125.80 | 7.048 |
| Paved road | 49.56 | 2.776 | 49.56 | 2.787 | 49.56 | 2.777 |
| Agriculture | 223.10 | 12.495 | 223.10 | 12.544 | 193.08 | 10.817 |
| Urban | 486.51 | 27.246 | 500.97 | 28.166 | 486.51 | 27.256 |
| Greenland | 51.29 | 2.873 | 51.29 | 2.884 | 51.29 | 2.874 |
| Forest | 633.34 | 35.469 | 633.34 | 35.608 | 633.34 | 35.482 |
| Water | 39.10 | 2.190 | 38.15 | 2.145 | 50.06 | 2.805 |
| Build up | 234.75 | 13.147 | 234.75 | 12.806 | 179.23 | 10.041 |
| Vacancy | 16.09 | 0.901 | 16.09 | 0.904 | 16.09 | 0.901 |
| Total | 1785.60 | 100 | 1785.60 | 100 | 1785.60 | 100 |
| Study Area | Scenario 1 | Scenario 2 | Scenario 3 | |||
|---|---|---|---|---|---|---|
| N | P | N | P | N | P | |
| Qunli Park | 3198.09 | 90.11 | 3566.13 | 95.99 | 2901.05 | 83.30 |
| Luming park | 1641.74 | 46.91 | 1725.24 | 52.82 | 1382.89 | 44.33 |
| Mangrove Park | 4326.74 | 343.74 | 4420.96 | 348.35 | 3710.14 | 240.15 |
| Watershed of Study Area | Scenario 1 | Scenario 2 | Scenario 3 |
|---|---|---|---|
| Qunli Park | 173,431.54 | 174,188.18 | 170,444.17 |
| Luming park | 1,496,780.37 | 1,590,450.76 | 1,484,466.62 |
| Mangrove Park | 76,588.91 | 77,448.94 | 74,339.53 |
Publisher’s Note: MDPI stays neutral with regard to jurisdictional claims in published maps and institutional affiliations. |
© 2022 by the authors. Licensee MDPI, Basel, Switzerland. This article is an open access article distributed under the terms and conditions of the Creative Commons Attribution (CC BY) license (https://creativecommons.org/licenses/by/4.0/).
Share and Cite
Li, Y.; Kim, Y. Analysis of Effects of Sponge City Projects Applying the Geodesign Framework. Land 2022, 11, 455. https://doi.org/10.3390/land11040455
Li Y, Kim Y. Analysis of Effects of Sponge City Projects Applying the Geodesign Framework. Land. 2022; 11(4):455. https://doi.org/10.3390/land11040455
Chicago/Turabian StyleLi, Yaoxue, and Youngmin Kim. 2022. "Analysis of Effects of Sponge City Projects Applying the Geodesign Framework" Land 11, no. 4: 455. https://doi.org/10.3390/land11040455
APA StyleLi, Y., & Kim, Y. (2022). Analysis of Effects of Sponge City Projects Applying the Geodesign Framework. Land, 11(4), 455. https://doi.org/10.3390/land11040455