
Land-Use/Landscape Pattern Changes and Related Environmental Driving Forces in a Dong Ethnic Minority Village in Southwestern China


Abstract
1. Introduction
2. Materials and Methods
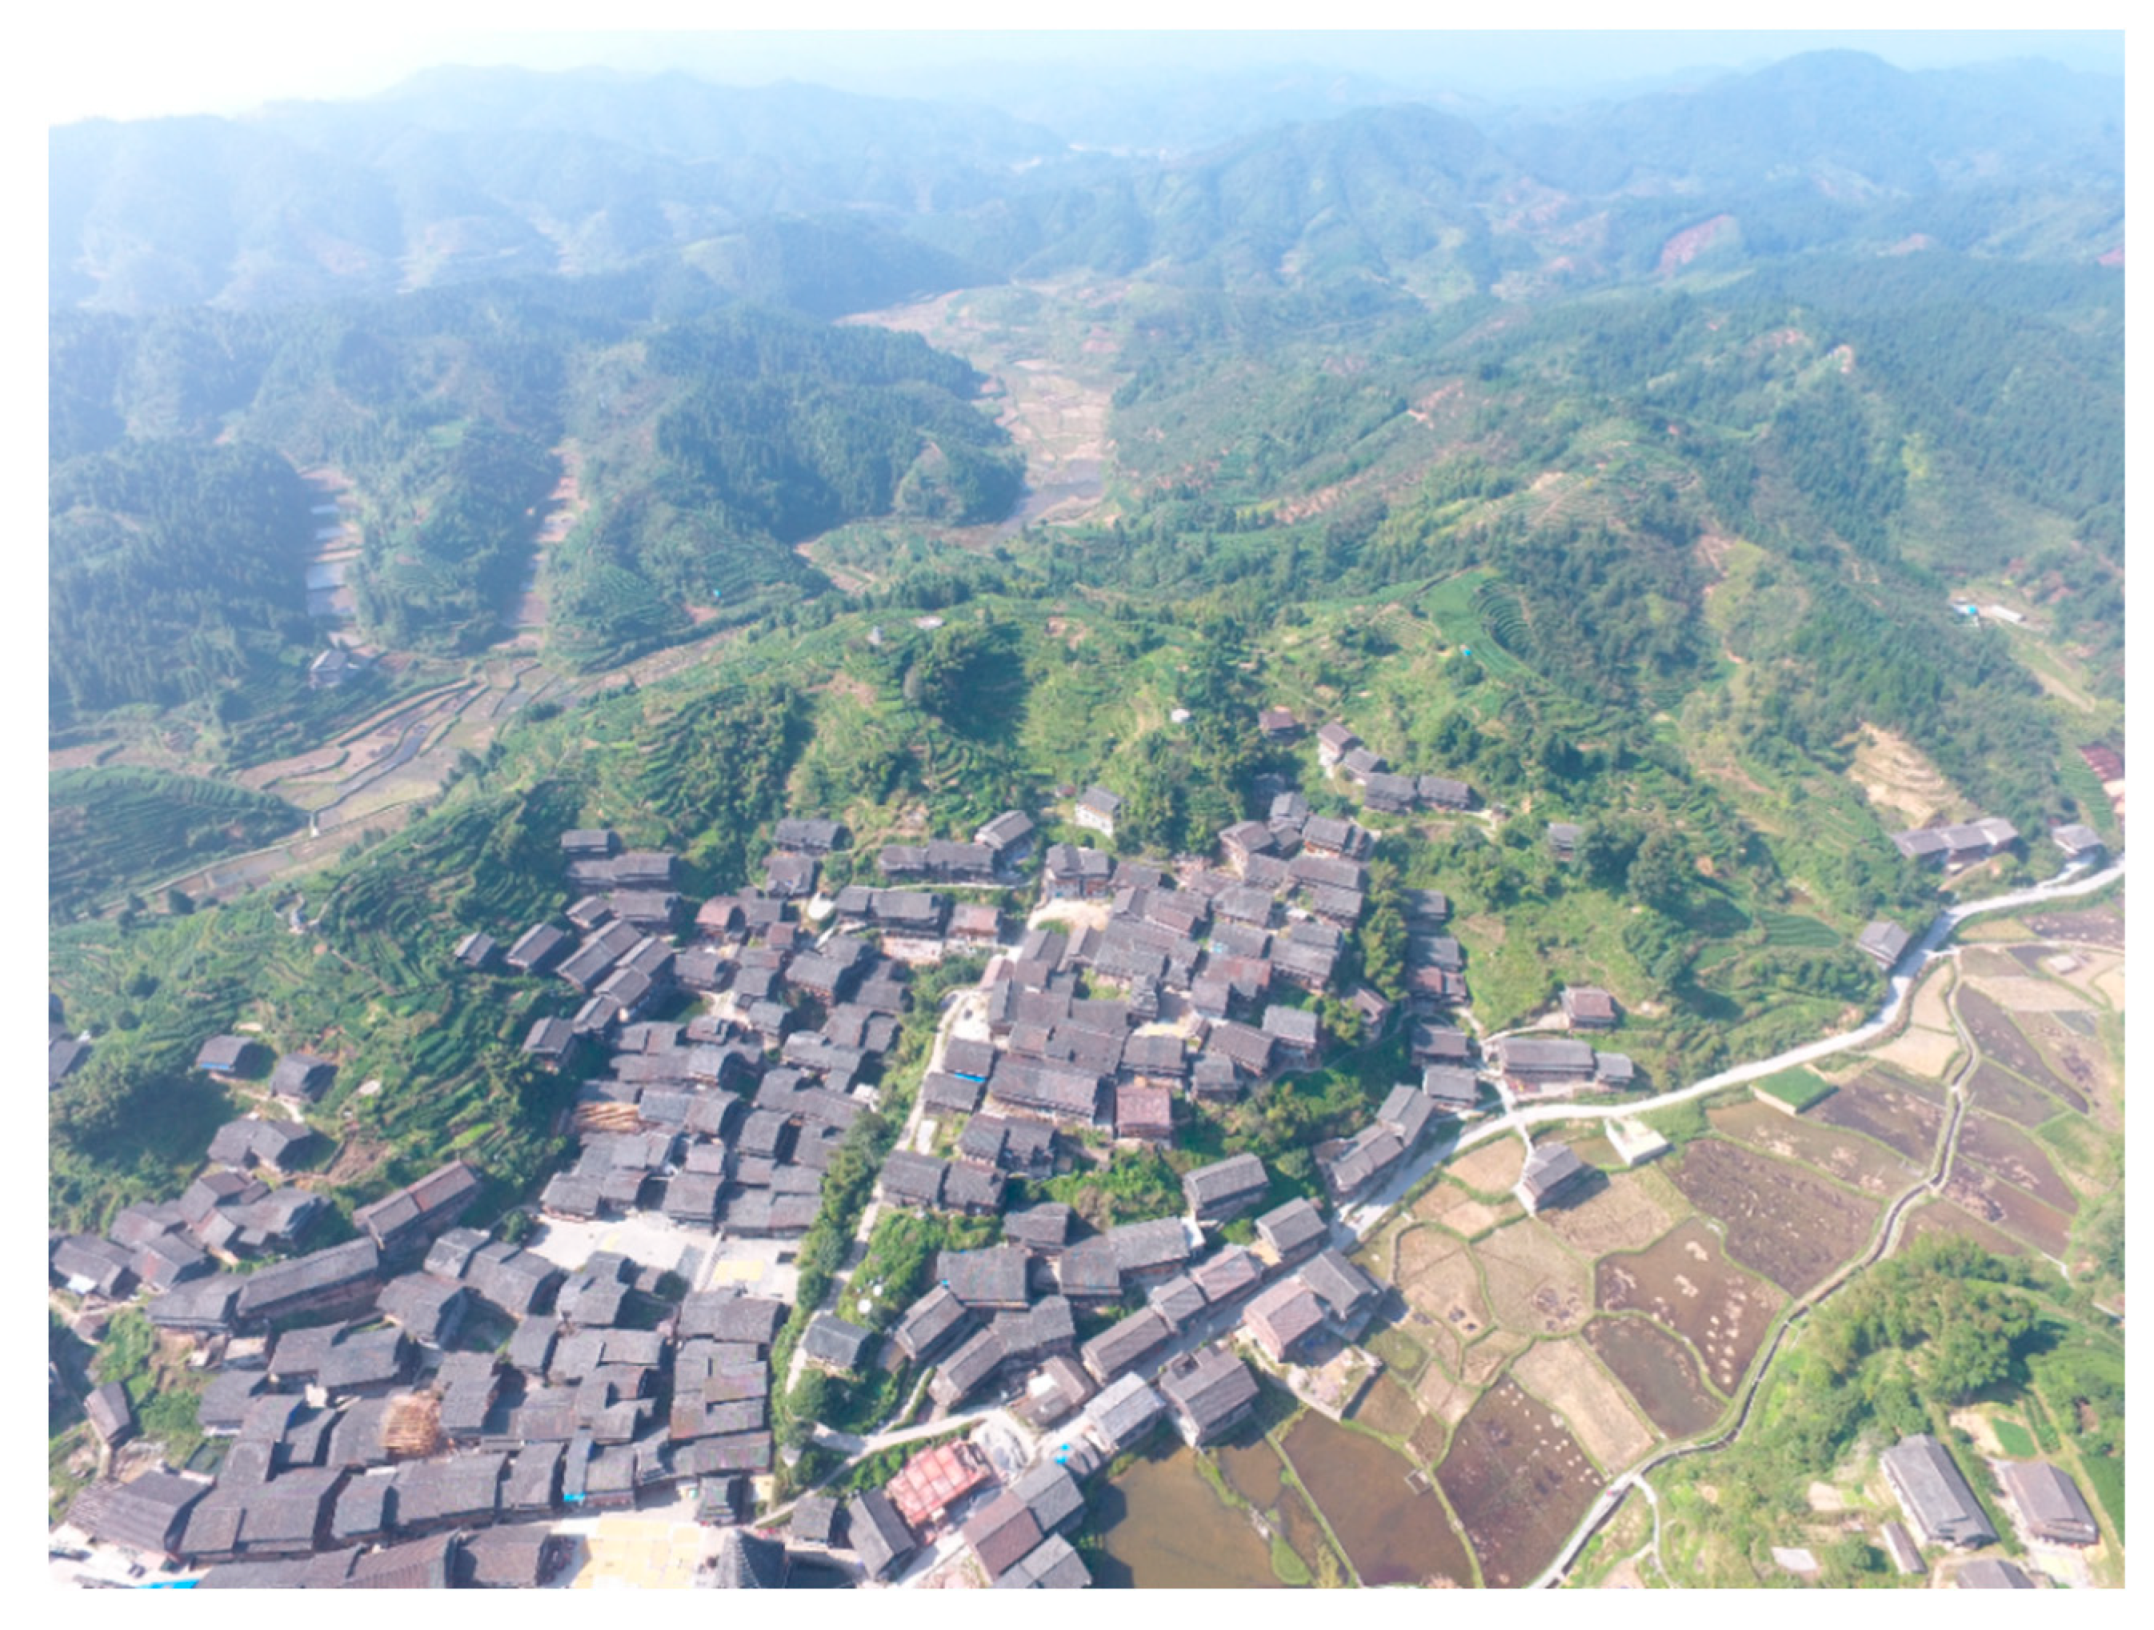
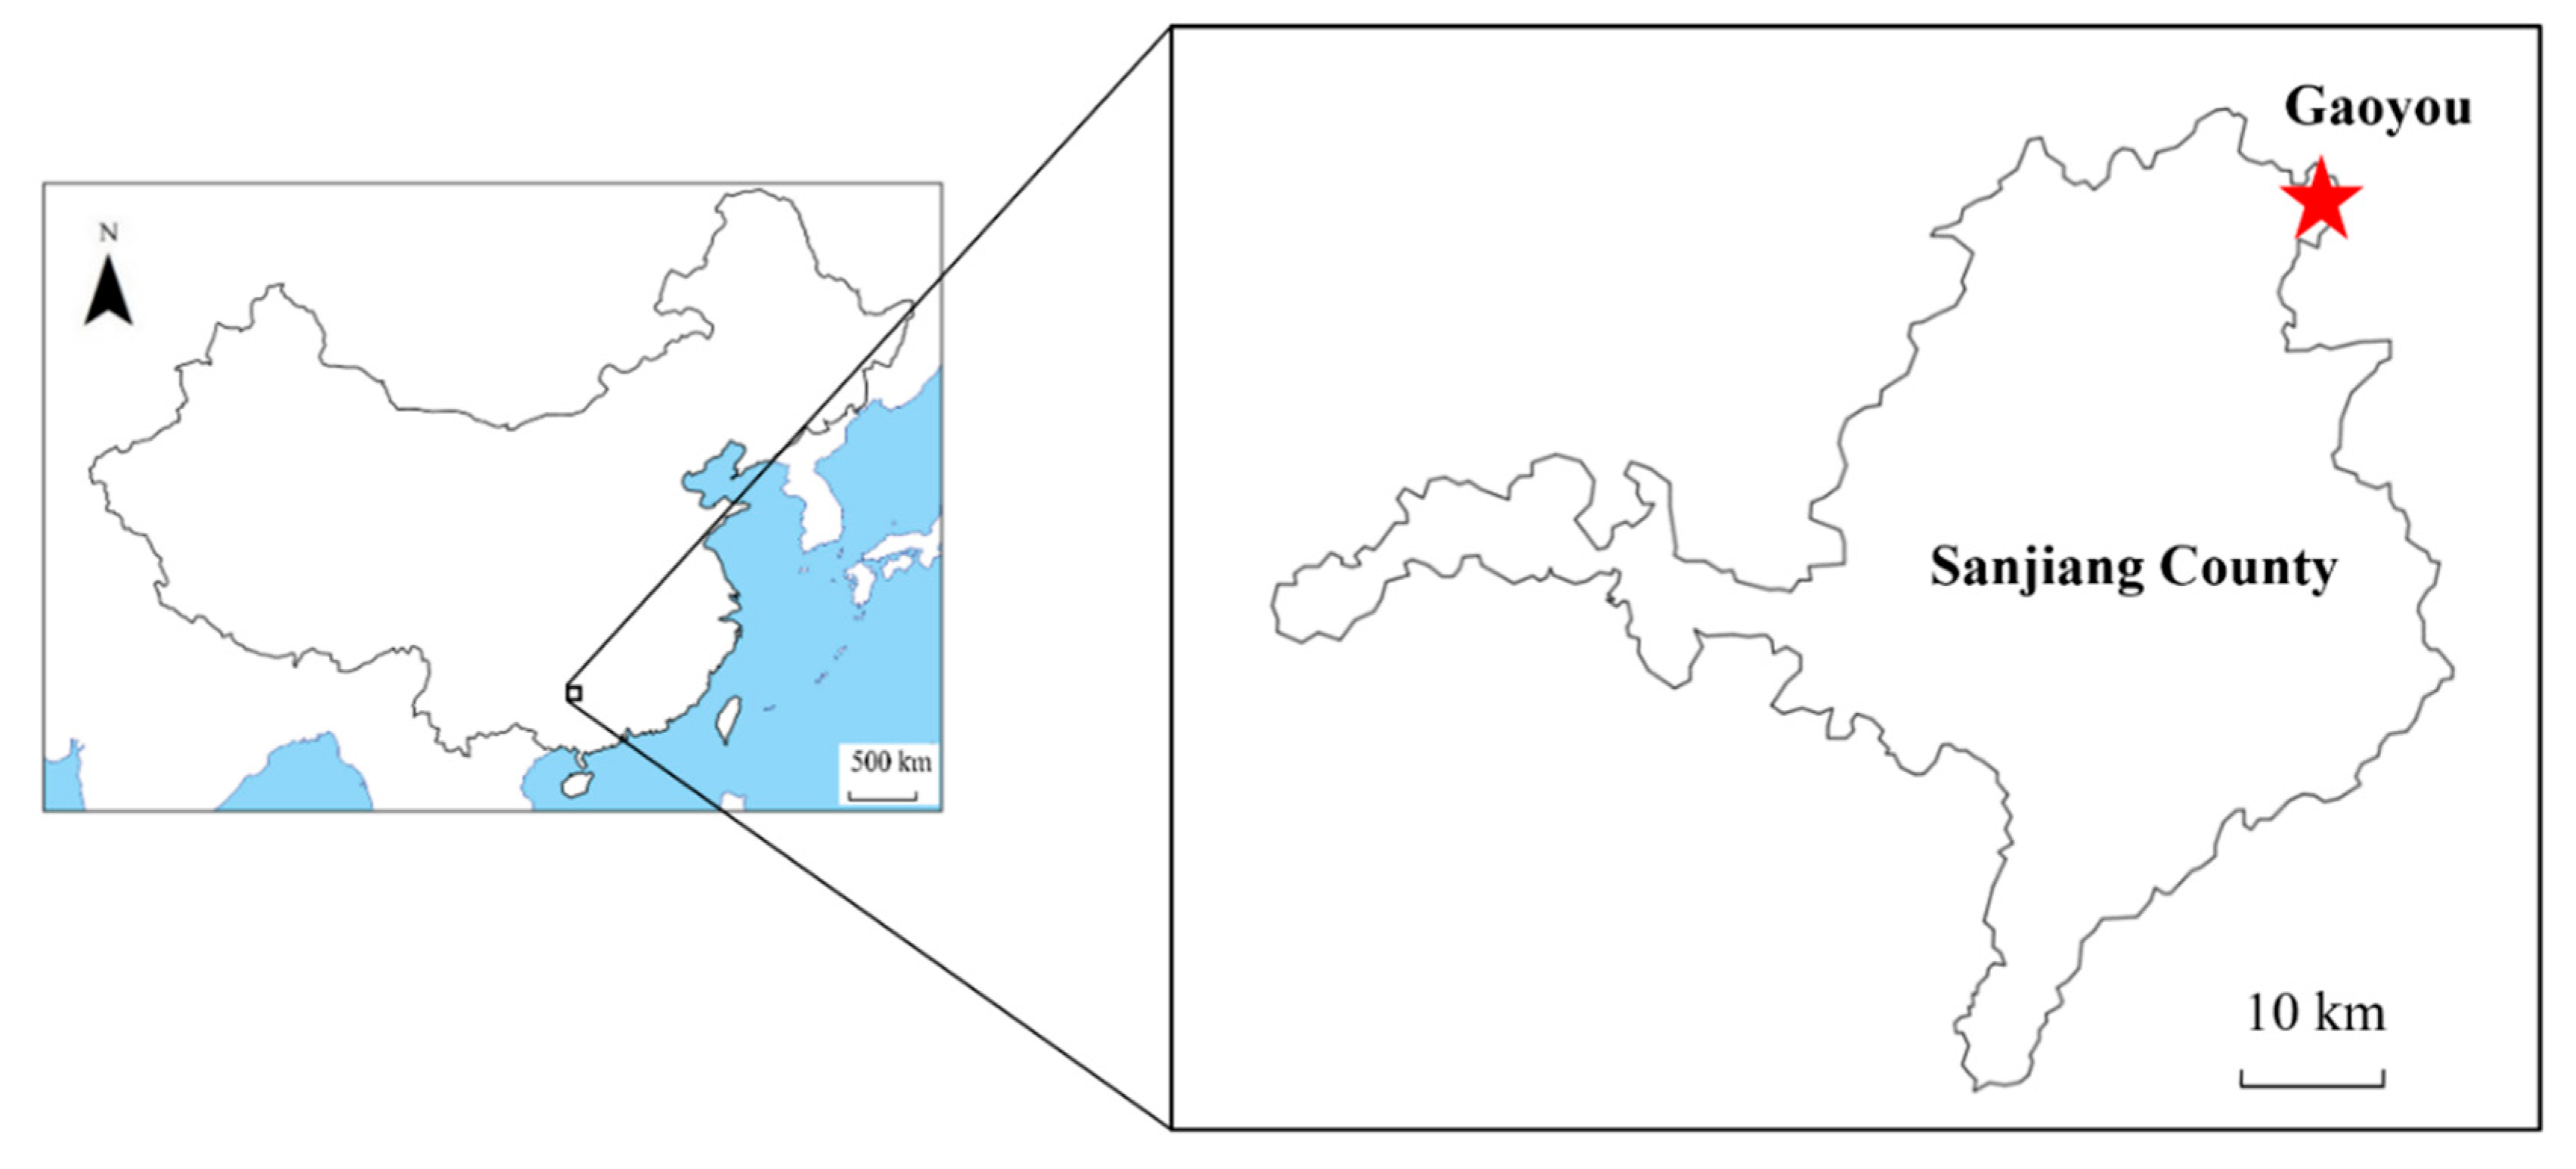
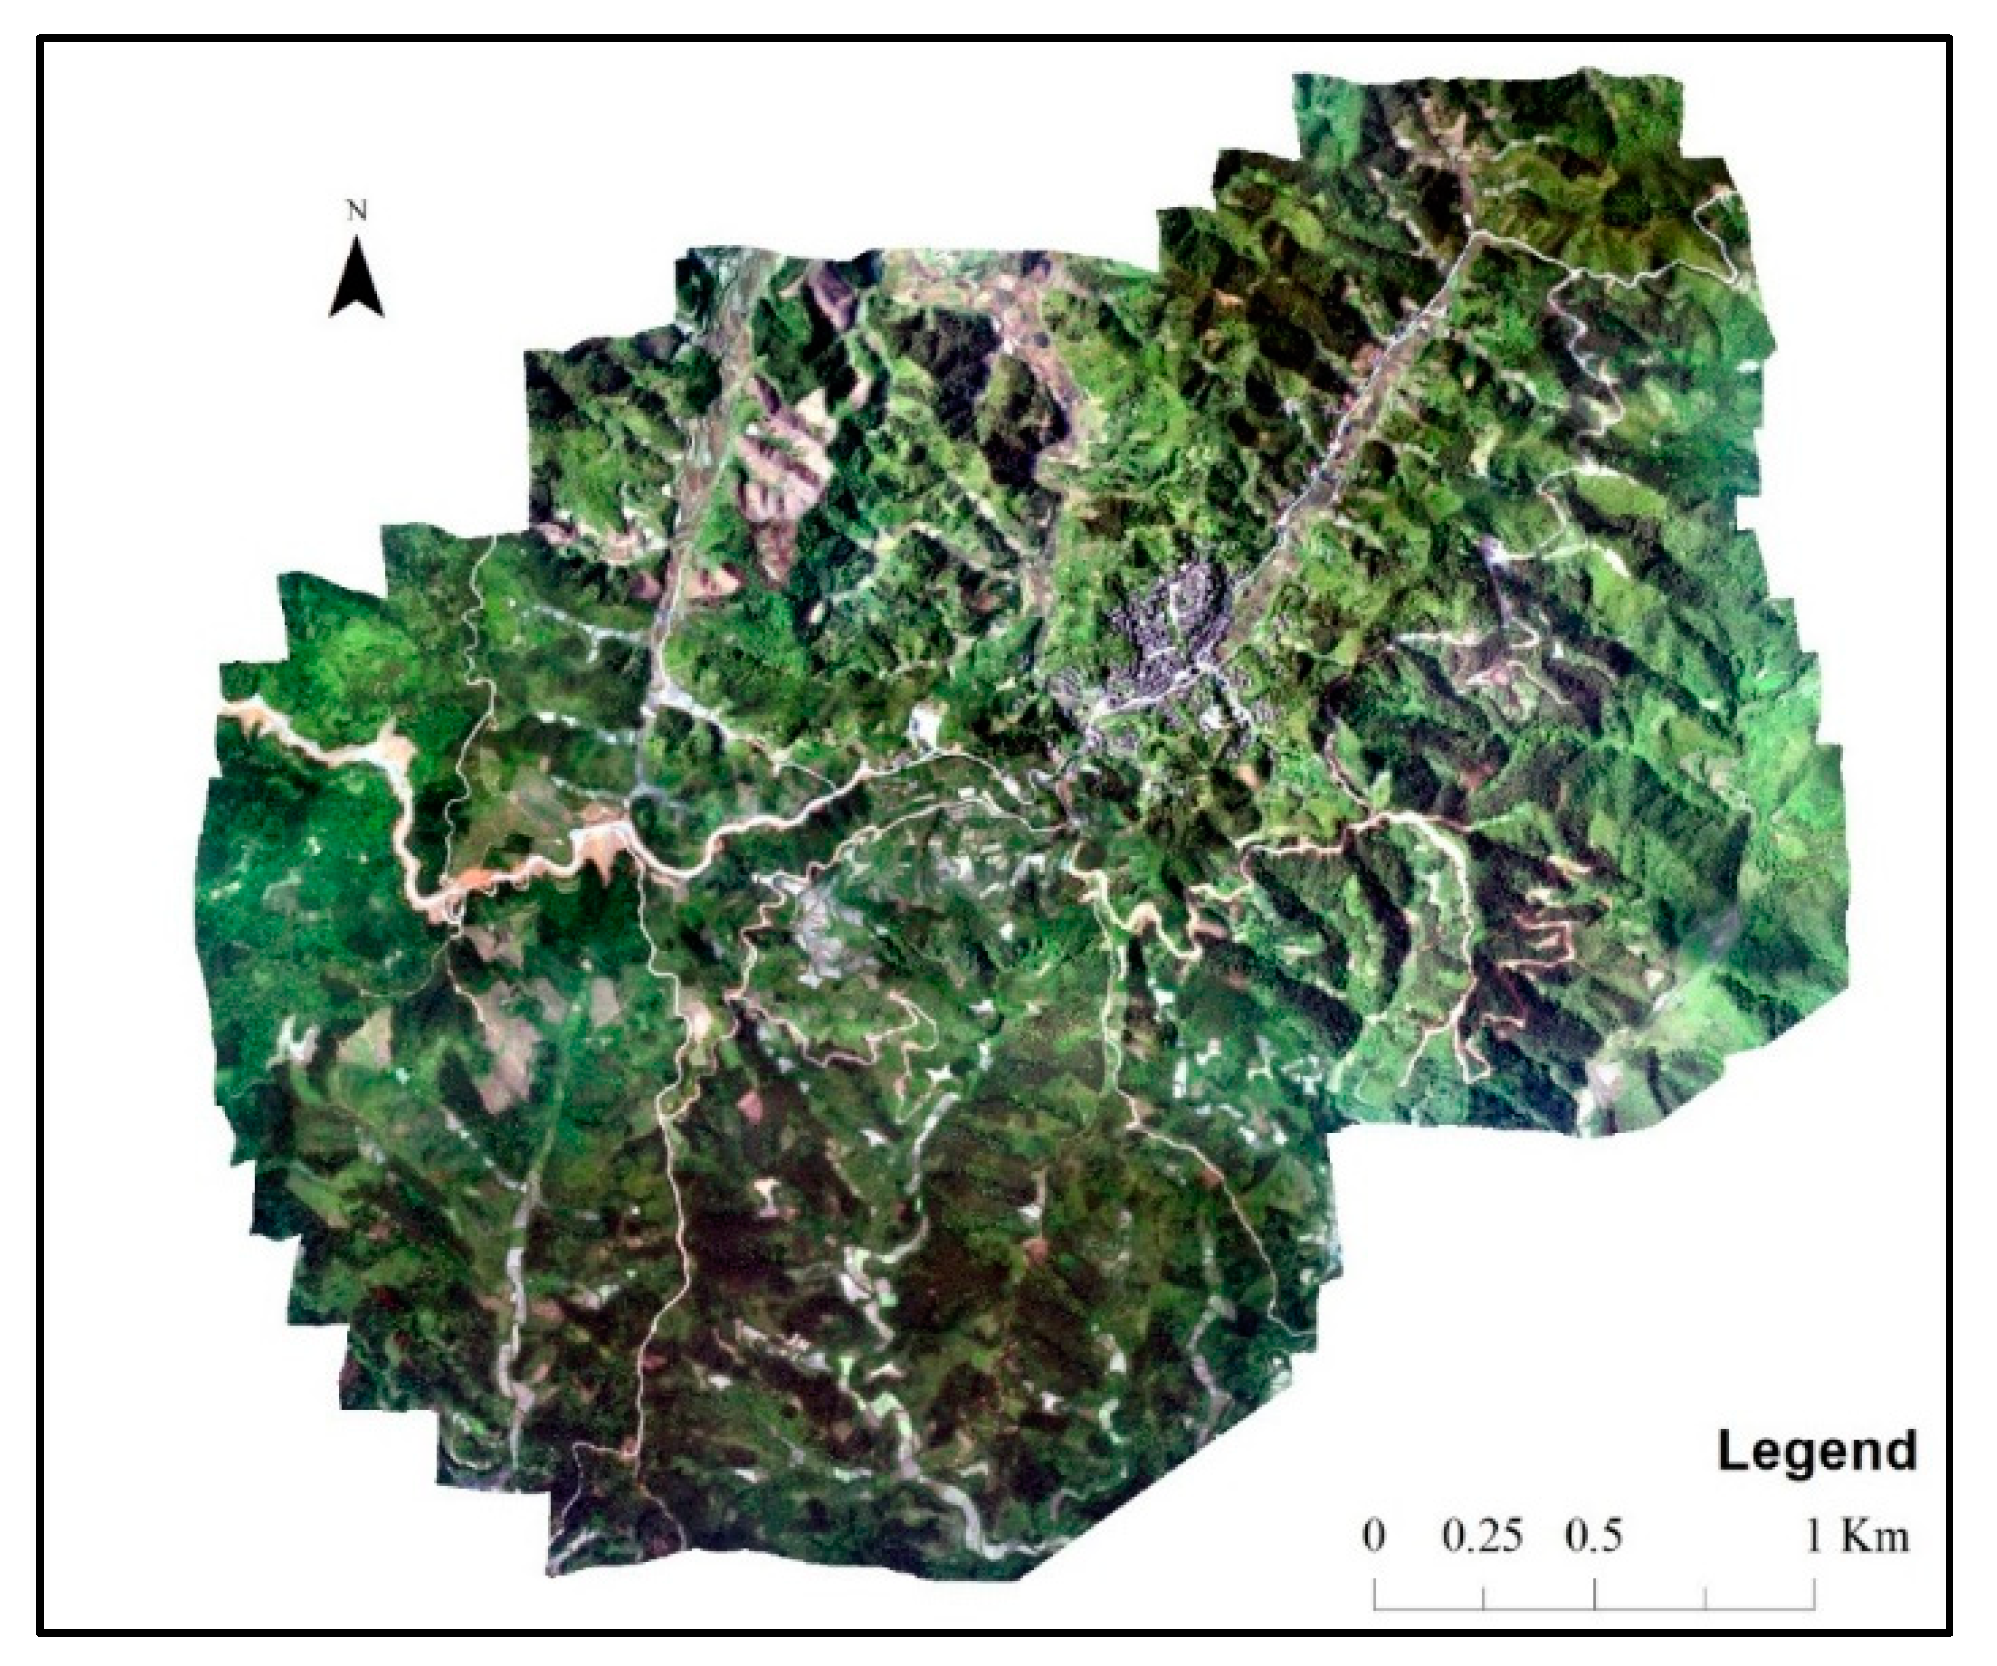
2.1. Study Site
2.2. Methods
2.2.1. Data Collection and Processing
2.2.2. Analysis of Land Use and Landscape Pattern Changes
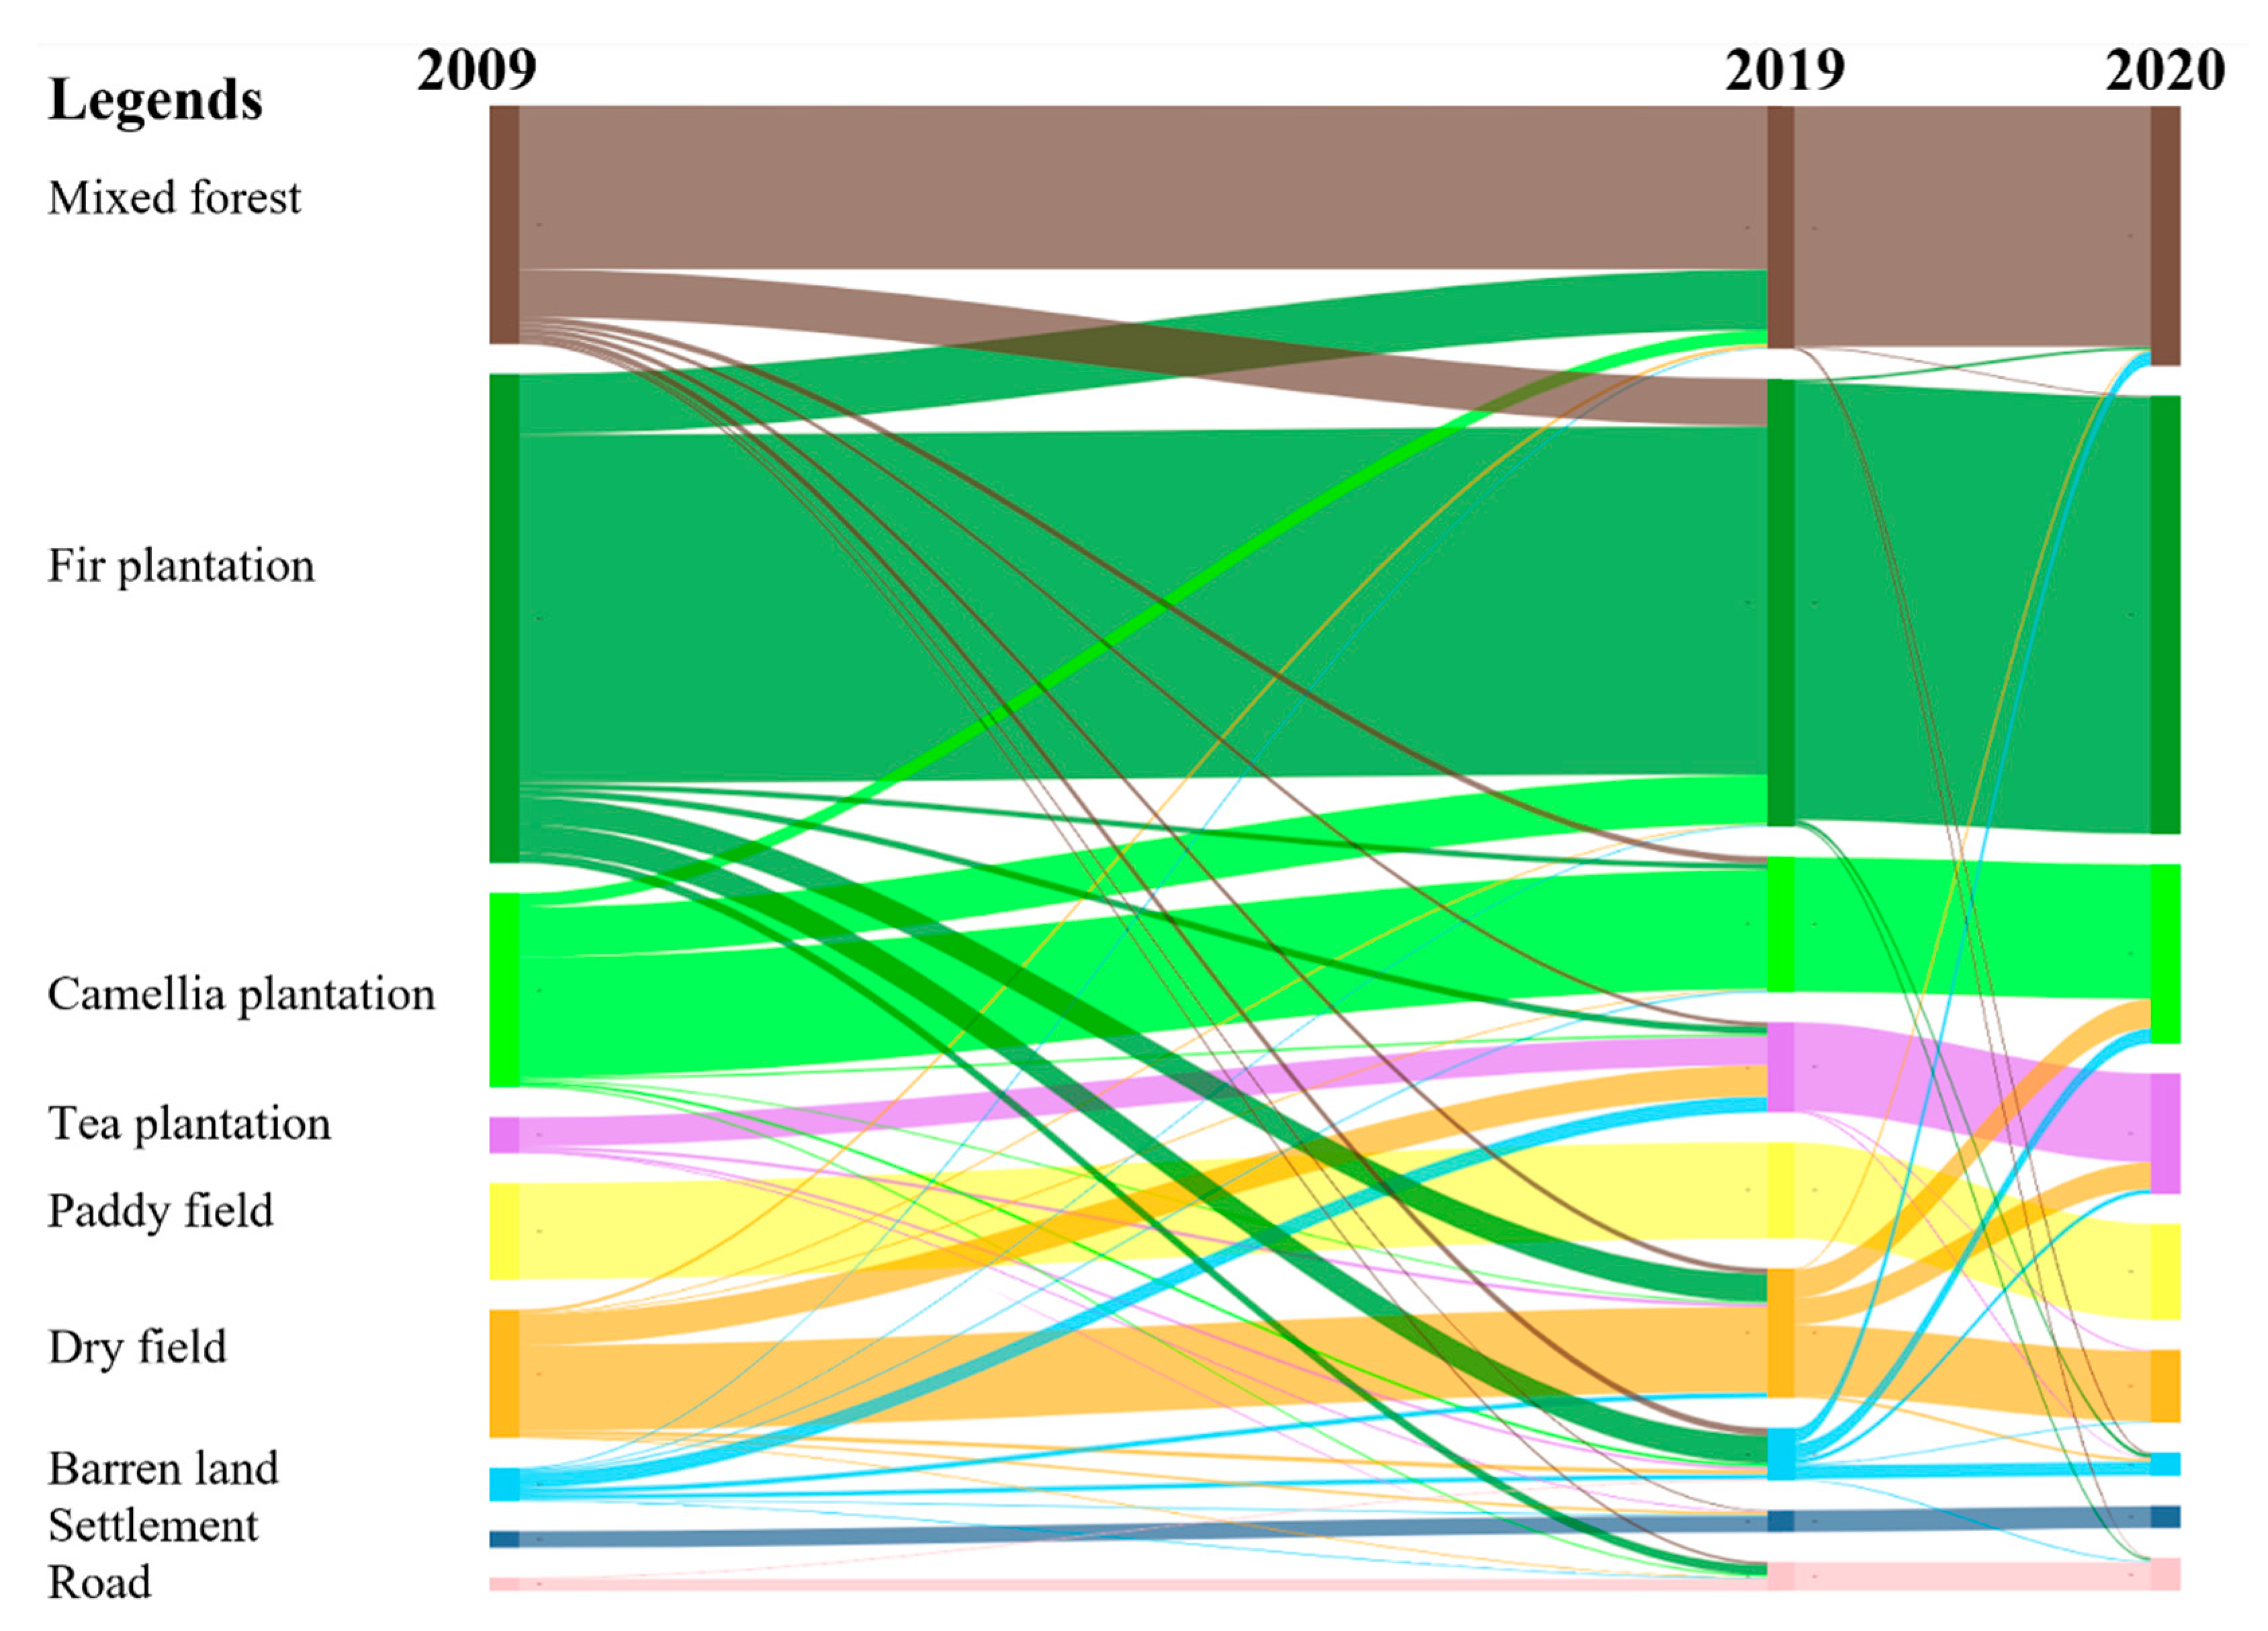
2.2.3. Analysis of Land-Use Change Trajectories and Environmental Drivers of Change
3. Results
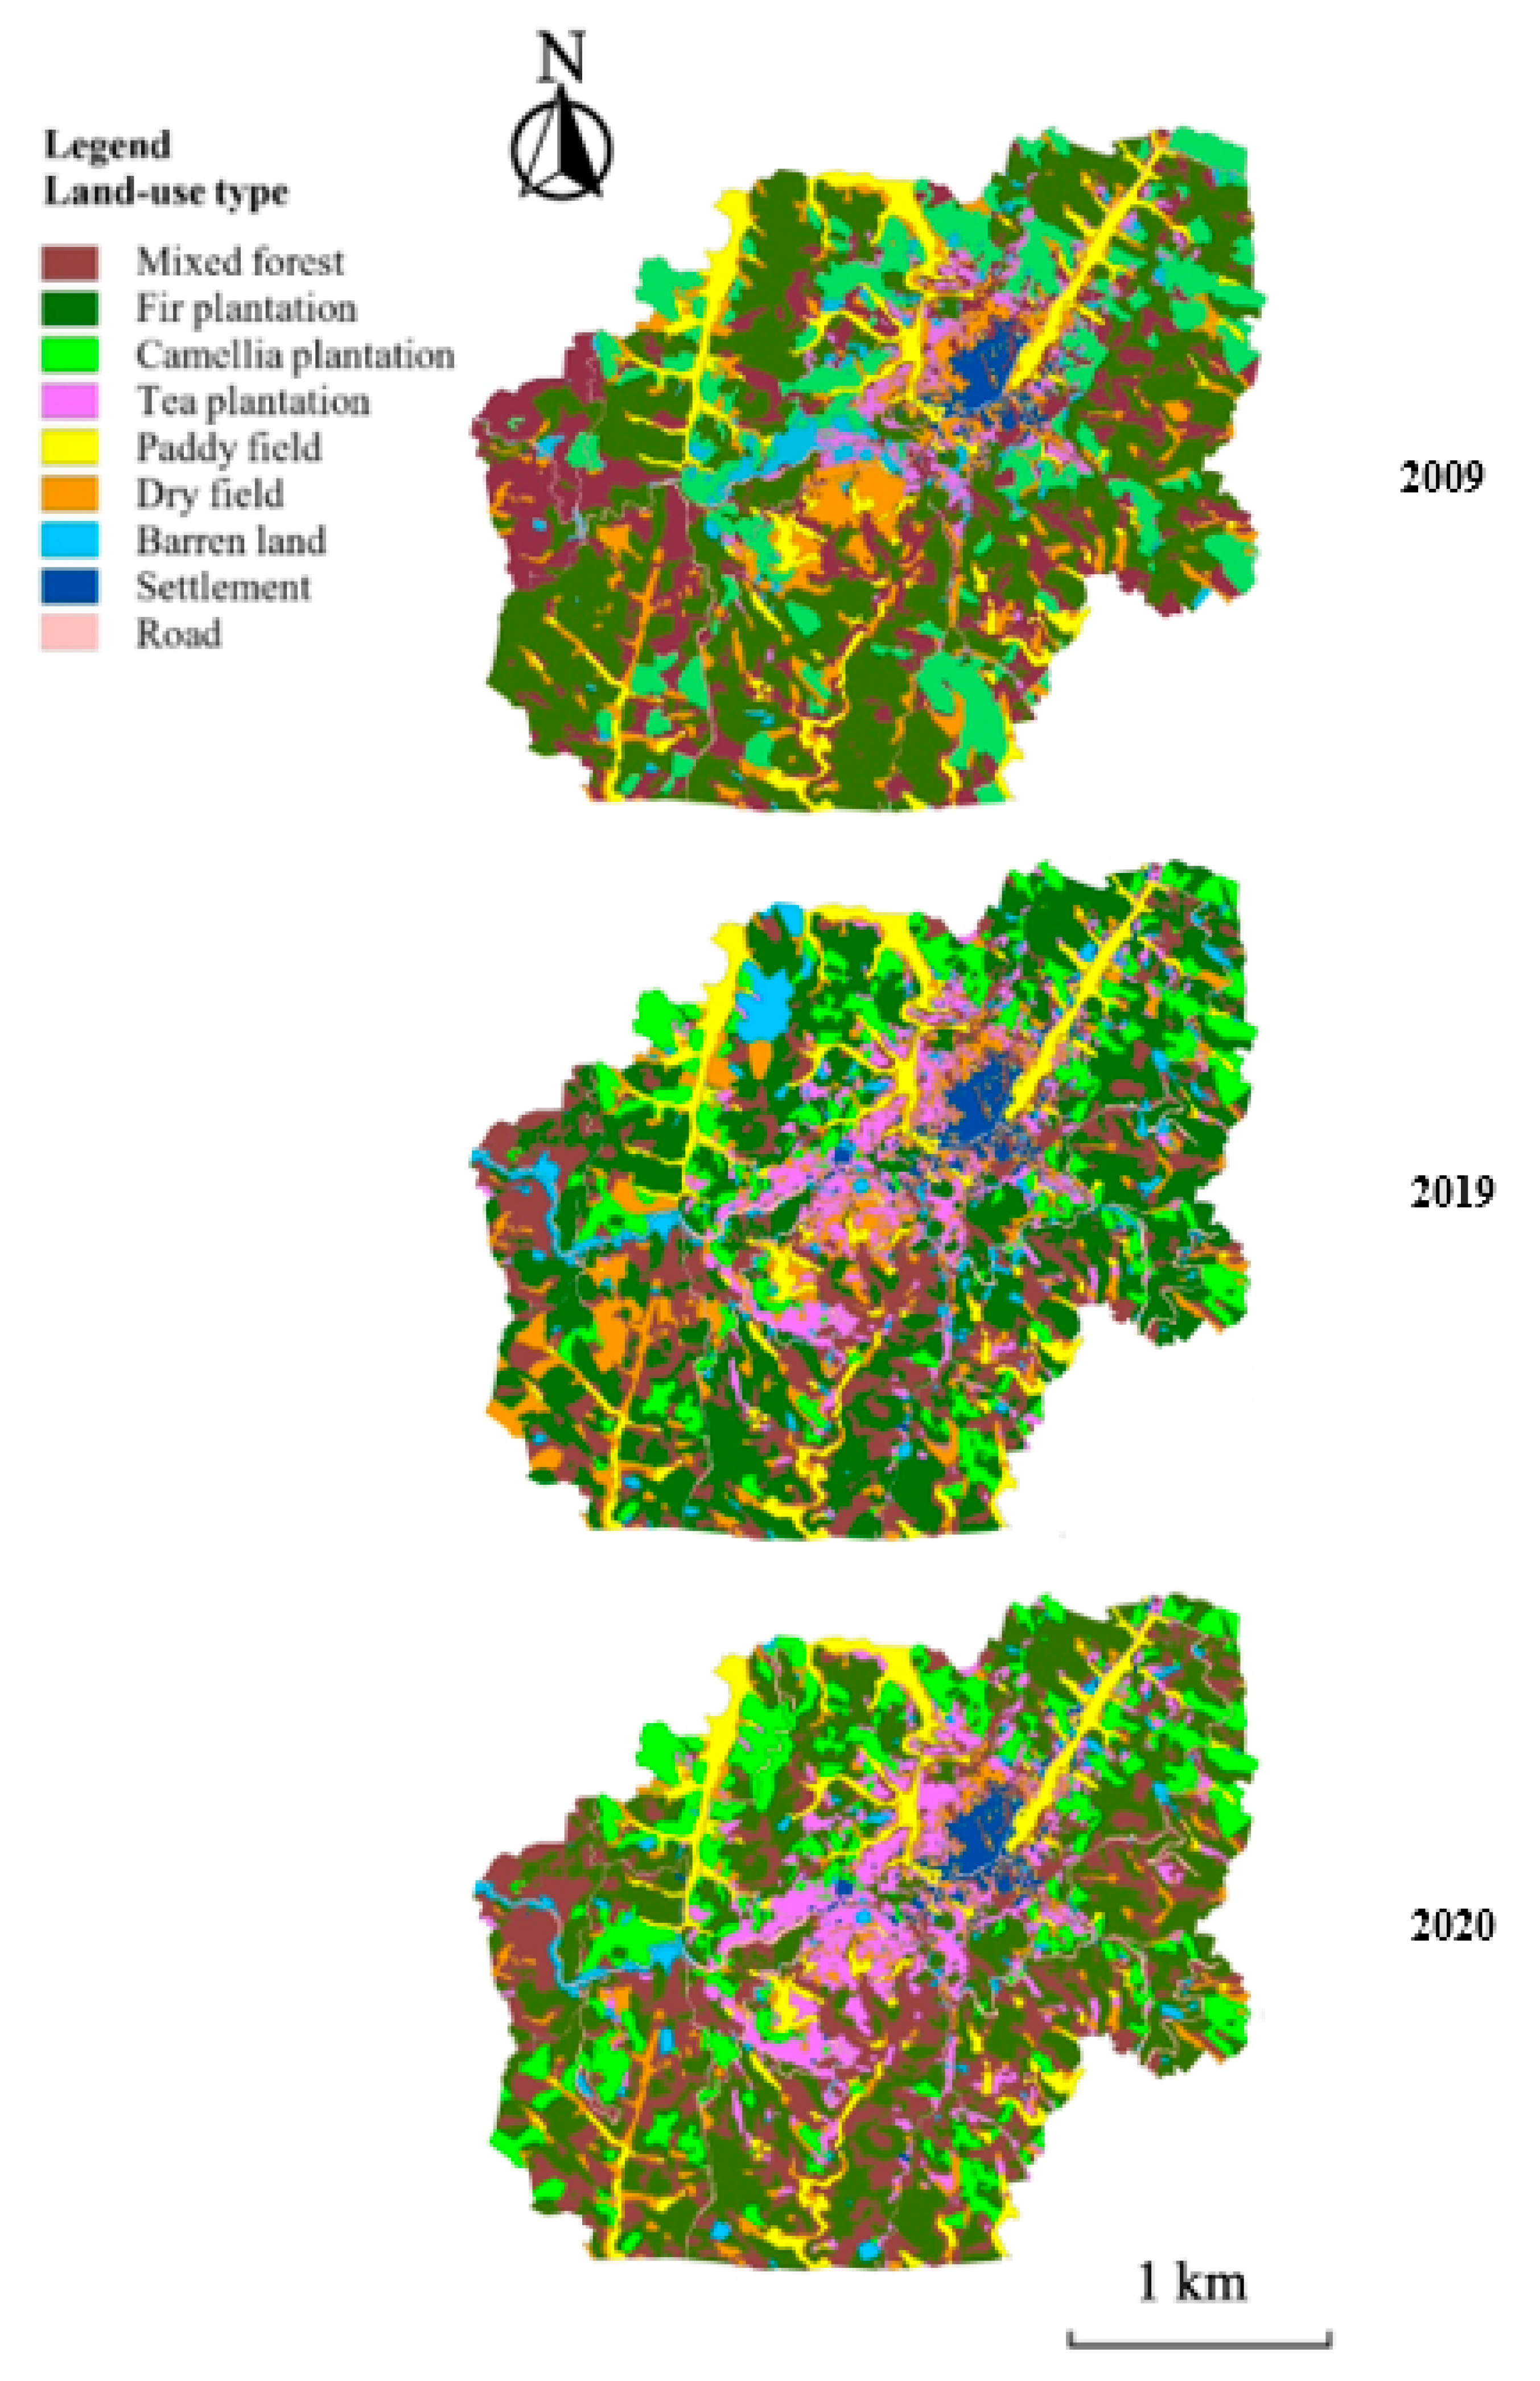
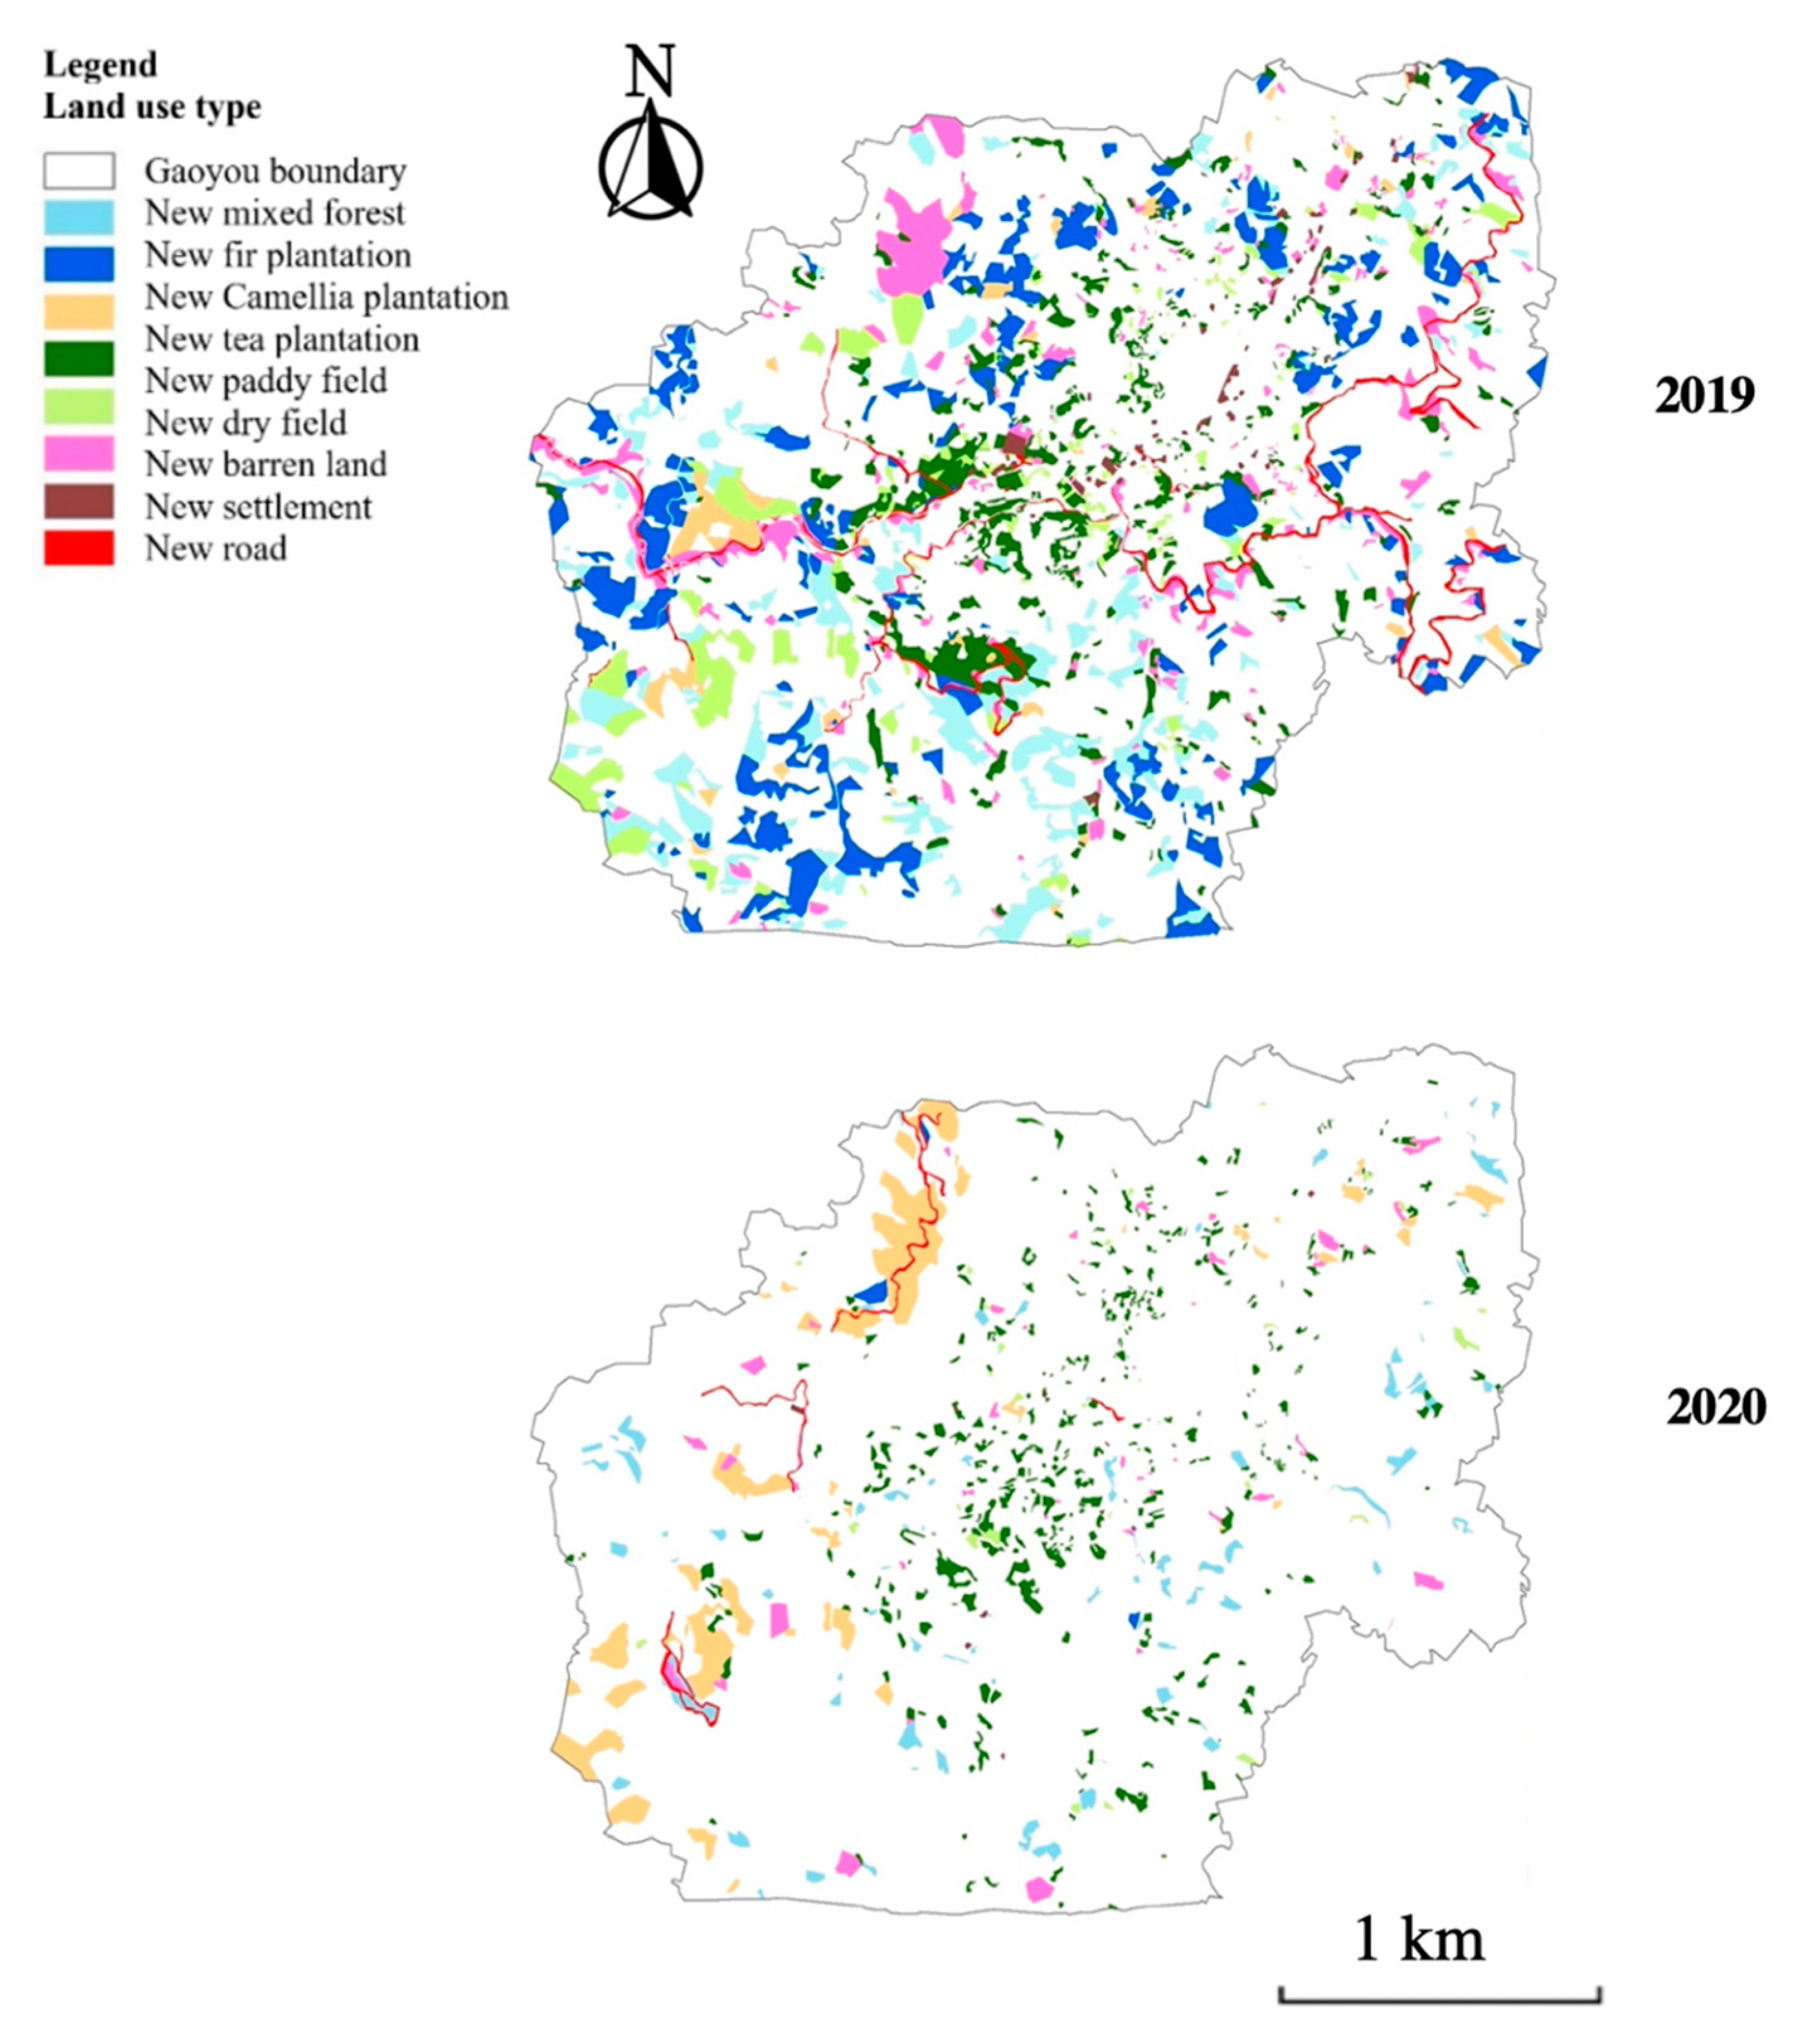
3.1. Land-Use Maps for 2009, 2019 and 2020
3.2. Changes in Land Use and Landscape Patterns
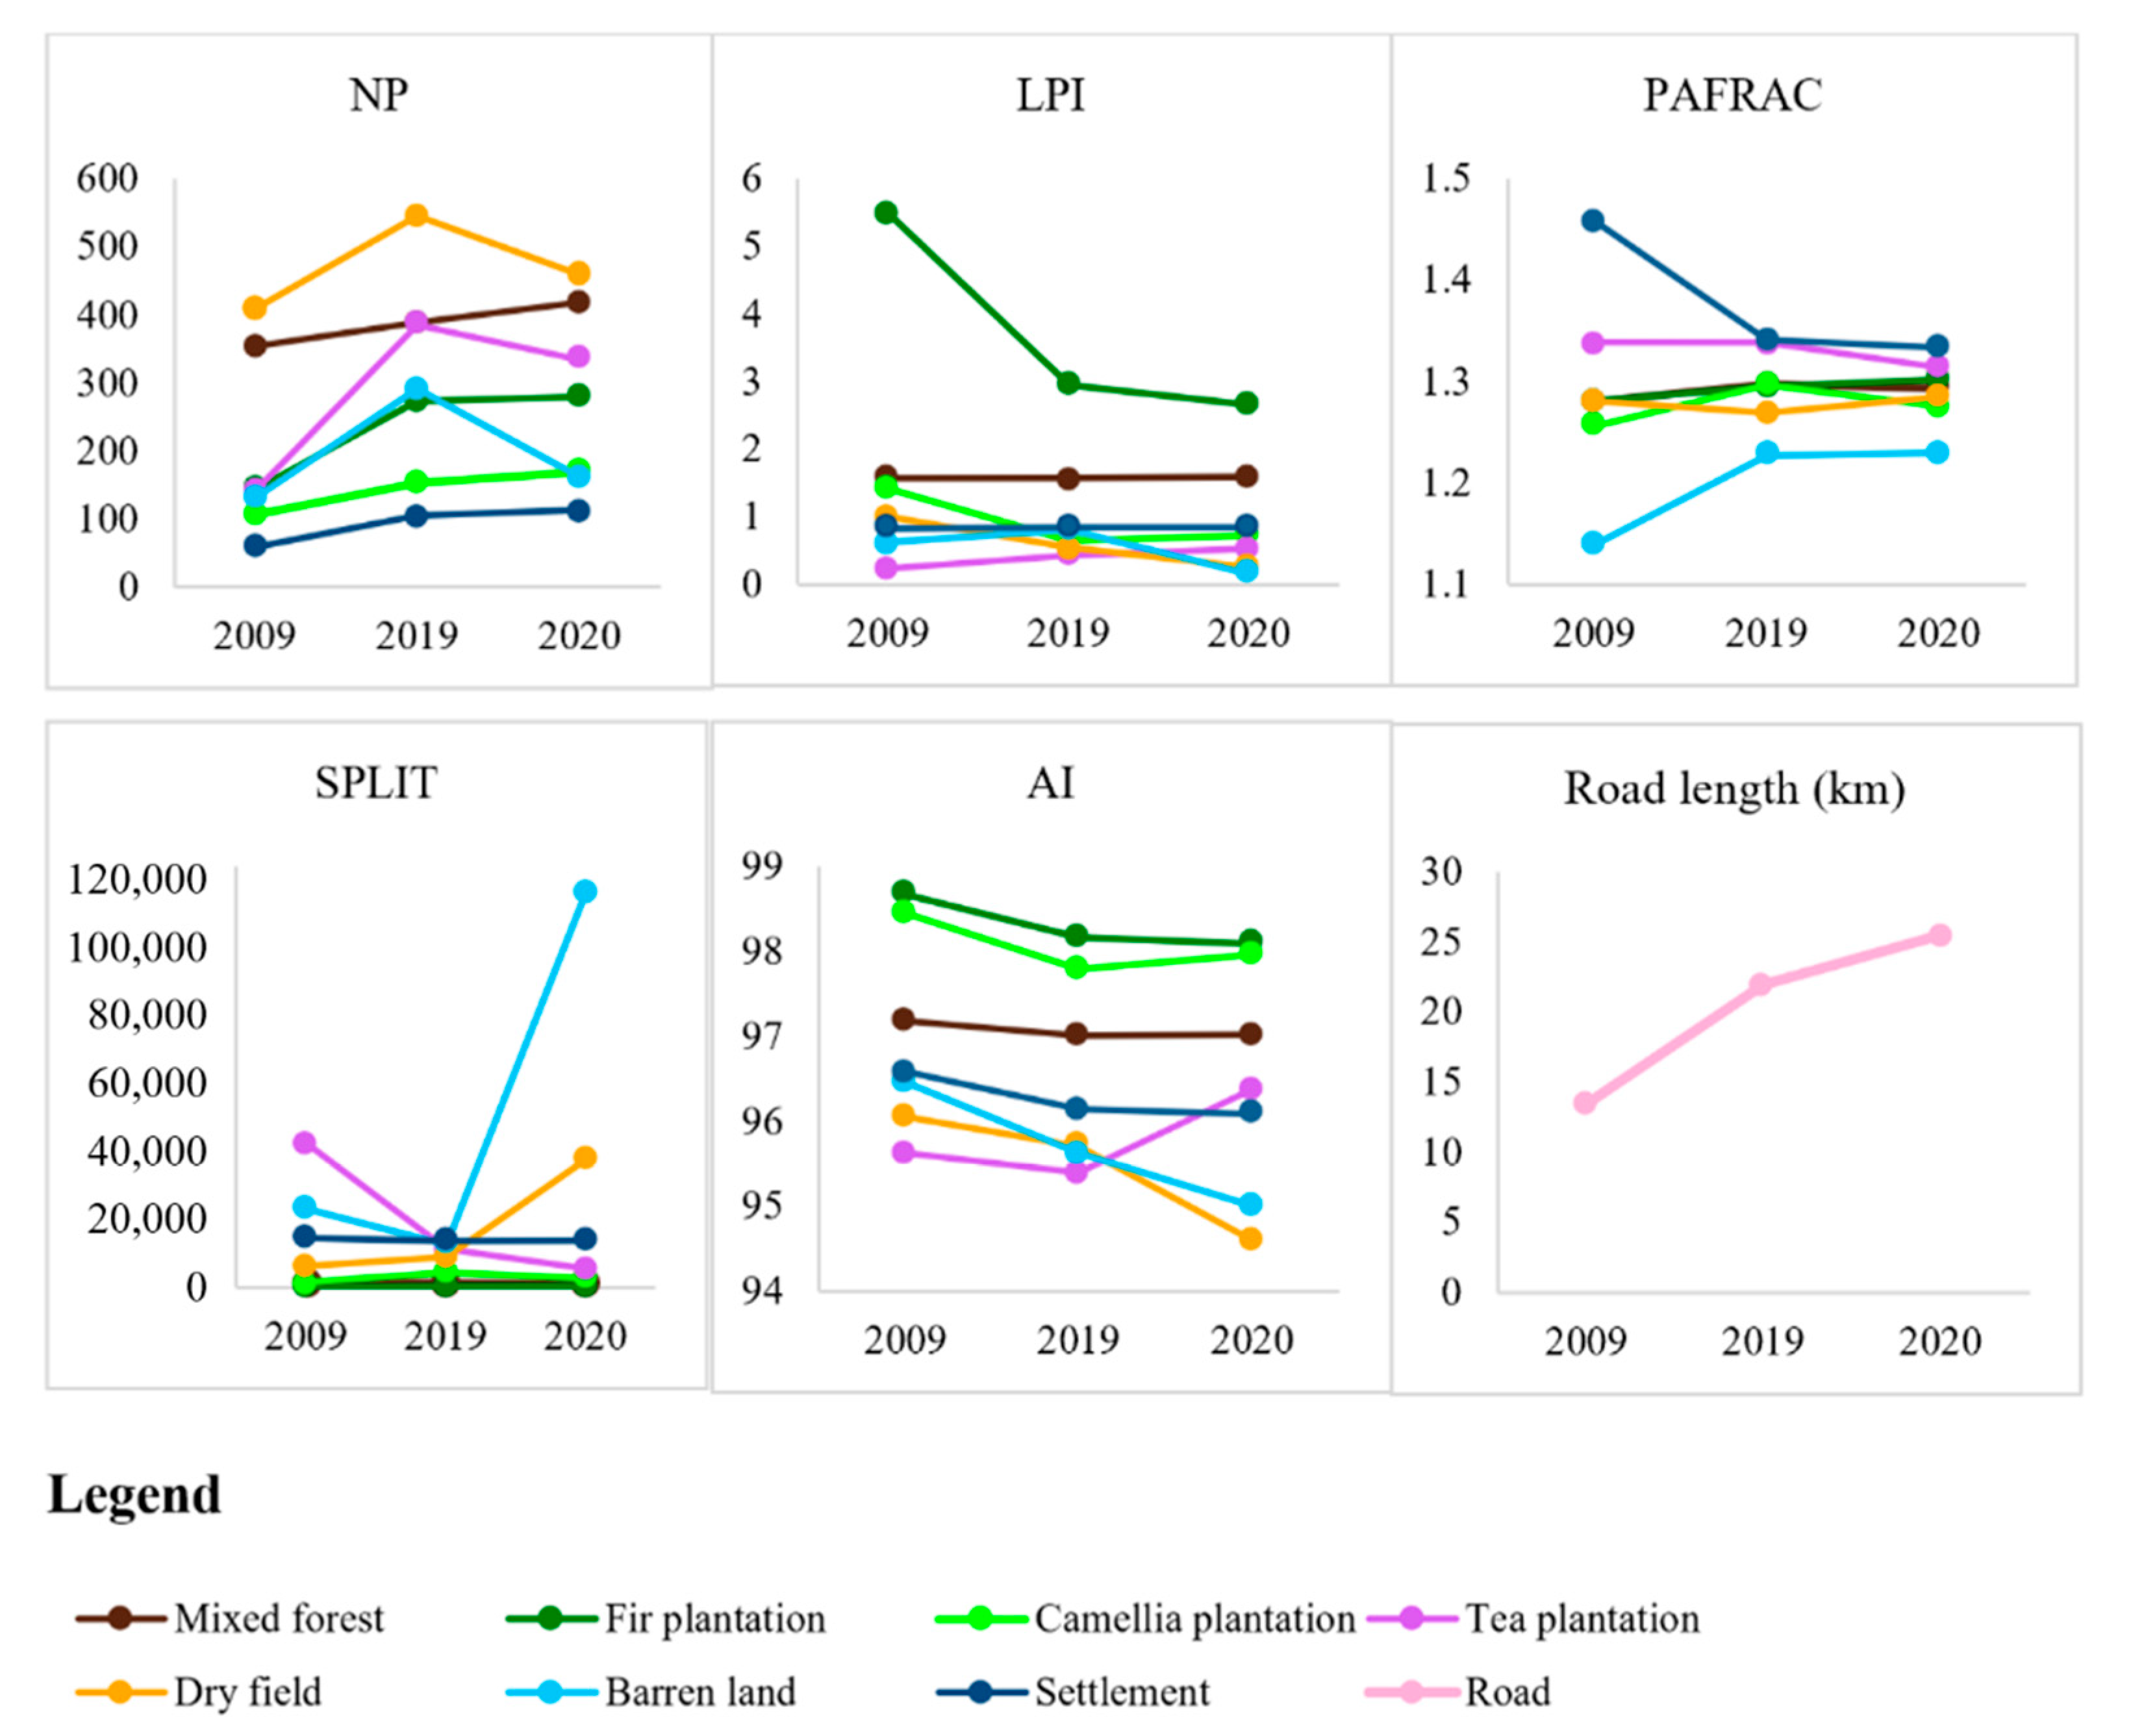
3.2.1. Changes in Landscape Metrics at Class Level
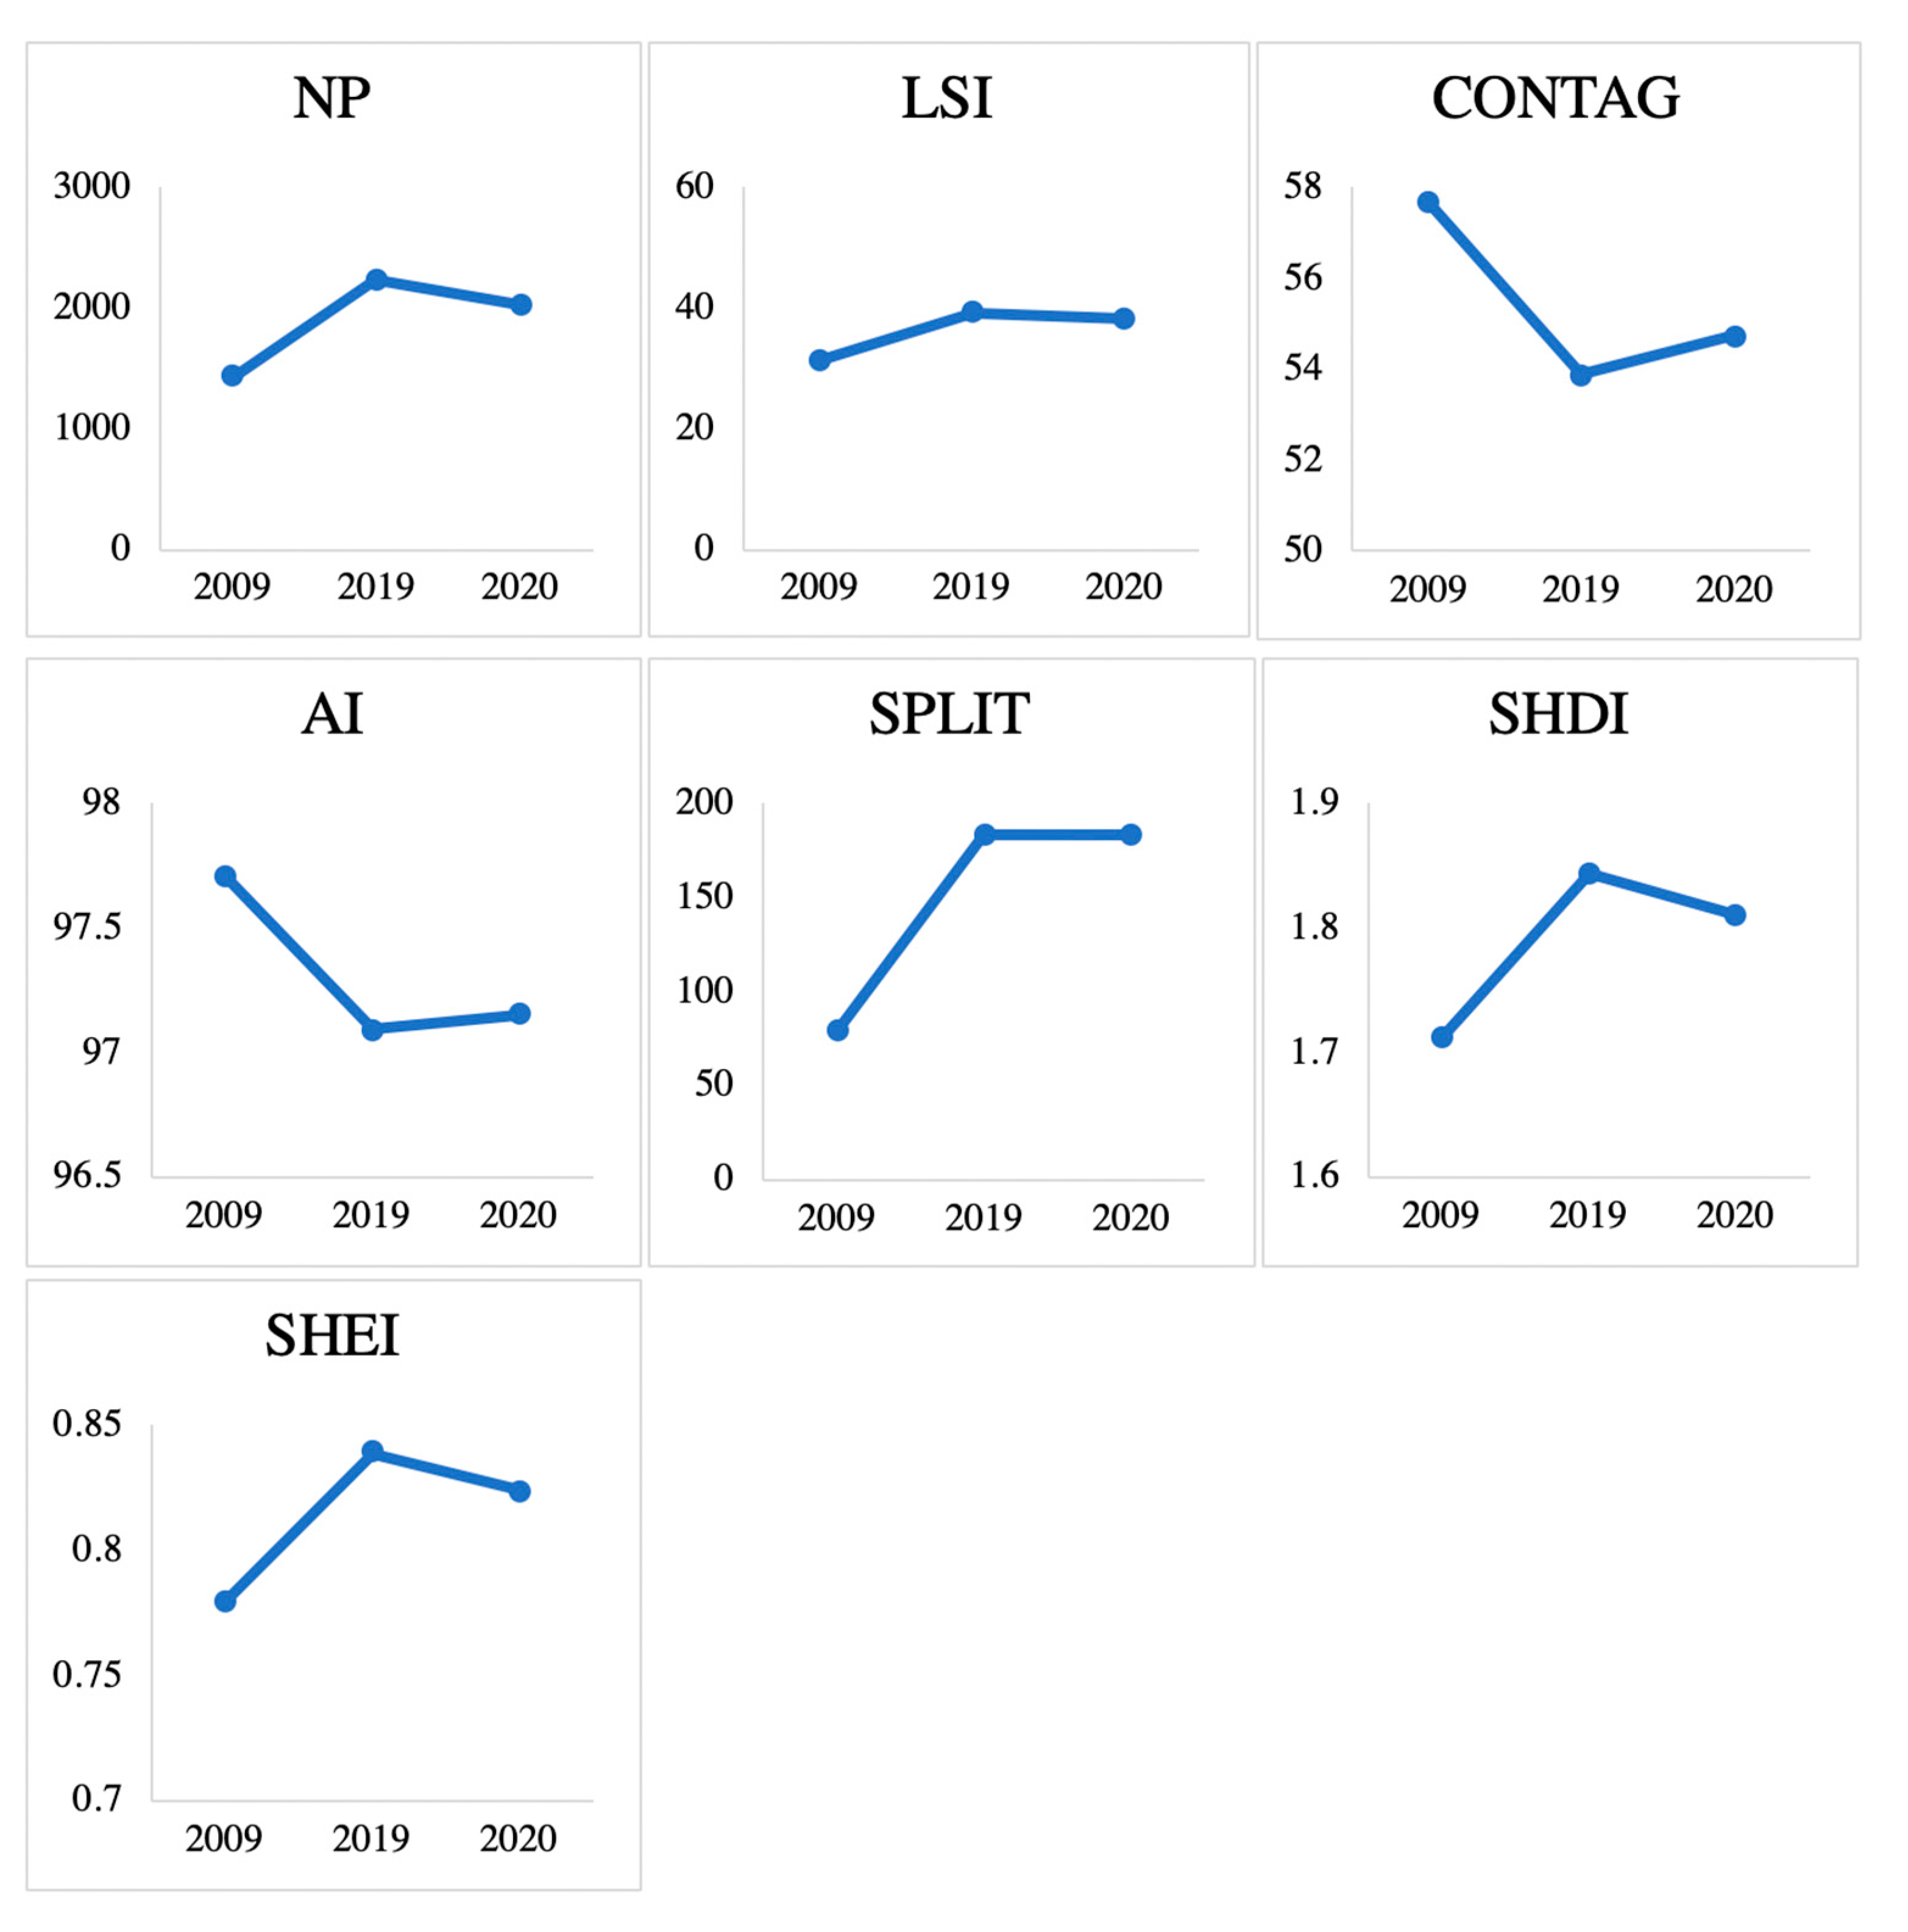
3.2.2. Changes in Landscape Metrics at Landscape Level
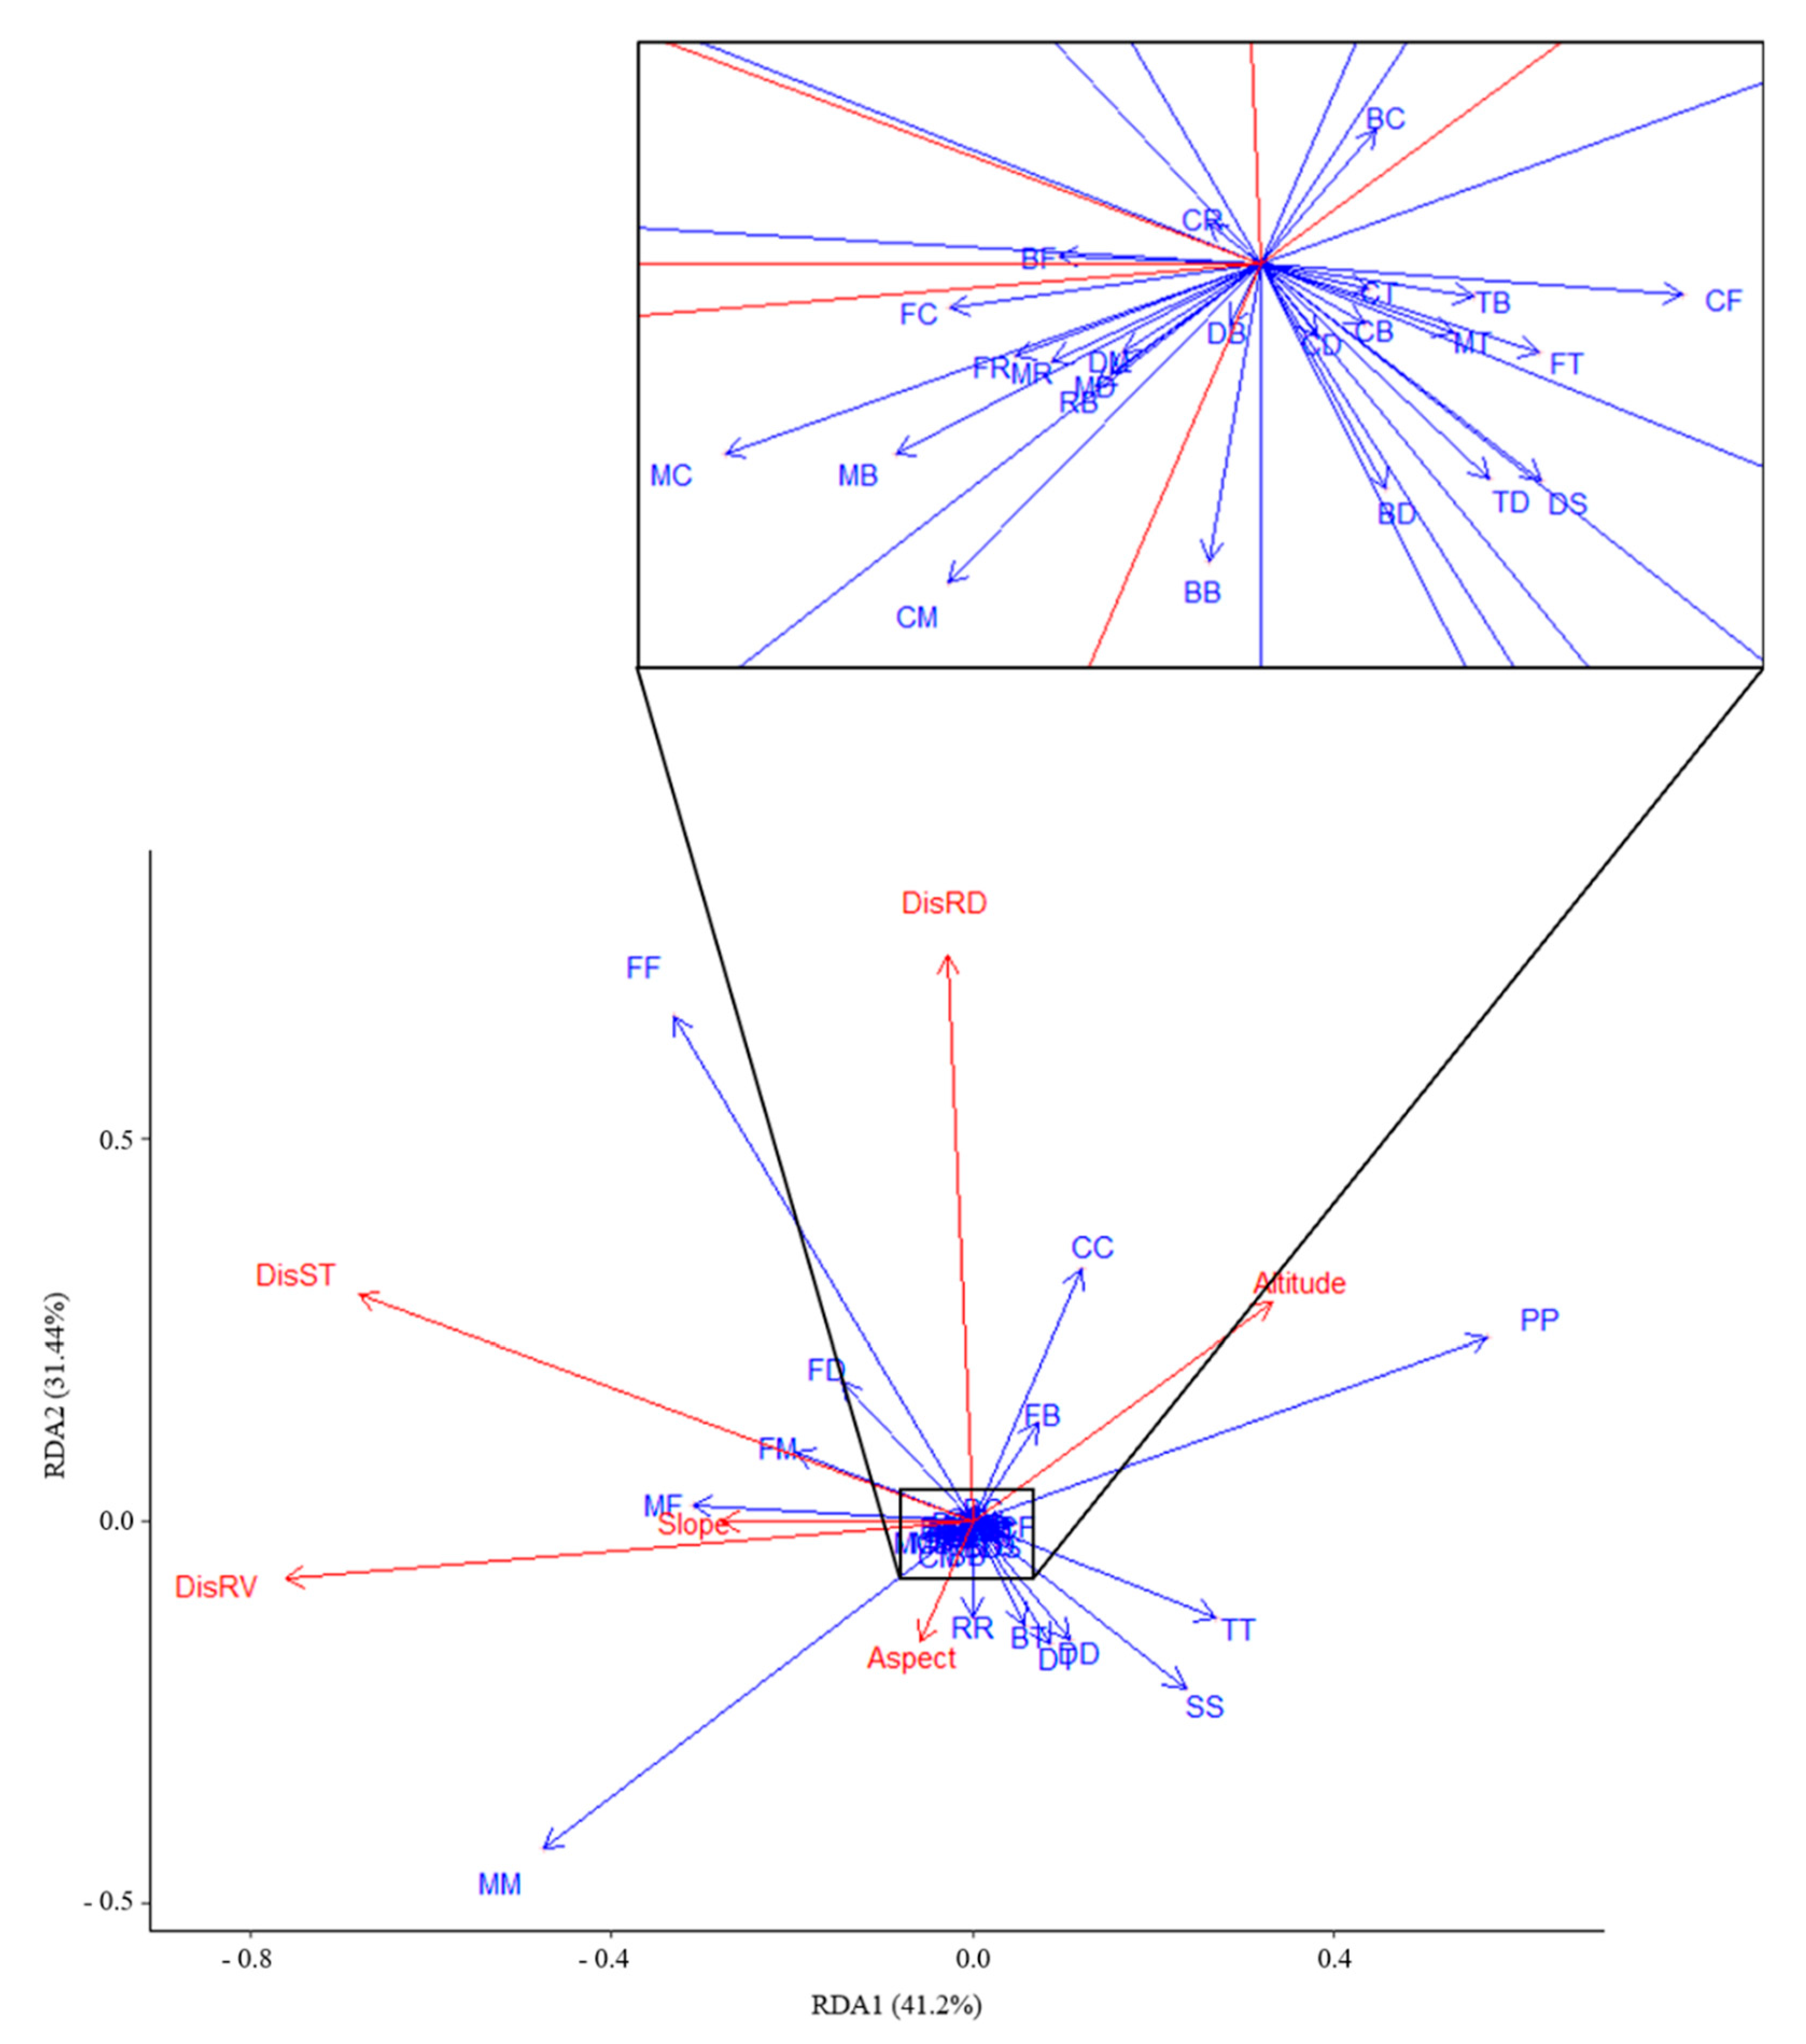
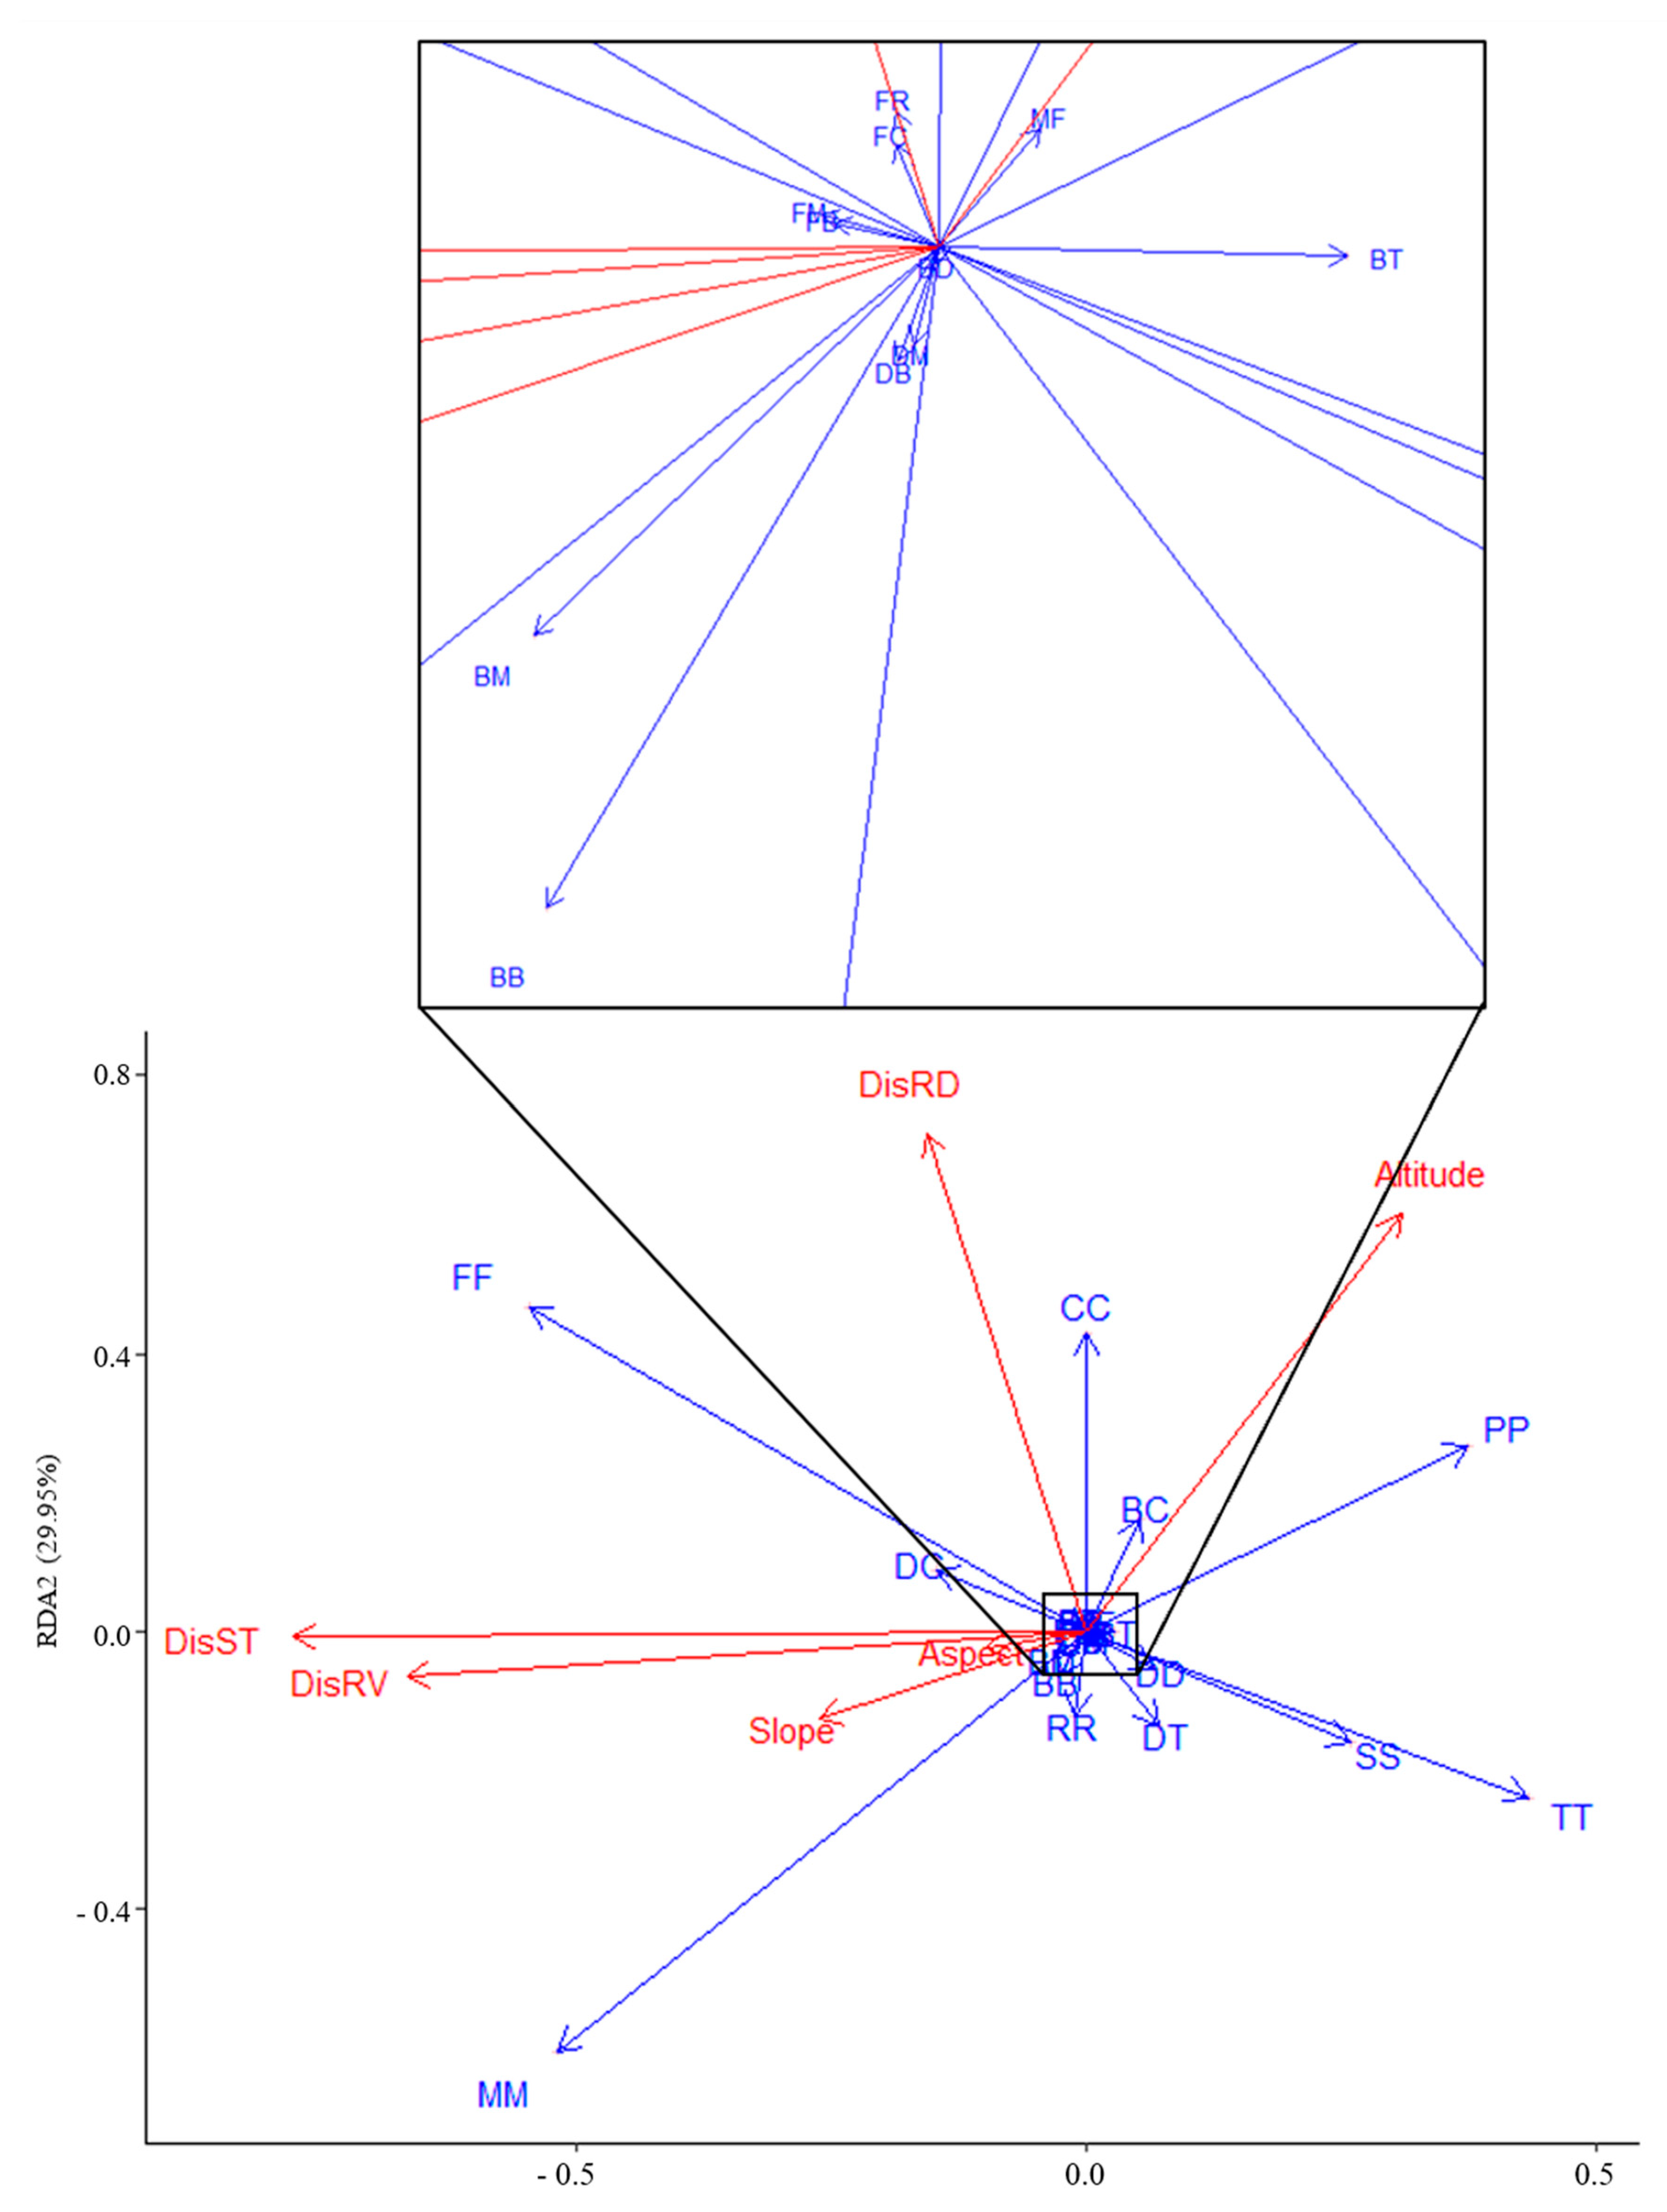
3.2.3. Relationship between Land Cover Change and Environmental Variables
4. Discussion
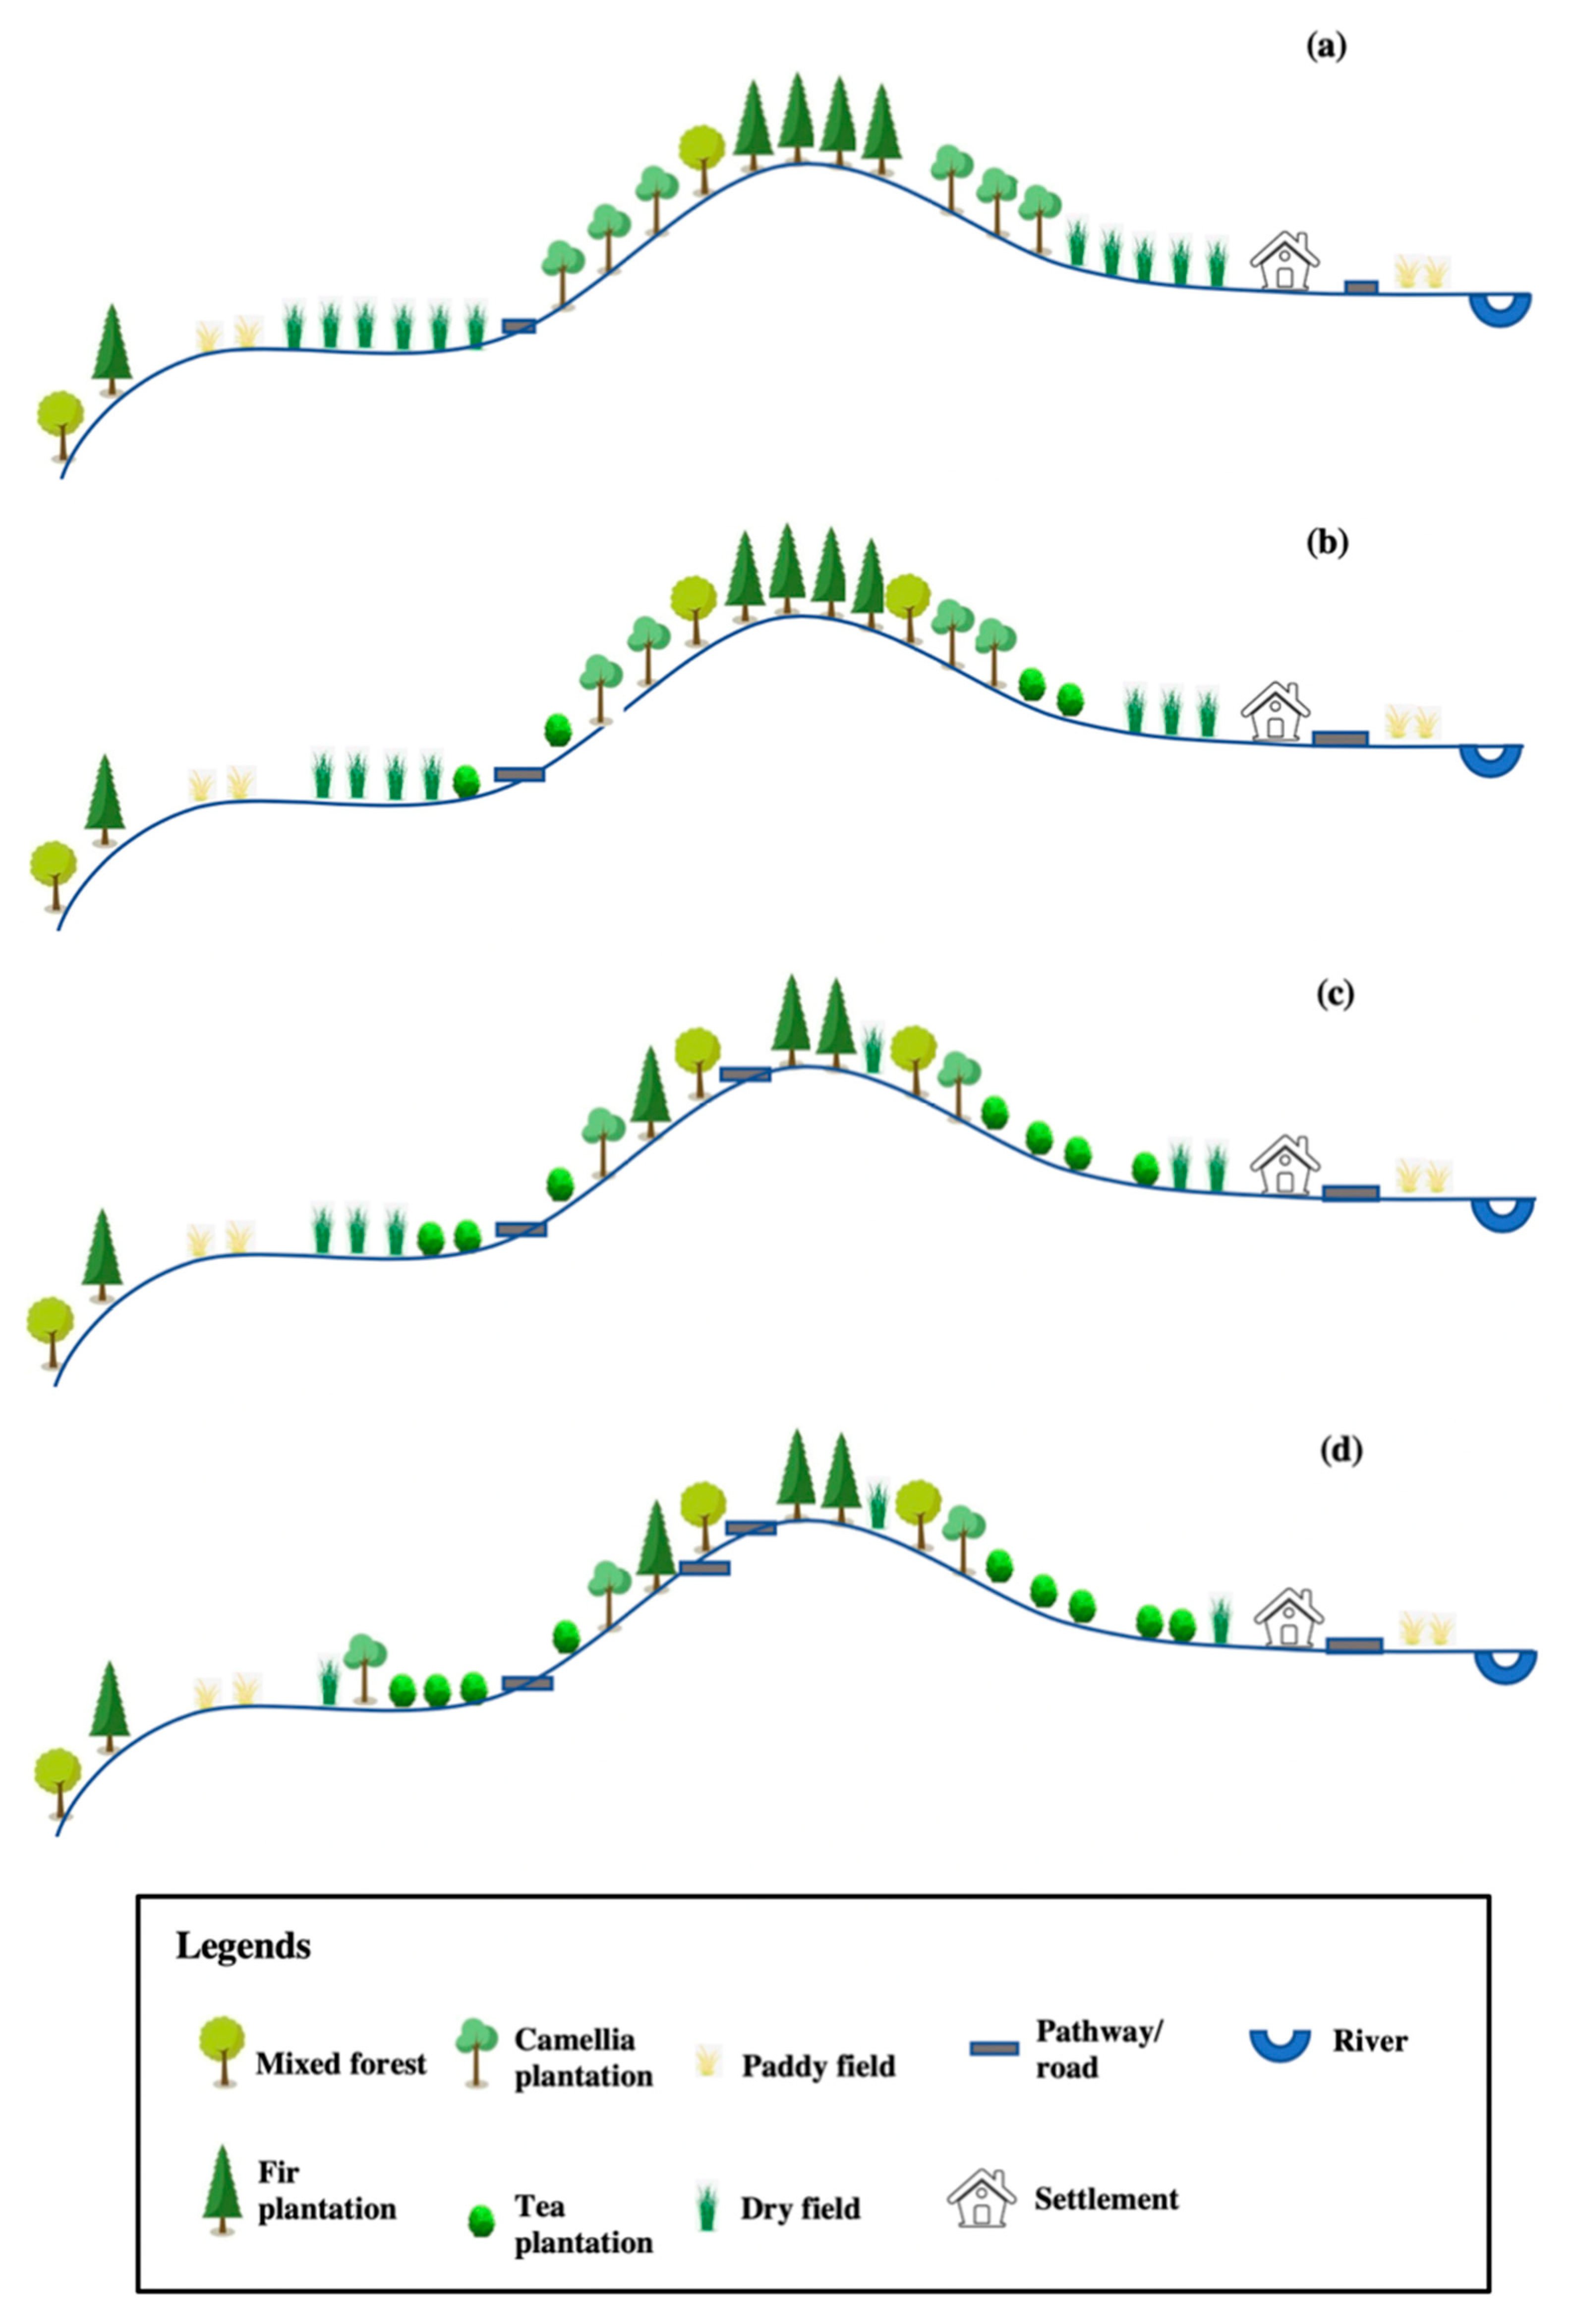
4.1. Direction of Land-Use Change in Gaoyou
4.2. Backgrounds of Rapid Land-Use Change
4.2.1. Clarification of Land-Use Change in Relation to Natural and Anthropogenic Variables
4.2.2. Role of Policy Intervention in Land-Use Change
4.2.3. Role of Local Dong People’s Traditional Ecological Knowledge
4.3. Possible Loss in Ecosystem Services Due to Rapid Land-Use Change
5. Conclusions
Author Contributions
Funding
Institutional Review Board Statement
Informed Consent Statement
Data Availability Statement
Acknowledgments
Conflicts of Interest
References
- Foley, J.; Defries, R.; Asner, G.; Barford, C.; Bonan, G.; Carpenter, S.; Chapin, F.; Coe, M.; Daily, G.; Gibbs, H.; et al. Global consequences of land use. Science 2005, 309, 570–574. [Google Scholar] [CrossRef] [PubMed]
- Lambin, E.F.; Baulies, X.; Bockstael, N.; Fischer, G.; Krug, T.; Leemans, R.; Moran, E.; Rindfuss, R.; Sato, Y.; Skole, D.; et al. Land-Use and Land-Cover Change (LUCC): Implementation Strategy. A Core Project of the International Geosphere-Biosphere Programme and the International Human Dimensions Programme on Global Environmental Change; IGBP Report 48, IHDP Report 10; IGBP: Stockholm, Sweden, 1999; Volume 125. [Google Scholar]
- Long, H.; Zhang, Y.; Ma, L.; Tu, S. Land Use Transitions: Progress, Challenges and Prospects. Land 2021, 10, 903. [Google Scholar] [CrossRef]
- Newbold, T.; Hudson, L.N.; Hill, S.L.; Contu, S.; Lysenko, I.; Senior, R.A.; Börger, L.; Bennett, D.J.; Choimes, A.; Collen, B.; et al. Global effects of land use on local terrestrial biodiversity. Nature 2015, 520, 45–50. [Google Scholar] [CrossRef]
- Bugalho, M.; Caldeira, M.; Pereira, J.; Aronson, J.; Pausas, J. Mediterranean cork oak savannas require human use to sustain biodiversity and ecosystem services. Front. Ecol. Environ. 2011, 9, 278–286. [Google Scholar] [CrossRef]
- Weng, Q. Land use change analysis in the Zhujiang Delta of China using satellite remote sensing, GIS and stochastic modelling. J. Environ. Manag. 2002, 64, 273–284. [Google Scholar] [CrossRef] [PubMed]
- Liu, J.; Zhang, Z.; Xu, X.; Kuang, W.; Zhou, W.; Zhang, S.; Li, R.; Yan, C.; Yu, D.; Wu, S.; et al. Spatial patterns and driving forces of land use change in China during the early 21st century. J. Geogr. Sci. 2010, 20, 483–494. [Google Scholar] [CrossRef]
- Liu, J.; Liu, M.; Zhuang, D.; Zhang, Z.; Deng, X. Study on spatial pattern of land-use change in China during 1995–2000. Sci. China Ser. D Earth Sci. 2003, 46, 373–384. [Google Scholar] [CrossRef]
- Peng, J.; Wu, J.; Yin, H.; Li, Z.; Chang, Q.; Mu, T. Rural Land Use Change during 1986–2002 in Lijiang, China, Based on Remote Sensing and GIS Data. Sensors 2008, 8, 8201–8223. [Google Scholar] [CrossRef]
- Long, H.; Tu, S.; Ge, D.; Li, T.; Liu, Y. The allocation and management of critical resources in rural China under restructuring: Problems and prospects. J. Rural Stud. 2016, 47, 392–412. [Google Scholar] [CrossRef]
- Su, Y.; Qian, K.; Lin, L.; Wang, K.; Guan, T.; Gan, M. Identifying the driving forces of non-grain production expansion in rural China and its implications for policies on cultivated land protection. Land Use Policy 2020, 92, 104435. [Google Scholar] [CrossRef]
- Vitousek, P.; Mooney, H.; Lubchenco, J.; Melillo, J. Human Domination of Earth’s Ecosystems. Science 1997, 277, 494–499. [Google Scholar] [CrossRef]
- Dadashpoor, H.; Azizi, P.; Moghadasi, M. Land use change, urbanization, and change in landscape pattern in a metropolitan area. Sci. Total Environ. 2019, 655, 707–719. [Google Scholar] [CrossRef] [PubMed]
- Liu, J.; Kuang, W.; Zhang, Z.; Xu, X.; Qin, Y.; Ning, J.; Zhou, W.; Zhang, S.; Li, R.; Yan, C.; et al. Spatiotemporal characteristics, patterns, and causes of land-use changes in China since the late 1980s. J. Geogr. Sci. 2014, 24, 195–210. [Google Scholar] [CrossRef]
- Tang, J.; Li, Y.; Cui, S.; Xu, L.; Ding, S. Linking land-use change, landscape patterns, and ecosystem services in a coastal watershed of southeastern China. Glob. Ecol. Conserv. 2020, 23, e01177. [Google Scholar] [CrossRef]
- Bürgi, M.; Hersperger, A.M.; Schneeberger, N. Driving forces of landscape change—current and new directions. Landsc. Ecol. 2004, 19, 857–868. [Google Scholar] [CrossRef]
- Lambin, E.; Geist, H.; Lepers, E. Dynamics of Land-Use and Land-Cover Change in Tropical Regions. Annu. Rev. Environ. Resour. 2003, 28, 205–241. [Google Scholar] [CrossRef]
- Gómez-Baggethun, E.; Corbera, E.; Reyes-García, V. Traditional Ecological Knowledge and Global Environmental Change: Research findings and policy implications. Ecol. Soc. 2013, 18, 72. [Google Scholar] [CrossRef]
- Yan, H.; Ku, H.; Xu, S. Rural revitalization, scholars, and the dynamics of the collective future in China. J. Peasant Stud. 2021, 48, 853–874. [Google Scholar] [CrossRef]
- Qin, F.; Fukamachi, K.; Shibata, S. Changes in indigenous natural resource utilisation regimes in a Dong ethnic minority village in southwest China. Landsc. Ecol. Eng. 2021, 17, 323–337. [Google Scholar] [CrossRef]
- Gray, P.; Ridge, J.; Poulin, S.; Seymour, A.; Schwantes, A.; Swenson, J.; Johnston, D. Integrating Drone Imagery into High-resolution Satellite Remote Sensing Assessments of Estuarine Environments. Remote Sens. 2018, 10, 1257. [Google Scholar] [CrossRef]
- Yao, H.; Qin, R.; Chen, X. Unmanned Aerial Vehicle for Remote Sensing Applications—A Review. Remote Sens. 2019, 11, 1443. [Google Scholar] [CrossRef]
- Rango, A.; Laliberte, A.; Herrick, J.; Winters, C.; Havstad, K.; Steele, C.; Browning, D. Unmanned aerial vehicle-based remote sensing for rangeland assessment, monitoring, and management. J. Appl. Remote Sens. 2009, 3, 033542. [Google Scholar] [CrossRef]
- Zhu, J.; Sun, K.; Jia, S.; Li, Q.; Hou, X.; Lin, W.; Liu, B.; Qiu, G. Urban Traffic Density Estimation Based on Ultrahigh-Resolution UAV Video and Deep Neural Network. IEEE J. Sel. Top. Appl. Earth Obs. Remote Sens. 2018, 11, 4968–4981. [Google Scholar] [CrossRef]
- Gioia, D.; Amodio, A.; Maggio, A.; Sabia, C. Impact of Land Use Changes on the Erosion Processes of a Degraded Rural Landscape: An Analysis Based on High-Resolution DEMs, Historical Images, and Soil Erosion Models. Land 2021, 10, 673. [Google Scholar] [CrossRef]
- McGarigal, K. Fragstats Help. 2015. Available online: https://ibis.geog.ubc.ca/courses/geob479/labs/fragstats.help.4.pdf (accessed on 22 February 2022).
- Li, H.; Wu, J. Use and misuse of landscape indices. Landsc. Ecol. 2004, 19, 389–399. [Google Scholar] [CrossRef]
- Cushman, S.A.; McGarigal, K.; Neel, M.C. Parsimony in landscape metrics: Strength, universality, and consistency. Ecol. Indic. 2008, 8, 691–703. [Google Scholar] [CrossRef]
- Southworth, J.; Nagendra, H.; Tucker, C. Fragmentation of a Landscape: Incorporating landscape metrics into satellite analyses of land-cover change. Landsc. Res. 2002, 27, 253–269. [Google Scholar] [CrossRef]
- UNESCO. Dong Villages. 2013. Available online: http://whc.unesco.org/en/tentativelists/5813/ (accessed on 24 December 2020).
- Uuemaa, E.; Antrop, M.; Roosaare, J.; Marja, R.; Mander, Ü. Landscape Metrics and Indices: An Overview of Their Use in Landscape Research. Living Rev. Landsc. Res. 2009, 3, 1–28. [Google Scholar] [CrossRef]
- Mertens, B.; Lambin, E. Land-cover-change trajectories in southern Cameroon. Ann. Am. Assoc. Geogr. 2000, 90, 467–494. [Google Scholar] [CrossRef]
- Hietel, E.; Waldhardt, R.; Otte, A. Linking socio-economic factors, environment and land cover in the German Highlands, 1945–1999. J. Environ. Manag. 2005, 75, 133–143. [Google Scholar] [CrossRef]
- Kong, W.; Sun, O.J.; Chen, Y.; Yu, Y.; Tian, Z. Patch-level based vegetation change and environmental drivers in Tarim River drainage area of West China. Landsc. Ecol. 2010, 25, 1447–1455. [Google Scholar] [CrossRef]
- Hietel, E.; Waldhardt, R.; Otte, A. Analysing land-cover changes in relation to environmental variables in Hesse, Germany. Landsc. Ecol. 2004, 19, 473–489. [Google Scholar] [CrossRef]
- Gustafsson, B.; Sai, D. Villages Where China’s Ethnic Minorities Live. China Econ. Rev. 2006, 20, 193–207. [Google Scholar] [CrossRef]
- Yu, Y.; Xu, T.; Wang, T. Outmigration Drives Cropland Decline and Woodland Increase in Rural Regions of Southwest China. Land 2020, 9, 443. [Google Scholar] [CrossRef]
- Geary, D.; Pan, Y. A Bilingual Education Pilot Project among the Kam People in Guizhou Province, China. J. Multiling. Multicult. Dev. 2003, 24, 274–289. [Google Scholar] [CrossRef]
- Cheng, T.; Selden, M. The Origins and Social Consequences of China’s Hukou System. China Q. 1994, 139, 644–668. [Google Scholar] [CrossRef]
- Lambin, E.; Turner, B.; Geist, H.; Agbola, S.; Angelsen, A.; Bruce, J.; Coomes, O.; Dirzo, R.; Fischer, G.; Folke, C.; et al. The causes of land-use and land-cover change: Moving beyond the myths. Glob. Environ. Chang. 2001, 11, 261–269. [Google Scholar] [CrossRef]
- Lubowski, R.; Bucholtz, S.; Claassen, R.; Roberts, M.; Cooper, J.; Gueorguieva, A.; Johansson, R. Environmental Effects of Agricultural Land-Use Change: The Role of Economics and Policy; Economic Research Report 33591; United States Department of Agriculture, Economic Research Service: Washington, DC, USA, 2006. [Google Scholar]
- Jiang, L.; Deng, X.; Seto, K. The impact of urban expansion on agricultural land use intensity in China. Land Use Policy 2013, 35, 33–39. [Google Scholar] [CrossRef]
- Keys, E.; McConnell, W. Global change and the intensification of agriculture in the tropics. Glob. Environ. Chang. 2005, 15, 320–337. [Google Scholar] [CrossRef]
- Wang, J.; Xu, J. The ecological connotation of Japan’s “satoyama initiative” and its practical dilemma in China’s Ethnic areas—A case study in Balong Village, Lengshui Town, Shizhu Tujia Autonomous County, Chongqing Municipality. J. MUC (Nat. Sci. Ed.) 2019, 28, 5–14. (In Chinese) [Google Scholar]
- Park, A.; Wang, S. Community-based development and poverty alleviation: An evaluation of China’s poor village investment program. J. Public Econ. 2010, 94, 790–799. [Google Scholar] [CrossRef]
- Li, Y.; Su, B.; Liu, Y. Realizing targeted poverty alleviation in China. China Agric. Econ. Rev. 2016, 8, 443–454. [Google Scholar] [CrossRef]
- Shukla, M.; Jharkharia, S. Agri-fresh produce supply chain management: A state-of-the-art literature review. Int. J. Oper. Prod. Manag. 2013, 33, 114–158. [Google Scholar] [CrossRef]
- Berkes, F.; Folke, C.; Gadgil, M. Traditional Ecological Knowledge, Biodiversity, Resilience and Sustainability. In Biodiversity Conservation. Ecology, Economy & Environment; Perrings, C.A., Mäler, K.G., Folke, C., Holling, C.S., Jansson, B.O., Eds.; Springer: Dordrecht, The Netherlands, 1995; Volume 4. [Google Scholar] [CrossRef]
- Kumar, A.; Kumar, S.; Komal; Ramchiary, N.; Singh, P. Role of Traditional Ethnobotanical Knowledge and Indigenous Communities in Achieving Sustainable Development Goals. Sustainability 2021, 13, 3062. [Google Scholar] [CrossRef]
- Takeuchi, K. Rebuilding the relationship between people and nature: The Satoyama Initiative. Ecol. Res. 2010, 25, 891–897. [Google Scholar] [CrossRef]
- Fukamachi, K.; Oku, H.; Nakashizuka, T. The change of a satoyama landscape and its causality in Kamiseya, Kyoto Prefecture, Japan between 1970 and 1995. Landsc. Ecol. 2001, 16, 703–717. [Google Scholar] [CrossRef]
- Berglund, B.E.; Kitagawa, J.; Lagerås, P.; Nakamura, K.; Sasaki, N.; Yasuda, Y. Traditional Farming Landscapes for Sustainable Living in Scandinavia and Japan: Global Revival Through the Satoyama Initiative. AMBIO 2014, 43, 559–578. [Google Scholar] [CrossRef]
- Dublin, D.R.; Tanaka, N. Indigenous agricultural development for sustainability and “satoyama”. Geogr. Environ. Sustain. 2014, 7, 86–95. [Google Scholar] [CrossRef][Green Version]
- Saito, O.; Subramanian, S.M.; Hashimoto, S.; Takeuchi, K. Introduction: Socio-ecological production landscapes and seascapes. In Managing Socio-Ecological Production Landscapes and Seascapes for Sustainable Communities in Asia; Saito, O., Subramanian, S., Hashimoto, S., Takeuchi, K., Eds.; Science for Sustainable Societies; Springer: Singapore, 2020. [Google Scholar]
- Mohri, H.; Lahoti, S.; Saito, O.; Mahalingam, A.; Gunatilleke, N.; Irham; Van Thang, H.; Hitinayake, G.; Takeuchi, K.; Herath, S. Assessment of ecosystem services in homegarden systems in Indonesia, Sri Lanka, and Vietnam. Ecosyst. Serv. 2013, 5, 124–136. [Google Scholar] [CrossRef]
- Shi, T.; Li, X.; Xin, L.; Xu, X. Analysis of Farmland Abandonment at Parcel Level: A Case Study in the Mountainous Area of China. Sustainability 2016, 8, 988. [Google Scholar] [CrossRef]
- Gu, K. Analyses on Folklore of Eighteen Years Old Chinese Fir from the View of Ecosystem Culture. J. Beijing For. Univ. (Soc. Sci.) 2007, 6, 1–15. [Google Scholar]
- Benayas, J. Abandonment of agricultural land: An overview of drivers and consequences. CAB Rev. Perspect. Agric. Vet. Sci. Nutr. Nat. Resour. 2007, 2, 1–14. [Google Scholar] [CrossRef]
- Wang, S.; Liu, Q.; Zhang, D. Karst rocky desertification in southwestern China: Geomorphology, landuse, impact and rehabilitation. Land Degrad. Dev. 2004, 15, 115–121. [Google Scholar] [CrossRef]
- Eckholm, E. The Deterioration of Mountain Environments. Science 1975, 189, 764–770. [Google Scholar] [CrossRef] [PubMed]
- Jaarsma, C.F.; Willems, G.P.A. Reducing habitat fragmentation by minor rural roads through traffic calming. Landsc. Urban Plan. 2002, 58, 125–135. [Google Scholar] [CrossRef]
- Li, T.; Shilling, F.; Thorne, J.; Li, F.; Schott, H.; Boynton, R.; Berry, A.M. Fragmentation of China’s landscape by roads and urban areas. Landsc. Ecol. 2010, 25, 839–853. [Google Scholar] [CrossRef]
- Fu, W.; Liu, S.; Degloria, S.; Dong, S.; Beazley, R. Characterizing the “fragmentation–barrier” effect of road networks on landscape connectivity: A case study in Xishuangbanna, Southwest China. Landsc. Urban Plan. 2010, 95, 122–129. [Google Scholar] [CrossRef]


| Population (Permanent Residents 1) | Households | Area (ha) | Farmland Area (Paddy Fields) (ha) | Forest Area (Fir/Camellia) (ha) | Tea Plantations (ha) | Garden Plots (ha) | Built-Up Land (ha) | Other Area (ha) | Average Elevation (m) |
|---|---|---|---|---|---|---|---|---|---|
| 1960 (1230) | 496 | 530.5 | 89.5 (85.2) | 330.9 (153.3/86.7) | 39.5 | 43 | 15.2 | 12.4 | 500 |
| Type | Description |
|---|---|
| Mixed forest | Including planted forests other than fir and camellia plantations and natural forests |
| Fir plantation | Plantation of fir trees |
| Camellia plantation | Plantation of camellia trees |
| Tea plantation | Plantation of tea bushes |
| Paddy field | Irrigated paddy field for rice and glutinous rice cultivation |
| Dry field | Irrigated paddy field for crops other than rice, rainfed paddy field (including dry rice cultivation), irrigated cropland (for example peanut field), rainfed cropland (for example sweet potato field), and vegetable field (for example leek field). |
| Barren land | Cleared land with no vegetation or structures, usually indicating that the old land use is cleared to change into another land use or will be left unmanaged |
| Settlement | Houses and nearby open areas, pathways and vegetable gardens |
| Road | Road for automobiles |
| Abbreviation | Range | |
|---|---|---|
| Total (class) area | CA | CA > 0, without limit |
| Percentage of landscape | PLAND | 0 < PLAND ≤ 100 |
| Number of patches | NP | NP > 0, without limit |
| Largest patch index | LPI | 0 < LPI ≤ 100 |
| Perimeter area fractal dimension | PAFRAC | 1 ≤ PAFRAC ≤ 2 |
| Splitting index | SPLIT | 1 ≤ SPLIT ≤ number of cells in the landscape area squared |
| Aggregation index | AI | 0 ≤ AI ≤ 100 |
| Abbreviation | Range | |
|---|---|---|
| Number of patches | NP | NP > 0, without limit |
| Landscape shape index | LSI | LSI ≥ 1, without limit |
| Contagion index | CONTAG | 0 ≤ CONTAG ≤ 100 |
| Aggregation index | AI | 0 ≤ AI ≤ 100 |
| Splitting index | SPLIT | 1 ≤ SPLIT ≤ number of cells in the landscape squared |
| Shannon’s diversity index | SHDI | SHDI ≥ 0, without limit |
| Shannon’s evenness index | SHEI | 0 ≤ SHEI ≤ 1 |
| Environmental Variable | Range | Median | Standard Deviation | |
|---|---|---|---|---|
| Natural attributes | Altitude (m) | 325–620 | 504 | 64.88 |
| Slope | 0.3–44.5 | 15.1 | 7.50 | |
| Aspect | 1–9 | 5 | 1.96 | |
| Distance to rivers (m) | 0–1500 | 300 | 264.30 | |
| Anthropogenic attributes | Distance to settlements (m) | 0–2800 | 1050 | 612.24 |
| Distance to roads (m) | 0–1103 | 160 | 217.95 | |
| Land-Use Type | 2009 | 2019 | 2020 | |||
|---|---|---|---|---|---|---|
| CA (ha) | PLAND (%) | CA (ha) | PLAND (%) | CA (ha) | PLAND (%) | |
| Mixed forest | 125 | 19.13 | 127 | 19.53 | 136 | 20.81 |
| Fir plantation | 256 | 39.22 | 234 | 35.89 | 228 | 35.05 |
| Camellia plantation | 102 | 15.59 | 71 | 10.90 | 94 | 14.41 |
| Tea plantation | 19 | 2.91 | 47 | 7.25 | 63 | 9.68 |
| Paddy field | 51 | 7.76 | 50 | 7.71 | 50 | 7.69 |
| Dry field | 67 | 10.29 | 68 | 10.41 | 38 | 5.87 |
| Barren land | 17 | 2.68 | 27 | 4.22 | 13 | 2.04 |
| Settlement | 9 | 1.34 | 11 | 1.76 | 12 | 1.80 |
| Road | 7 | 1.09 | 15 | 2.32 | 17 | 2.64 |
| Total | 652 | 100 | 652 | 100 | 652 | 100 |
| Land-Use Type | Change (%) | Net Change (ha) | Rate of Change (ha/Year) | ||||||
|---|---|---|---|---|---|---|---|---|---|
| 2009–2019 | 2019–2020 | 2009–2020 | 2009–2019 | 2019–2020 | 2009–2020 | 2009–2019 | 2019–2020 | 2009–2020 | |
| Mixed forest | 0.40 | 1.28 | 1.68 | 2 | 9 | 11 | 0.2 | 9 | 1 |
| Fir plantation | −3.33 | −0.84 | −4.17 | −22 | −6 | −28 | −2.2 | −6 | −2.5 |
| Camellia plantation | −4.69 | 3.51 | −1.18 | −31 | 23 | −8 | −3.1 | 23 | −0.7 |
| Tea plantation | 4.34 | 2.43 | 6.77 | 28 | 16 | 44 | 2.8 | 16 | 4 |
| Paddy field | −0.05 | −0.02 | −0.07 | −1 | 0 | −1 | −0.1 | 0 | −0.1 |
| Dry field | 0.12 | −4.54 | −4.42 | 1 | −30 | −29 | 0.1 | −30 | −2.6 |
| Barren land | 1.54 | −2.18 | −0.64 | 10 | −14 | −4 | 1 | −14 | −0.4 |
| Settlement | 0.42 | 0.04 | 0.46 | 2 | 1 | 3 | 0.2 | 1 | 0.3 |
| Road | 1.23 | 0.32 | 1.55 | 8 | 2 | 10 | 0.8 | 2 | 0.9 |
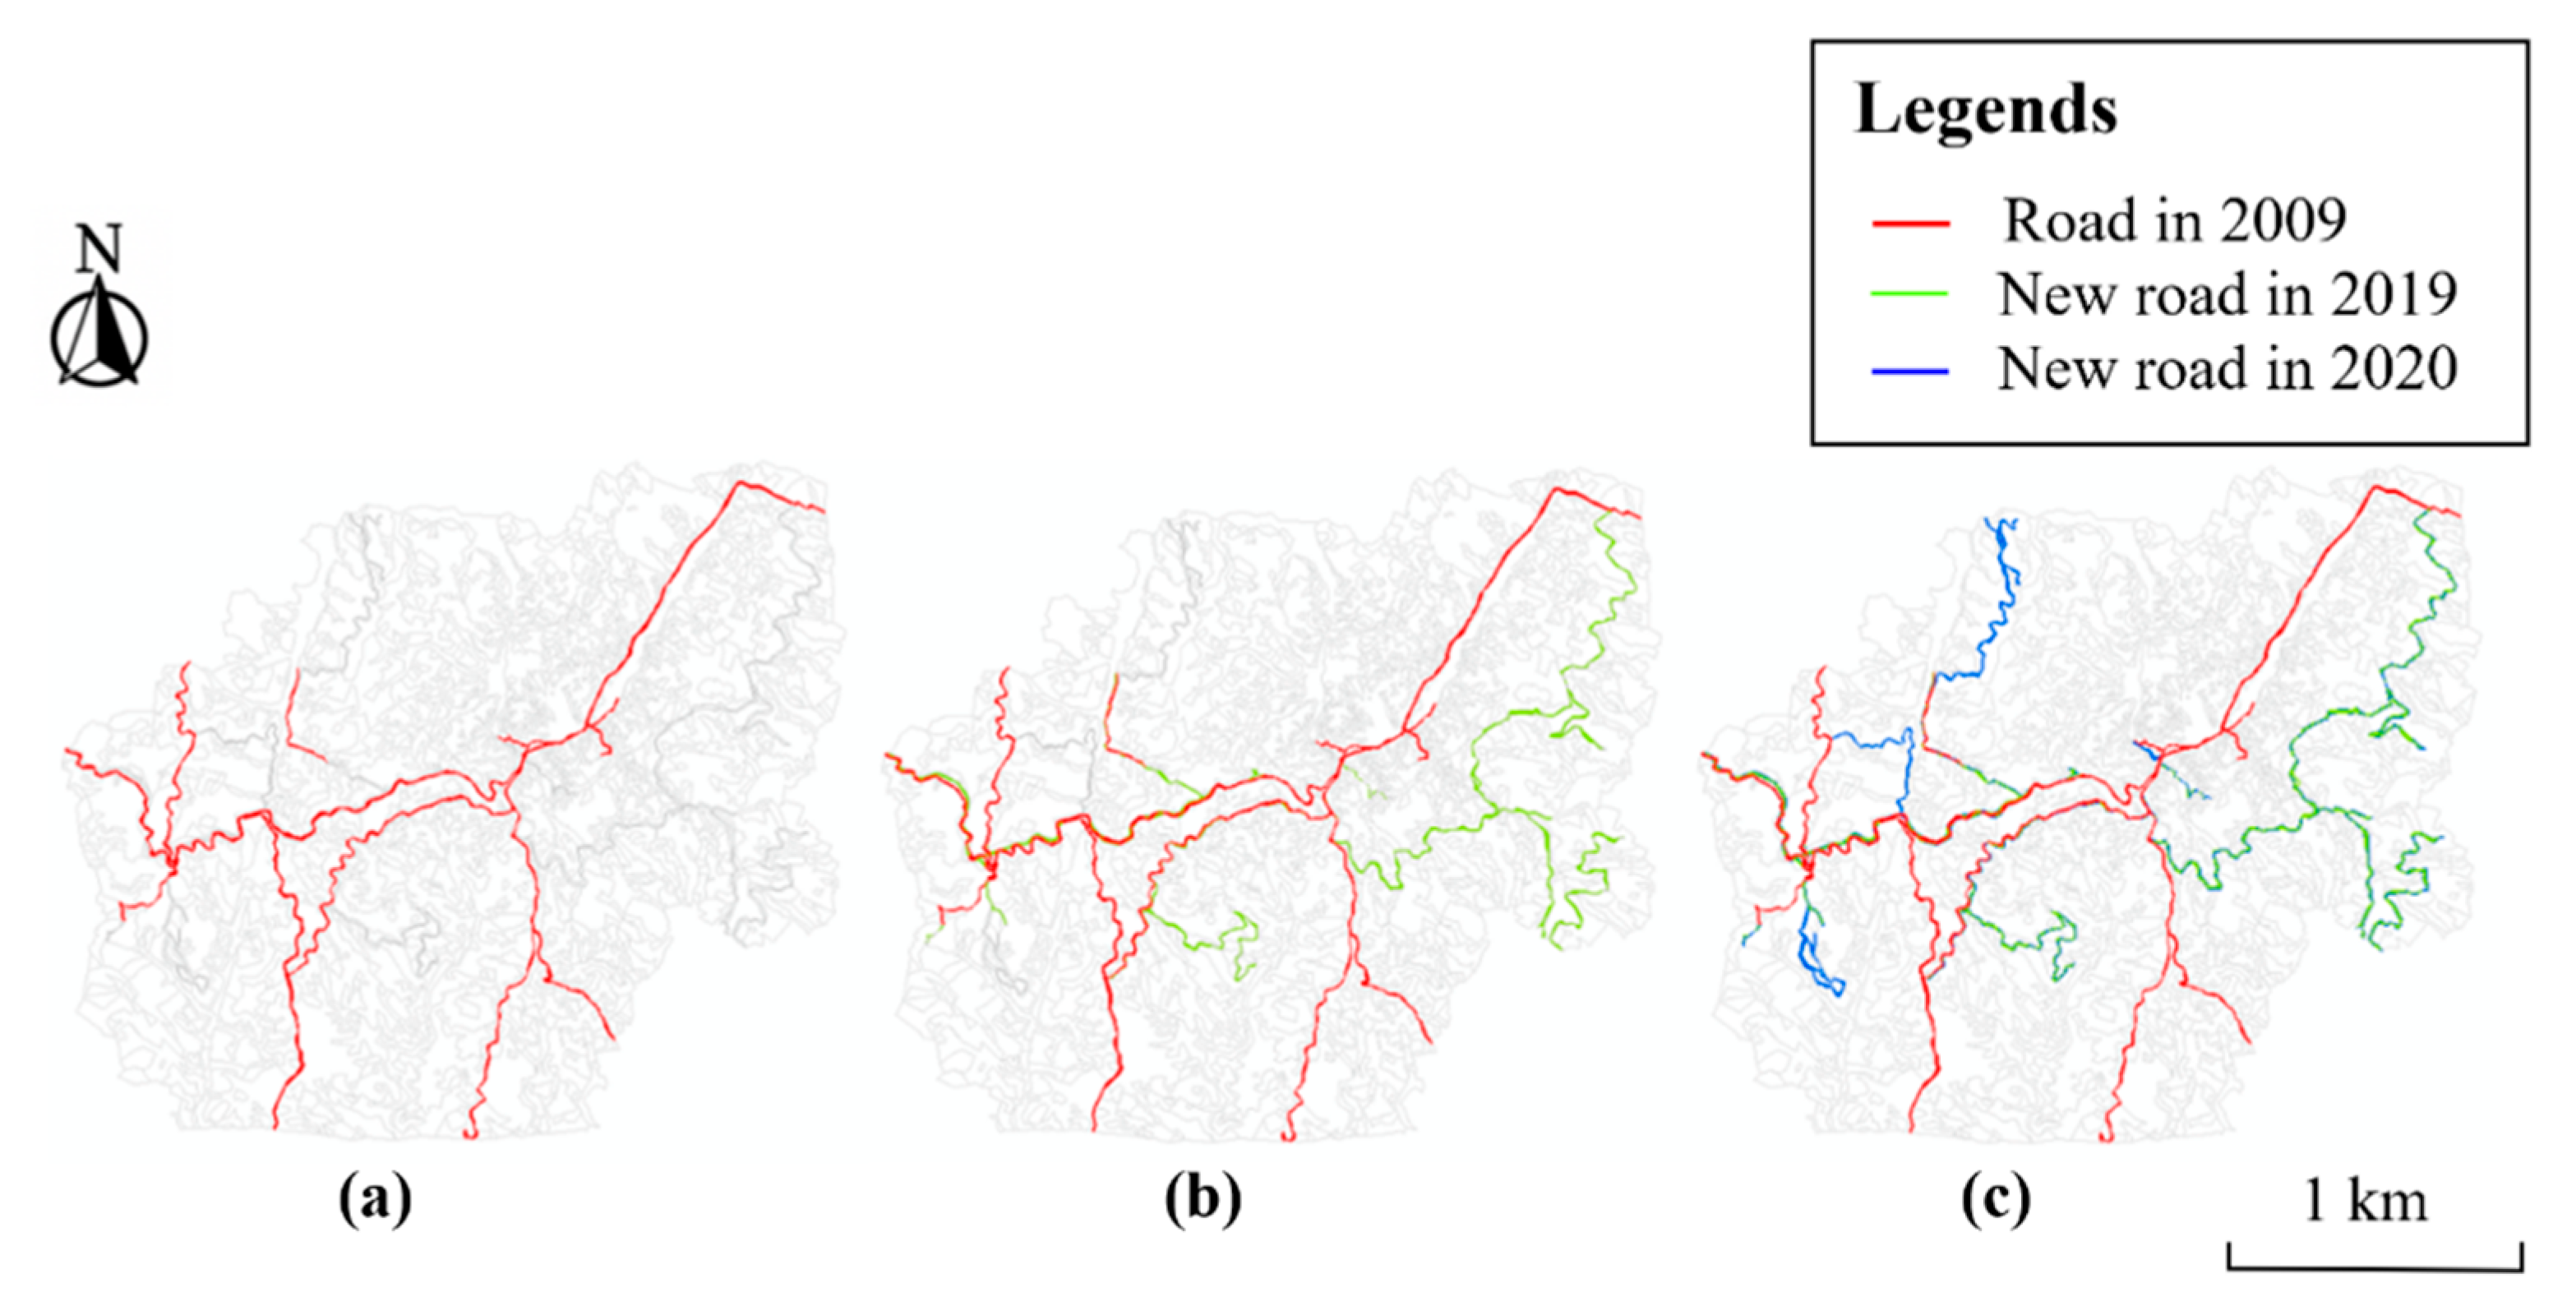
| Length (km) | Area (ha) | Width (m) | |
|---|---|---|---|
| 2009 | 13.4 | 7 | 5.2 |
| 2019 | 22.0 | 15 | 6.8 |
| 2020 | 25.5 | 17 | 6.7 |
| Year | Male (%) | Female (%) | Whole Population (%) |
|---|---|---|---|
| 1990 | 0 | 0 | 0 |
| 2000 | 11.17 | 10.66 | 10.93 |
| 2010 | 26.53 | 22.14 | 24.46 |
Publisher’s Note: MDPI stays neutral with regard to jurisdictional claims in published maps and institutional affiliations. |
© 2022 by the authors. Licensee MDPI, Basel, Switzerland. This article is an open access article distributed under the terms and conditions of the Creative Commons Attribution (CC BY) license (https://creativecommons.org/licenses/by/4.0/).
Share and Cite
Qin, F.; Fukamachi, K.; Shibata, S. Land-Use/Landscape Pattern Changes and Related Environmental Driving Forces in a Dong Ethnic Minority Village in Southwestern China. Land 2022, 11, 349. https://doi.org/10.3390/land11030349
Qin F, Fukamachi K, Shibata S. Land-Use/Landscape Pattern Changes and Related Environmental Driving Forces in a Dong Ethnic Minority Village in Southwestern China. Land. 2022; 11(3):349. https://doi.org/10.3390/land11030349
Chicago/Turabian StyleQin, Fanya, Katsue Fukamachi, and Shozo Shibata. 2022. "Land-Use/Landscape Pattern Changes and Related Environmental Driving Forces in a Dong Ethnic Minority Village in Southwestern China" Land 11, no. 3: 349. https://doi.org/10.3390/land11030349
APA StyleQin, F., Fukamachi, K., & Shibata, S. (2022). Land-Use/Landscape Pattern Changes and Related Environmental Driving Forces in a Dong Ethnic Minority Village in Southwestern China. Land, 11(3), 349. https://doi.org/10.3390/land11030349