Article

Thirty Years of Change in the Land Use and Land Cover of the Ziz Oases (Pre-Sahara of Morocco) Combining Remote Sensing, GIS, and Field Observations

1
Bioactives, Health & Environment Laboratory, Epigenetics, Faculty of Science and Techniques, Errachidia (UMI), Moroccan Center for Culture and Science, Moulay Ismail University, Meknes 50050, Morocco
2
Department of Geography, Ibn Tofail University, Kenitra 14000, Morocco
3
Cluster of Competency on Health and Environment, Moulay Ismail University, Meknes 52000, Morocco
4
Laboratory of Water, Biodiversity and Climate Change, Faculty of Sciences Semlalia, Cadi Ayyad University, Marrakech 40000, Morocco
5
Bioactives, Health and Environmental Laboratory, Epigenetics, Moulay Ismail University, Meknes 50050, Morocco
*
Author to whom correspondence should be addressed.
Land 2023, 12(12), 2127; https://doi.org/10.3390/land12122127
Submission received: 1 December 2022 / Revised: 25 January 2023 / Accepted: 1 February 2023 / Published: 1 December 2023

Abstract

:
Remote sensing (RS) data and geographic information system (GIS) techniques were used to monitor the changes in the Oasis agroecosystem of the pre-Saharan province of Errachidia, southeastern Morocco. The land use and land cover (LULC) change of the agroecosystem of this province was processed using Landsat time series with 5-year intervals of the last thirty years. The normalized difference vegetation index (NDVI) and the maximum likelihood classification (MLC) were categorized into five classes, including water bodies, cultivated land, bare land, built-up, and desertified land. The overall accuracy of the MLC maps was estimated to be higher than 90%. The finding showed a degradation trend represented by an increase in desertified lands, which tripled in the ten last years, passing from 20.62% in 2011 to 58.49% in 2022. The findings also depicted a decreasing trend in the cultivated area in this period passing from 174.2 km 2 in 1991 to 82.2 km 2 in 2022. Using NDWI, Landsat images from 1991 to 2021 depicted a strong association between the water reserve in Hassan Eddakhil dam in the upstream area and the LULC changes. The oases from the dam (upstream) to Er-Rissani (downstream) recorded high rates of decline with an increasing trend of desertification due to drought and overuse mainly of groundwater. The outputs of this research effort constitute a significant source of information that may be used to support further research and decision-makers to manage arid ecosystems and achieve the sustainable development goals (SDGs), precisely the SDGs 15 (Life on land).

1. Introduction

Oases are millennial agro-ecosystems that support a significant flora and fauna biodiversity [1]. Worldwide, the oases are arid wetlands localized in many regions in China from Asia, in the Middle East, and in North African countries such as Algeria and Morocco. In these areas, water resources are rare, and these ecosystems are primarily linked to groundwater ecosystem reserves (ES). This dependence on water resources in arid climates exposes the oases to droughts and demographic growth. Many studies have confirmed the reduction of the surface areas, water surface, and groundwater reserves in these vulnerable ecosystems. In the Shiyang River Basin from China, Huang, and Ochoa [2] reported that the sustainability of the Qingtu Oasis, a fragile ecosystem is relied on ecological water diversion, advancing that the decrease in water diversion may cause water-level decline, oasis area reduction, fragmentation, and vegetation degradation. In the oasis-desert in the Sangong River watershed (Northwestern China), Yin et al. [3] recorded salt accumulation in different landscapes, mainly accelerating in irrigated lands, a continuous decrease in groundwater levels, and the degradation of groundwater quality.
In Morocco, Moumane et al. [4] investigated the spatiotemporal variation of groundwater level and salinity, recording the overuse in the Middle Draa valley in the pre-Saharan region. According to this last study, the groundwater table decreased by 10 m and a significant increase in water salinity (from 1077.55 to 1211.9 µS/cm) between 2013 and 2018, which caused the drying up of several wells and remarkable drinking water shortages in the closest city and villages. Otherwise, studying the agricultural dynamics of the Algerian oasis of Sidi Okba and the Tadjdid extension, Hamamouche et al. [5] reported that in recent decades this oasis experienced physical degradation causing the removal of the lower layers (i.e., annual field crops and fruit trees). However, in Tunisia, Haj-Amor et al. [6] investigated the impacts of climate change (CC) on irrigation water requirements in an oasis under the salinity trend of groundwater. These authors recorded that CC induced a progressive increase in the salinity of water irrigation in Metouia oasis (a coastal oasis in southeastern Tunisia). The same study projected in the period 2019–2050 an increase in irrigation water requirement of date palms and a decreasing trend of rainfall, which may increase the aridity condition of the oasis [6]. Similarly, in the ecoregion in Oman and Yemen in Fog Oases in Southern Arabia, a fragile ecosystem Patzelt, [7] advanced that the vegetation is slow to regenerate and extremely sensitive to disturbance, and the extended areas and habitat are over-exploited and degraded with various species threatened with disappearance. However, in the oasis of Wadi Al-Thulaima (southern part of Al-Kharj city, southeast of Riyadh, Saudi Arabia) El-Sheikh et al. [8] considered it a hyper-arid habitat altered by wastewater reuse. This study reported the importance of the reuse of treated wastewater as a solution that helps the restoration of soils in these areas and the growth of perennial vegetation. Otherwise, Moumane et al. [9] studied the desertification in the Ternata oasis (Zagora province), in the southeastern province of Morocco, using remote sensing (RS) techniques reporting that the oasis experienced a significant expansion of desertification in the period between 1991 and 2021 and a remarkable reduction in cultivated lands (−29.6%). This advancement of the desert was also recorded by Karmaoui [10,11].
In Morocco, particularly in oasis areas, the strategy of converting water resources and creating dams in these arid areas has been used in several oases. The example of the Mansour Eddahbi dam (MED) in the Draa Valley and Hassan Eddakhil dam (HED), and Kadoussa dam in Errachidia province (oasis area of Morocco) are excellent examples. As they have benefits, these dams also have disadvantages, such as the change in the state of arid and semi-arid ecosystems and the appearance/disappearance of species, mainly in the downstream area. Dams are structural measures to produce hydraulic energy, control the flow during floods, and increase the irrigated agricultural area, which subsequently contributes to the socio-economic development of a region, especially in arid areas. Unfortunately, these structures suffer from some serious issues, such as siltation, which causes the reduction of their capacities. According to the forecasts made on the dams, they must retain less and less water in the coming years, which means less and less agricultural production. Since a large part of the population is dependent on the agricultural sector, which will be forced to move and migrate. This situation may increase the unemployment rate and, consequently, poverty. Additionally, erosion is another significant problem linked to the low quality of soil in this fragile area that has been estimated in several studies. The results of the IMPETUS project implemented in the region estimated that the rate of erosion was at 5.6 tons/ha/year [12], which confirms the high level of siltation in these dams. These reported issues, including ecosystem fragmentation, desertification, dam silting, water depletion, and soil erosion, may indicate a significant rate of degradation in these vulnerable areas.
The changes in oases ecosystems and resources are approached using different methods, including conceptual models, field surveys, field measurements, GIS techniques, and RS technologies. The RS is increasingly used in many domains, such as climatology, geology, agriculture, forestry, ecology, hydrology [13], epidemiology [14], and geography. The applications range from the observation and monitoring of many variables, including desertification, fires, floods, erosion [15,16], droughts [17], and urbanization. The most used applications are the impacts of CC and anthropogenic pressure on LULC change, such as vegetation, cities, and water surface. The farm productivity and income in an oasis (palm grove) are not stable from one year to another and are linked to the availability of dam water [5]. The importance of climate and economic opportunities and the governmental support for some crops have attracted national investors to base in the area. This was also reported by Hamamouche et al. [5], advancing that new forms of Saharan agriculture were attractive to national investors. This trend was also reported by Moumane et al. [4], and Karmaoui et al. [11] considered the orientation of farmers to some crops, particularly watermelon, in arid areas as harmful in the long run. This option may induce, in addition to the water shortage, the reduction of soil fertility and, consequently, long-term socioecological impacts. The current decreasing trend of water resources and LULC raised the necessity to measure and monitor the dynamics of ecosystems.
The current study primarily aimed to monitor the change in LULC in the Oued Ziz (pre-Saharan area of Morocco) and to better understand the interaction between the components of the socio-ecological system of this arid zone. This may help explore the impact of CC and human intervention on the LULC using RS and GIS techniques in the last thirty years.

2. Materials and Methods
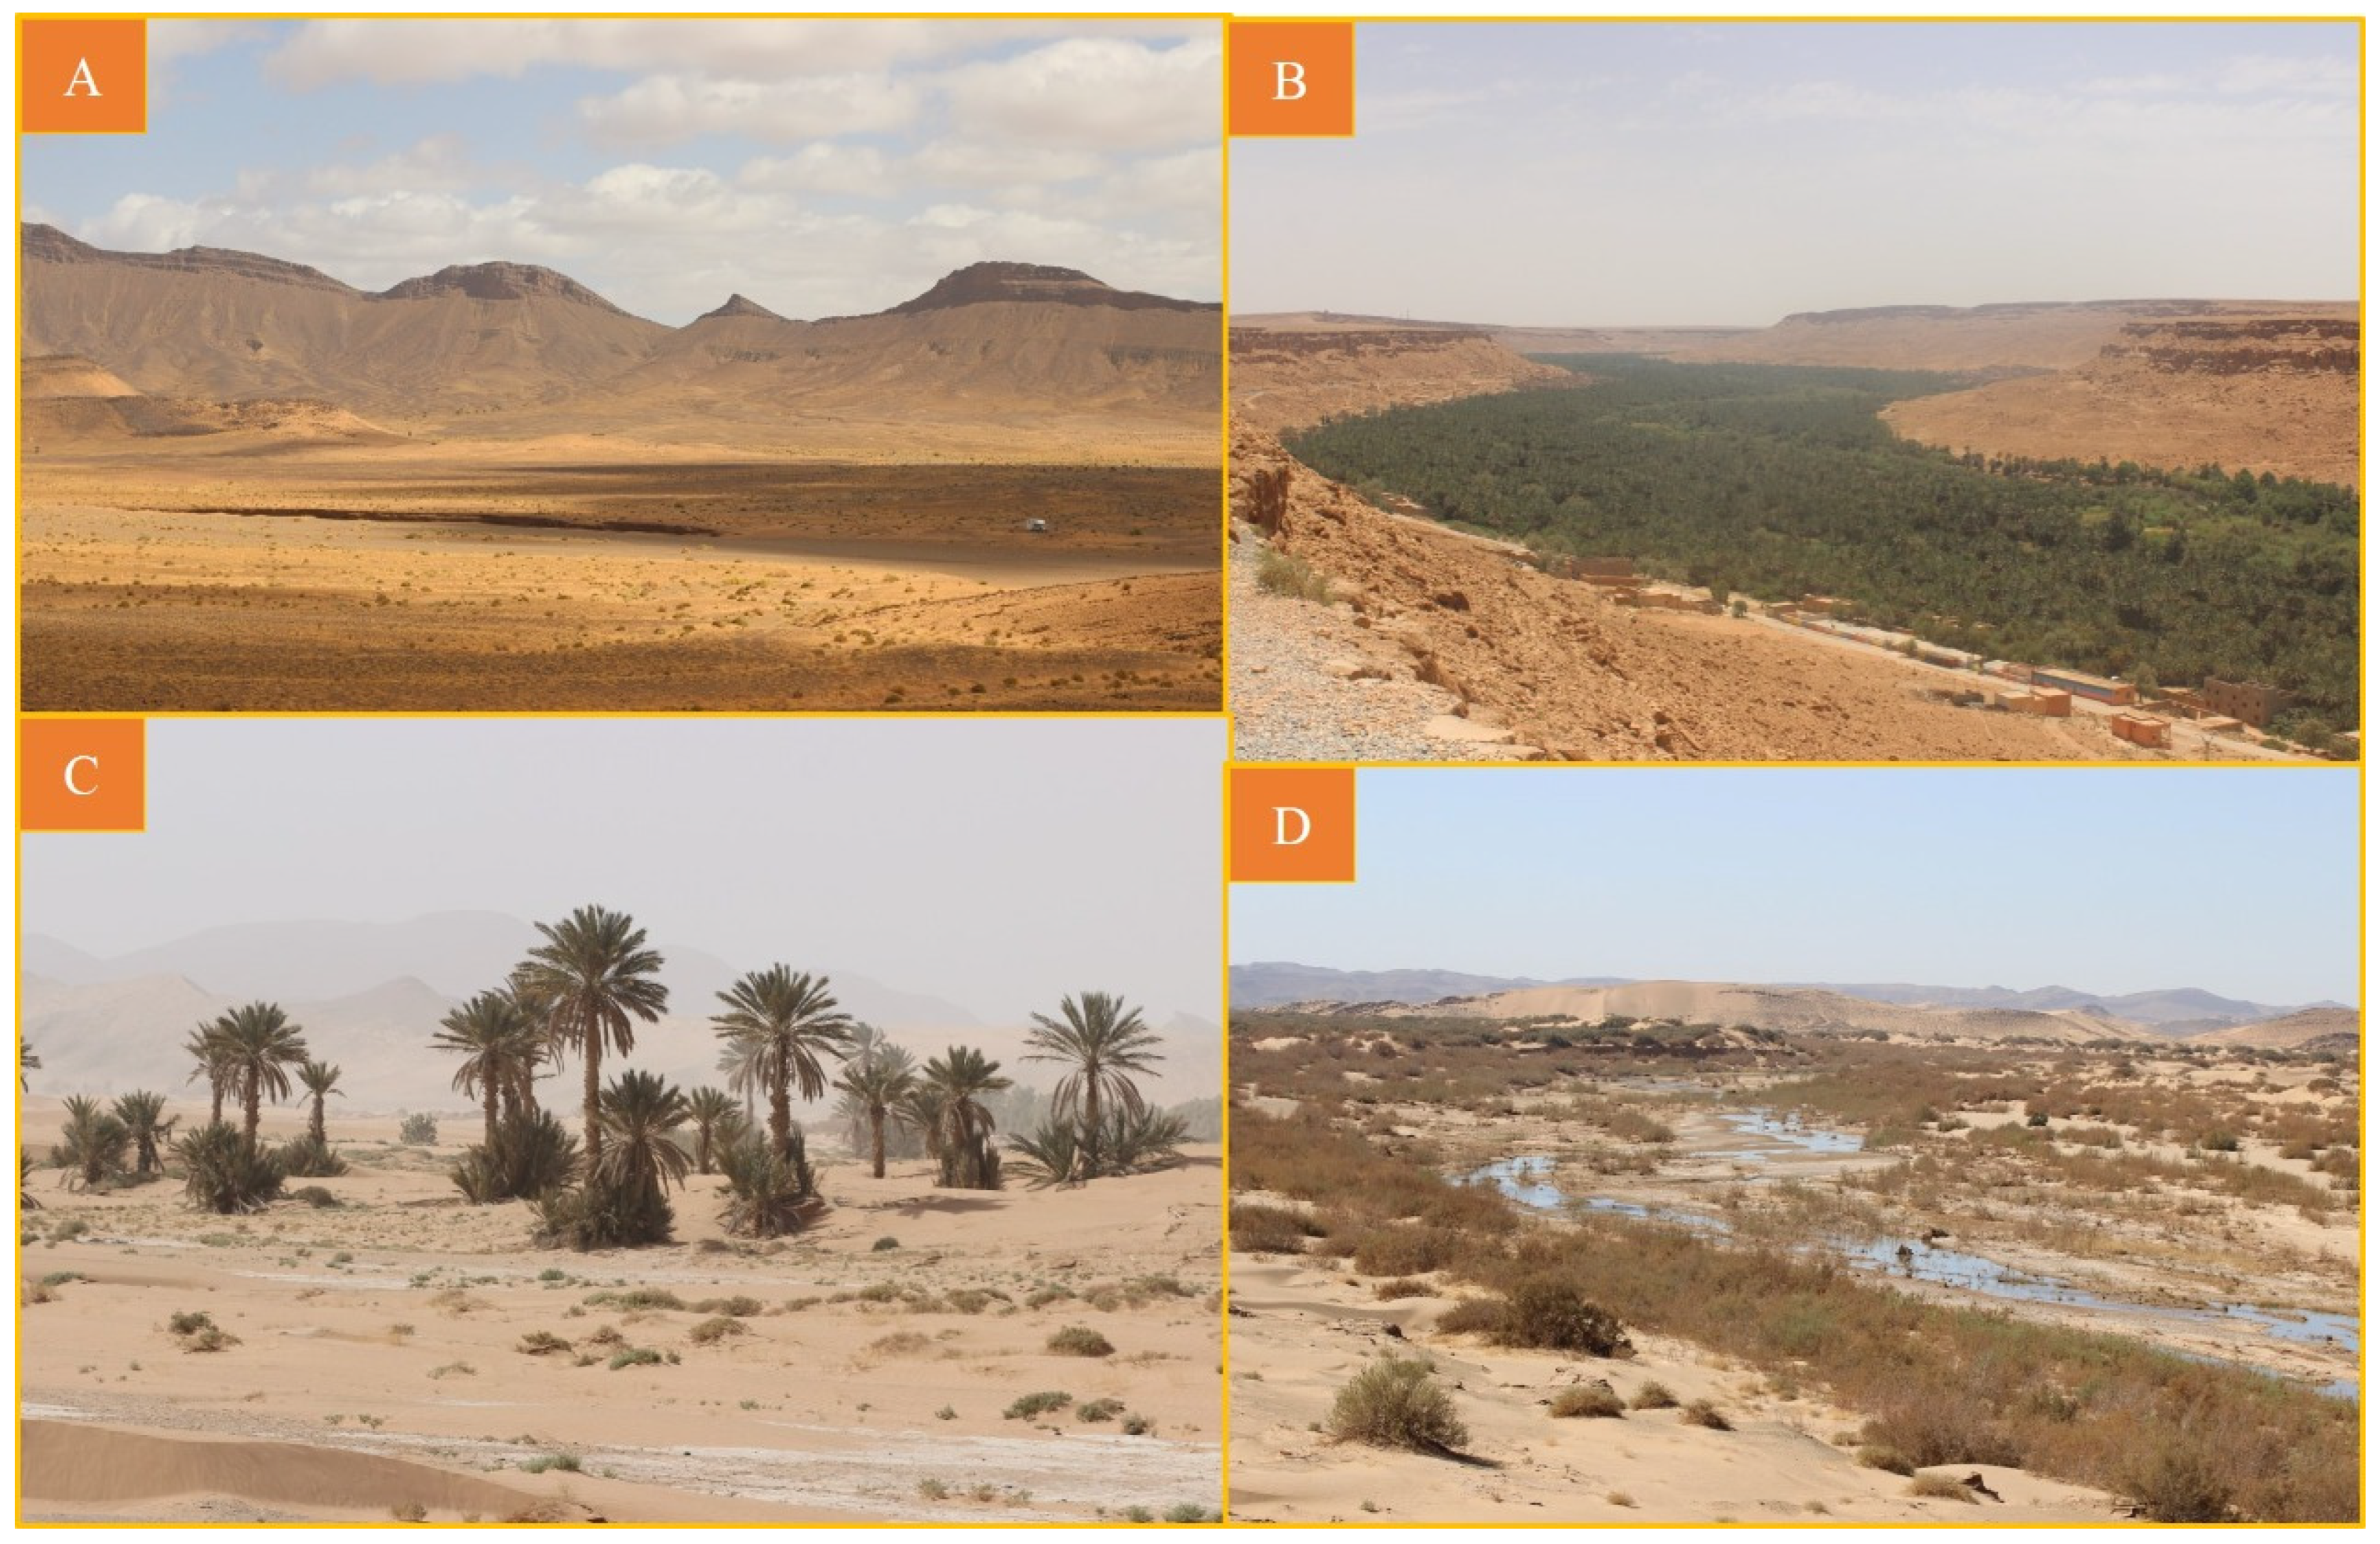
2.1. Study Area

The study was carried out in the province of Errachidia (southeastern Morocco). It extends over an area of 27,037 km 2 with a population of 418,451 inhabitants (2014) [18]. It is situated in the Draa-Tafilalet region between the Algerian border and the High Atlas Mountain, characterized by a significant climatic and geographic contrast from upstream to downstream. The topography is relatively sloping towards the southeastern area. Errachidia is crossed by several intermittent streams locally called Oueds including Oued Ziz that originate in the northern area of province and end up in the desert in southern area (Er-Rissani or Rissani oasis).
The climate is semiarid to arid with hot dry summers and cold winters, rare and irregular rainfall in space and time, with less than 80 mm of annual rainfall in upstream area. The temperatures are highly variable depending on regions and seasons and can reach less than 0 °C in winter and more than 45 °C in summer. In this area, oases are agrarian areas characterized by fragility and high vulnerability to sand encroachment induced by wind [19]. This may affect the presence and distribution of both animal and vegetation diversity, which influence the ES and then the local economy and human well-being.
The irrigated area is concentrated in the upstream area and along the oueds that cross the province. The main economic sector is agriculture localized, primarily in oasis agroecosystems. This economic activity is based along the oueds banks [20] and in the Tafilalet region that includes the lower valley of oued Ziz. In addition to agriculture, tourism is another significant economic activity [21]. Due to the cultural and historical diversity (historic crossroads between north and south), geographical and natural (forests, oases, sand dunes, mountains, and plains), the province of Errachidia is considered a paradise destination for tourists.
These two sectors are both dependent on groundwater and the releases of Hassan Eddakhil dam (HED) installed in the upstream area of the province. The valley crosses the most important ancient palm groves of the province starting from this dam crossing several oases until the downstream Er-Rissani oasis then flows in the desert (Figure 1). The current study focused on the system that includes HED, Errachidia, Erfoud (Arfoud), Er-Rissani (Rissani) cities, oases, and the desert. Errachidia city is a big and ancient urban area in the province, located 5 km downstream of the dam.
It should be noted that the bare land area refers to the areas outside the traditional oases without dominant vegetation while the desertified areas are the degraded cultivated areas (resulting from the degradation process). Cultivated land or irrigated farms includes areas with date palm cover and associated crops in lower layers such as vegetables, cereals, and alfalfa. However, the built-up areas are mostly outside or at the limit of the oasis ecosystem while water bodies very sensitive to evaporation are the smallest area due to the arid aspect of the climate. The majority of water is stored in the dams and realized periodically through farms irrigation.
According to the National Agency for Oases and Argan tree Zones Development (ANDZOA) of Morocco [22], the oases are characterized as follows:
  • Climatically, by low rainfall inputs that do not compensate the significant evaporation and frequent and drying winds with very high sunshine;
  • Hydrologically, the water balance is largely in deficit;
  • Socioeconomically, oases are intensively cultivated agro-ecosystems and are considered favorable settlements and stopover of desert forwarders throughout history.
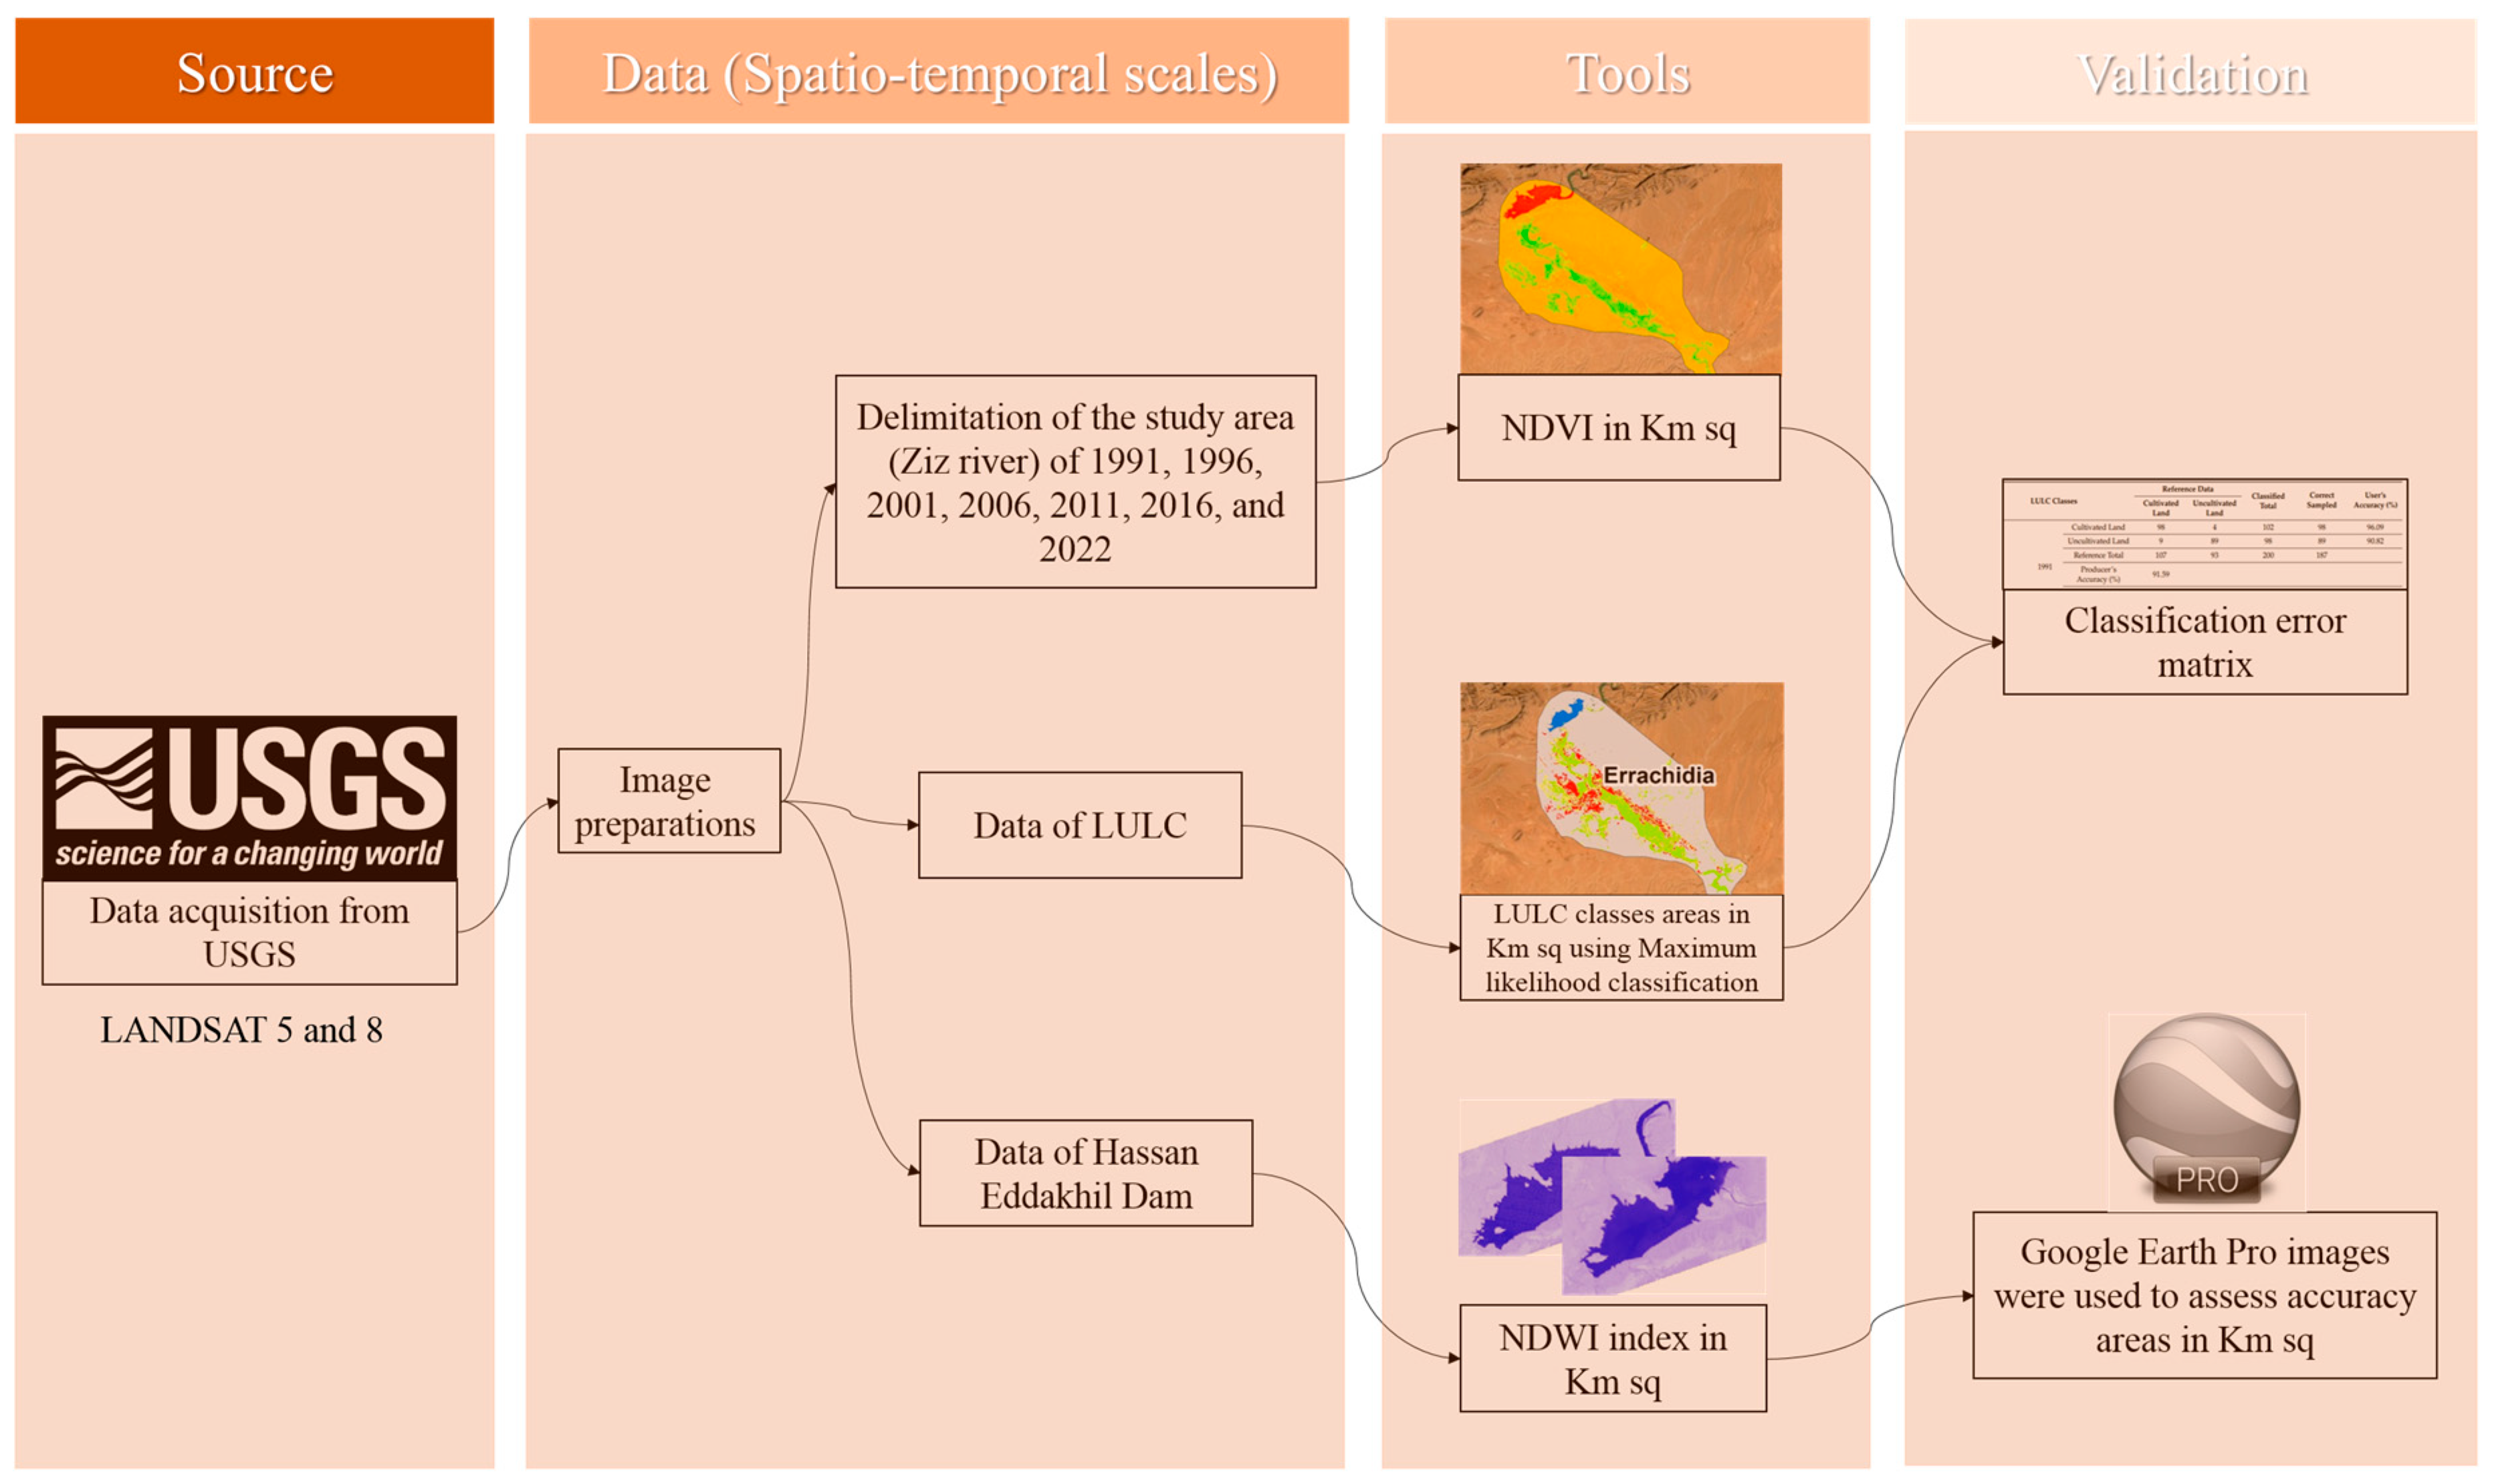
The study area belongs to the Ziz watershed, where the high part of this basin is wealthy in groundwater, and 60% of this zone has moderate to very high capacity for water storage [23]. In the lower part of the watershed, the climate is essentially semi-desertic with a high continental influence where the precipitations do not exceed 60 mm/year, and the temperature can reach 50 °C in summer (Rissani zone) [24]. Oued Ziz watershed is the important hydrological basin of the province that has its source in the High Atlas Mountains with an irregular flow [21]. It feeds the HED, the main source of water surface and groundwater of the province that supports the socioecological system of the oases (Figure 2).

2.2. Methodology

Geospatial techniques are frequently used in environmental and extreme events research. Remote sensing (RS) and Geographic Information System (GIS) are among the most important and trending tools used mainly to produce LULC maps. The evaluation of land cover change is among the principal applications of RS data [25]. Using these technologies, three steps were followed, a delimitation of the area and time series, second, an extraction and image preparation, and then a validation of data. The land use and land cover (LULC) change of agroecosystem associated with Oued Ziz was processed using Landsat 5 and 8 time series with 5-year intervals of the last 30 years by computing the maximum likelihood classification (MLC), the normalized difference vegetation index (NDVI), and the normalized difference water index (NDWI) (Figure 3).

2.2.1. Satellite Data Preparation

Satellite data were extracted from United States Geological Survey (USGS) Earth Explorer website (http://earthexplorer.usgs.gov/, accessed on April 2022, See Table 1). The LULC was explored using seven Landsat images (Landsat 5 with 7 bands using TM sensor and Landsat 8 with 11 bands using OLI sensor) of the time series 1991 (8 March), 1996 (18 February), 2001 (15 February), 2006 (13 February), 2011 (31 March), 2016 (28 March), and 2022 (29 March) (Table 1). The selected images were cloud-free with a 30 m resolution (Table 1). The image treatment was processed using ArcMap 10.5.

2.2.2. The Maximum Likelihood Classification (MCL)

MCL was used to detect accurately the changes in satellite imagery of LULC. This method is the most remarkable pixel-based classification algorithm [25] and is very easy to implement [26]. This algorithm was used to classify the images in case of desertification [27] and in the context of drought [26]. For the specification of the used Landsat satellite images for the dam there are the following two types of data: raster data (step 1), which used to produce the dam and LULC and NDVI maps and vector data (step 2), to compute the area. For the number, the main images processed were seven the table gives all the necessary information and the bands, there was an equivalent number of high-resolution images to carry out the accuracy assessment of seven, plus four sentinel images. For the MLC between 1991 and 2022, five LULC classes were used including water bodies, bare land, cultivated land, desertified land, and built-up. One single multispectral image was produced using multiple bands. To process the supervised MLC, field survey was conducted, and high-resolution Google Earth Pro images were used. Each group of pixels was included in a single polygon to differentiate the selected LULC classes [28]. Supervised image classification was carried out using the MCL algorithm and the produced images were categorized into the above-mentioned classes [9].

2.2.3. The Vegetation Index
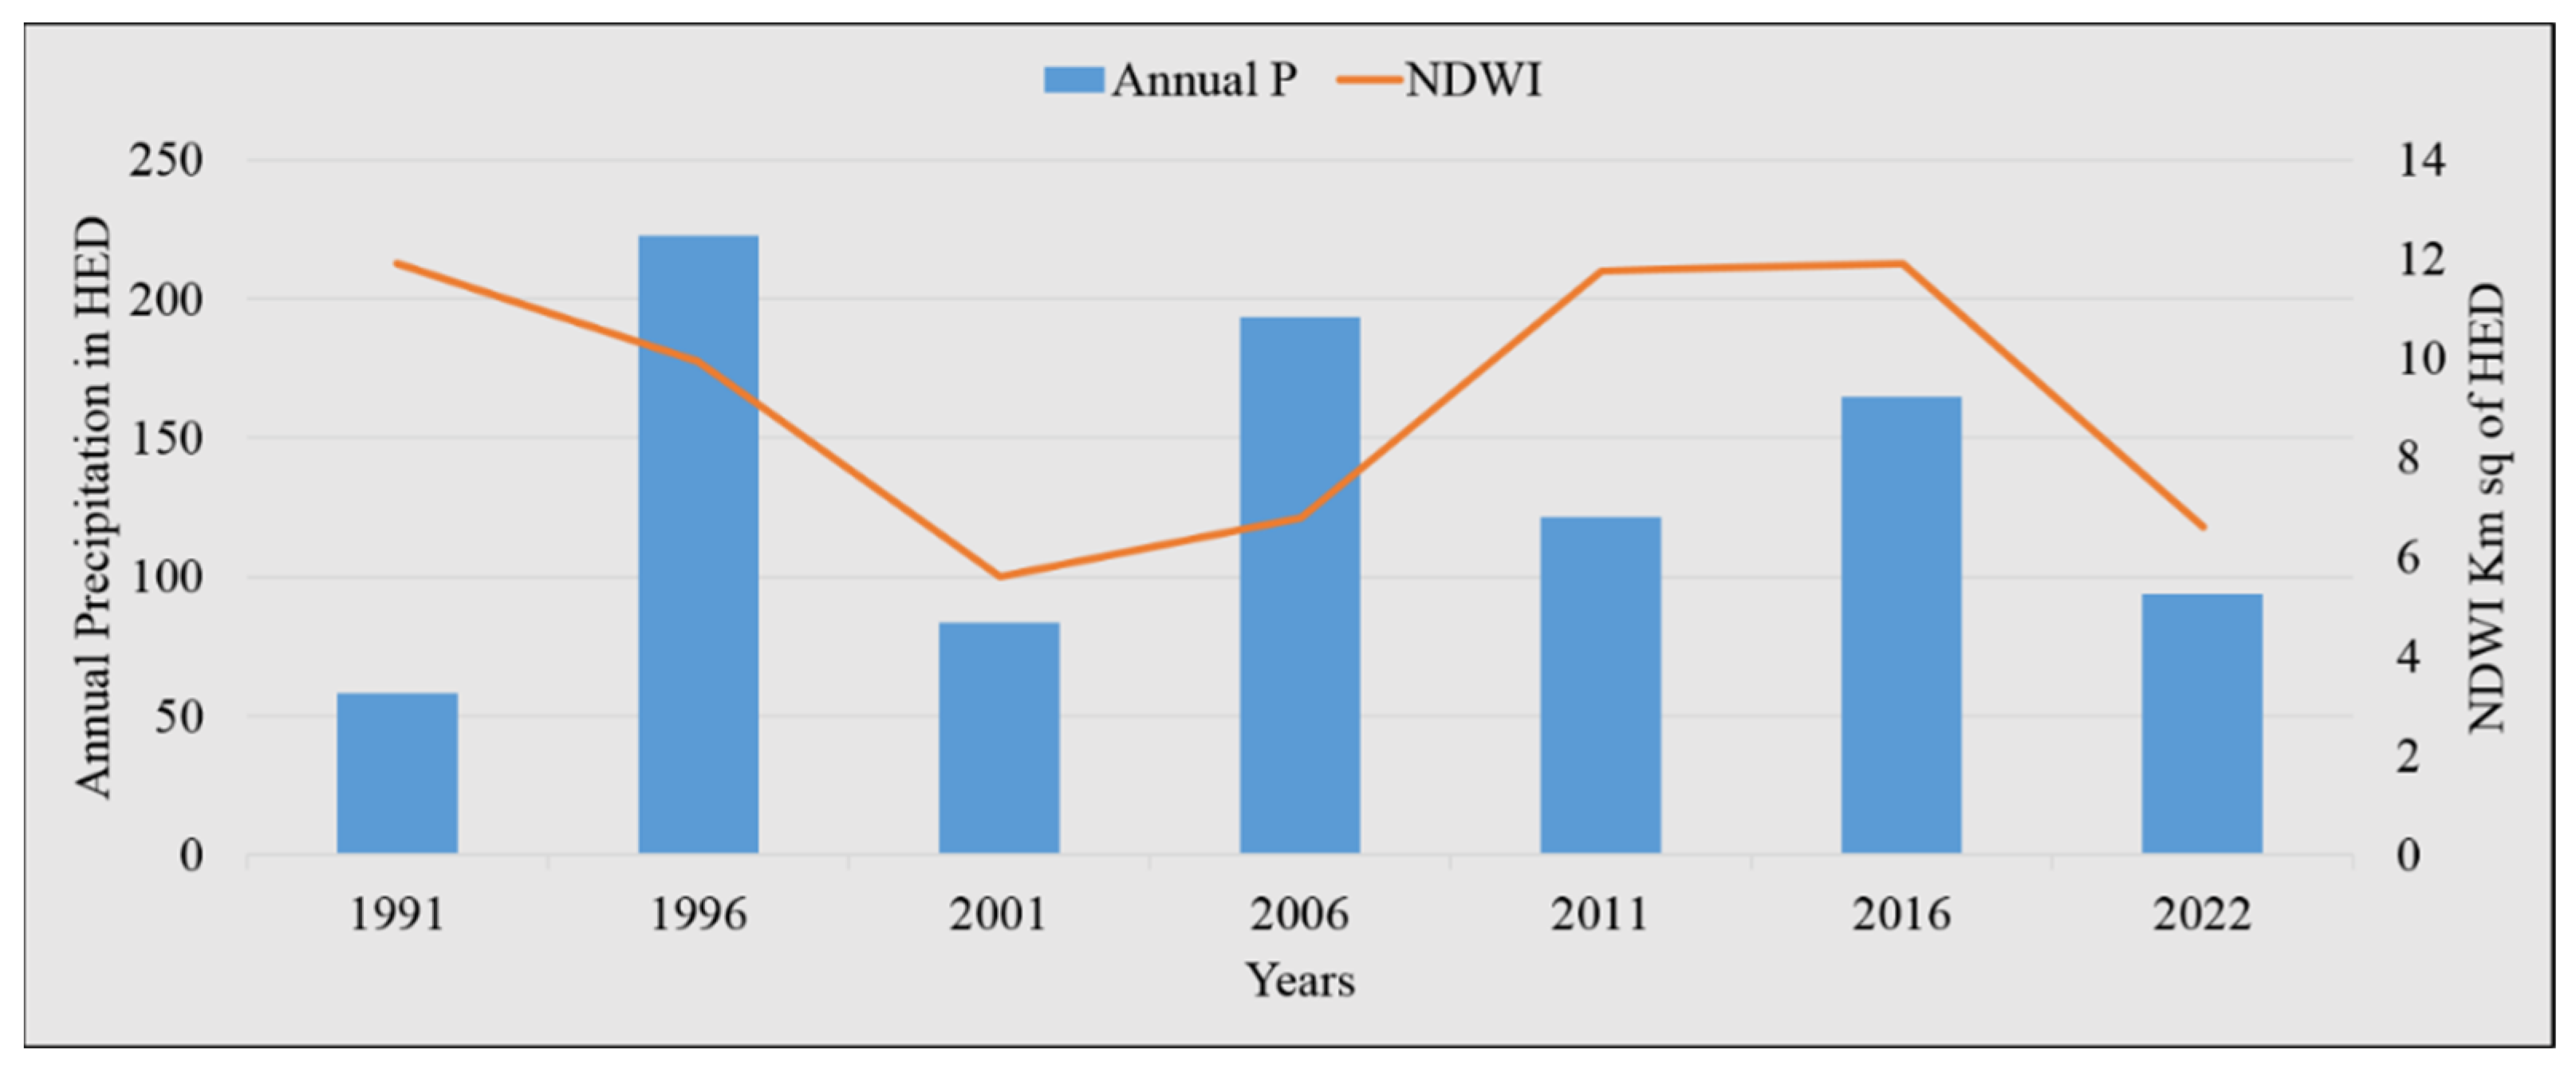
The NDVI was conceived to quantify vegetation by computing the difference between near-infrared (NIR) and red light [29]. This index was used in context of drought assessment [30], flood impact on agriculture [31], in fires safety management [32], and in context of desertification impact [9]. NDVI based on formula 1 was used to explore the change in the vegetation cover during the last thirty years.
NDVI = NIR RED NIR + RED
where NIR is the reflection in the near-infrared spectrum and RED is the reflection in the red range. The NDVI values oscillate on a scale from −1 to 1. The negative values are associated with water and clouds, the values near zero refer to bare land, and values near 1 are associated with dense vegetation. The following two main classes were considered: the cultivated and uncultivated areas. For more information about the bands, refer to the official website of USGS.gov.

2.2.4. Water Index

NDWI based on formula 2 was used to monitor the change in the water surface HED, the principal water resource during the last thirty years. This index was proposed by Gao [33] to detect the change in the vegetation liquid water, used also to manage water bodies and soil moisture [34]. Values near +1 indicate higher moister while lower values correspond to drier area and negative values (or 0) for terrestrial vegetation and soil.
NDWI = Green NIR Green + NIR
where the NDWI is produced based on green and near-infrared (NIR) bands.

2.2.5. Classification Accuracy

Accuracy assessment (AA) is considered a crucial condition to effectively use it in decision-making and in ecosystem management. The overall accuracy or the validation of the satellite images or the classified image compares how the pixels are classified versus the definite land cover on ground truth data [35]. Techniques to assess the accuracy of RS data were proposed by Stehman and Czaplewski [36], reviewed in Costa et al. [37] and applied in Moumane et al. [9]. Randomly, more than 200 ground control points were collected during 2022 by using a Garmin geographical positioning system (GPS) to validate the quality of produced maps, Google Earth images were also used to assess the accuracy by using the error matrix [9,38]. The kappa coefficient of agreement was introduced to the remote sensing community in the early 1980s as an index to express the accuracy of an image classification used to produce a thematic map [39,40].

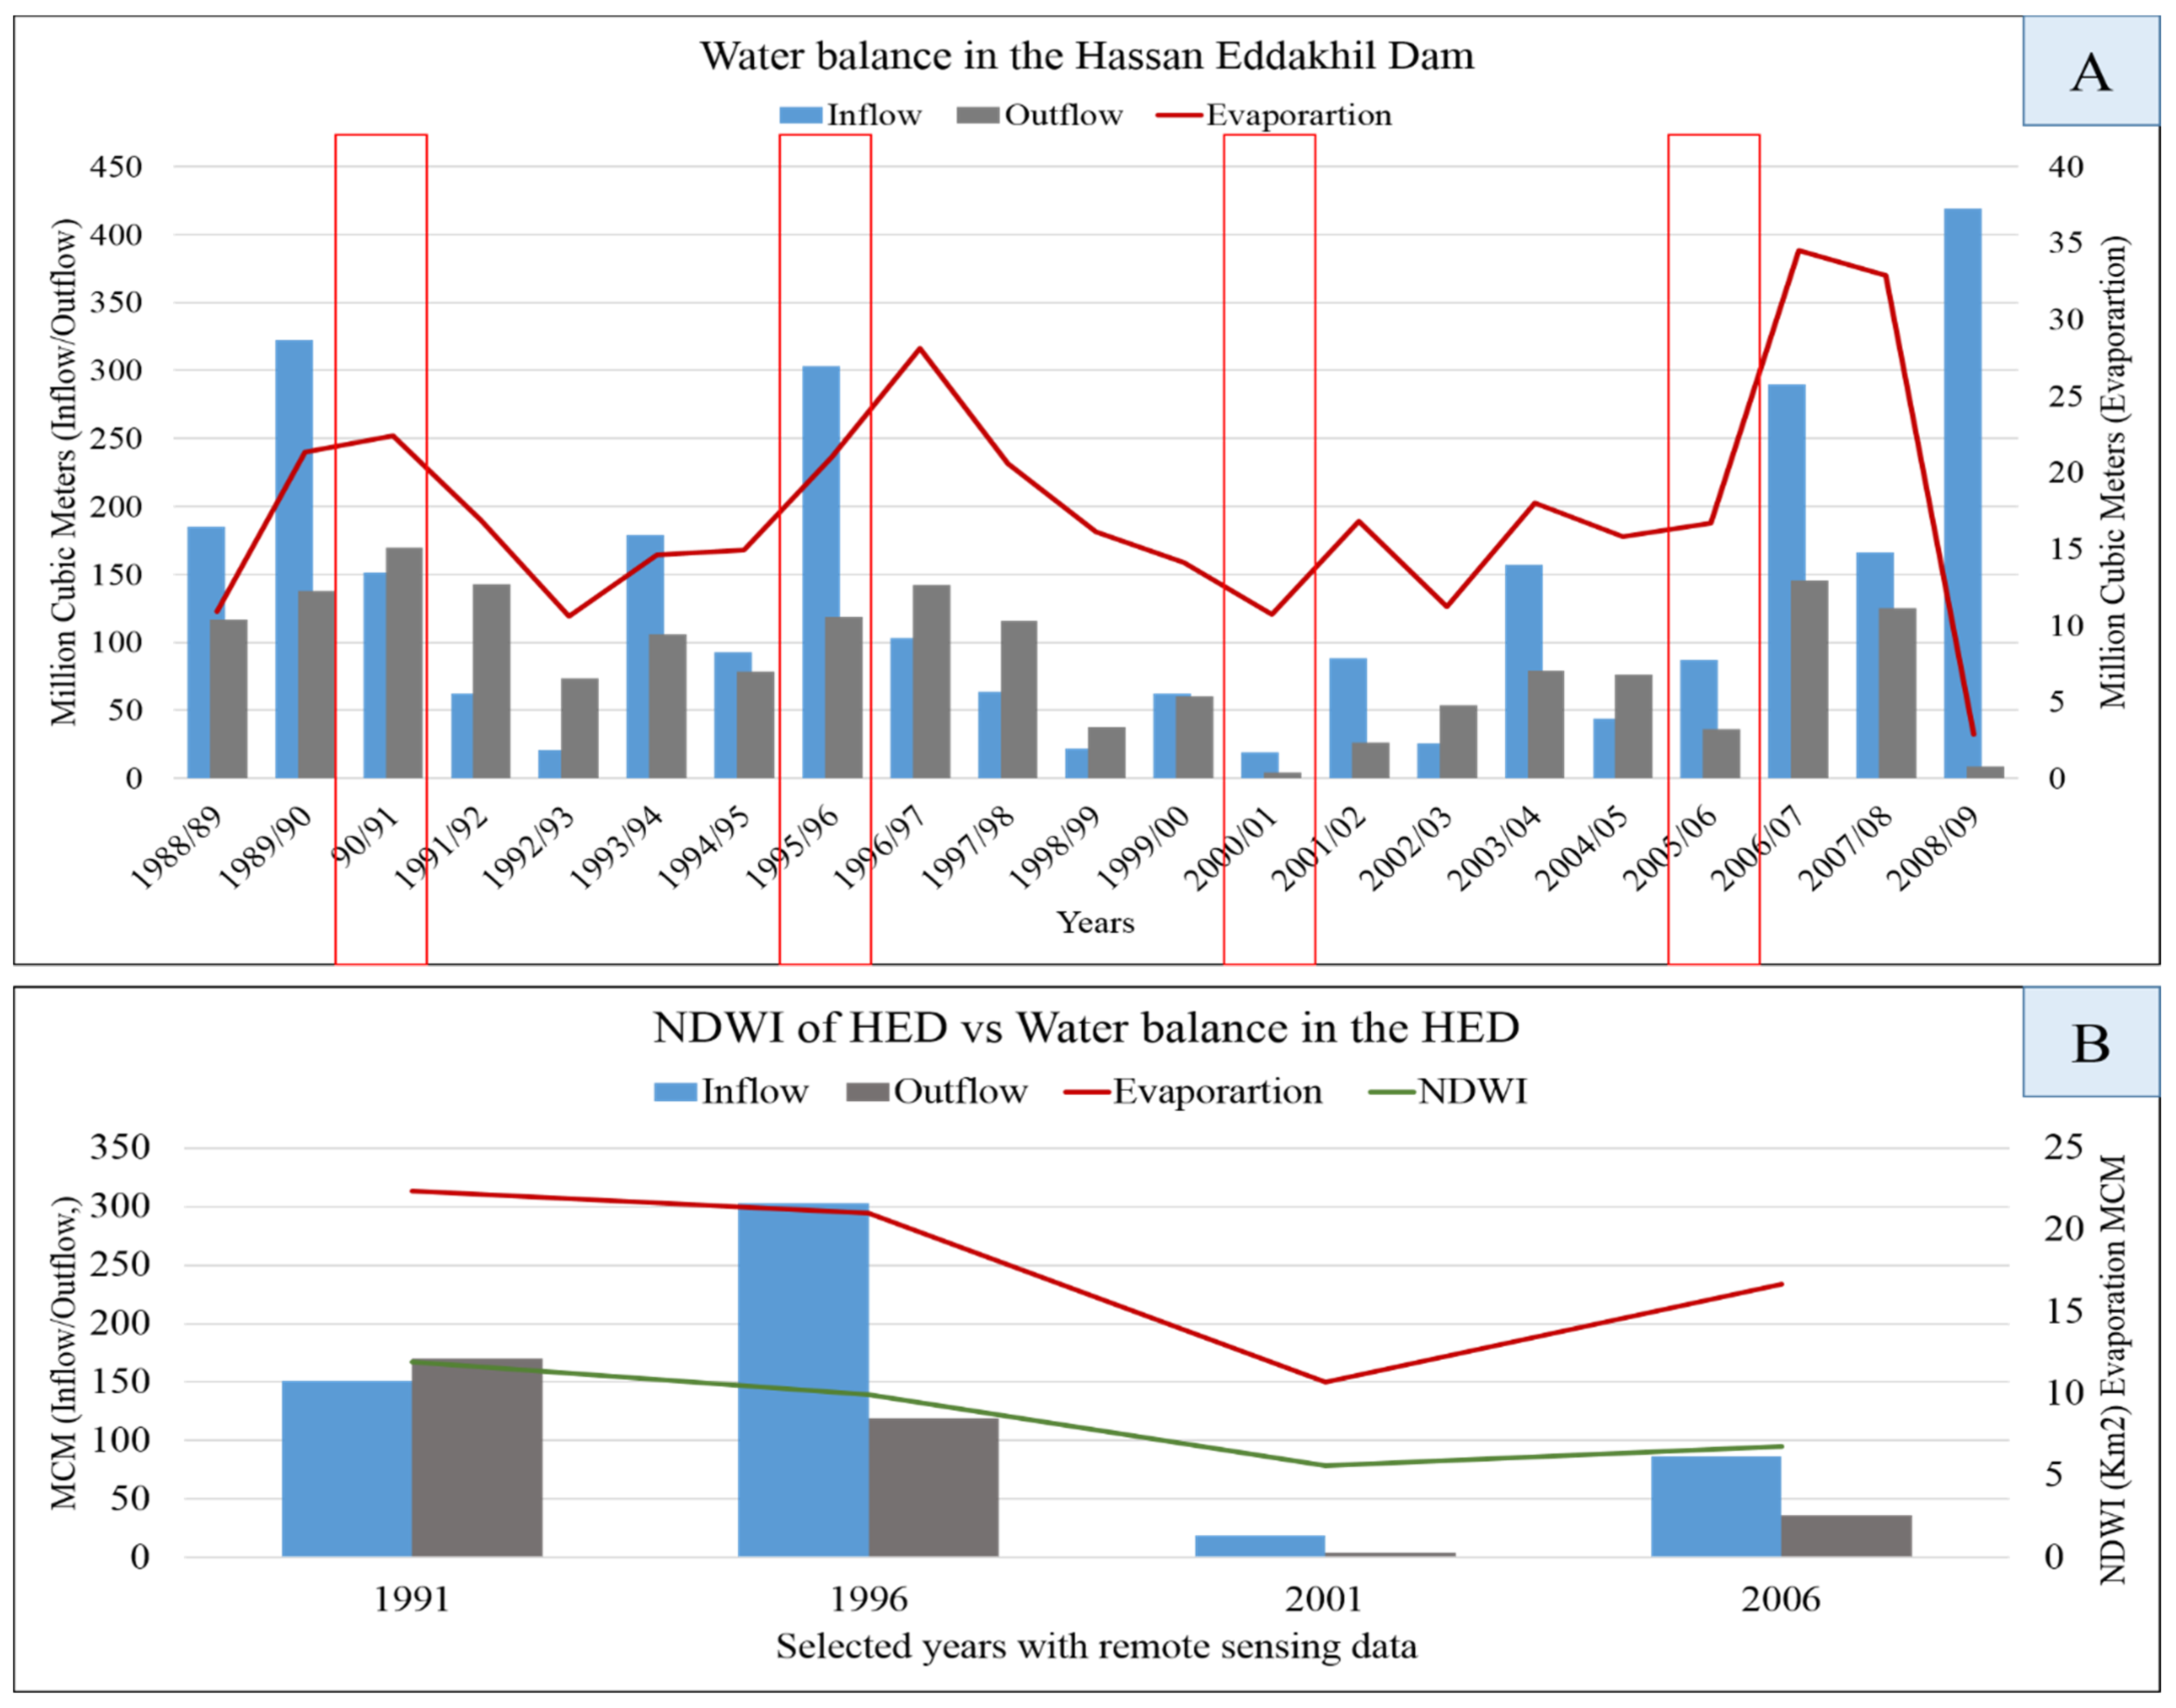
2.2.6. Associations between LULC and Surface Water in the Dam

The association of water surface of the HED in the upstream area and the cultivated area was conducted. Water surface (in km 2 ) of the dam was processed in the years 1991, 1996, 2001, 2006, 2011, 2016, and 2022 using NDWI. These maps were validated using Google Earth Pro and all accuracies are accepted (Validation of the HED areas in the same period using Google Earth images and surface estimation tool). However, the cultivated area in km 2 was estimated using MLC in the same years. The change of volume of water in the dam during the same period can be also used to validate the NDWI estimations.

2.2.7. Urban Area Change

The maximum likelihood classification was used to monitor the LULC including urban area between 1991 and 2022. All the accuracies are accepted for the urban area. It should be noted that the algorithm MLC has confusion in classifying bare and urban lands [26]. This limitation was also recorded by As-syakur et al. [41] reporting that due to the high degree of homogeneity, the bare land and urban areas (using spectral indices) have low accuracy. We have tried to use the normalized difference built-up index (NDBI) and normalized difference bareness index (NDBaI) [42,43] but they were unable to distinguish between built-up areas and bare and dry soil that surround it, this problem is common in remote sensing research in cities in dry climates [44]. To extract the built-up area, we have used the MLC-supervised image classification then we have adjusted the output image according to comparison with field data and high-resolution images from Google Earth Pro. For the field data, we recorded randomly and compared points in a direction downstream to upstream for different LULC classes.

2.2.8. Ancillary Data

For the precipitation data of the weather station 602,100 (GMFK) (Latitude: 31.93 | Longitude: −4.4 | Altitude: 1034) was provided by the Tutiempo Network, S.L. while the evaporation in the dam was provided by “L’Agence du Bassin Hydraulique du Guir-Ziz-Rhéris”. The hydrologic data of this dam including inflow and outflow were also gathered from this agency and correlated with the satellite data. For the dam images, we collected supply or release data to validate the dam data by remote sensing as well as the oasis data.

2.2.9. Geographic and Statistical Analyses

Geographic analysis was performed using ArcMap 10.5 and statistical correlation using the Pearson correlation coefficient (Formula (3)) to estimate the strength of a linear association between some climatic and hydrologic variables and land cover such as water bodies in HED, cultivated land, precipitation, desertified area, and urban area.
r = i x i x ¯ y i y ¯ i x i x ¯ 2 i y i y ¯ 2

3. Results

3.1. LULC Classes Using NDVI

In this section, LULC was categorized into the following two main classes: the cultivated and uncultivated, for the years 1991, 1996, 2001, 2006, 2011, 2016, and 2022 and processed (Figure 3 and Table 2). For example, the cultivated area represents 18% in 1991 against 6.5 in 2001 and 9% in 2022, while the uncultivated category, including urban, bare land, and water bodies areas, represents, respectively, 81%, 93%, and 91% (Table 2 and Figure 4). Generally, the findings depicted a decreasing trend in the cultivated area in this period. Comparing Google Earth images and using ground observations, the threshold for the cultivated land class was 0.20. To detect the change in cultivated lands, the images were reclassified into the following two main classes: cultivated area ≥ 0.20 and uncultivated land < 0.20 (bare land, built-up land, desertified land, and water bodies).

3.2. Accuracy Assessment for the Classified Images

Based on NDVI, error matrices for 1991, 2001, 2011, and 2022 were estimated and the accuracy assessment for NDVI-classified images indicated a high accuracy and met the criteria of 85% minimum overall [45] and 70% per-class accuracy [46] (Table 3). Overall accuracy = 93.5% (1991) with Kappa coefficient = 0.87, 85% (1996) with Kappa coefficient = 0.70, 91% (2001) with Kappa coefficient = 0.82, 88% (2011), and 91% (2022) with Kappa coefficient = 0.82 (Table 3). However, the maps produced based on MLC of the study area are also highly accurate, while the overall accuracy = 80.5% (1991) with Kappa coefficient = 0.72. For 2022, the overall accuracy = 85.5% (2022), and the Kappa coefficient = 0.78 (Table 4).

3.3. NDWI of Hassan Eddakhil Dam

NDWI was used to monitor the change in the water surface of the HED, and 1991, 1996, 2001, 2006, 2011, 2016, and 2022 are the time series used to correlate the water bodies and precipitation (Figure 5 and Figure 6). The outputs revealed that the water surface in the HED varied from 5.6   km 2 as the minimal value recorded in 2001 and 11.92 km 2 estimated in 1991 as the maximal water surface in the study area. Otherwise, the current year 2022, recorded the second most dried year with 6.6 km 2 in the selected time series (Figure 4). The correlation (using Pearson correlation coefficient) of these data with annual precipitation in this dam revealed a moderate positive correlation (the value of R is 0.7482). This indicates a tendency for high annual precipitation scores to go with high NDWI scores (and vice versa). The correlation is not total because an important amount of water comes from mountainous areas and tributaries.
For NDWI maps, only Google Earth Pro images were used to assess their accuracy for the following two years: 2016 and 2022 (See Figure 3). In this case, all accuracies are accepted, as shown in Table 5.

3.4. Maximum Likelihood Classification 1991 and 2022

For the MLC between 1991 and 2022, five LULC classes were used, including water bodies, bare land, cultivated land, desertified land, and built-up, for a total area of about 921 km 2 (Figure 7 and Figure 8).
Bare land/built-up area constitutes the majority of the total area in the investigated time series and ranges from 711.66 to 831.5 km 2 in the studied period. The cultivated class is the second most important class ranging from 63.94 to 175.33 km 2 as the maximal value. This category is followed by the desertified class, which varied from 19.98 to 58.49 km 2 . However, the water bodies class represents the smallest class that fluctuates from 6.22 to 14.85 km 2 . The water surface was observed in the upstream area in the HED that changes depending on the supply resulting from the precipitations and dam inflow. The years 1991 and 2011 recorded the highest quantity of water compared to 2001 and 2022, the drier years, with a trend toward drier conditions. The results showed an increasing trend in the desertified area in the period from 1991 to 2022 and a decreasing trend in the cultivated area. Desertification significantly increased (tripled) in the ten last years, which has passed from 20.62 km 2 in 2011 to 58.48   km 2 in 2022). Urban development is very important in Errachidia city near the HED.
Figure 9A showed the association between the water surface in km 2 using NDWI in the HED and the cultivated area using MLC. The correlation (using Pearson correlation coefficient) of water in HED and the cultivated area revealed a strong positive correlation (the value of R is 0. 8715), and the value of R2, the coefficient of determination is 0.7595, and the p-value is 0.010696 (The result is significant at p < 0.05). However, Figure 9B depicted the comparison between the surface of LULC classes in km 2 using maximum likelihood classification in 1991, 2001, 2011, and 2022 with bare land and built-up areas combined. The MLC method also shows a strong association between water in Oued Ziz (including the water stored in the HED) and the cultivated area, an increasing trend in the desertified area, and a slight increase in the bare land/urban class (Figure 9B). The MLC showed a significant decrease in water surface in the study area from 1991 to 2001, followed by an increase in 2011 and then a decrease recorded in 2022. The same fluctuation was recorded in the water surface of HED using NDWI (Figure 9C). These findings revealed that more than 80% of the water surface is stored in the HED (Figure 9C), which indicates the importance of this dam for the socio-economic development of the region. Otherwise, outputs were also represented in Figure 9D, which shows a comparison of the change in LULC classes between 1991 and 2022 in km 2 separating bare land from built-up area class. To extract the built-up area, we used the MLC-supervised image classification then we adjusted the output image according to comparison to high-resolution images from Google Earth Pro. Comparing 1991 and 2022, the change of the water stored in the HED and cultivated areas using MLC revealed a significant decrease of about 50% while the desertified area has tripled and the built-up area has quadrupled (Figure 9D).
The estimations of water surface in the HED were compared with observed data provided by the local governmental hydraulic basin agency (from the “Agence du Bassin Hydraulique du Guir-Ziz-Rhéris”). The observed data include hydraulic variables such as inflow/outflow in a million cubic meters (MCM) of the reservoir and the evaporation as a climatic, important variable due to its significant impact in an arid climate. Figure 10A shows the change in water in HED (inflow, outflow, and evaporation rate) in 21 years between 1989 and 2009 (available data). To highlight the association between variables inflow, outflow, and evaporation and NDWI data. The change in the outflow, evaporation, and water surface in the HED have the same change that decreased slightly from 1991 to 1996 and then continued decreasing a bit faster to 2001 (the drier year of the reservoir) (Figure 10B). However, from 2001 to 2006, the three variables increased simultaneously. The same observation for the inflow with a difference of change was recorded in 1996, which showed a significant increase in 1996 compared to the outflow.

4. Discussion

Morocco hosts a great diversity of natural environments, including the Mediterranean Sea, the Atlantic Ocean, the Atlas Mountains, and a large Saharan zone. The lowlands in the northern and western parts are relatively characterized by fertile soils, more developed compared to the Atlas Mountains, the south, and the southeastern area, including the study area (Oued Ziz), which are less developed. The local economy is very dependent on water resources, which exposed it to droughts that are a real threat to socio-economic development. The main productive LULC class of Oued Ziz is the oasis ecosystem.
The oasis ecosystem is a wetland located in arid and desert zones worldwide. It provides favorable conditions for human installation and management of agriculture in the desert area [47]. The oasis ecosystem has a rich cultural and civilizational background and is characterized by unique landscapes and biodiversity in the arid area [48]. More particularly, the traditional oases encompass a significant reservoir of cultural and genetic biodiversity [49]. Additionally, this biodiversity relieves the hot temperature and moisturizes the settlements installed in the surrounding areas. Zhou et al. [50] highlighted the importance of this climate softening function called the oasis cold island effect that makes the surface temperature lower in the oasis ecosystem compared to the surrounding desert areas, which extremely influences the lives of oasis residents.
With the impact of CC resulting in an increase in temperature and a decrease in annual precipitations, this millennial biome is experiencing many serious issues, whether in the North African region, the Middle East, or Asia. According to Peng et al. [51], in the desert–oasis ecotone in China, the fragility of the environment, the simplicity of species structure, and the significant habitat fragmentation induces desertification and severely influence the oasis’ ecological security. Otherwise, in the southeastern area of Morocco, the oasis’ ecosystem is suffering from degradation due to droughts, a high rate of evaporation, and a notable reduction in vegetation cover aggravated by anthropogenic impacts [52]. This state of degradation was also reported in the context of an increasing salinity trend in groundwater in the Tunisian oasis [6] and in an increase in soil salinity area and a degree in all land-use types in the desert–oasis ecotone. In a current study on the Tafilalet area, Rafik et al. [53] conducted a spatial–temporal analysis of soil salinity and demonstrated a highly variable and negative association with the standardized precipitation anomaly index. The arid nature of the climate of these areas is represented by temperatures (0–48 °C), irregular annual precipitations (50–150 mm), and hot-dry winds frequently violent (40–50 km/h) favor a very high average evaporation (3358 mm/year) [54]. Bouhlassa and Paré [55] reported that in the arid regions where the average annual rainfall is less than 80 mm, evapotranspiration is the most significant factor of water depletion, stating that a sustainable development of this resource requires a good command of the hydrological balance components.
To study these reported issues, we must take advantage of field knowledge and new technologies. In this context, Wang et al. [47] advanced that the sustainable development in an oasis must be based on scientific management. This management starts firstly from an understanding of the dynamic of change in these areas. Many studies in the oasis areas in Morocco have quantified the water, soil, and vegetation ES. El Ouali et al. [56] mapped the spatiotemporal quality of water in HED using Sentinel-2 data and field measurements while Moumane et al. [4] explored the LULC of Feija plan in Zagora province using Landsat 5 and 8. The RS constitutes relevant and updated tools to detect and monitor the change on land from space. Otherwise, our study focused on monitoring the advancement of desertification and the change of water surface, cultivated area, and urban area along Oued Ziz in the pre-Saharan region of Morocco. Using the MLC, the findings of the current study revealed a general degradation trend represented by an increase in desertified lands three times comparing 1991 and 2022. This trend also was recorded by Moumane et al. [9] in the Middle Draa Valley in the same pre-Saharan zone. The results showed an increasing trend in the desertified area in the period from 1991 to 2022 and a decreasing trend in the cultivated area. Desertification significantly increased (tripled) in the ten last years, which has passed from 20.6225 in 2011 to 58.4878 km 2 in 2022. This serious advancement of the desertified area was accompanied by a considerable reduction of cultivated areas in the study period, principally, in the Tafilalet plain. This can be explained by the less developed class of soil in this area due to the climatic factor, wind, water erosion, and lack of vegetation cover [53].
Since agriculture is dependent on water stored in HED in the upstream area and released periodically to feed the series of oases. After the flood of October 1965 that devastated the Ziz valley causing 25,000 people homeless, later, in 1970, the government constructed this dam with a capacity of 312.8 million m3 that receives the water of the Ziz River and its tributaries [6]. The water surface in the HED depends on the supply resulting from the precipitations and dam inflow. The years 1991 and 2011 recorded the highest quantity of water compared to 2001 and 2022, the drier years, with a general trend toward drier conditions. Landsat images from 1991 to 2021 depicted a strong association between water reserves in HED in the upstream area and the LULC changes. Another important output of this study was that the oases from the dam to Merzouga downstream recorded high rates of decline, and the desertified area has an increasing trend due to drought and overuse mainly of groundwater. In the oasis area of the Draa basin, the same region (Draa-Tafilalet), frequent droughts, overuse and salinity of groundwater, and demographic growth are the primary issues for groundwater management [57]. In the context of the Moroccan oases, CC, water management, land-use change, and release of domestic wastes are leading to irreversible transformations in the subsurface environment [58]. de Haas et al. [59] suggested the restoration and maintenance of the traditional infrastructure, such as dams, irrigation channels, and Khettaras that are badly managed due to the breakdown of Kabila or traditional institutions and the increasing conflicts between water users. Additionally, the increasing trend in droughts induced an increase in pumping stations, which causes the drying up of many Khettaras used previously to supply palm plantations.
Otherwise, to be able to manage efficiently water resources, the quantification of reservoir water balance is a primordial process estimating reservoir inflow and outflow [60]. For this end, data on inflow and outflow in the HED were compared to the evaporation and water surface using NDWI measurements. This indicated a general association between these variables, which can reflect the impact of climate parameters and water stored in the reservoir on the degradation in the downstream area. This declining trend of water was also reflected in the decrease in waterbodies in the entire studied area using MLC between 1991 and 2022. This negative trend was found also in a recent study on a provincial scale [61]. In contrast, this last method has demonstrated an increase in the urban area (built-up class), very remarkable in Errachidia city near the HED. The accuracy of this class is not questionable because of the high rate of error associated with the urban areas in arid and Saharan areas. Methodologically, as in the study of Erdem et al. [26] in the context of drought analysis of the Van Lake Basin in Turkey, the MLC algorithm was used for Landsat-5 and 8 images to produce LULC classes in the delimited area of the current study. In this last research effort, it was reported that in certain cases, the algorithm encounters difficulties in categorizing bare and urban land classes. To increase the accuracy of the outputs, multispectral imagery of 10 m resolution extracted from sentinel-2 can be classified using artificial intelligence techniques such as artificial neural network and support vector machine.
The study was carried out in the ancient palm grove along Oued Ziz, which suffers from increasing degradation due to desertification, water depletion, frequent fires, and Bayoud diseases. Sedra et al. 2015 [54] reported that for more than a century, Palme grove suffered from bayoud disease (caused by soil fungus Fusarium oxysporum f.sp. albedinis), and in recent years, about 1000 Moroccan oases have been affected reporting 60 foci in Aoufous in Ziz Valley. This disease caused the loss of more than 10 million palm trees [62]. In this context, several methods were proposed to support the oasis and fight against the bayoud [54], including the following:
  • The intervention of the National Institute of Agronomic Research to preserve the genetic material of national patrimony;
  • Selection of new varieties;
  • Distribution of over 1.5 million of in vitro plants since 1987 to reconstitute the oases.
The government also encouraged the extension of the palm groves, mainly outside the traditional oases area. In fact, the extension was performed primarily outside the study area, particularly in the Boudnib commune of Errachidia (Figure 11). These farms installed are modern and equipped with a drip irrigation system with large basins.
The majority of extensions (modern oasis) were concentrated on high-value varieties such as El Majhoul and Boufgous. This extension was initiated by a national program that aimed to plant one million date palms with an initial budget of MAD 1.25 billion [63]. However, the reduction of the traditional palm groves may influence the disappearance of a large number of ES provided by this millennial agroecosystem. Aware of this situation, through ANDZOA national agency, the government launched the project “Sustainable Oases Initiative (SOI)” during the COP22 held in Marrakech from 7 to 18 November 2016. This initiative of protection, safeguarding, and development of these ecosystems [48] has the aim to achieve the following:
  • Recognize the oases and their exceptional fragile nature;
  • Implement effective measures to conserve the oases heritage including livelihood and biodiversity;
  • Value the economic potentialities of these ecosystems.
According to the national report published on 15 February 2019 « Sixième rapport national sur l’état de la mise en œuvre de la convention sur la diversité biologique », the agriculture consumes more than 85% of water resources and the state developed a strategy to support project to equip approximately 550,000 hectares with drip systems in the medium term (available on http://www.environnement.gov.ma/fr/115-theme/biodiversite/3383-les-rapports-nationaux-sur-l-etat-de-la-mise-en-oeuvre-de-la-convention-sur-la-diversite-biologique, accessed on 4 January 2023). This report mentioned the project to plant 1,000,000 date palm in Tafilalet (our study area) generating 450,000 working days while increasing production to 53,000 tons, compared to 26,000 tons in 2010 (http://www.ormvatafilalet.ma, accessed on 4 January 2023).
The current study highlighted the environmental status of the oasis ecosystem in the pre-Sahara of Morocco and shed light on the importance of the combination of geospatial techniques such as RS, GIS, and Google Earth Pro high-resolution images, the field observations, and the accuracy techniques.
The output of this study constitutes a significant source of information that may be used to support further research and decision-makers to manage arid ecosystems and achieve Sustainable Development Goals.

Limitations of the Study

The main limitations of the current study are the validation of satellite data with observed data because of the lack of local data, mainly for the hydrologic and climatic variables. The reliability of the results depends on the quality of the collected data.

5. Conclusions

In the context of land degradation, the 2030 Agenda for Sustainable Development fixed related goals [64] such as the fight against global warming that was explicit in objective SDGs13 and the fight against deforestation and desertification, and biodiversity loss highlighted in objective SDGs 15 “Life on Land”, which also coincides with the Food and Agriculture Organization priorities. Sustainable management of ecosystems in arid regions has become a necessity since these lands are ecologically vulnerable and support a large population. The pressure on these fragile areas requires the development of adaptive capacities of populations and institutions to tackle CC and ecosystem degradation. Geospatial technologies are frequently used in environmental research to measure the change and monitor the ecosystems and land use. In this study, RS and GIS were used to produce LULC maps using classification methods. Currently, these techniques have significant improvements in quality and accuracy using field data, programs, and software, which made the application of these methods very frequent. The current article aimed to produce, classify, and assess the accuracy of LULC images in Oued Ziz oases, a vulnerable area experiencing several environmental and socio-economic issues. The images were classified into five classes including water bodies, bare land, cultivated land, desertified land, and built-up.
The overall accuracy of the MLC maps was estimated to be higher than 90%. The results showed a degradation trend represented by an increase in desertified lands, which tripled from 20.62% in 2011 to 58.49% in 2022.
This study also depicted a decreasing trend in the cultivated area in this period, from 174.2 km 2 in 1991 to 82.2   km 2 in 2022. Landsat images from 1991 to 2021 depicted a strong association between the water reserve in Hassan Eddakhil dam in the upstream area and the LULC changes.
In the study area, there is an increase in urbanization and population, but the area of agriculture is decreasing. In contrast, there is a trend of increasing the area of modern agriculture outside the zone, especially in the commune of Boudnib (as mentioned in the discussion section) but the productions are intended for the national and international markets. In fact, the changes in the model of agriculture in the newly cultivated areas use renewable energy coupled with water economic techniques. The problem lies in large newly cultivated areas, which is reflected in the increasing water demands and the frequent periods of droughts. This situation of shortage is logical in an arid zone where the oases are completely dependent on water resources that are constantly decreasing due to drought and increasing use in the newly cultivated areas. Despite this increase outside the study area, the city relies mainly on products from other regions that are much more productive in terms of essential goods.
The findings may offer a crucial source of information that may be used to support further research and decision-makers, which may support the efforts to achieve the sustainable development goals (SDGs) and strengthen the Moroccan Green Plan.

Author Contributions

Conceptualization, methodology, software, validation, formal analysis, investigation, A.K. and A.M. (Adil Moumane); resources, data curation, A.M. (Adil Moumane) and A.K.; writing—original draft preparation, A.K.; writing—review and editing, A.K. and A.M. (Adil Moumane); visualization, A.M. (Adil Moumane) and A.K.; supervision, project administration, funding acquisition, S.E.J., A.M. (Aziza Menouni), L.H., J.A.K. and M.Y. All authors have read and agreed to the published version of the manuscript.

Funding

This work was supported by the Institutional University Cooperation program with Moulay Ismail University, which is funded by the VLIR-UOS (Phase I: 2017–2021; Contract no MA2017IUC038A104).

Informed Consent Statement

We confirm that the study complies with all regulations and confirmation that informed consent was obtained.

Data Availability Statement

The data is included in the article.

Acknowledgments

Many thanks to the reviewers for their valuable review comments.

Conflicts of Interest

The authors declare no conflict of interest.

Abbreviations

CCClimate Change
HEDHassan Eddakhil Dam
GISGeographic Information System
LULCLand use and Land Cover
MLCMaximum Likelihood Classification
NDBINormalized Difference Built-up Index
NDVINormalized Difference Vegetation Index
NDWINormalized Difference Water Index
RSRemote Sensing
SDGsSustainable Development Goals

References

  1. El-Saied, A.B.; El-Ghamry, A.; Khafagi, O.M.A.; Powell, O.; Bedair, R. Floristic diversity and vegetation analysis of Siwa Oasis: An ancient agro-ecosystem in Egypt’s Western Desert. Ann. Agric. Sci. 2015, 60, 361–372. [Google Scholar] [CrossRef]
  2. Huang, F.; Ochoa, C.G. A copula incorporated cellular automata module for modeling the spatial distribution of oasis recovered by ecological water diversion: An application to the Qingtu Oasis in Shiyang River basin, China. J. Hydrol. 2022, 608, 127573. [Google Scholar] [CrossRef]
  3. Yin, X.; Feng, Q.; Li, Y.; Deo, R.C.; Liu, W.; Zhu, M.; Zheng, X.; Liu, R. An interplay of soil salinization and groundwater degradation threatening coexistence of oasis-desert ecosystems. Sci. Total Environ. 2022, 806, 150599. [Google Scholar] [CrossRef]
  4. Moumane, A.; El Ghazali, F.E.; Al Karkouri, J.; Delorme, J.; Batchi, M.; Chafiki, D.; Karmaoui, A. Monitoring spatiotemporal variation of groundwater level and salinity under land use change using integrated field measurements, GIS, geostatistical, and remote-sensing approach: Case study of the Feija aquifer, Middle Draa watershed, Moroccan Sahara. Environ. Monit. Assess. 2021, 193, 769. [Google Scholar] [CrossRef] [PubMed]
  5. Hamamouche, M.F.; Kuper, M.; Amichi, H.; Lejars, C.; Ghodbani, T. New reading of Saharan agricultural transformation: Continuities of ancient oases and their extensions (Algeria). World Dev. 2018, 107, 210–223. [Google Scholar] [CrossRef]
  6. Haj-Amor, Z.; Acharjee, T.K.; Dhaouadi, L.; Bouri, S. Impacts of climate change on irrigation water requirement of date palms under future salinity trend in coastal aquifer of Tunisian oasis. Agric. Water Manag. 2020, 228, 105843. [Google Scholar] [CrossRef]
  7. Patzelt, A. The Fog Oasis in Southern Arabia–A Fragile Desert Cloud Forest Ecosystem at the Brink of Extinction. Ref. Modul. Earth Syst. Environ. Sci. 2021, 303–317. [Google Scholar] [CrossRef]
  8. El-Sheikh, M.A.; Al-Oteiby, S.A.; Alfarhan, A.H.; Barcelo, D.; Picó, Y.; Alatar, A.A.; Javed, S.B.; Eid, E.M. Distribution of soil organic carbon in Wadi Al-Thulaima, Saudi Arabia: A hyper-arid habitat altered by wastewater reuse. Catena 2018, 170, 266–271. [Google Scholar] [CrossRef]
  9. Moumane, A.; Al Karkouri, J.; Benmansour, A.; El Ghazali, F.E.; Fico, J.; Karmaoui, A.; Batchi, M. Monitoring long-term land use, land cover change, and desertification in the Ternata oasis, Middle Draa Valley, Morocco. Remote Sens. Appl. Soc. Environ. 2022, 26, 100745. [Google Scholar] [CrossRef]
  10. Karmaoui, A.; El Jaafari, S.; Chaachouay, H.; Hajji, L. The socio-ecological system of the pre-Sahara zone of Morocco: A conceptual framework to analyse the impact of drought and desertification. GeoJournal 2021, 87, 4961–4974. [Google Scholar] [CrossRef]
  11. Karmaoui, A. Drought and desertification in Moroccan Pre-Sahara, Draa valleys: Exploring from the perspective of young people. Geoenviron. Disasters 2019, 6, 1–13. [Google Scholar] [CrossRef]
  12. Diekkrüger, B.; Busche, H.; Klose, A.; Klose, S.; Rademacher, C.; Schulz, O. Impact of global change on hydrology and soil degradation—scenario analysis for the semi-arid Drâa catchment (South Morocco). River Basins Chang. 2012, 21–26. Available online: https://www.researchgate.net/publication/316989058_Impact_of_Global_Change_on_hydrology_and_soil_degradation_-_Scenario_analysis_for_the_semi-arid_Draa_catchment_South_Morocco (accessed on 21 June 2022).
  13. Wang, F.; Lai, H.; Li, Y.; Feng, K.; Zhang, Z.; Tian, Q.; Zhu, X.; Yang, H. Identifying the status of groundwater drought from a GRACE mascon model perspective across China during 2003–2018. Agric. Water Manag. 2022, 260, 107251. [Google Scholar] [CrossRef]
  14. Karmaoui, A.; El Qorchi, F.; Hajji, L.; Zerouali, S. Eco-epidemiological aspects of Zoonotic cutaneous leishmaniasis in Ouarzazate Province, Morocco. J. Parasit. Dis. 2021, 45, 341–350. [Google Scholar] [CrossRef]
  15. Ougougdal, H.A.; Khebiza, M.Y.; Messouli, M.; Bounoua, L.; Karmaoui, A. Delineation of vulnerable areas to water erosion in a mountain region using SDR-InVEST model: A case study of the Ourika watershed, Morocco. Sci. Afr. 2020, 10, e00646. [Google Scholar] [CrossRef]
  16. Ben Salem, S.; Ben Salem, A.; Karmaoui, A.; Khebiza Yacoubi, M.; Messouli, M. Quantification and Evaluation of Water Erosion: Application of the Model SDR—InVEST in the Ziz Basin in South-East Morocco. In Decision Support Methods for Assessing Flood Risk and Vulnerability; IGI Global: Hershey, PA, USA, 2019. [Google Scholar] [CrossRef]
  17. Noorisameleh, Z.; Khaledi, S.; Shakiba, A.; Firouzabadi, P.Z.; Gough, W.A.; Mirza, M.M.Q. Comparative evaluation of impacts of climate change and droughts on river flow vulnerability in Iran. Water Sci. Eng. 2020, 13, 265–274. [Google Scholar] [CrossRef]
  18. HCP. Monographie de la province d’Errachidia. High Commission for Planning. Direction Regionale de Draa-Tafilalet. Roy. Du Maroc 2019, 101, 23. Available online: https://www.hcp.ma/draa-tafilalet/Monographie-de-la-province-d-Errachidia-de-l-annee-2019_a269.html (accessed on 21 June 2022).
  19. Puy, A.; Herzog, M.; Escriche, P.; Marouche, A.; Oubana, Y.; Bubenzer, O. Detection of sand encroachment patterns in desert oases. The case of Erg Chebbi (Morocco). Sci. Total Environ. 2018, 642, 241–249. [Google Scholar] [CrossRef]
  20. Karmaoui, A.; Balica, S. A new flood vulnerability index adapted for the pre-Saharan region. Int. J. River Basin Manag. 2021, 19, 93–107. [Google Scholar] [CrossRef]
  21. Bahaj, T.; Kacimi, I.; Hilali, M.; Kassou, N.; Mahboub, A. Preliminary study of the groundwater geochemistry in the sub-desert area in Morocco: Case of the Ziz-Ghris basins. Procedia Earth Planet. Sci. 2013, 7, 44–48. [Google Scholar] [CrossRef]
  22. National Agency for Oases and Argan Tree Zones Development (ANDZOA). Available online: http://andzoa.ma/fr/presentation/ (accessed on 6 June 2022).
  23. Nouayti, N.; Khattach, D.; Hilali, M. Potential areas mapping for the groundwater storage in the high Ziz basin (Morocco): Contribution of remote sensing and geographic information system Cartographie des zones potentielles pour le stockage des eaux souterraines dans le haut bassin du Ziz (Maroc): Apport de la télédétection et du système d’information géographique. Bull. De L’institut Sci. Sect. Sci. De La Terre 2017, 39, 13. [Google Scholar]
  24. Baki, S.; Hilali, M.; Kacimi, I.; Kassou, N.; Nouiyti, N.; Bahassi, A. Assessment of groundwater intrinsic vulnerability to pollution in the Pre-Saharan areas-the case of the Tafilalet Plain (Southeast Morocco). Procedia Earth Planet. Sci. 2017, 17, 590–593. [Google Scholar] [CrossRef]
  25. Otukei, J.R.; Blaschke, T. Land cover change assessment using decision trees, support vector machines and maximum likelihood classification algorithms. Int. J. Appl. Earth Obs. Geoinf. 2010, 12, S27–S31. [Google Scholar] [CrossRef]
  26. Erdem, F.; Atun, R.; Avdan, Z.Y.; Atila, I.; Avdan, U. Drought analysis of Van Lake Basin with remote sensing and GIS technologies. Egypt. J. Remote Sens. Space Sci. 2021, 24, 1093–1102. [Google Scholar] [CrossRef]
  27. Ajaj, Q.M.; Pradhan, B.; Noori, A.M.; Jebur, M.N. Spatial monitoring of desertification extent in western Iraq using Landsat images and GIS. Land Degrad. Dev. 2017, 28, 2418–2431. [Google Scholar] [CrossRef]
  28. Twisa, S.; Buchroithner, M.F. Land-use and land-cover (LULC) change detection in Wami River Basin, Tanzania. Land 2019, 8, 136. [Google Scholar] [CrossRef]
  29. Gupta, V.D.; Areendran, G.; Raj, K.; Ghosh, S.; Dutta, S.; Sahana, M. Assessing habitat suitability of leopards (Panthera pardus) in unprotected scrublands of Bera, Rajasthan, India. In Forest Resources Resilience and Conflicts; Elsevier: Amsterdam, The Netherlands, 2021; pp. 329–342. [Google Scholar] [CrossRef]
  30. Xie, F.; Fan, H. Deriving drought indices from MODIS vegetation indices (NDVI/EVI) and Land Surface Temperature (LST): Is data reconstruction necessary? Int. J. Appl. Earth Obs. Geoinf. 2021, 101, 102352. [Google Scholar] [CrossRef]
  31. Shrestha, R.; Di, L.; Yu, G.; Shao, Y.; Kang, L.; Zhang, B. Detection of flood and its impact on crops using NDVI-Corn case. In Proceedings of the 2013 Second International Conference on Agro-Geoinformatics (Agro-Geoinformatics) 2013, Fairfax, VA, USA, 12–16 August 2013; pp. 200–204. [Google Scholar]
  32. Reszka, P.; Fuentes, A. The great Valparaiso fire and fire safety management in Chile. Fire Technol. 2015, 51, 753–758. [Google Scholar] [CrossRef]
  33. Gao, B.C. Normalized difference water index for remote sensing of vegetation liquid water from space. In Imaging Spectrometry; SPIE: Bellingham, WA, USA, 1995; Volume 2480, pp. 225–236. [Google Scholar] [CrossRef]
  34. Alsaady, W.F.; Mohammed, R. Detecting of climatic drought by combination geo-information system and remote sensing in semi-arid zones: A case study. Mater. Today Proc. 2021. [Google Scholar] [CrossRef]
  35. Rwanga, S.S.; Ndambuki, J.M. Accuracy assessment of land use/land cover classification using remote sensing and GIS. Int. J. Geosci. 2017, 8, 611. [Google Scholar] [CrossRef]
  36. Stehman, S.V.; Czaplewski, R.L. Design and analysis of thematic map accuracy assessment: Fundamental principles. Remote Sens. Environ 1998, 64, 331–344. [Google Scholar] [CrossRef]
  37. Costa, H.; Foody, G.M.; Boyd, D.S. Supervised methods of image segmentation accuracy assessment in land cover mapping. Remote Sens. Environ. 2018, 205, 338–351. [Google Scholar] [CrossRef]
  38. Lillesand, T.M.; Kiefer, R.W.; Chipman, J.W. Remote Sensing and Image Interpretation, 7th ed.; John Wiley & Sons, Inc.: Hoboken, NJ, USA, 2015. [Google Scholar]
  39. Congalton, R.G.; Oderwald, R.G.; Mead, R.A. Assessing Landsat classification accuracy using discrete multivariate analysis statistical techniques. Photogramm. Eng. Remote Sens. 1983, 49, 1671–1678. [Google Scholar]
  40. Rosenfield, G.H.; Fitzpatrick-Lins, K. A coefficientof agreement as a measure of thematic classification accuracy. Photogramm. Eng. Remote Sens. 1986, 52, 223–227. [Google Scholar]
  41. As-Syakur, A.; Adnyana, I.; Arthana, I.W.; Nuarsa, I.W. Enhanced built-up and bareness index (EBBI) for mapping built-up and bare land in an urban area. Remote Sens. 2012, 4, 2957–2970. [Google Scholar] [CrossRef]
  42. Zha, Y.; Gao, J.; Ni, S. Use of normalized difference built-up index in automatically mapping urban areas from TM imagery. Int. J. Remote Sens. 2003, 24, 583–594. [Google Scholar] [CrossRef]
  43. Zhao, H.; Chen, X. Use of normalized difference bareness index in quickly mapping bare areas from TM/ETM+. In Proceedings of the International Geoscience and Remote Sensing Symposium, Seoul, Republic of Korea, 25–29 July 2005; Volume 3, p. 1666. [Google Scholar]
  44. Rasul, A.; Balzter, H.; Ibrahim, G.R.; Hameed, H.M.; Wheeler, J.; Adamu, B.; Ibrahim, S.A.; Najmaddin, P.M. Applying built-up and bare-soil indices from Landsat 8 to cities in dry climates. Land 2018, 7, 81. [Google Scholar] [CrossRef]
  45. Anderson, J.R.; Hardy, E.E.; Roach, J.T.; Witmer, R.E. A Land Use and Land Cover Classification System for Use with Remote Sensor Data; USGS Numbered Series No. 964; USGS: Reston, VA, USA, 1976; Volume 964. [CrossRef]
  46. Foody, G.M. Status of land cover classification accuracy assessment. Remote Sens. Environ. 2002, 80, 185–201. [Google Scholar] [CrossRef]
  47. Wang, T.; Wang, Z.; Guo, L.; Zhang, J.; Li, W.; He, H.; Zong, R.; Wang, D.; Jia, Z.; Wen, Y. Experiences and challenges of agricultural development in an artificial oasis: A review. Agric. Syst. 2021, 193, 103220. [Google Scholar] [CrossRef]
  48. ANDZOA. Sustainable Oases Initiative. National Agency for Oases and Argan tree Zones Development; 2016, 22p. Available online: http://andzoa.ma/wp-content/uploads/2017/04/English_10042017.pdf (accessed on 21 June 2022).
  49. Zemni, N.; Slama, F.; Bouksila, F.; Bouhlila, R. Simulating and monitoring water flow, salinity distribution and yield production under buried diffuser irrigation for date palm tree in Saharan Jemna oasis (North Africa). Agric. Ecosyst. Environ. 2022, 325, 107772. [Google Scholar] [CrossRef]
  50. Zhou, Y.; Liao, W.; Li, X. The contributions of individual factors to the oasis cold island effect intensity in the Heihe River Basin. Agric. For. Meteorol. 2022, 312, 108706. [Google Scholar] [CrossRef]
  51. Peng, M.; He, H.; Wang, Z.; Li, G.; Lv, X.; Pu, X.; Zhuang, L. Responses and comprehensive evaluation of growth characteristics of ephemeral plants in the desert–oasis ecotone to soil types. J. Environ. Manag. 2022, 316, 115288. [Google Scholar] [CrossRef] [PubMed]
  52. Karmaoui, A.; Minucci, G.; Messouli, M.; Khebiza, M.Y.; Ifaadassan, I.; Babqiqi, A. Climate Change Impacts on Water Supply System of the Middle Draa Valley in South Morocco. In Climate Change, Food Security and Natural Resource Management; Behnassi, M., Pollmann, O., Gupta, H., Eds.; Springer: Cham, Switzerland, 2019. [Google Scholar] [CrossRef]
  53. Rafik, A.; Ibouh, H.; El Alaoui El Fels, A.; Eddahby, L.; Mezzane, D.; Bousfoul, M.; Amazirh, A.; Ouhamdouch, S.; Bahir, M.; Gourfi, A.; et al. Soil Salinity Detection and Mapping in an Environment under Water Stress between 1984 and 2018 (Case of the Largest Oasis in Africa-Morocco). Remote Sens. 2022, 14, 1606. [Google Scholar] [CrossRef]
  54. Sedra, M.H. Date Palm Status and Perspective in Morocco. In Date Palm Genetic Resources and Utilization; Al-Khayri, J., Jain, S., Johnson, D., Eds.; Springer: Dordrecht, The Netherlands, 2015; pp. 257–323. [Google Scholar] [CrossRef]
  55. Bouhlassa, S.; Paré, S. Évapotranspiration de référence dans la région aride de Tafilalet au sud-est du Maroc. Afr. J. Environ. Assess. Manag. 2006, 11, 1–16. Available online: https://www.researchgate.net/publication/230735080 (accessed on 21 June 2022).
  56. El Ouali, A.; El Hafyani, M.; Roubil, A.; Lahrach, A.; Essahlaoui, A.; Hamid, F.E.; Muzirafuti, A.; Paraforos, D.S.; Lanza, S.; Randazzo, G. Modeling and Spatiotemporal Mapping of Water Quality through Remote Sensing Techniques: A Case Study of the Hassan Addakhil Dam. Appl. Sci. 2021, 11, 9297. [Google Scholar] [CrossRef]
  57. Hssaisoune, M.; Bouchaou, L.; Sifeddine, A.; Bouimetarhan, I.; Chehbouni, A. Moroccan groundwater resources and evolution with global climate changes. Geosciences 2020, 10, 81. [Google Scholar] [CrossRef]
  58. Messouli, M.; Ben Salem, A.; Ghallabi, B.; Yacoubi-Khebiza, M.; Ait Boughrous, A.; El Alami El Filali, A.; Rochdane, S.; Ezzahra Hammadi, F. Ecohydrology and groundwater resources management under global change: A pilot study in the pre-Saharan basins of southern Morocco. Options Méditerranéennes 2009, 88, 255–264. [Google Scholar]
  59. de Haas, H.; Bencherifa, A.; de Haan, L.; El Ghanjou, H.; El Harradji, A.; Moumni, Y.; Sghaier, M.; Solé-Benet, A. Migration, Agricultural Transformations and Natural Resource Exploitation in the Oases of Morocco and Tunisia; Final Scientific Report, IMARROM Project 2001, IC18-CT97–0134 (EC, DGXII, INCO-DC); University of Amsterdam: Amsterdam, The Netherlands, 2001. [Google Scholar]
  60. Song, J.H.; Her, Y.; Kang, M.S. Estimating Reservoir Inflow and Outflow From Water Level Observations Using Expert Knowledge: Dealing With an Ill-Posed Water Balance Equation in Reservoir Management. Water Resour. Res. 2022, 58, e2020WR028183. [Google Scholar] [CrossRef]
  61. Karmaoui, A.; Ben Salem, A.; El Jaafari, S.; Chaachouay, H.; Moumane, A.; Hajji, L. Exploring the land use and land cover change in the period 2005–2020 in the province of Errachidia, the pre-sahara of Morocco. Front. Earth Sci. 2022, 10. [Google Scholar] [CrossRef]
  62. Anjarne, M.; Bougerfaoui, M.; Abahmane, L. Micropropagation of date palm: A tool for development of Moroccan palm groves devestated by Bayoud disease. In Actes du Symposium International sur le Développement Durable des Systèmes Oasiens du 08 au 10 Mars 2005 Erfoud, Maroc-B; Boulanouar, Kradi, C., Eds.; Available online: https://www.inra.org.ma/sites/default/files/publications/ouvrages/oasis.pdf (accessed on 21 June 2022).
  63. MDMEMEE. 3e RAPPORT, Communication Nationale du Maroc à la Convention Cadre des Nations Unies sur les Changements Climatiques. Ministère Délégué auprès du Ministre de l’Energie, des Mines, de l’Eau et de l’Environnement Chargé de l’Environnement. ROYAUME DU MAROC. Avril 2016. Available online: https://unfccc.int/resource/docs/natc/marnc3.pdf (accessed on 21 June 2022).
  64. Assembly, G. Resolution Adopted by the General Assembly on 11 September 2015; A/RES/69/315 15 September 2015; United Nations: New York, NY, USA, 2015; Available online: https://www.un.org/en/development/desa/population/migration/generalassembly/docs/globalcompact/A_RES_70_1_E.pdf (accessed on 21 June 2022).
Figure 1. The study area shows the Ziz River (Oued Ziz) and the associated land use and land cover classes. On the left, some images were extracted using the Google Earth Pro online tool. These images show from top to bottom of the image HED, Errachidia, the big city, a central part of Oued Ziz, Erfourd and Er-Rissani cities in the downstream area extracted from Google Earth Pro.
Land 12 02127 g001
Figure 2. Comparison of HED status in 2016 and 2022 using Google Earth Pro (A) and manual drawing and treatment using GIS platform (B).
Land 12 02127 g002
Figure 3. General scheme of the methodology, image acquisition, classification, classes change, and accuracy using NDVI, NDWI, and MLC.
Land 12 02127 g003
Figure 4. NDVI of the study area of the years 1991 (A), 1996 (B), 2001 (C), 2006 (D), 2011 (E), 2016 (F), and 2022 (G). (H), Google Earth and LULC image for comparison purposes.
Land 12 02127 g004
Figure 5. Water surface of HED in km2 using NDWI and the annual precipitations in mm in HED.
Land 12 02127 g005
Figure 6. Water surface change in the Hassan Eddakhil dam in km2 using NDWI. 1991 (A), 1996 (B), 2001 (C), 2006 (D), 2011 (E), 2016 (F), and 2022 (G). (H), Google Earth image for comparison purposes with bounding hand drawn (see also Figure 2).
Land 12 02127 g006
Figure 7. Photos of different land uses and land covers of the study area; (A), bare land (southern limit); (B), cultivated land on the banks of Oued Ziz (Aoufous oasis); (C), desertified land near Er-Rissani oasis; (D), Oued Ziz flows into the desert in the southern limit of the study area.
Land 12 02127 g007
Figure 8. Maximum likelihood classification between 1991 and 2022 including urban area (built-up class).
Land 12 02127 g008
Figure 9. LULC changes in the studied area and period using NDVI, NDWI, and MLC. (A), association of the water surface of the Hassan Eddakhil dam in the upstream area (using NDWI in HED) and the cultivated area along Oued Ziz (using MLC); (B), The change in LULC using maximum likelihood classification in 1991, 2001, 2011, and 2022 with bare land and built-up areas combined; (C), water surface in the study area, a comparison between water surface in the entire Oued Ziz area using MLC and water surface in HED using NDWI; (D), The change in LULC using maximum likelihood classification between the year of departure (1991) and 2022 with bare land and built-up areas separated.
Land 12 02127 g009
Figure 10. Water surface changes in HED. (A), Inflow, outflow, and evaporation rate in the dam of 21 years between 1989 and 2009 (available data) using observed data (from the L’Agence du Bassin Hydraulique du Guir-Ziz-Rhéris); (B), the association between inflow, outflow, and evaporation and NDWI data.
Land 12 02127 g010
Figure 11. The extension of the palm groves mainly outside the traditional oases area Boudnib commune of Errachidia. (A), First example of a big farm extended over 463 hectares; (B), second example of farm extending over 100 hectares; (C), a general view showing new established farms.
Land 12 02127 g011
Table 1. Landsat image characteristics including Landsat image category, acquisition date, sensor, number of bands, spatial resolution, path/raw, and the reference.
SatelliteAcquisition DateSensorNumber of BandsSpatial ResolutionPath/RawDoi
(m)
LANDSAT 58 March 1991TM730200/038https://doi.org/10.5066/P918ROHC, accessed on 7 April 2022
LANDSAT 518 Feruary 1996TM730200/038https://doi.org/10.5066/P918ROHC, accessed on 15 April 2022
LANDSAT 515 Feruary 2001TM730200/038https://doi.org/10.5066/P918ROHC, accessed on 15 April 2022
LANDSAT 513 Feruary 2006TM730200/038https://doi.org/10.5066/P918ROHC, accessed on 15 April 2022
LANDSAT 531 March 2011TM730200/038https://doi.org/10.5066/P918ROHC, accessed on 7 April 2022
LANDSAT 828 March 2016OLI1130200/038https://doi.org/10.5066/P9OGBGM6, accessed on 15 April 2022
LANDSAT 829 March 2022OLI1130200/038https://doi.org/10.5066/P9OGBGM6, accessed on 14 April 2022
Table 2. Cultivated, uncultivated, and total areas in km2 during the period 1991–2022 using NDVI.
1991199620012006201120162022
Cultivated174.26145.8659.9456.12135.91158.1182.26
Uncultivated747.63776.0861.96865.78785.98763.67839.62
Total921.89921.87921.91921.90921.9921.78921.88
Table 3. Error matrices for 1991, 2001, 2011, and 2022 classified images based on NDVI of the study area.
LULC ClassesReference DataClassified TotalCorrect SampledUser’s Accuracy (%)
Cultivated LandUncultivated Land
Classified data1991Cultivated Land9841029896.09
Uncultivated Land989988990.82
Reference Total10793200187
Producer’s Accuracy (%)91.59
Overall Accuracy = 93.5
Kappa = 0.87
2001Cultivated Land905959094.74
Uncultivated Land13921059287.62
Reference Total10397200182
Producer’s Accuracy (%)87.3894.86
Overall Accuracy = 91
Kappa = 0.82
2011Cultivated Land953989596.94
Uncultivated Land21811028179.41
Reference Total11684200176
Producer’s Accuracy (%)81.996.43
Overall Accuracy = 88
Kappa = 0.76
2022Cultivated Land881898898.88
Uncultivated Land17941119484.69
Reference Total10595200182
Producer’s Accuracy (%)83.8198.95
Overall Accuracy = 91
Kappa = 0.82
Table 4. Error matrices for 1991 and 2022 classified images based on maximum likelihood classification of the study area.
LULC ClassesReference DataClassified TotalCorrect SampledUser’s Accuracy (%)
Cultivated LandDesertified LandBare LandWaterBuilt Up
Classified data1991Cultivated Area344000383489.47
Desertified Land0181301321856.25
Bare Land0127600887686.36
Water0001001010100
Built-Up009023322371.87
Reference Total3434981024200161
Producer’s Accuracy (%)10052.9477.5510095.83
Overall Accuracy = 80.5
Kappa Coefficient = 0.72
2022Cultivated Area9870001059893.33
Desertified Land027702362775
Bare Land093000393076.92
Water0006066100
Built-Up004010141071.43
Reference Total984341612200171
Producer’s Accuracy 10062.7973.1710083.33
Overall Accuracy = 85.5
Kappa Coefficient = 0.78
Table 5. NDWI maps accuracy using Google Earth Pro images (see also Figure 2).
Years with Available Google Earth (GE) ImagesGoogle Earth (GE) Approximation in k m 2 NDWI Estimations in k m 2 NDWI/GE
(%)
20161311.9191
20227.26.59994
Disclaimer/Publisher’s Note: The statements, opinions and data contained in all publications are solely those of the individual author(s) and contributor(s) and not of MDPI and/or the editor(s). MDPI and/or the editor(s) disclaim responsibility for any injury to people or property resulting from any ideas, methods, instructions or products referred to in the content.

