
Effect of Land-Use Change on Runoff in Hyrcania


Abstract
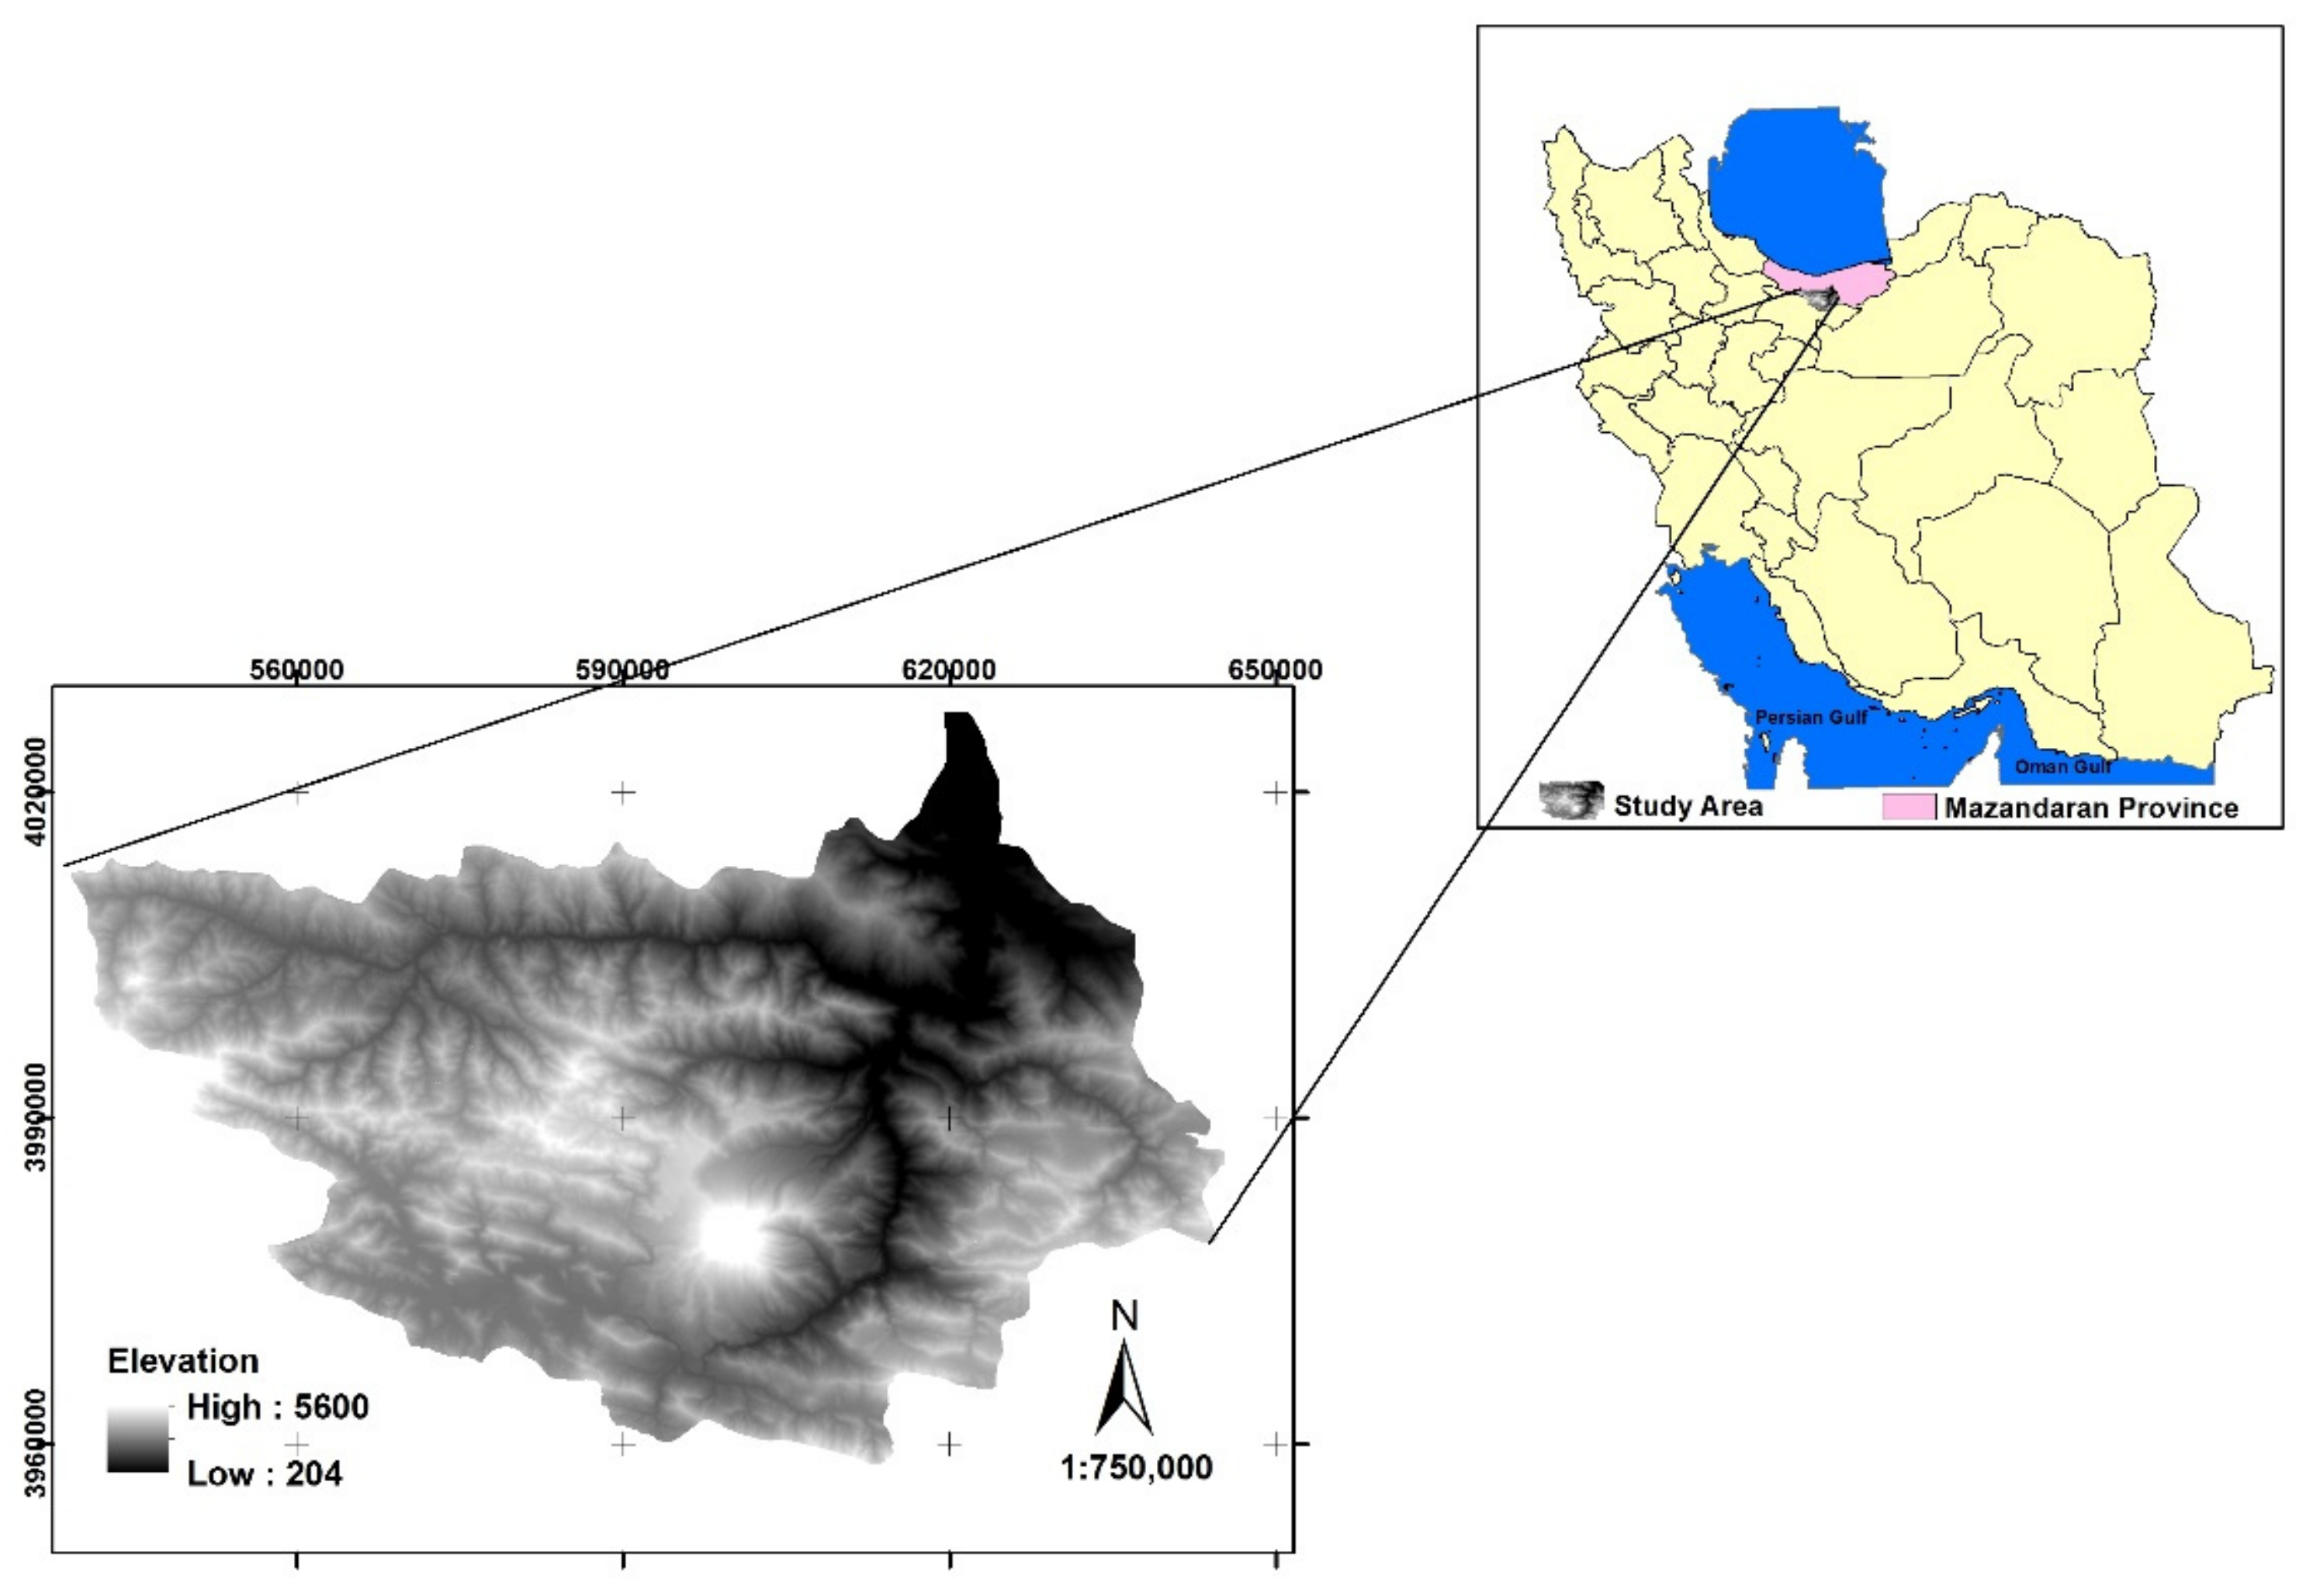
:1. Introduction
2. Materials and Methods
2.1. Steps of the Analysis
2.2. Land-Use Classification
2.3. Hydrological Classification
2.4. Calculation of Runoff Potential
2.5. Estimation of Runoff
- 5 mm (<10 mm): 66 times/year
- 15 mm: 10 times/year
- 25 mm: 2 times/year
- 35 mm: 1 times/year
- 45 mm: 1 times/year
- 55 mm: 1 times/year
3. Results
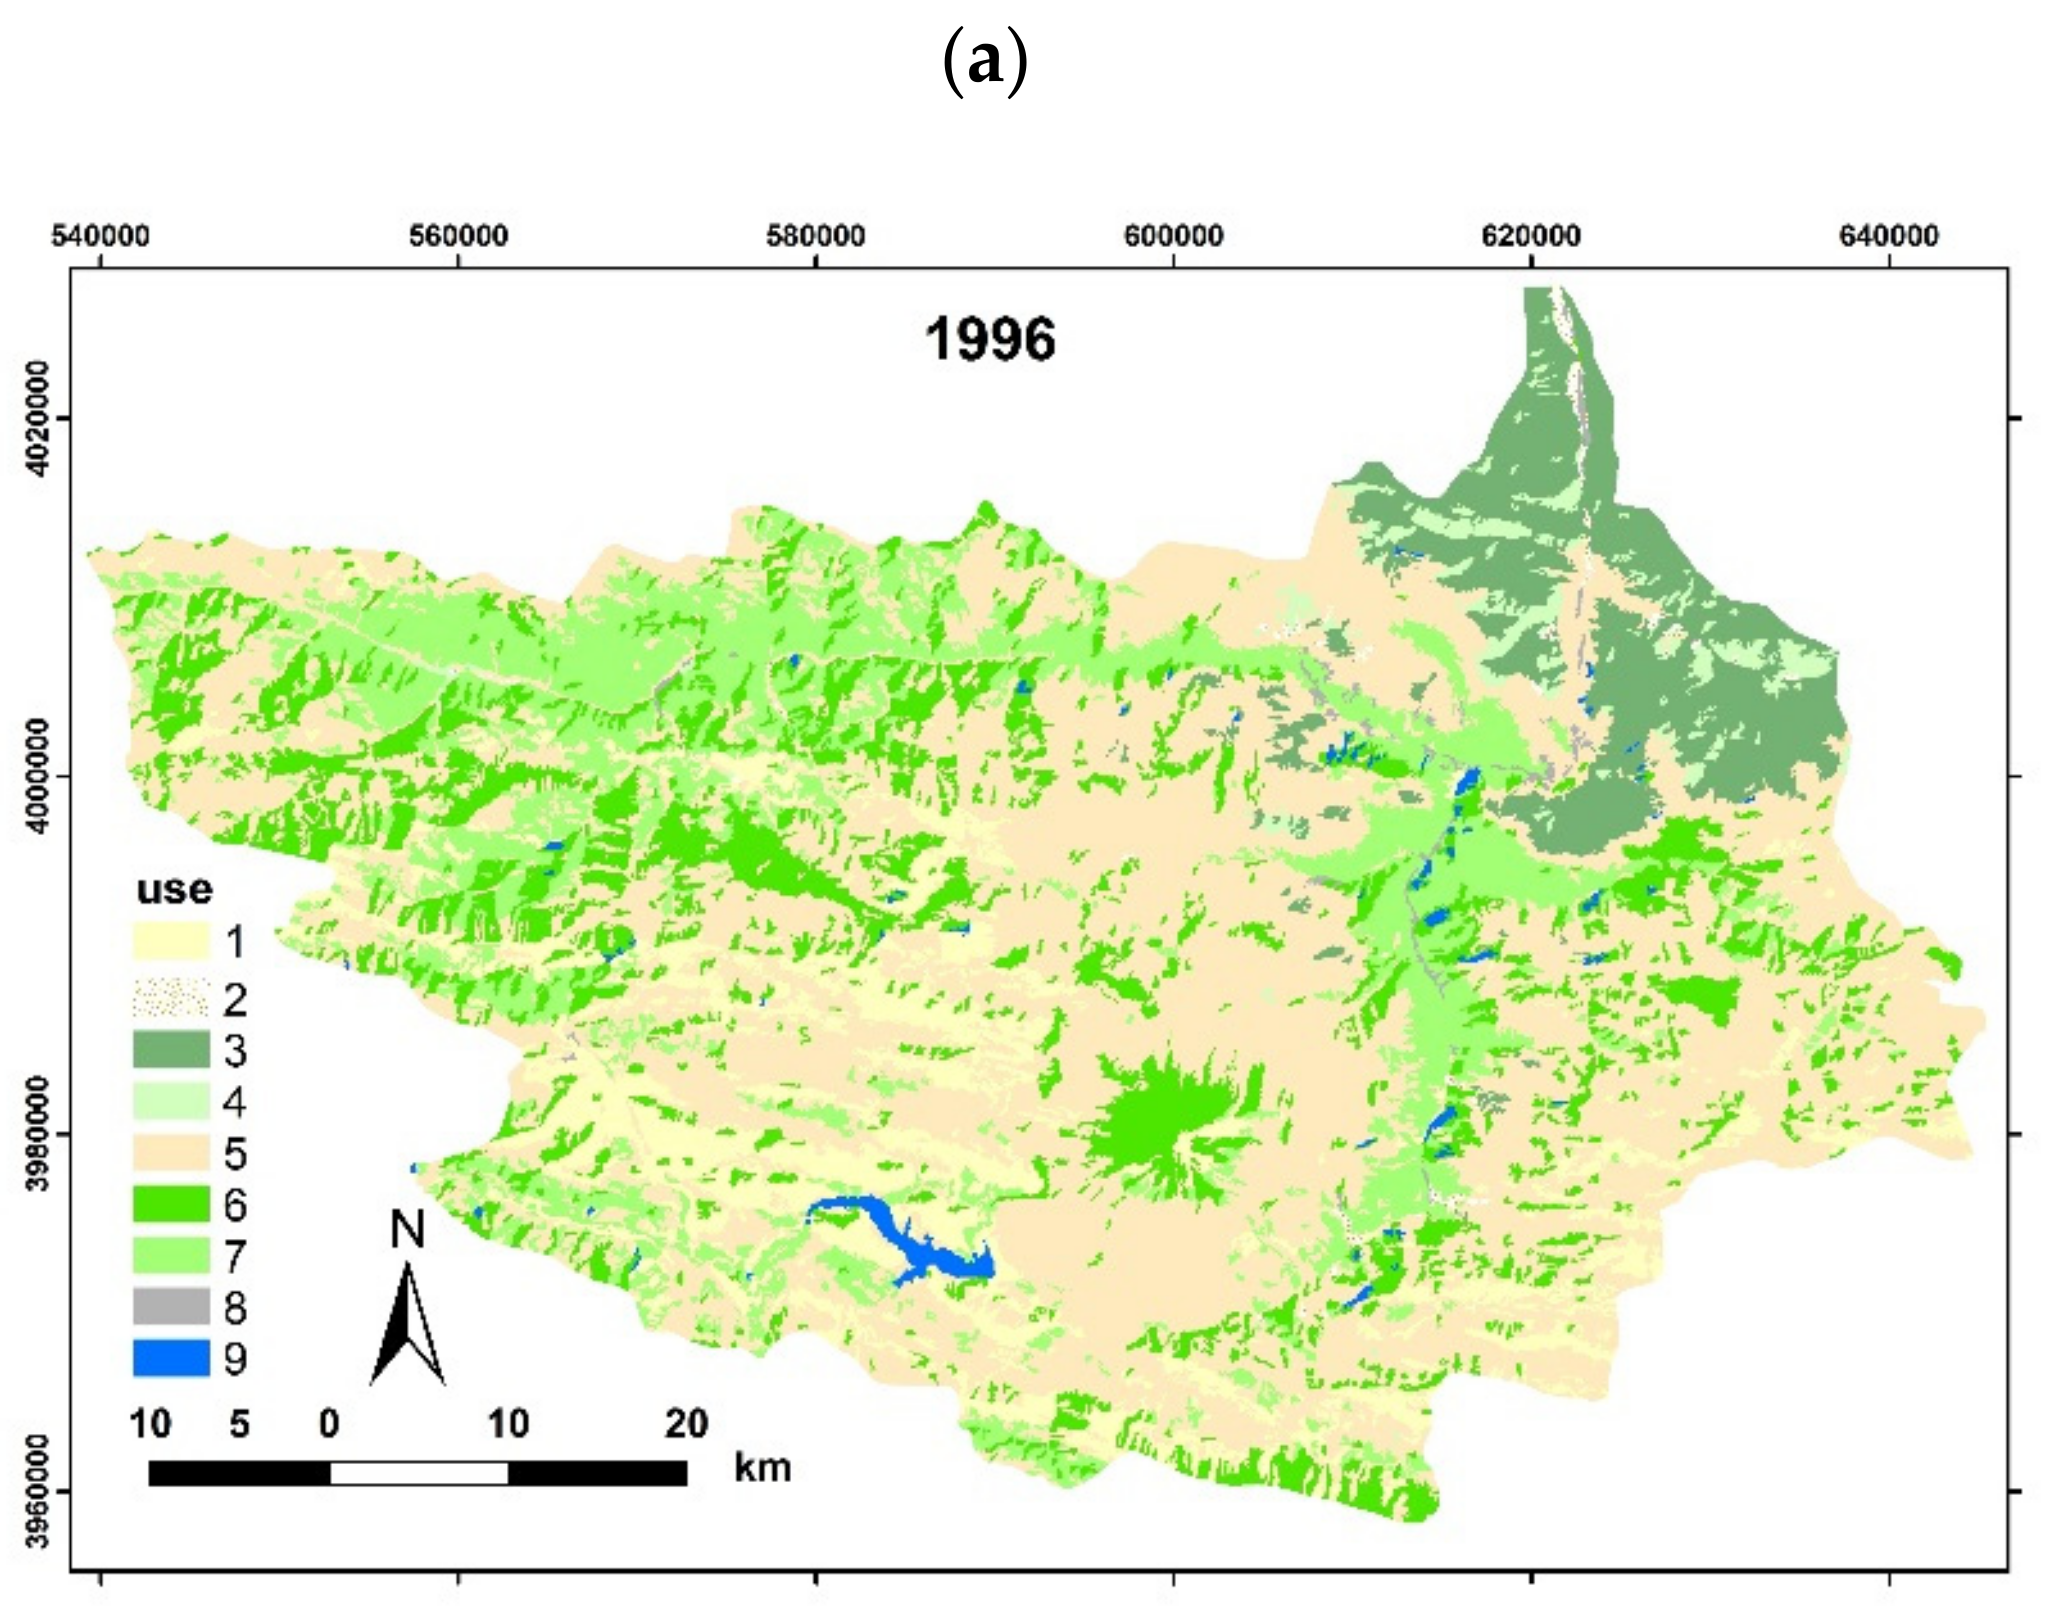
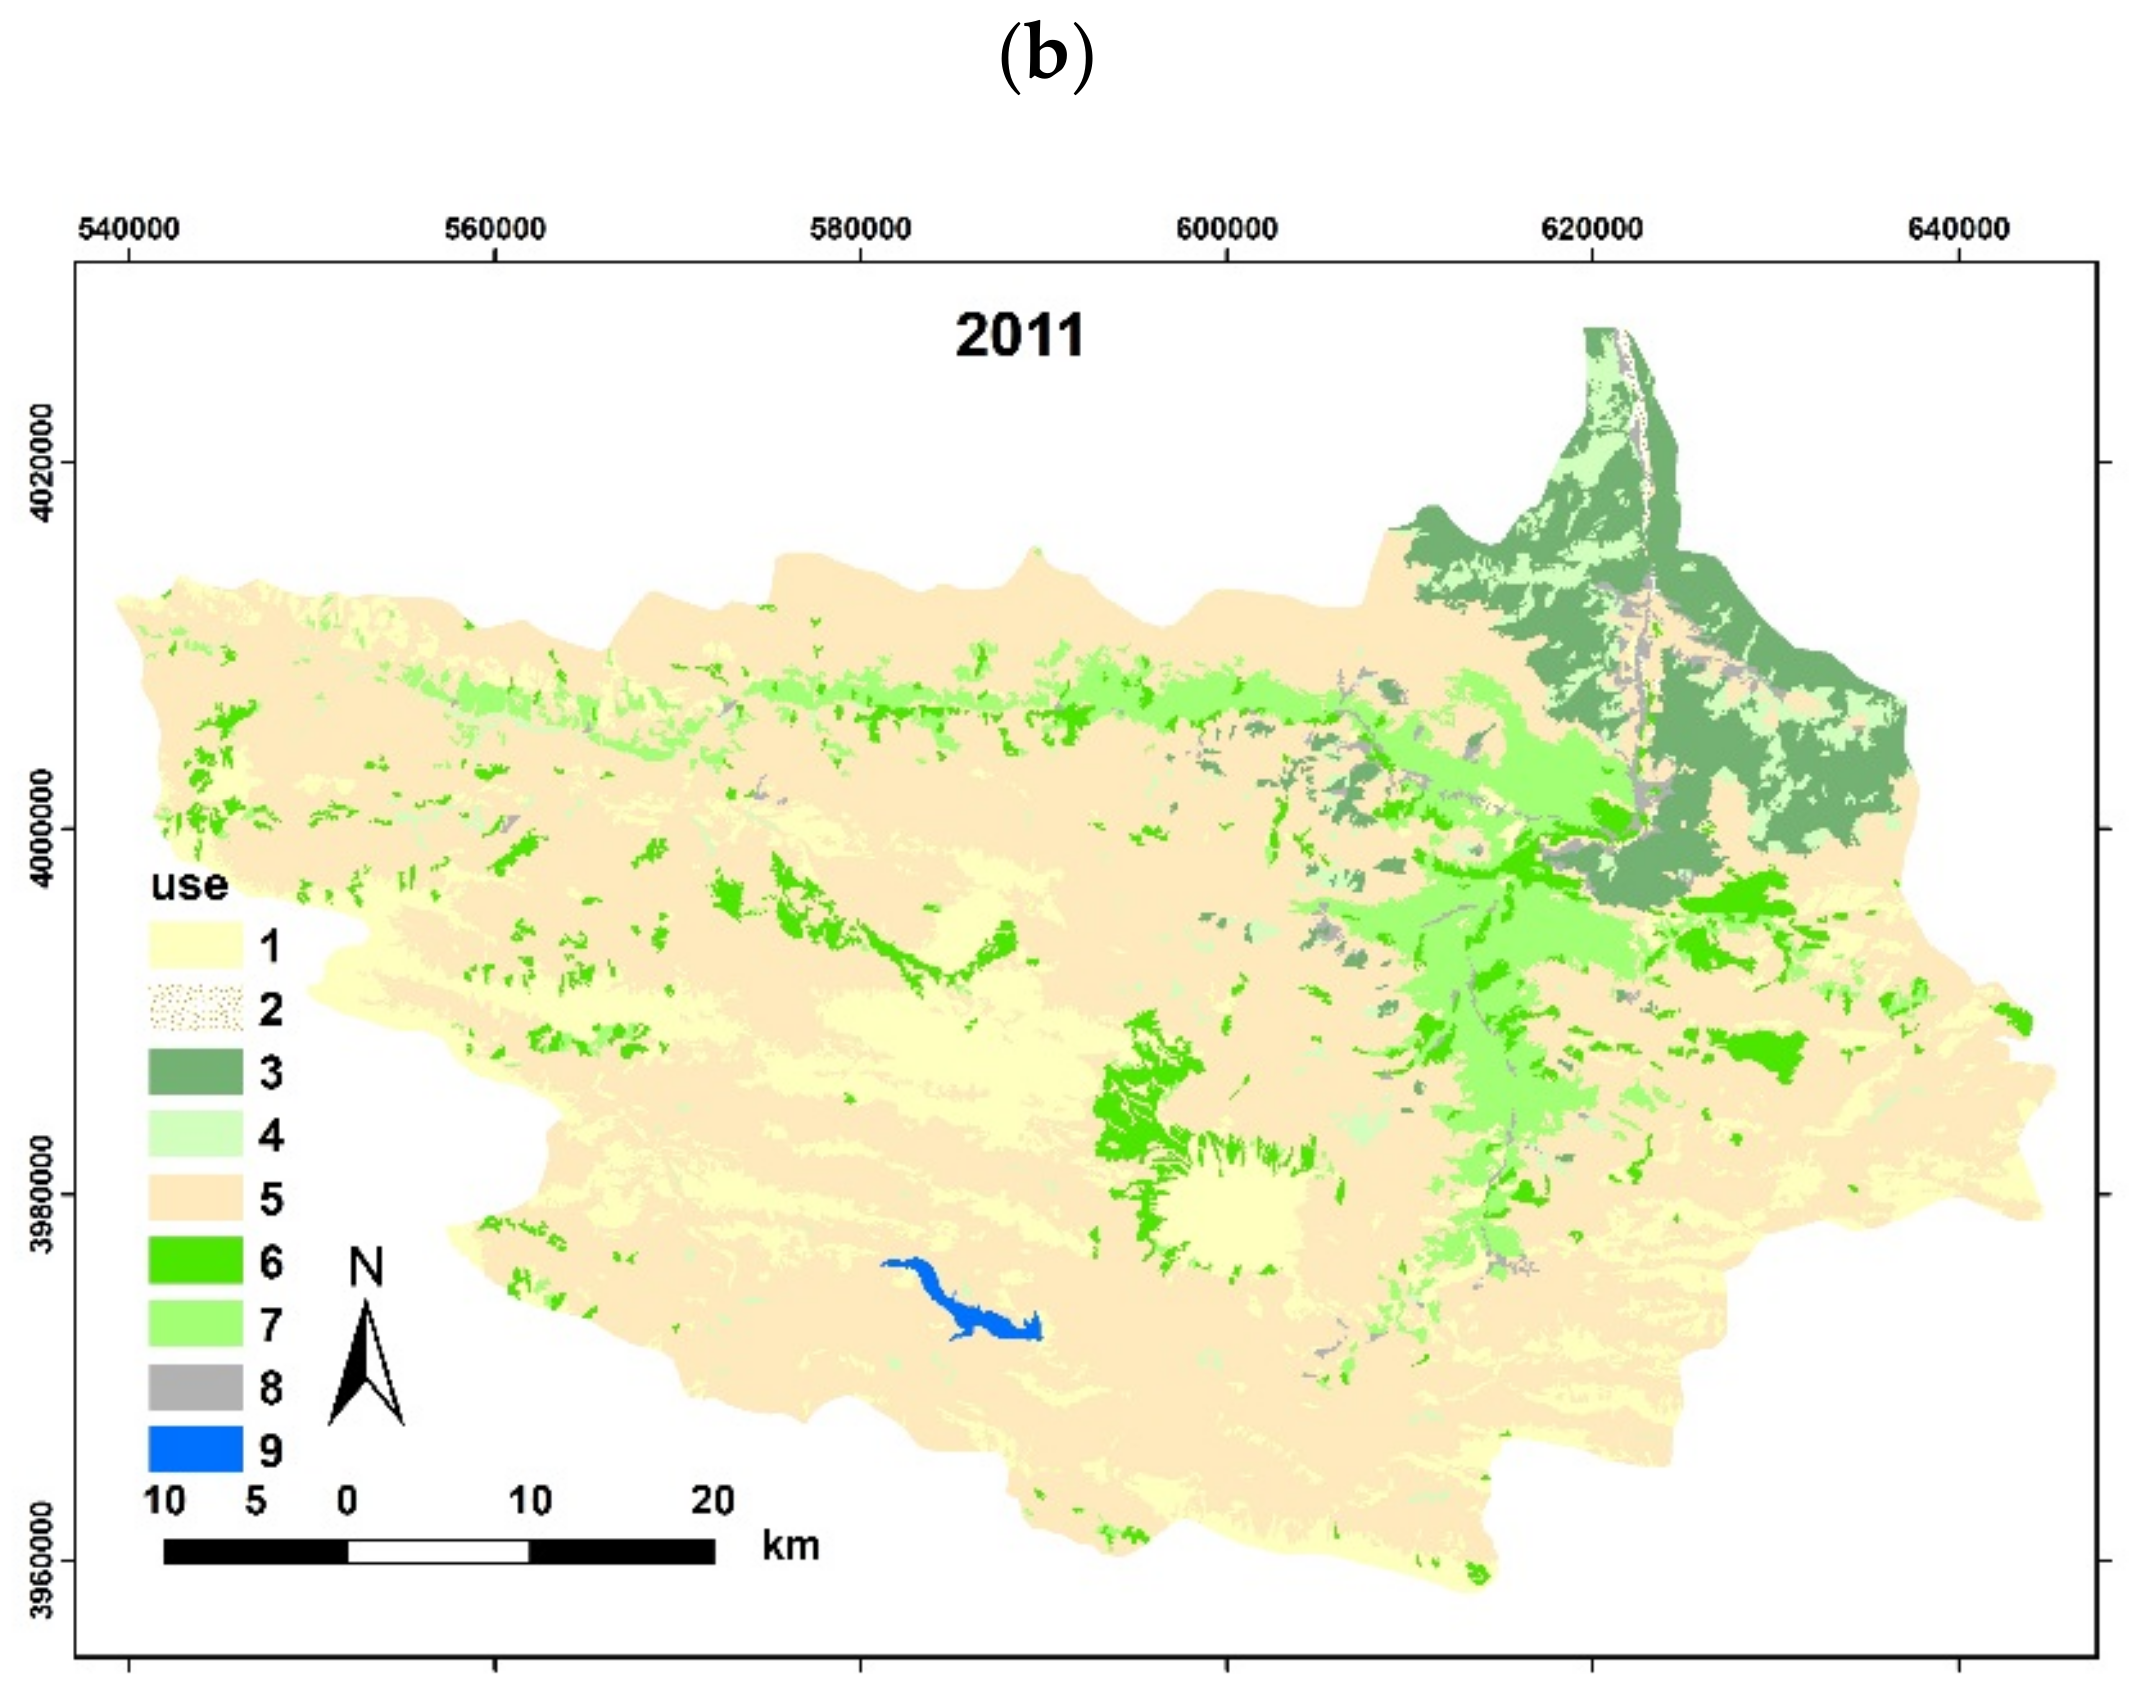
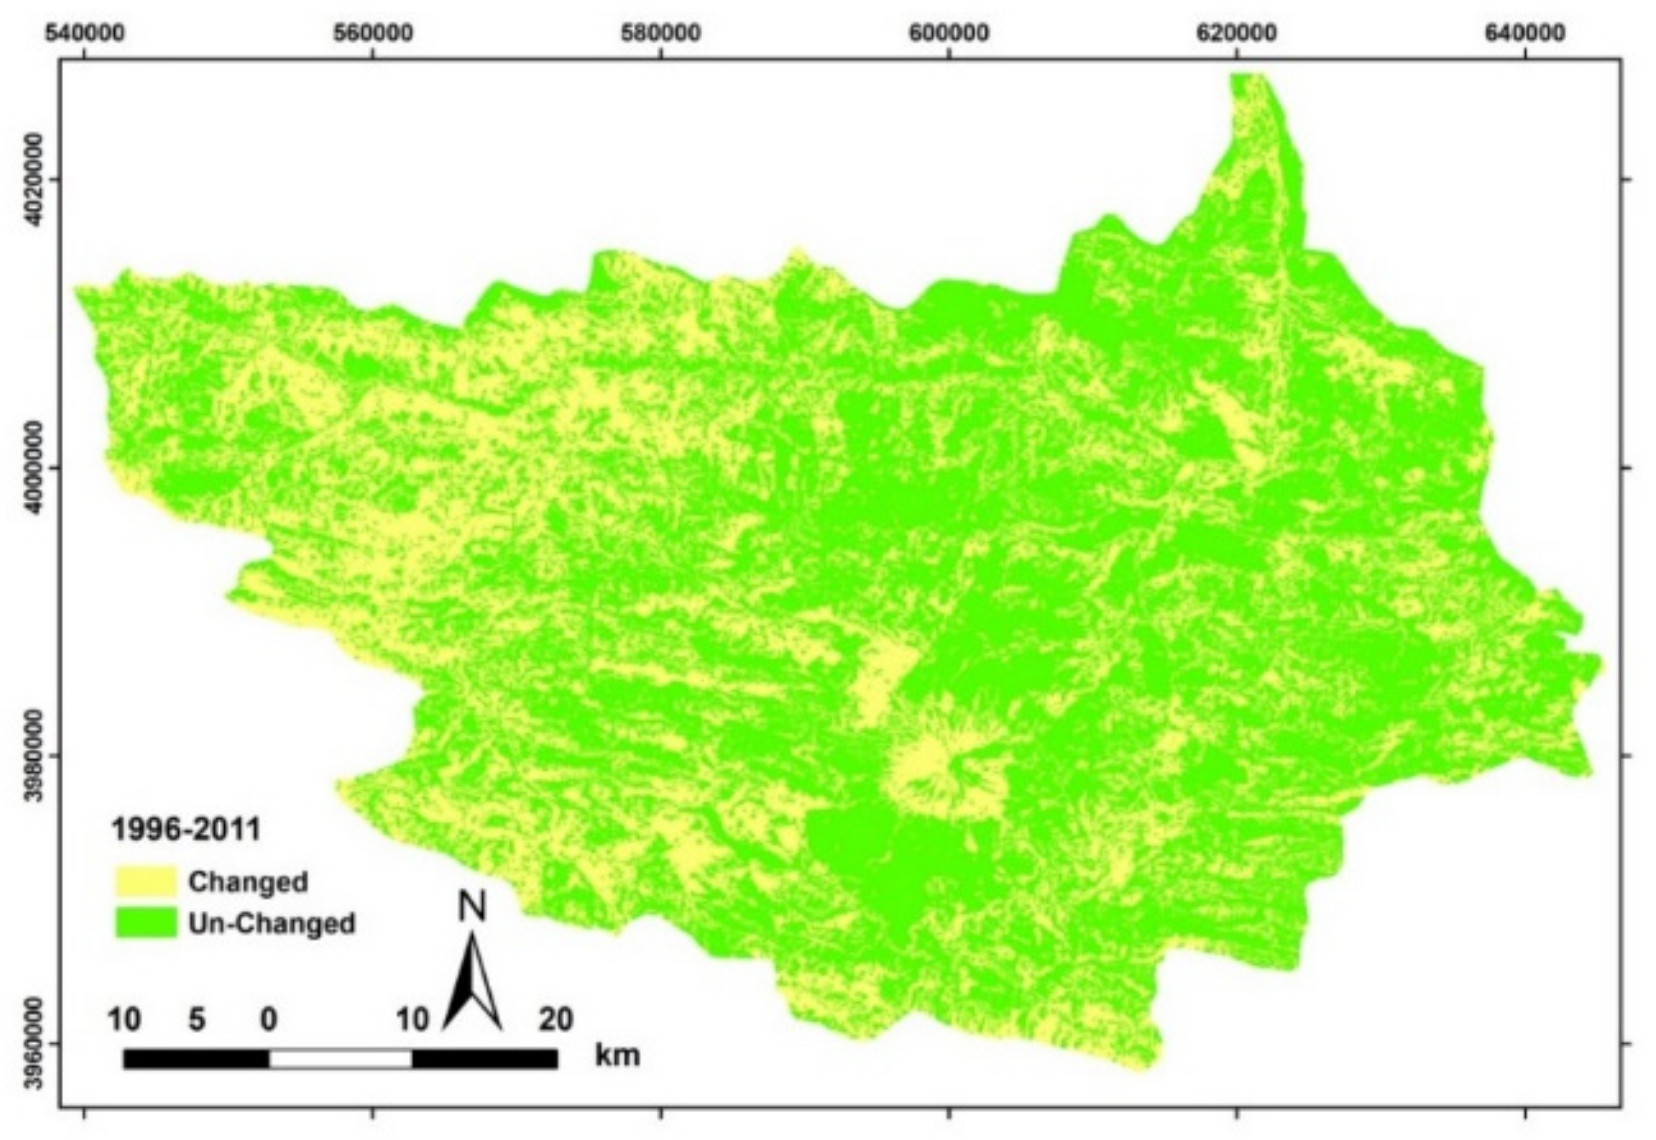
3.1. Land-Use Change
3.2. Hydrological Soil Groups
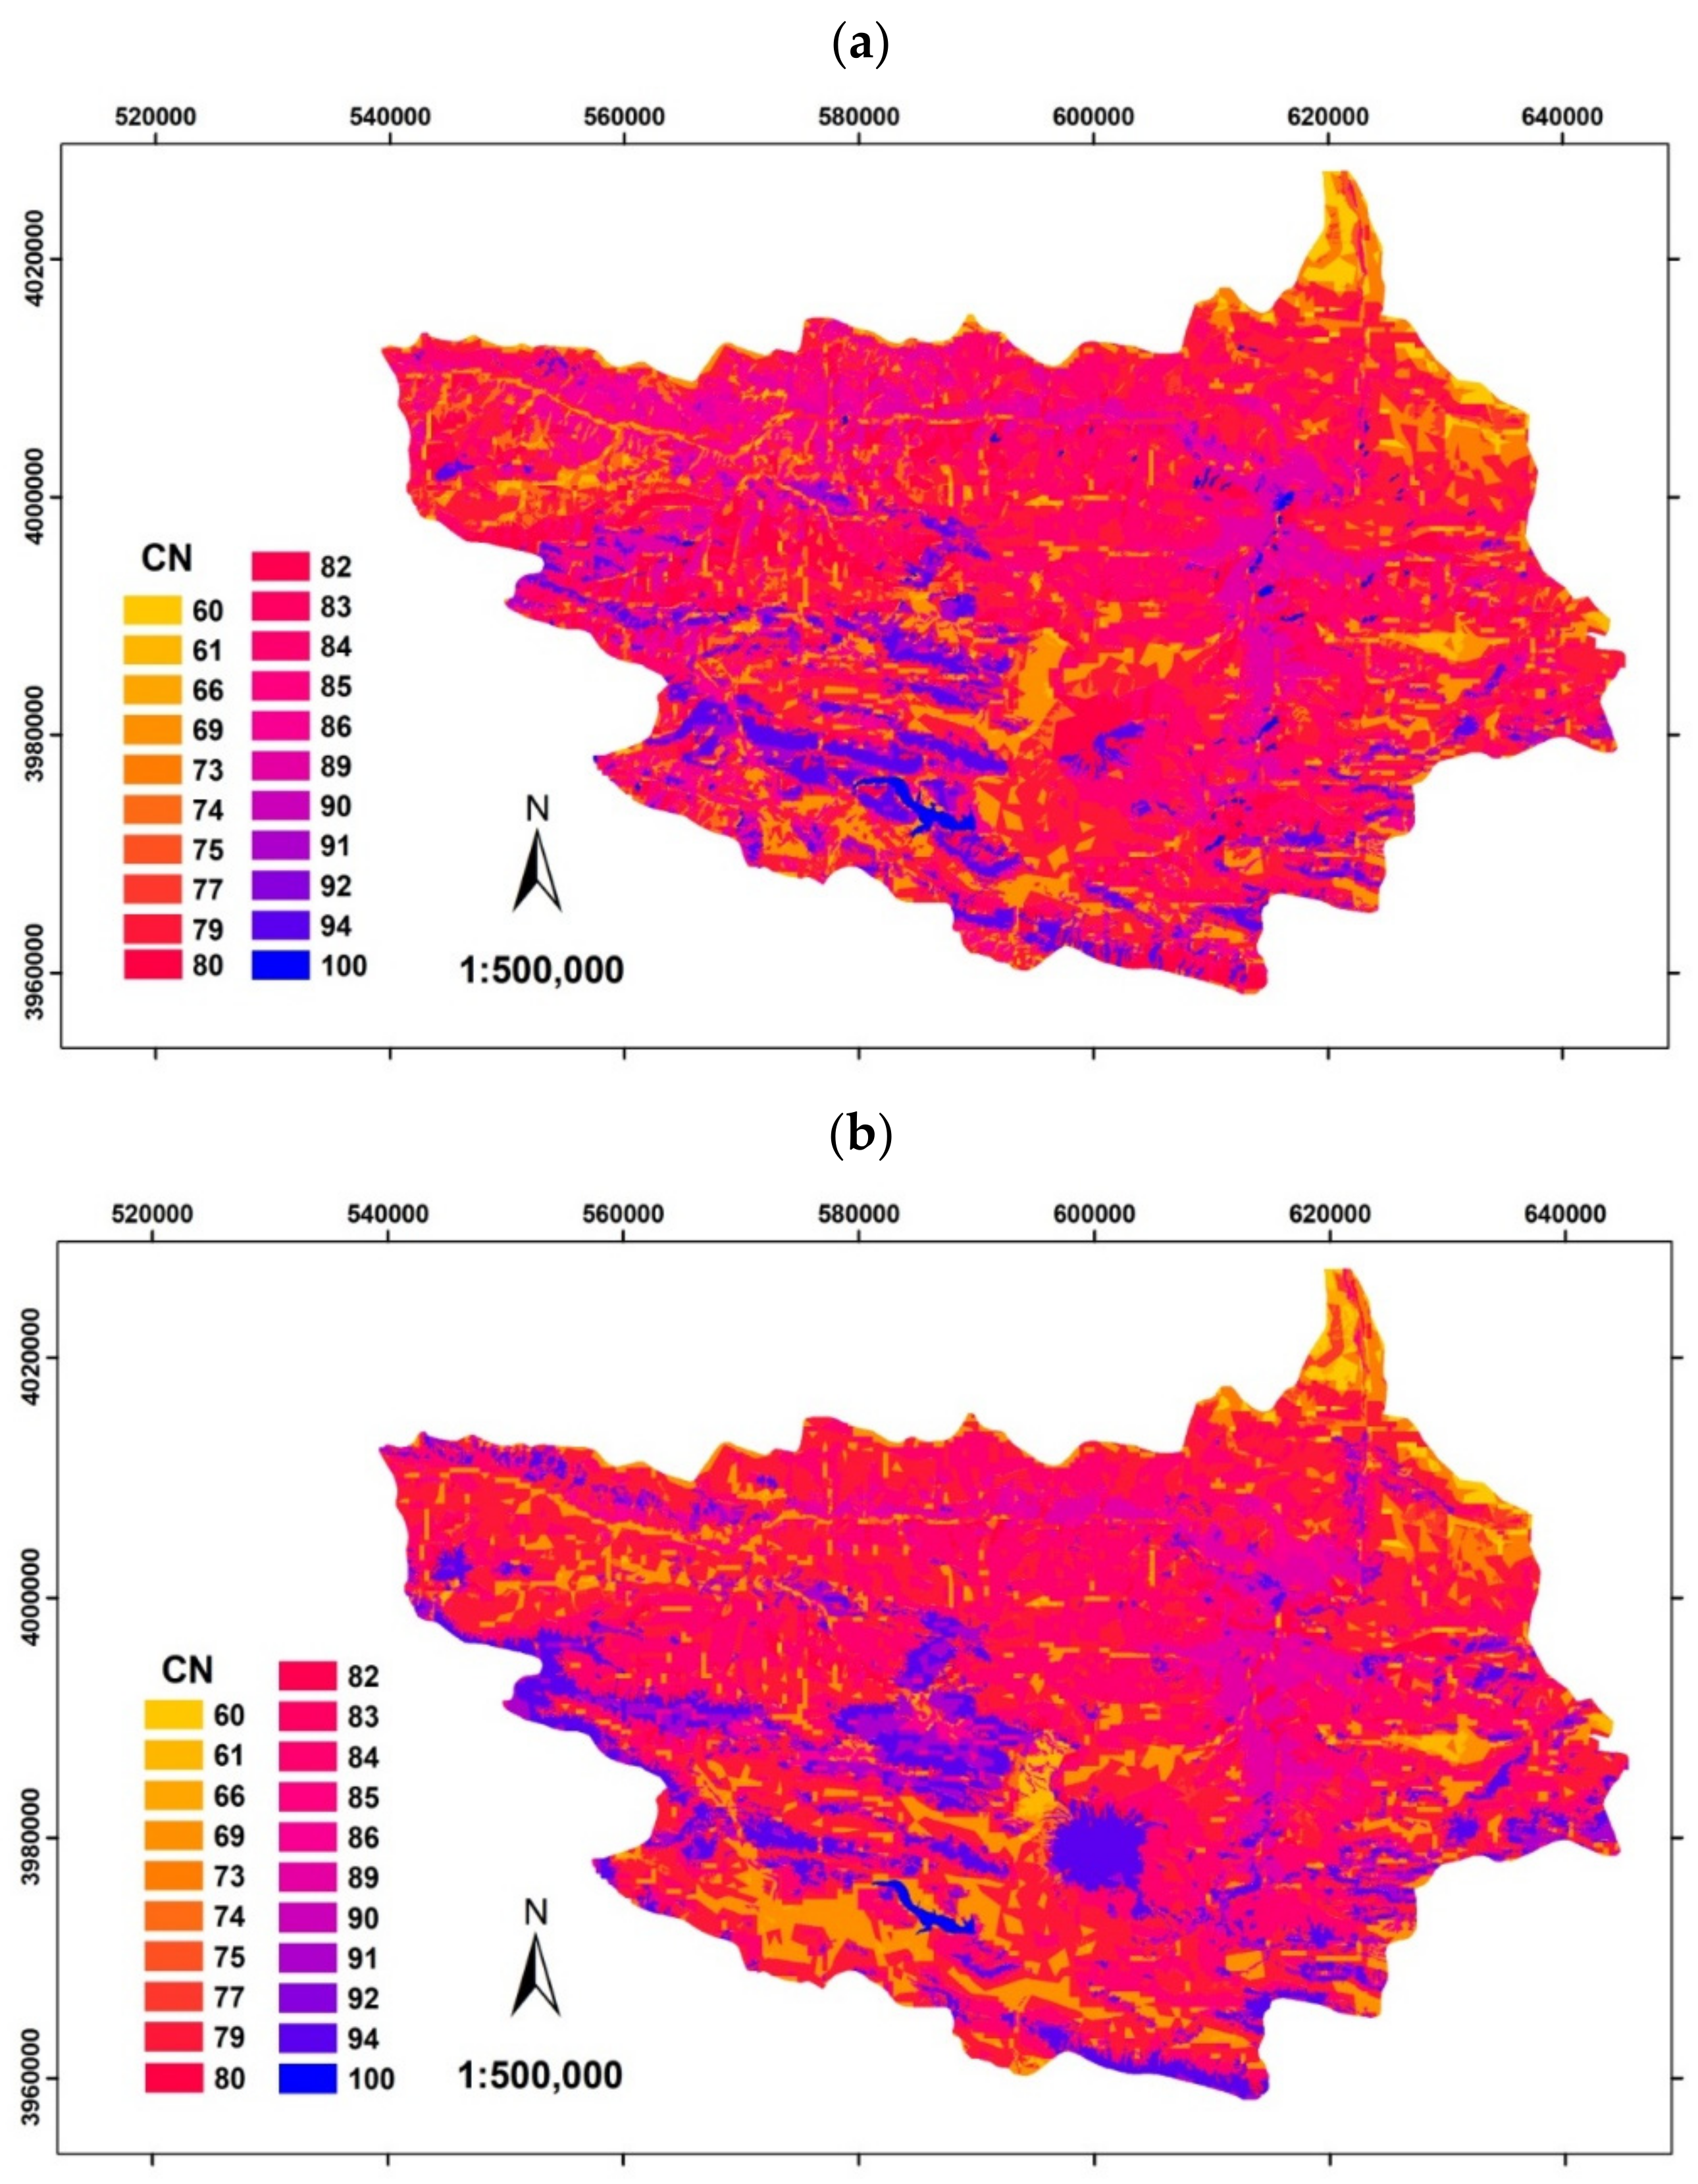
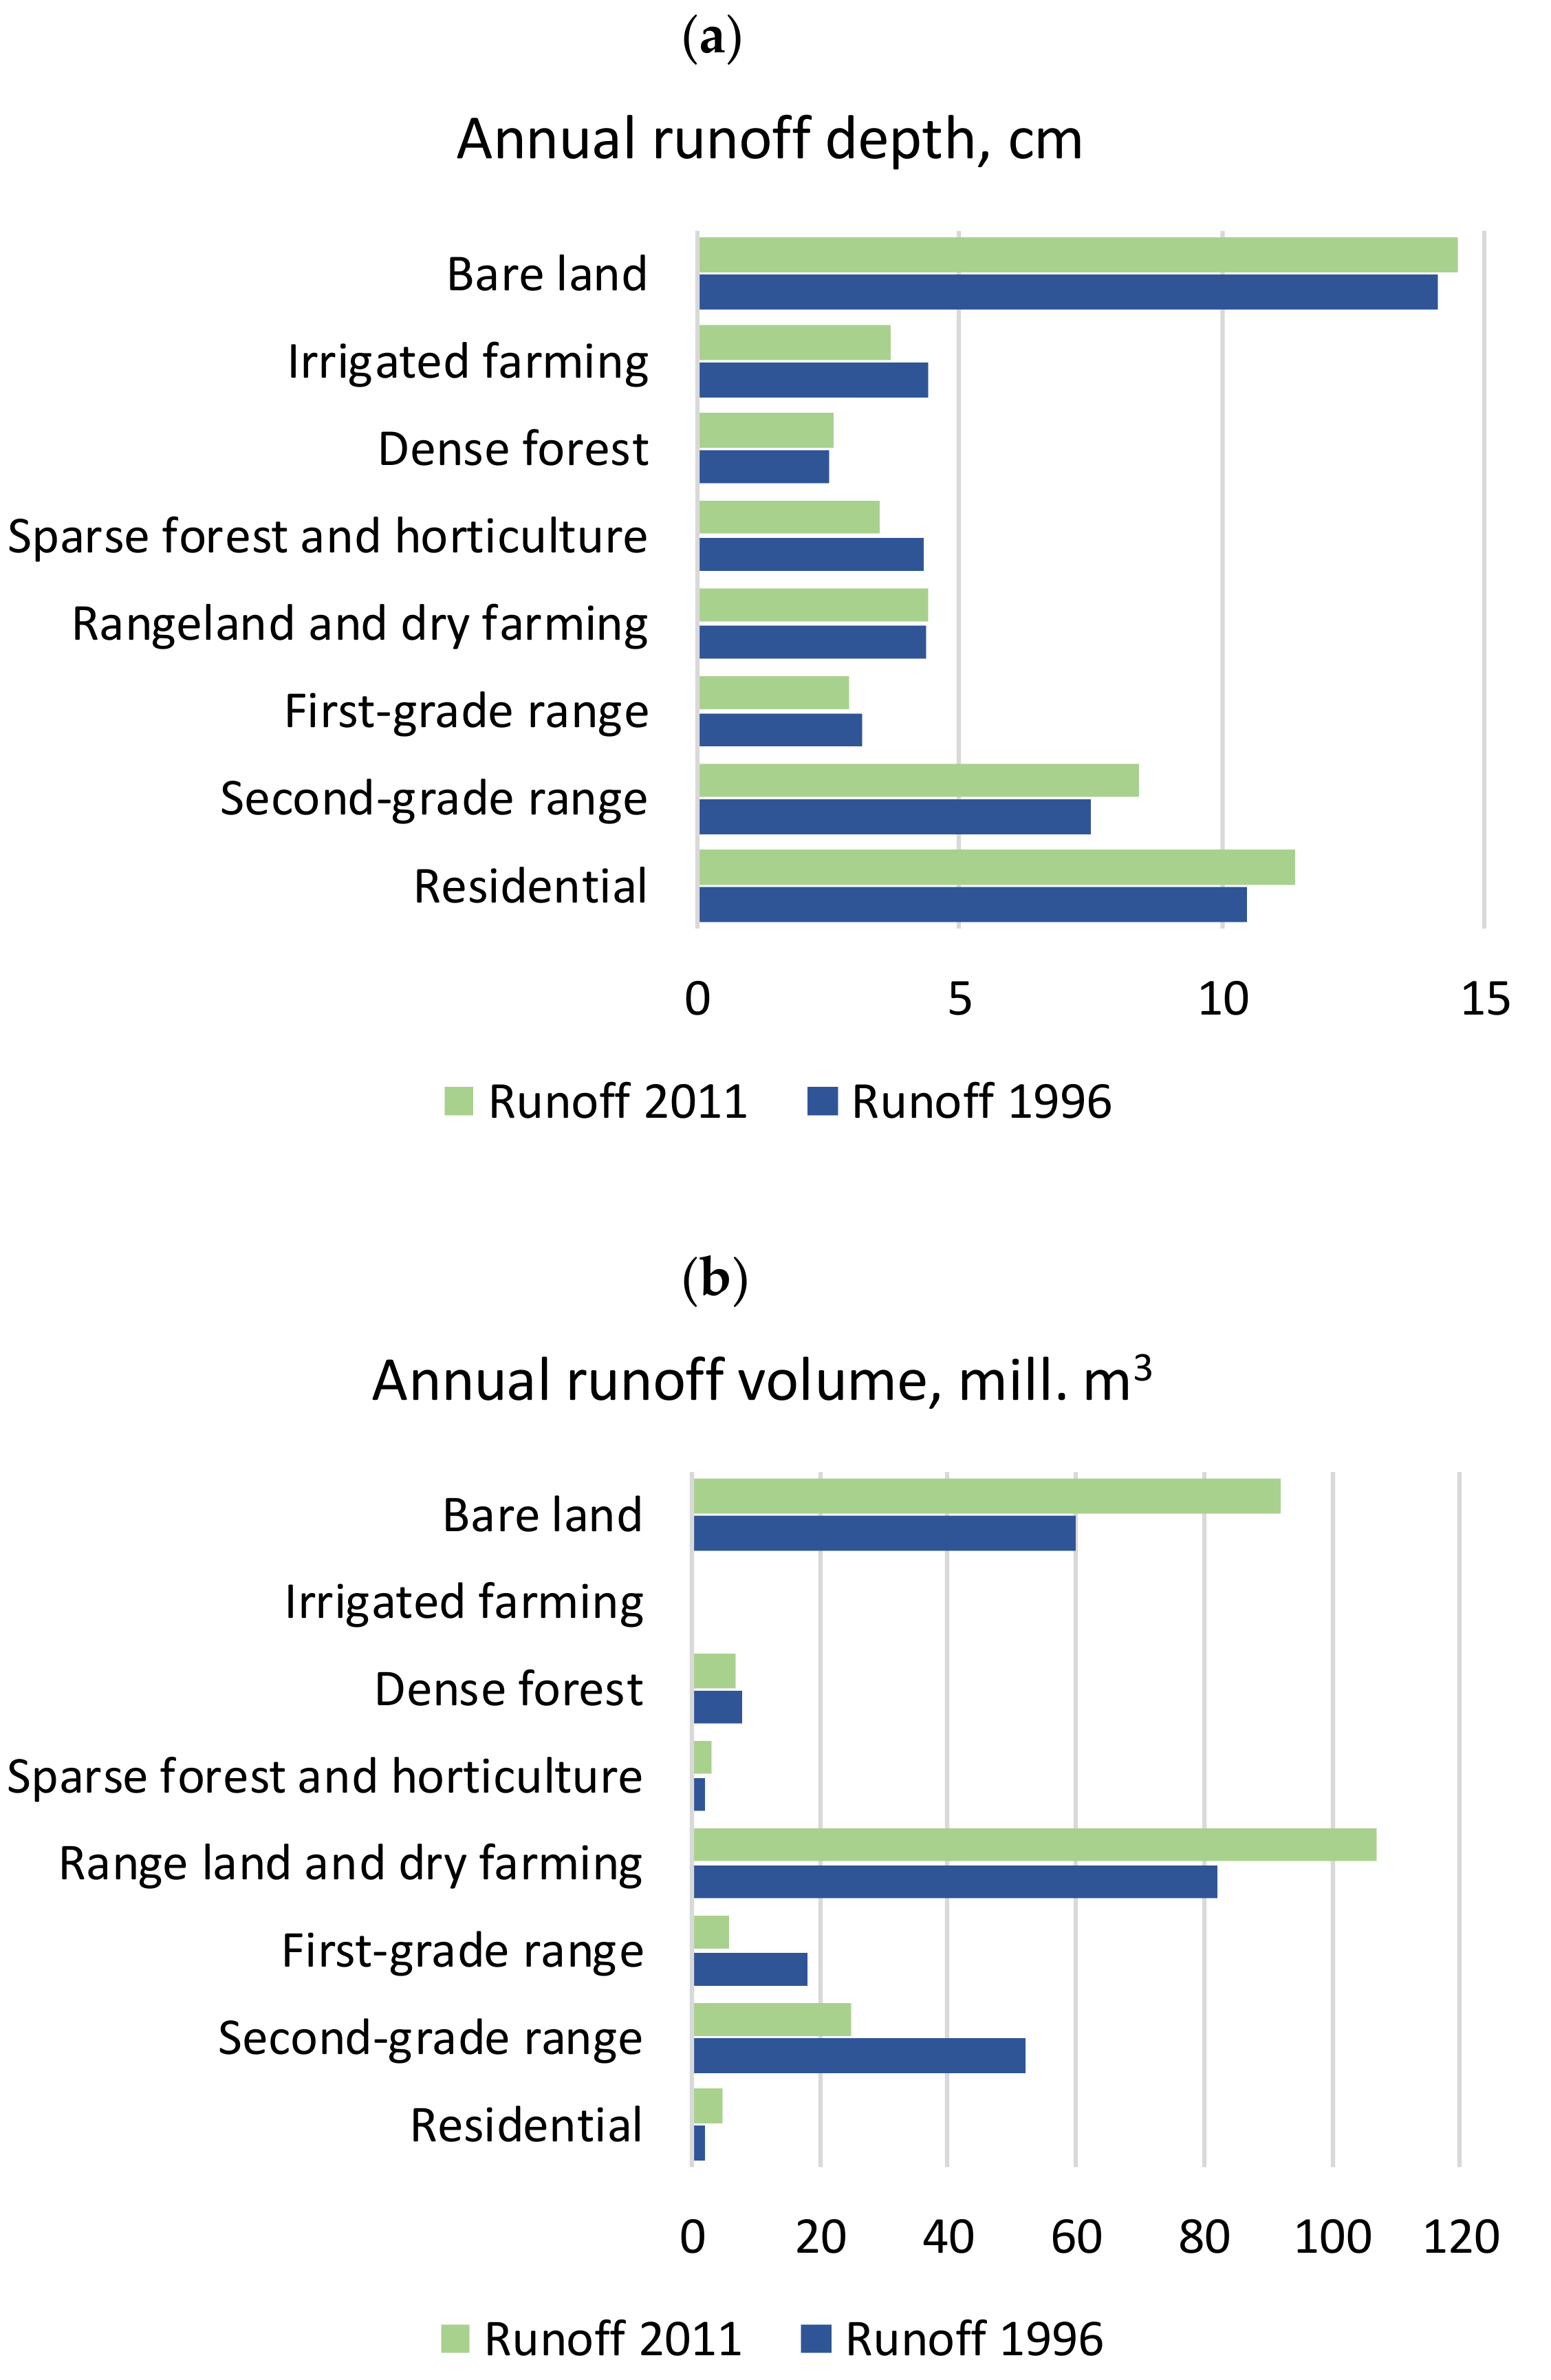
3.3. Curve Numbers and Runoff
4. Discussion
5. Conclusions
Author Contributions
Funding
Data Availability Statement
Conflicts of Interest
References
- Food and Agriculture Organization of the United Nations; United Nations Environment Programme. The Future of our Land. Facing the Challenge; FAO Publication, FAO: Rome, Italy, 1999; pp. 1–82. [Google Scholar]
- Githui, F.; Mutua, F.; Bauwens, W. Estimating the impacts of land-cover change on runoff using the soil and water assessment tool (SWAT): Case study of Nzoia catchment, Kenya. Hydrol. Sci. J. 2010, 54, 898–908. [Google Scholar]
- Singh, P.; Javed, S.; Shashtri, S.; Singh, R.P.; Vishwakarma, C.A.; Mukherjee, S. Influence of changes in watershed land-use pattern on the wetland of Sultanpur National Park, Haryana using remote sensing techniques and hydrochemical analysis. Remote Sens. Appl. Soc. Environ. 2017, 7, 84–92. [Google Scholar]
- Bal, M.; Dandpat, A.K.; Naik, B. Hydrological modeling with respect to impact of land-use and land-cover change on the runoff dynamics in Budhabalanga river basing using ArcGIS and SWAT model. Remote Sens. Appl. Soc. Environ. 2021, 23, 100527. [Google Scholar] [CrossRef]
- Mallikarjuna, V.; Prasad, K.R.K.; Udaya Bhaskar, P.; Sailakshmi, M. Watershed modeling of Krishna Delta using GIS and remote sensing techniques. Int. J. Eng. Sci. Technol. 2012, 4, 4539–4545. [Google Scholar]
- Ibrahim, A.; Zakaria, N.; Harun, N.; Hashim, M.M.M. Rainfall runoff modeling for the basin in Bukit Kledang, Perak. In Proceedings of the IOP Conference Series: Materials Science and Engineering, Selangor, Malaysia, 17–19 November 2020; Volume 1106, p. 012033. [Google Scholar] [CrossRef]
- Shang, X.; Jiang, X.; Jia, R.; Wei, C. Land-use and climate change effects on surface runoff variations in the upper Heihe River basin. Water 2019, 11, 344. [Google Scholar] [CrossRef] [Green Version]
- Desta, Y.; Goitom, H.; Aregay, G. Investigation of runoff response to land-use/land-cover change on the case of Aynalem catchment, North of Ethiopia. J. Afr. Earth Sci. 2019, 153, 130–143. [Google Scholar] [CrossRef]
- Xu, D.; Lyon, S.W.; Mao, J.; Dai, H.; Jarsjö, J. Impacts of multi-purpose reservoir construction, land-use change and climate change on runoff characteristics in the Poyang Lake basin, China. J. Hydrol. Reg. Stud. 2020, 29, 100694. [Google Scholar] [CrossRef]
- Yin, J.; He, F.; Xiong, Y.J.; Qiu, G.Y. Effect of land-use/land-cover and climate changes on surface runoff in a semi-humid and semi-arid transition zone in Northwest China. Hydrol. Earth Syst. Sci. 2017, 21, 183–196. [Google Scholar] [CrossRef] [Green Version]
- Selkimäki, M.; Gonzaléz-Olabarria, J.R.; Pukkala, T. Site and stand characteristics related to surface erosion occurrence in forests of Catalonia (Spain). Eur. J. For. Res. 2012, 131, 727–738. [Google Scholar] [CrossRef]
- De Jong, C. European perspectives on forest hydrology. Forest Hydrology: Processes, Management and Assessment, 1st ed.; CABI: Wallingford, UK, 2016; pp. 69–87. [Google Scholar]
- Faccini, F.; Luino, F.; Paliaga, G.; Sacchini, A.; Turconi, L.; de Jong, C. Role of rainfall intensity and urban sprawl in the 2014 flash flood in Genoa City, Bisagno catchment (Liguria, Italy). Appl. Geogr. 2018, 98, 224–241. [Google Scholar] [CrossRef]
- Kastridis, A.; Theodosiou, G.; Fotiadis, G. Investigation of Flood Management and Mitigation Measures in Ungauged NATURA Protected Watersheds. Hydrology 2021, 8, 170. [Google Scholar] [CrossRef]
- Zhao, B.; Zhang, L.; Xia, Z.; Xu, W.; Xia, L.; Liang, Y.; Xia, D. Effects of rainfall intensity and vegetation cover on erosion characteristics of a soil containing rock fragments slope. Adv. Civ. Eng. 2019, 2019, 7043428. [Google Scholar] [CrossRef]
- He, Y.; Lin, K.; Chen, X. Effect of land-use and climate change on runoff in the Dongjiang Basin of South China. Math. Probl. Eng. 2013, 2013, 471429. [Google Scholar] [CrossRef] [Green Version]
- Liu, Z.; Yao, Z.; Huang, H.; Wu, S.; Liu, G. Land-use and climate changes and their impacts on runoff in Yarlung Zangbo river basin, China. Land Degrad. Dev. 2012, 25, 203–215. [Google Scholar] [CrossRef]
- Sajikumar, N.; Remya, R.S. Impact of land-cover and land-use change on runoff characteristics. J. Environ. Manag. 2015, 161, 460–468. [Google Scholar] [CrossRef]
- Shrestha, S.; Bhatta, B.; Shrestha, M.; Shrestha, P.K. Integrated assessment of the climate and land-use change impact on hydrology and water quality in the Songkhram River Basin, Thailand. Sci. Total Environ. 2018, 643, 1610–1622. [Google Scholar] [CrossRef]
- Pandey, A.; Chowdary, V.M.; Mal, B.C.; Dabral, P.P. Estimation of runoff for agricultural watershed using SCS curve number and Geographic Information System. In Proceedings of the Map India Conference, New Delhi, India, 28–31 January 2003. [Google Scholar]
- Kumar, A.; Kanga, S.; Taloor, A.K.; Singh, S.K.; Đurin, B. Surface runoff estimation of Sind river basin using integrated SCS-CN and GIS techniques. HydroResearch 2021, 4, 61–74. [Google Scholar] [CrossRef]
- Jaiswal, R.K.; Ali, S.; Bharti, B. Comparative evaluation of conceptual and physical rainfall–runoff models. Appl. Water Sci. 2020, 10, 48. [Google Scholar] [CrossRef] [Green Version]
- Roy, T.; Gupta, H.V.; Serrat-Capdevila, A.; Valdes, J.B. Using satellite-based evapotranspiration estimates to improve the structure of a simple conceptual rainfall–runoff model. Hydrol. Earth Syst. Sci. 2017, 21, 879–896. [Google Scholar] [CrossRef] [Green Version]
- Rozos, E. A methodology for simple and fast stream flow modelling. Hydrol. Sci. J. 2020, 65, 1084–1095. [Google Scholar] [CrossRef]
- Rozos, E.; Dimitriadis, P.; Bellos, V. Machine Learning in Assessing the Performance of Hydrological Models. Hydrology 2022, 9, 5. [Google Scholar] [CrossRef]
- Najafi Kalyani, N.; Ranjbar-Fordoei, A.; Fatemeh, P.; Musavi, H. Prediction of Soil Hydrological Responses under Land Use/Cover Changes using Markov Chains in Jiroft Watershed, Iran. ECOPERSIA 2022, 10, 47–59. [Google Scholar]
- Ranjbar, H.; Gharehhassanloo, S. Modeling and Estimating the Potential of Runoff Using SCS Approach in GIS context (Case Study: Shahed Shahriar City). J. Environ. Sci. Stud. 2020, 5, 3002–3011. [Google Scholar]
- Hu, S.; Fan, Y.; Zhang, T. Assessing the effect of land-use change on surface runoff in a rapidly urbanized city: A case study of the central area of Beijing. Land 2020, 9, 17. [Google Scholar] [CrossRef] [Green Version]
- Zhan, X.; Huang, M.L. ArcCN-Runoff: An ArcGIS tool for generating curve number and runoff maps. Environ. Modeling Softw. 2004, 19, 875–879. [Google Scholar] [CrossRef]
- Fang, F.N.; Hua, Z.H.; Lu, L.; Zhong, L.; Qian, J.; Lei, A. The effects of rainfall regimes and land-use changes on runoff and soil loss in a small mountainous watershed. Catena 2012, 99, 1–8. [Google Scholar] [CrossRef]
- Pandey, A.C.; Singh, S.K.; Nathawat, M.S.; Saha, D. Assessment of surface and subsurface waterlogging, water level fluctuations, and lithological variations for evaluating groundwater resources in Ganga Plains. Int. J. Digit. Earth 2013, 6, 276–296. [Google Scholar] [CrossRef]
- Singh, S.K.; Pandey, A.C.; Rathore, V.S.; Nathawat, M.S. Evaluating factors responsible for contrasting signature of wasteland development in northern and southern Ganga Plains (Bihar State, India) with focus on waterlogging. Arab. J. Geosci. 2014, 7, 4175–4190. [Google Scholar] [CrossRef]
- Balkhair, K.S.; Ur Rahman, K. Development and assessment of rainwater harvesting suitability map using analytical hierarchy process, GIS and RS techniques. Geocarto Int. 2021, 36, 421–448. [Google Scholar] [CrossRef]
- Patil, N.S.; Nataraja, M. Effect of land-use/land-cover changes on runoff using hydrological model: A case study in Hiranyakeshi watershed. Modeling Earth Syst. Environ. 2020, 6, 2345–2357. [Google Scholar] [CrossRef]
- Rana, V.K.; Suryanarayana, T.M.V. GIS-based multi criteria decision making method to identify potential runoff storage zones within watershed. Ann. GIS 2020, 26, 149–168. [Google Scholar] [CrossRef] [Green Version]
- Coutu, G.W.; Vega, C. Impacts of land-use changes on runoff generation in the east branch of the Brandywine Creek watershed using a GIS-based hydrological model. Middle States Geogr. 2007, 40, 142–149. [Google Scholar]
- Muttaqin, A. Estimation of peak runoff impact from land-use change using remote sensing and GIS in Keduang sub-watershed. In Proceedings of the IOP Conference Series: Earth and Environmental Science, virtual. 25 May 2021; Volume 824, p. 012005. [Google Scholar] [CrossRef]
- Zurqani, H.A.; Post, C.J.; Mikhailova, E.A.; Schlautman, M.A.; Sharp, J.L. Geospatial analysis of land-use change in the Savannah River Basin using Google Earth Engine. Int. J. Appl. Earth Obs. Geoinf. 2018, 69, 175–185. [Google Scholar] [CrossRef]
- Adhiambo, M.P.; Kironchi, G.; Mureithi, S.; Kathumo, V. Assessing land-use and land-cover change using participatory geographical information system (PGIS) approach in Nguruman Sub-catchment, Kajiado north Sub county, Kenya. J. Geogr. Reg. Plan. 2017, 10, 219–228. [Google Scholar]
- Mola-aghajanzadeh, S.; Soleymani, K.; Habibnejad, M.; Kavyan, A.; Rahmani, M. Application of Remote Sensing in Assessing Land-Use Changes in Haraz Watershed. Geogr. Res. 2021, 36, 275–284. [Google Scholar]
- NRCS. National Engineering Handbook, Part 630 Hydrology; USDA: Washington, DC, USA, 2009. [Google Scholar]
- Abraham, S.; Huynh, C.; Vu, H. Classification of soils into hydrologic groups using machine learning. Data 2020, 5, 2. [Google Scholar] [CrossRef] [Green Version]
- USACE. Hydrologic Modeling System HEC-HMS: Technical Reference Manual; Hydrologic Engineering Center, US Army Corps of Engineers: Davis, CA, USA, 2000; p. 138.
- Verma, S.; Singh, P.K.; Mishra, S.K.; Singh, V.P.; Singh, V.; Singh, A. Activation soil moisture accounting (ASMA) for runoff estimation using soil conservation service curve number (SCS-CN) method. J. Hydrol. 2020, 589, 125114. [Google Scholar] [CrossRef]
- Babykalpana, Y.; Thanushkodi, K. Classification of land-use/land-cover change detection using remotely sensed data. Int. J. Comput. Sci. Eng. 2011, 3, 1638–1644. [Google Scholar]
- Al-Ghobari, H.; Dewidar, A.Z. Integrating GIS-Based MCDA Techniques and the SCS-CN Method for Identifying Potential Zones for Rainwater Harvesting in a Semi-Arid Area. Water 2021, 13, 704. [Google Scholar] [CrossRef]
- Ponce, V.M.; Hawkins, R. Runoff curve number: Has it reached maturity. J. Hydrol. Eng. 1996, 1, 11–19. [Google Scholar] [CrossRef]
- D’Asaro, F.; Grillone, G. Empirical investigation of curve number method parameters in the Mediterranean area. J. Hydrol. Eng. 2012, 17, 1141–1152. [Google Scholar] [CrossRef]
- Woodward, D.E.; Hawkins, R.H.; Jiang, R.; Hjelmfelt, A.T., Jr.; Van Mullem, J.A.; Quan, Q.D. Runoff curve number method: Examination of the initial abstraction ratio. In Proceedings of the 2003 World Water & Environmental Resources Congress, Philadelphia, PA, USA, 23–26 June 2003; American Society of Civil Engineers: Peston, VA, USA, 2003. [Google Scholar] [CrossRef] [Green Version]
- Huang, M.; Gallichand, J.; Wang, Z.; Goulet, M. A modification to the Soil Conservation Service curve number method for steep slopes in the Loess Plateau of China. Hydrol. Processes 2006, 20, 579–589. [Google Scholar] [CrossRef]
- Garen, D.C.; Moore, D.S. Curve number hydrology in water quality modelling: Uses, abuses, and future directions. J. Am. Water Resour. Assoc. 2005, 41, 377–388. [Google Scholar] [CrossRef]
- Chow, V.T.; Maidment, D.R.; Mays, L.W. Applied Hydrology; McGraw-Hill: New York, NY, USA, 1988; p. 572. ISBN 007-010810-2. [Google Scholar]
- Singh, A.K.; Sharma, S.B.; Jain, A.O. Mapping and Prediction of Surface Run-off using SCS-CN Method. In Proceedings of the Geomatics 2011, National Conference on Impact of Climate Chang with Special Emphasis on Desertification, Ajmer, India, 3–5 February 2011. [Google Scholar]
- He, Y.; Song, J.; Hu, Y.; Tu, X.; Zhao, Y. Impacts of different weather conditions and land-use change on runoff variations in the Beiluo River Watershed, China. Sustain. Cities Soc. 2019, 50, 101674. [Google Scholar] [CrossRef]
- Yin, J.; He, F. Researching relationship between the change of vegetation cover and runoff based on RS and GIS. Procedia Environ. Sci. 2012, 12, 1077–1081. [Google Scholar]
- Il Euma, H.; Dibikeb, Y.; Prowse, T. Comparative evaluation of the effects of climate and land-cover changes on hydrologic responses of the Muskeg River. J. Hydrol. Reg. Stud. 2016, 8, 198–221. [Google Scholar] [CrossRef] [Green Version]
- Kamuju, N. Rainfall-runoff estimation and comparative analysis using advanced geospatial digital hydrological modelling tools, ArcCN-Runoff & ArcSWAT. Int. J. Geoinformatics Geol. Sci. 2015, 2, 1–6. [Google Scholar]

| 1966 | 2011 | |||
|---|---|---|---|---|
| Land-Use Class | Number | Area, ha | Number | Area, ha |
| Bare land | 10 | 163 | 11 | 179 |
| Irrigated farming | 16 | 281 | 15 | 617 |
| Dense forest | 16 | 278 | 18 | 252 |
| Sparse forest and horticulture | 11 | 82 | 10 | 137 |
| Rangeland and dry farming | 22 | 305 | 30 | 531 |
| First-grade range | 18 | 211 | 17 | 106 |
| Second-grade range | 17 | 260 | 19 | 385 |
| Residential | 8 | 80 | 16 | 238 |
| Water | 6 | 41 | 8 | 44 |
| Total | 124 | 144 |
| Classified Land Use | True Land Use | |||||||||
|---|---|---|---|---|---|---|---|---|---|---|
| 1 | 2 | 3 | 4 | 5 | 6 | 7 | 8 | 9 | Total | |
| 1 | 12 | 0 | 0 | 0 | 0 | 0 | 0 | 0 | 0 | 12 |
| 2 | 0 | 16 | 0 | 0 | 0 | 0 | 0 | 0 | 0 | 16 |
| 3 | 0 | 0 | 18 | 3 | 0 | 0 | 0 | 0 | 0 | 21 |
| 4 | 0 | 2 | 2 | 6 | 0 | 0 | 0 | 0 | 0 | 10 |
| 5 | 0 | 1 | 0 | 1 | 31 | 1 | 1 | 0 | 0 | 35 |
| 6 | 0 | 0 | 0 | 0 | 0 | 7 | 1 | 0 | 0 | 8 |
| 7 | 0 | 0 | 0 | 0 | 0 | 0 | 8 | 1 | 0 | 9 |
| 8 | 0 | 0 | 0 | 0 | 0 | 0 | 0 | 11 | 0 | 11 |
| 9 | 0 | 0 | 0 | 0 | 0 | 0 | 0 | 0 | 8 | 8 |
| Total | 12 | 19 | 20 | 10 | 31 | 8 | 10 | 12 | 8 | 130 |
| Code | Land Use | 1996 | 2011 | ||
|---|---|---|---|---|---|
| Area (ha) | % | Area (ha) | % | ||
| 1 | Bare land | 42,289 | 10.40 | 62,724 | 15.43 |
| 2 | Irrigated farming | 1532 | 0.38 | 622 | 0.15 |
| 3 | Dense forest | 28,535 | 7.01 | 24,551 | 6.04 |
| 4 | Sparse forest and horticulture | 6188 | 1.52 | 10,007 | 2.46 |
| 5 | Rangeland and dry farming | 198,367 | 48.78 | 255,144 | 62.74 |
| 6 | First-grade range | 59,843 | 14.72 | 18,898 | 4.65 |
| 7 | Second-grade range | 65,698 | 16.16 | 29,745 | 7.31 |
| 8 | Residential | 1468 | 0.36 | 4049 | 1.00 |
| 9 | Water | 2709 | 0.67 | 888 | 0.22 |
| Land Use | Area (ha) | Proportion (%) |
|---|---|---|
| Bare land | 26,888 | 6.61 |
| Irrigated farming | 239 | 0.06 |
| Dense forest | 22,148 | 5.45 |
| Low-dense forest and horticulture | 3313 | 0.81 |
| Rangeland and dry farming | 165,657 | 40.74 |
| First-grade range | 12,441 | 3.06 |
| Second-grade range | 21,670 | 5.34 |
| Residential | 420 | 0.10 |
| Water | 881 | 0.22 |
| Land Use in 1996 | Land Use in 2011 | Area (ha) | Area (%) |
|---|---|---|---|
| Second-grade range | Rangeland and dry farming | 35,857 | 8.82 |
| First-grade range | Rangeland and dry farming | 33,945 | 8.35 |
| Rangeland and dry farming | Bare land | 18,801 | 4.62 |
| Bare land | Rangeland and dry farming | 15,316 | 3.77 |
| First-grade range | Bare land | 10,959 | 2.70 |
| Second-grade range | Bare land | 5788 | 1.42 |
| Rangeland and dry farming | Second-grade range | 5042 | 1.24 |
| Land Use | Percentage 1996 | Percentage 2011 | Curve Number | ||||||
|---|---|---|---|---|---|---|---|---|---|
| B | C | D | B | C | D | B | C | D | |
| Bare land | 16 | 33 | 51 | 11 | 32 | 56 | 86 | 91 | 94 |
| Irrigated farming | 46 | 30 | 24 | 63 | 19 | 19 | 75 | 82 | 86 |
| Dense forest | 14 | 32 | 54 | 13 | 29 | 58 | 60 | 73 | 79 |
| Sparse forest and horticulture | 9 | 31 | 60 | 21 | 34 | 45 | 66 | 77 | 83 |
| Range land and dry farming | 16 | 39 | 45 | 16 | 40 | 45 | 69 | 79 | 84 |
| First-grade range | 9 | 29 | 63 | 18 | 24 | 57 | 61 | 74 | 80 |
| Second-grade range | 14 | 40 | 45 | 8 | 28 | 64 | 79 | 86 | 89 |
| Residential | 32 | 24 | 43 | 19 | 27 | 54 | 85 | 90 | 92 |
| Water | 41 | 14 | 45 | 79 | 17 | 4 | 100 | 100 | 100 |
| Total | 15 | 36 | 49 | 15 | 36 | 49 | |||
Publisher’s Note: MDPI stays neutral with regard to jurisdictional claims in published maps and institutional affiliations. |
© 2022 by the authors. Licensee MDPI, Basel, Switzerland. This article is an open access article distributed under the terms and conditions of the Creative Commons Attribution (CC BY) license (https://creativecommons.org/licenses/by/4.0/).
Share and Cite
Ahmadi-Sani, N.; Razaghnia, L.; Pukkala, T. Effect of Land-Use Change on Runoff in Hyrcania. Land 2022, 11, 220. https://doi.org/10.3390/land11020220
Ahmadi-Sani N, Razaghnia L, Pukkala T. Effect of Land-Use Change on Runoff in Hyrcania. Land. 2022; 11(2):220. https://doi.org/10.3390/land11020220
Chicago/Turabian StyleAhmadi-Sani, Naser, Lida Razaghnia, and Timo Pukkala. 2022. "Effect of Land-Use Change on Runoff in Hyrcania" Land 11, no. 2: 220. https://doi.org/10.3390/land11020220
APA StyleAhmadi-Sani, N., Razaghnia, L., & Pukkala, T. (2022). Effect of Land-Use Change on Runoff in Hyrcania. Land, 11(2), 220. https://doi.org/10.3390/land11020220