
Transportation and Air Quality Perspectives and Projections in a Mediterranean Country, the Case of Greece

 ,
,  ,
,  and
and 
Abstract
:1. Introduction
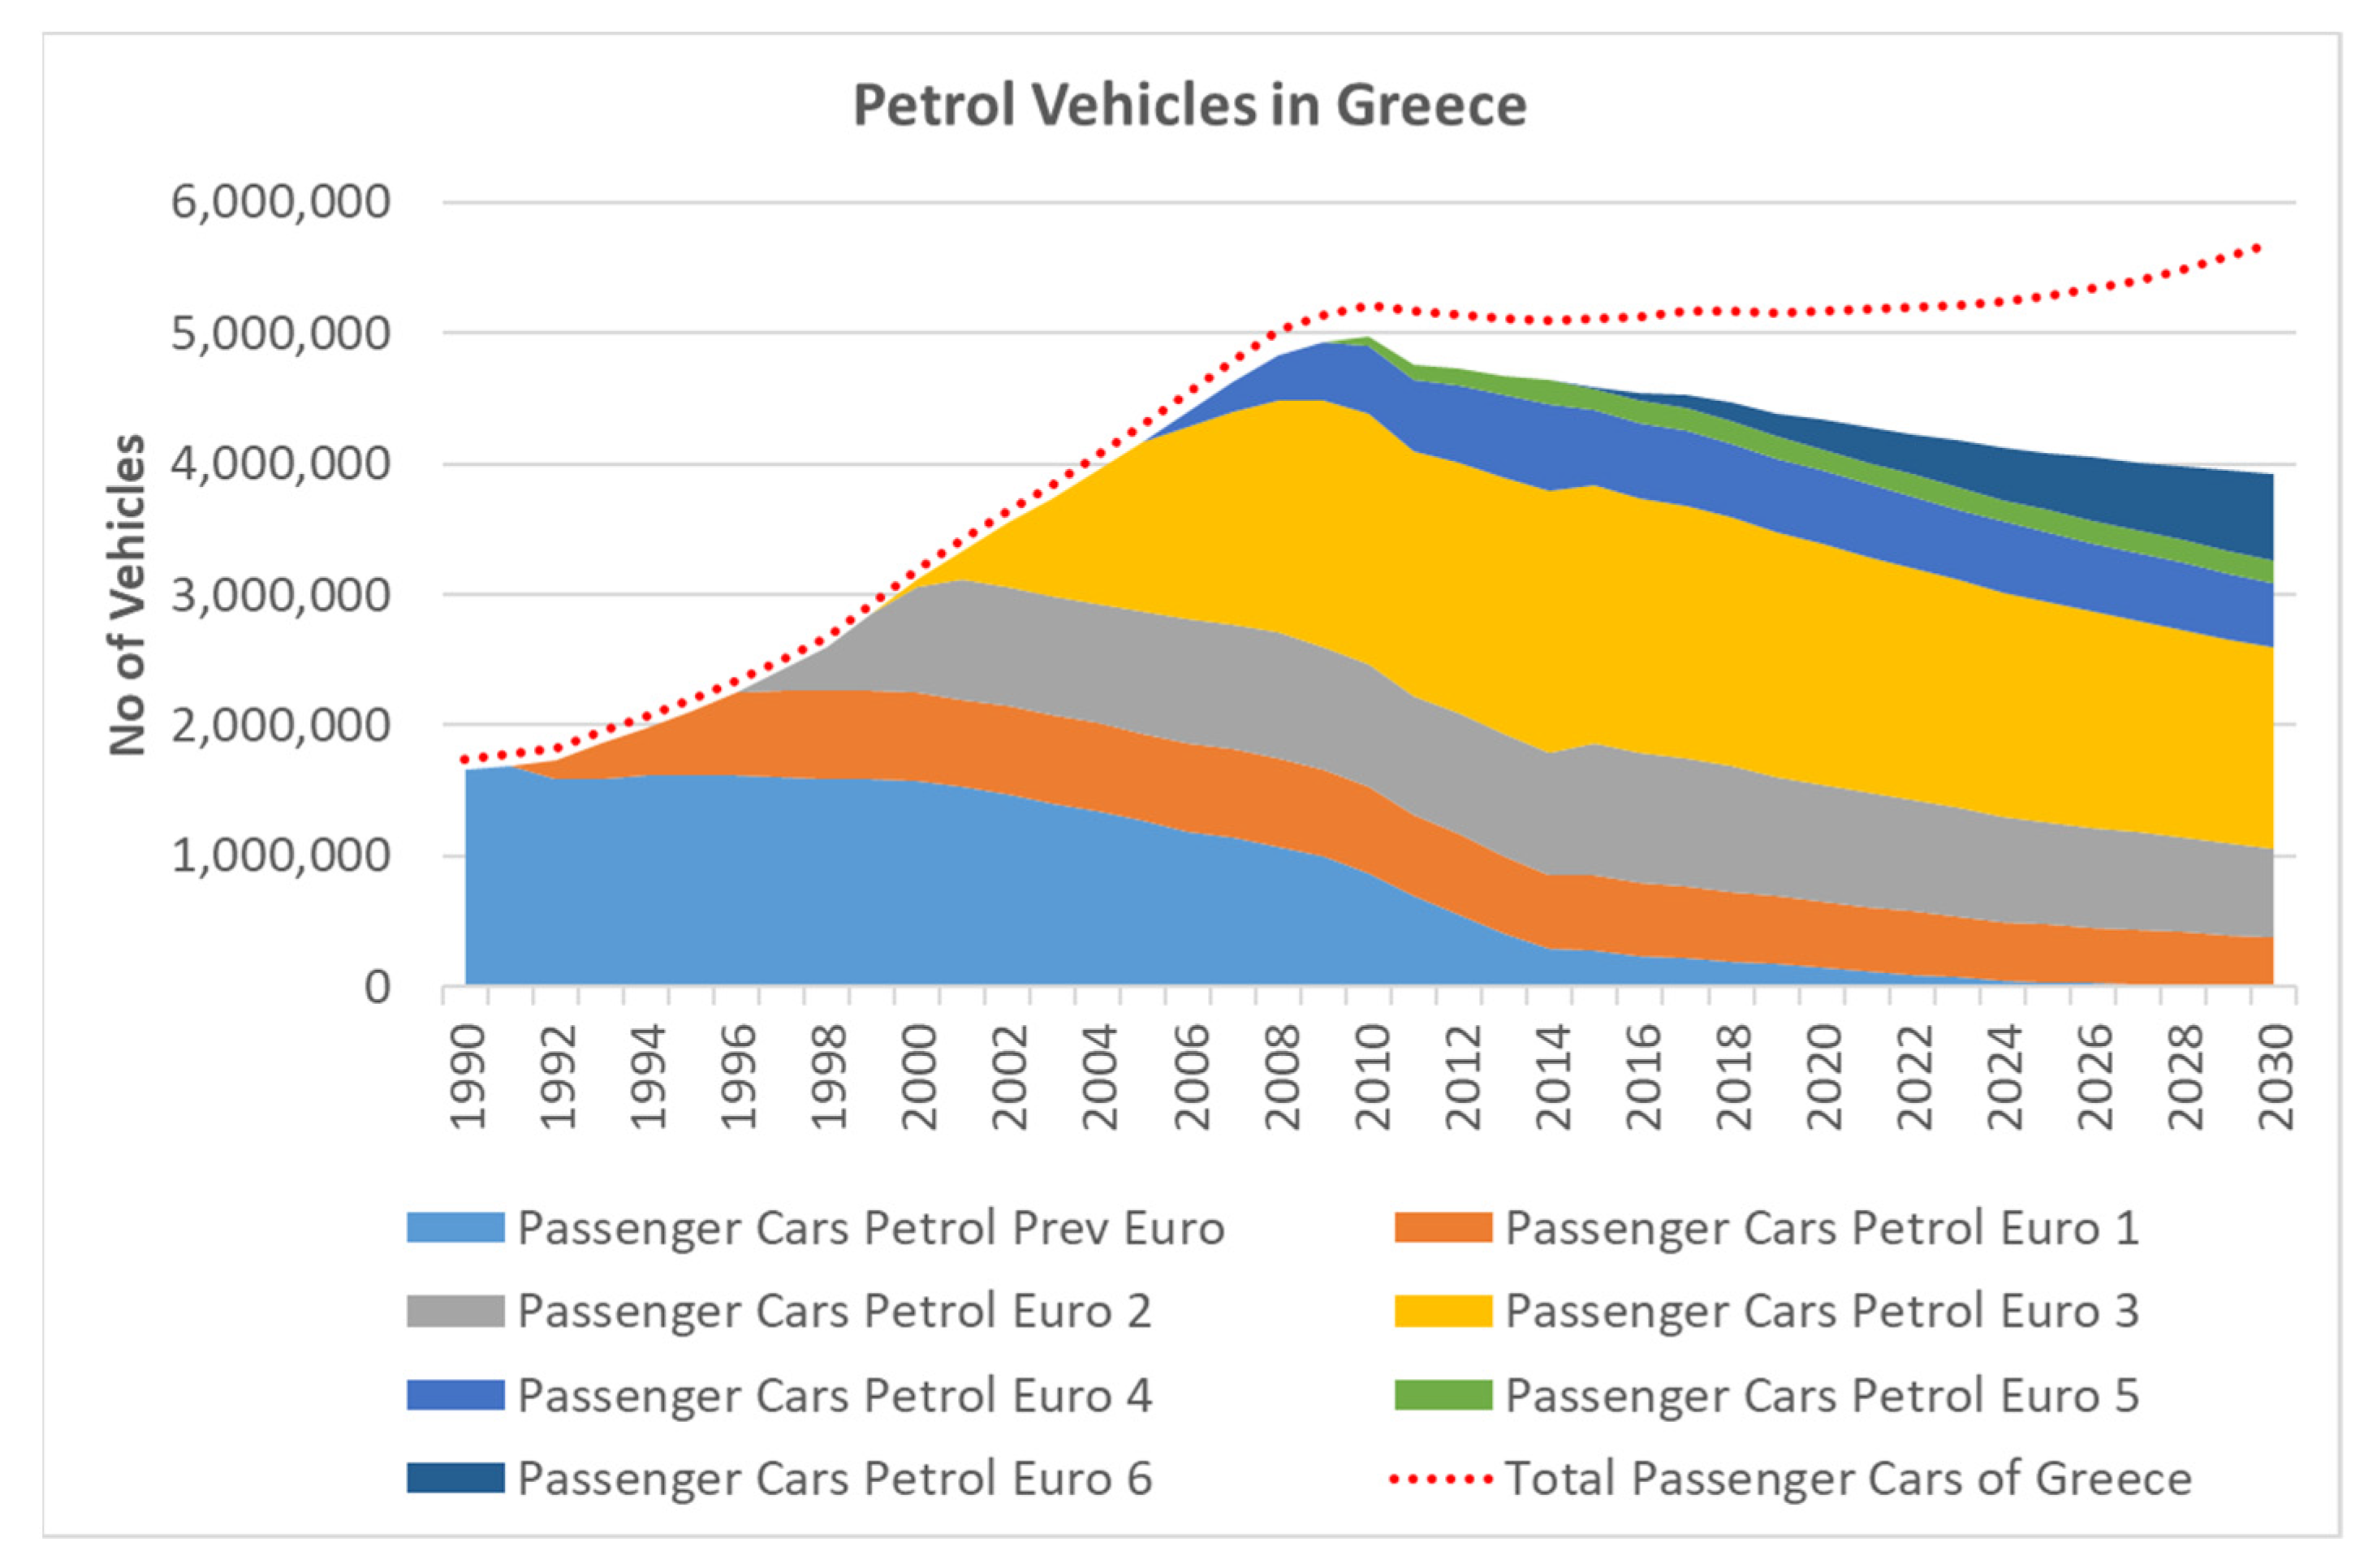
- Analyses and provides a classification for passenger vehicle fleet data for Greece during 1990–2018.
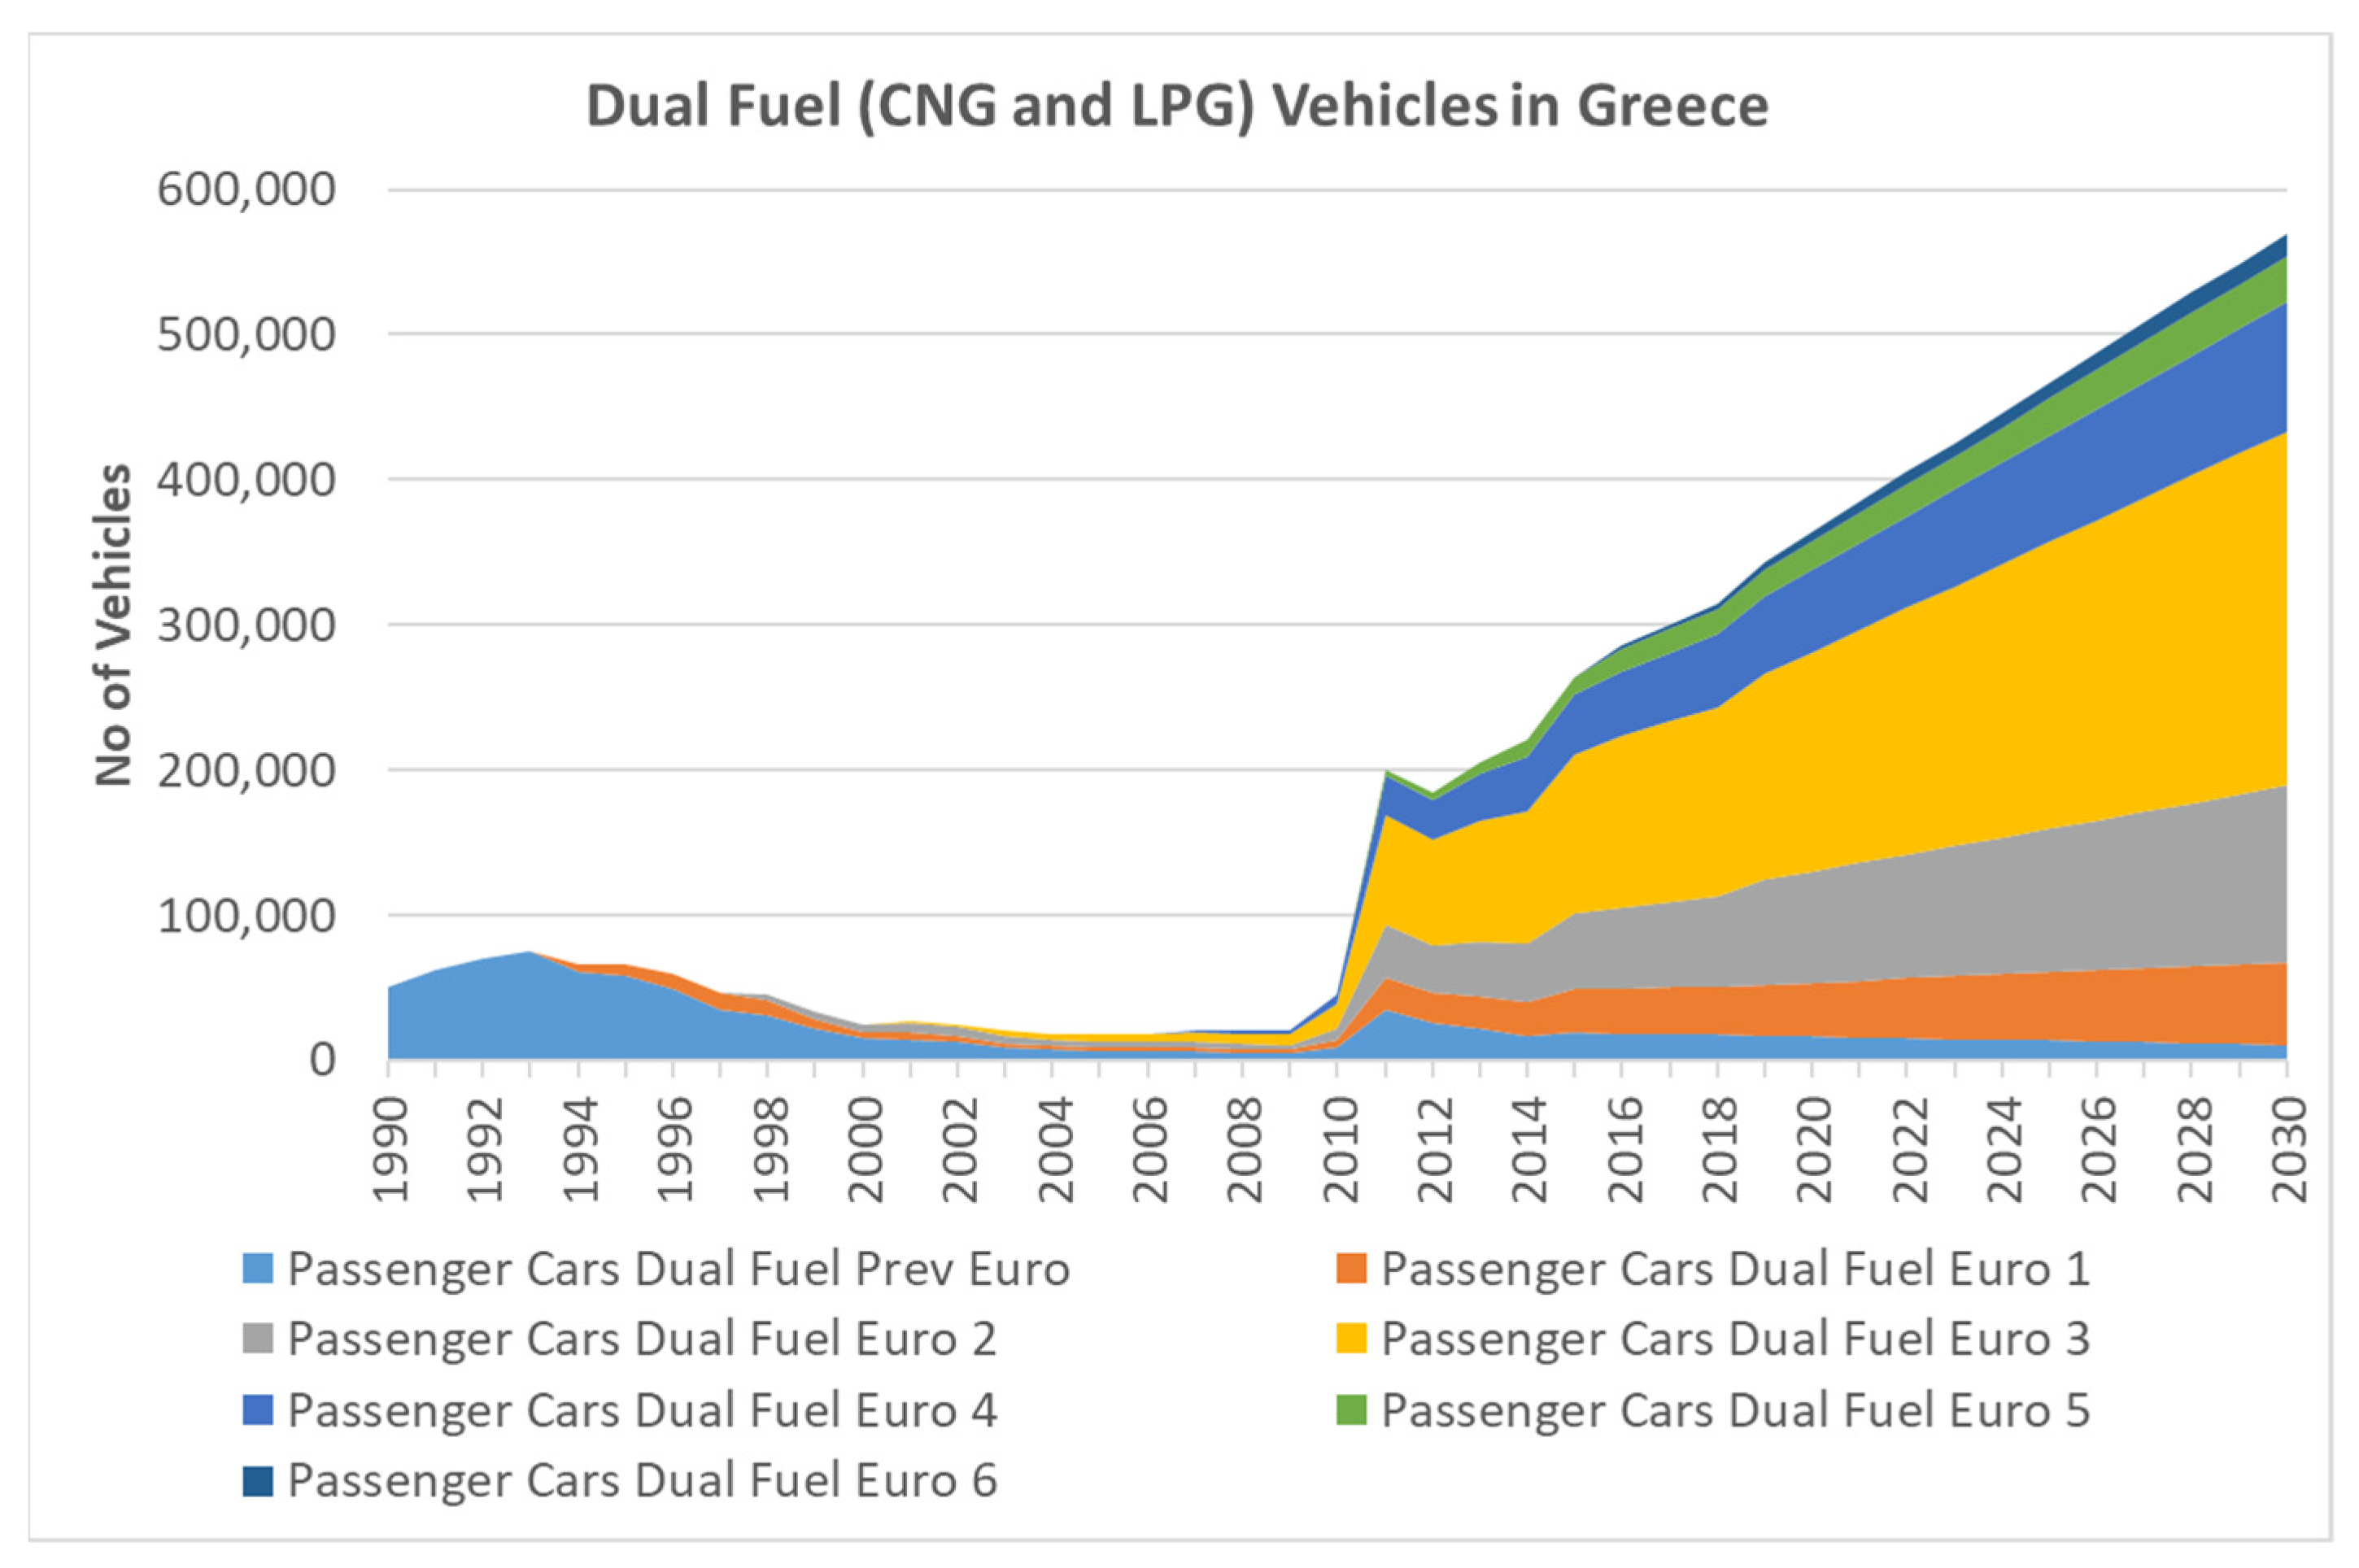
- Forecasts results for the Greek passenger vehicle fleet in 2030, opening up a analytic approach to vehicle mix insights.
- Generates annual emission factors for major air pollutants and CO2 up to 2030, deriving from each subcategory of the passenger vehicle, enabling scenario building for policy making.
- Estimates annual air pollution and CO2 emissions up to 2030 for each classified subcategory of passenger vehicle.
2. Materials and Methods
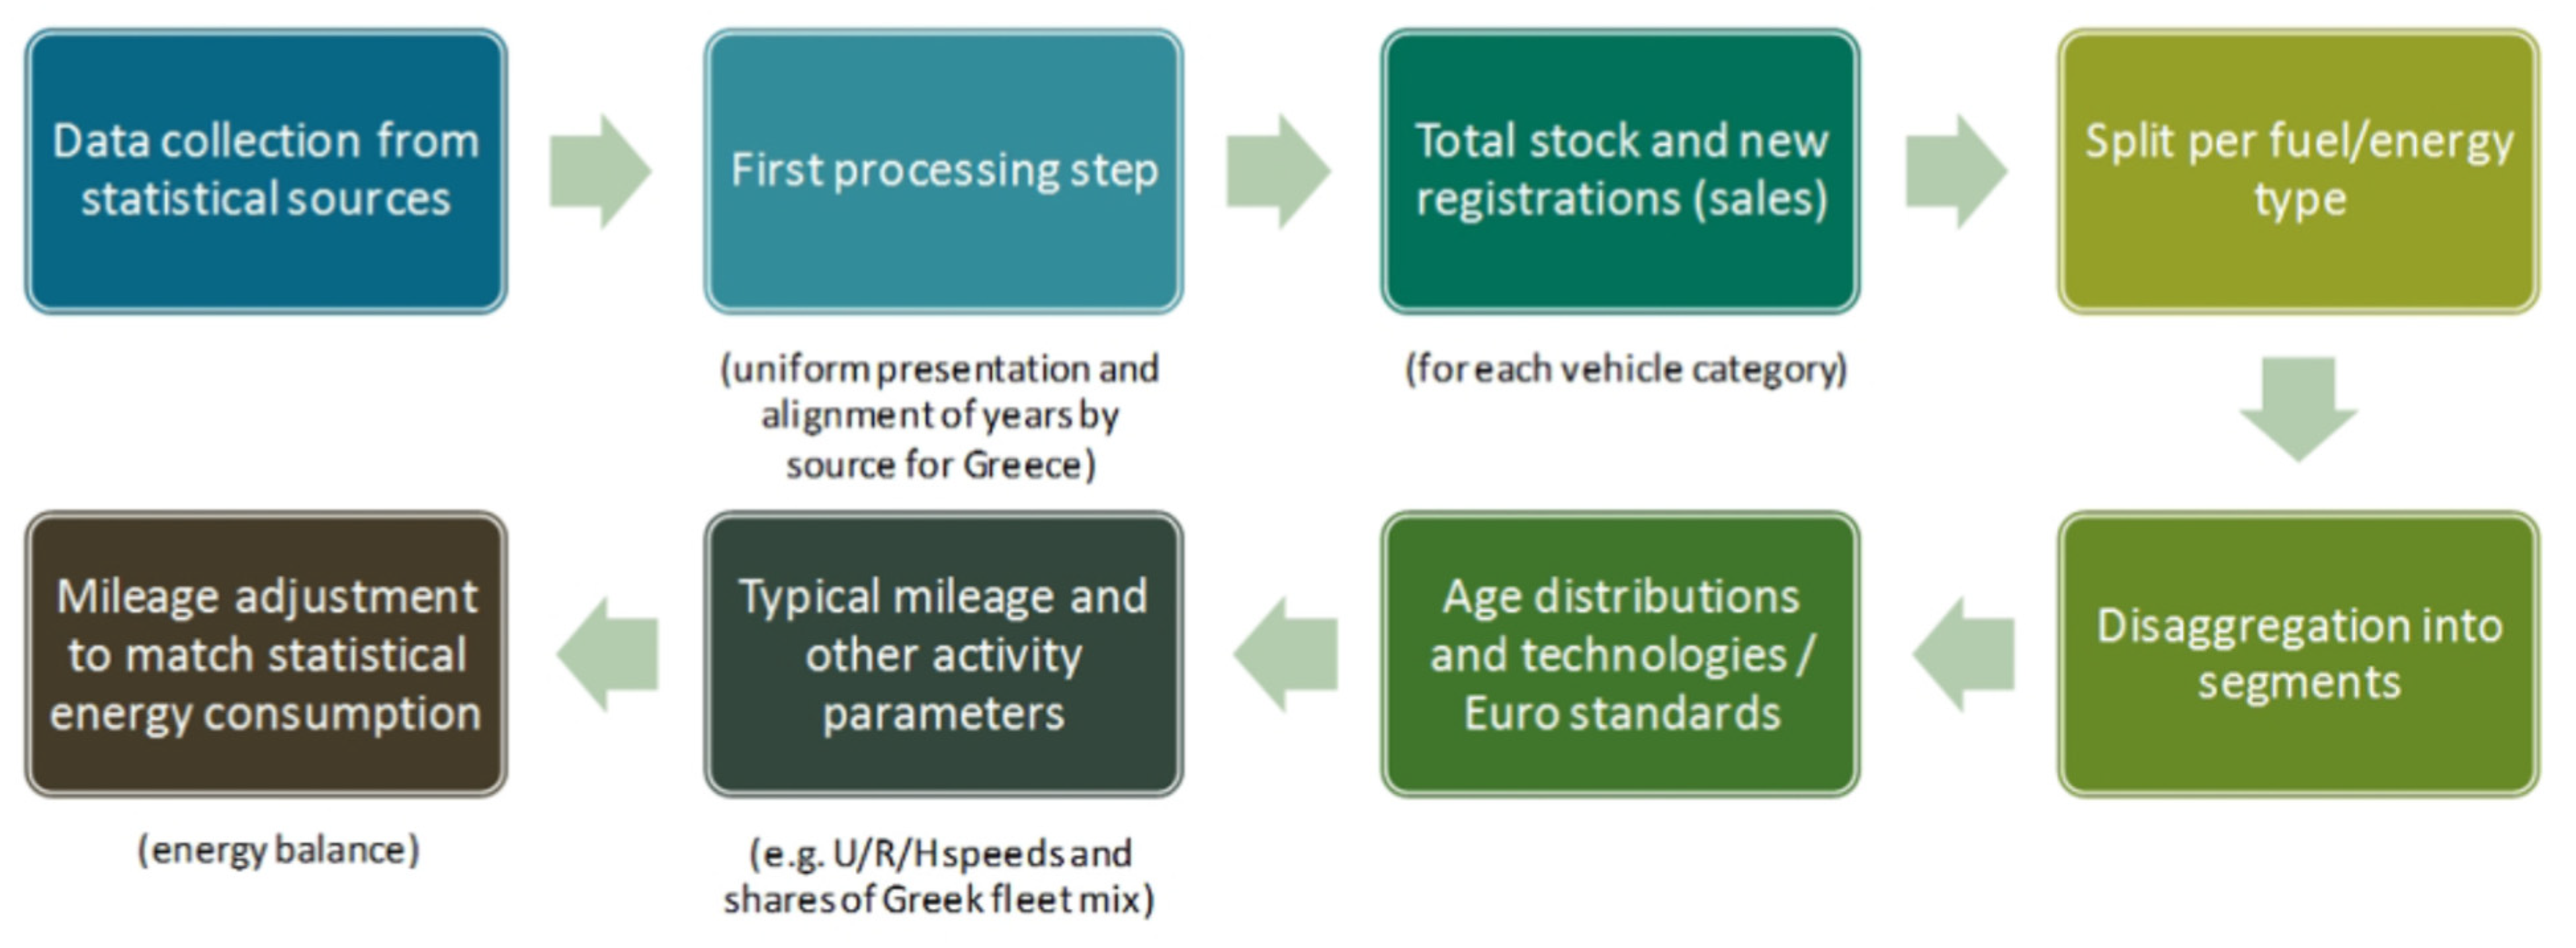
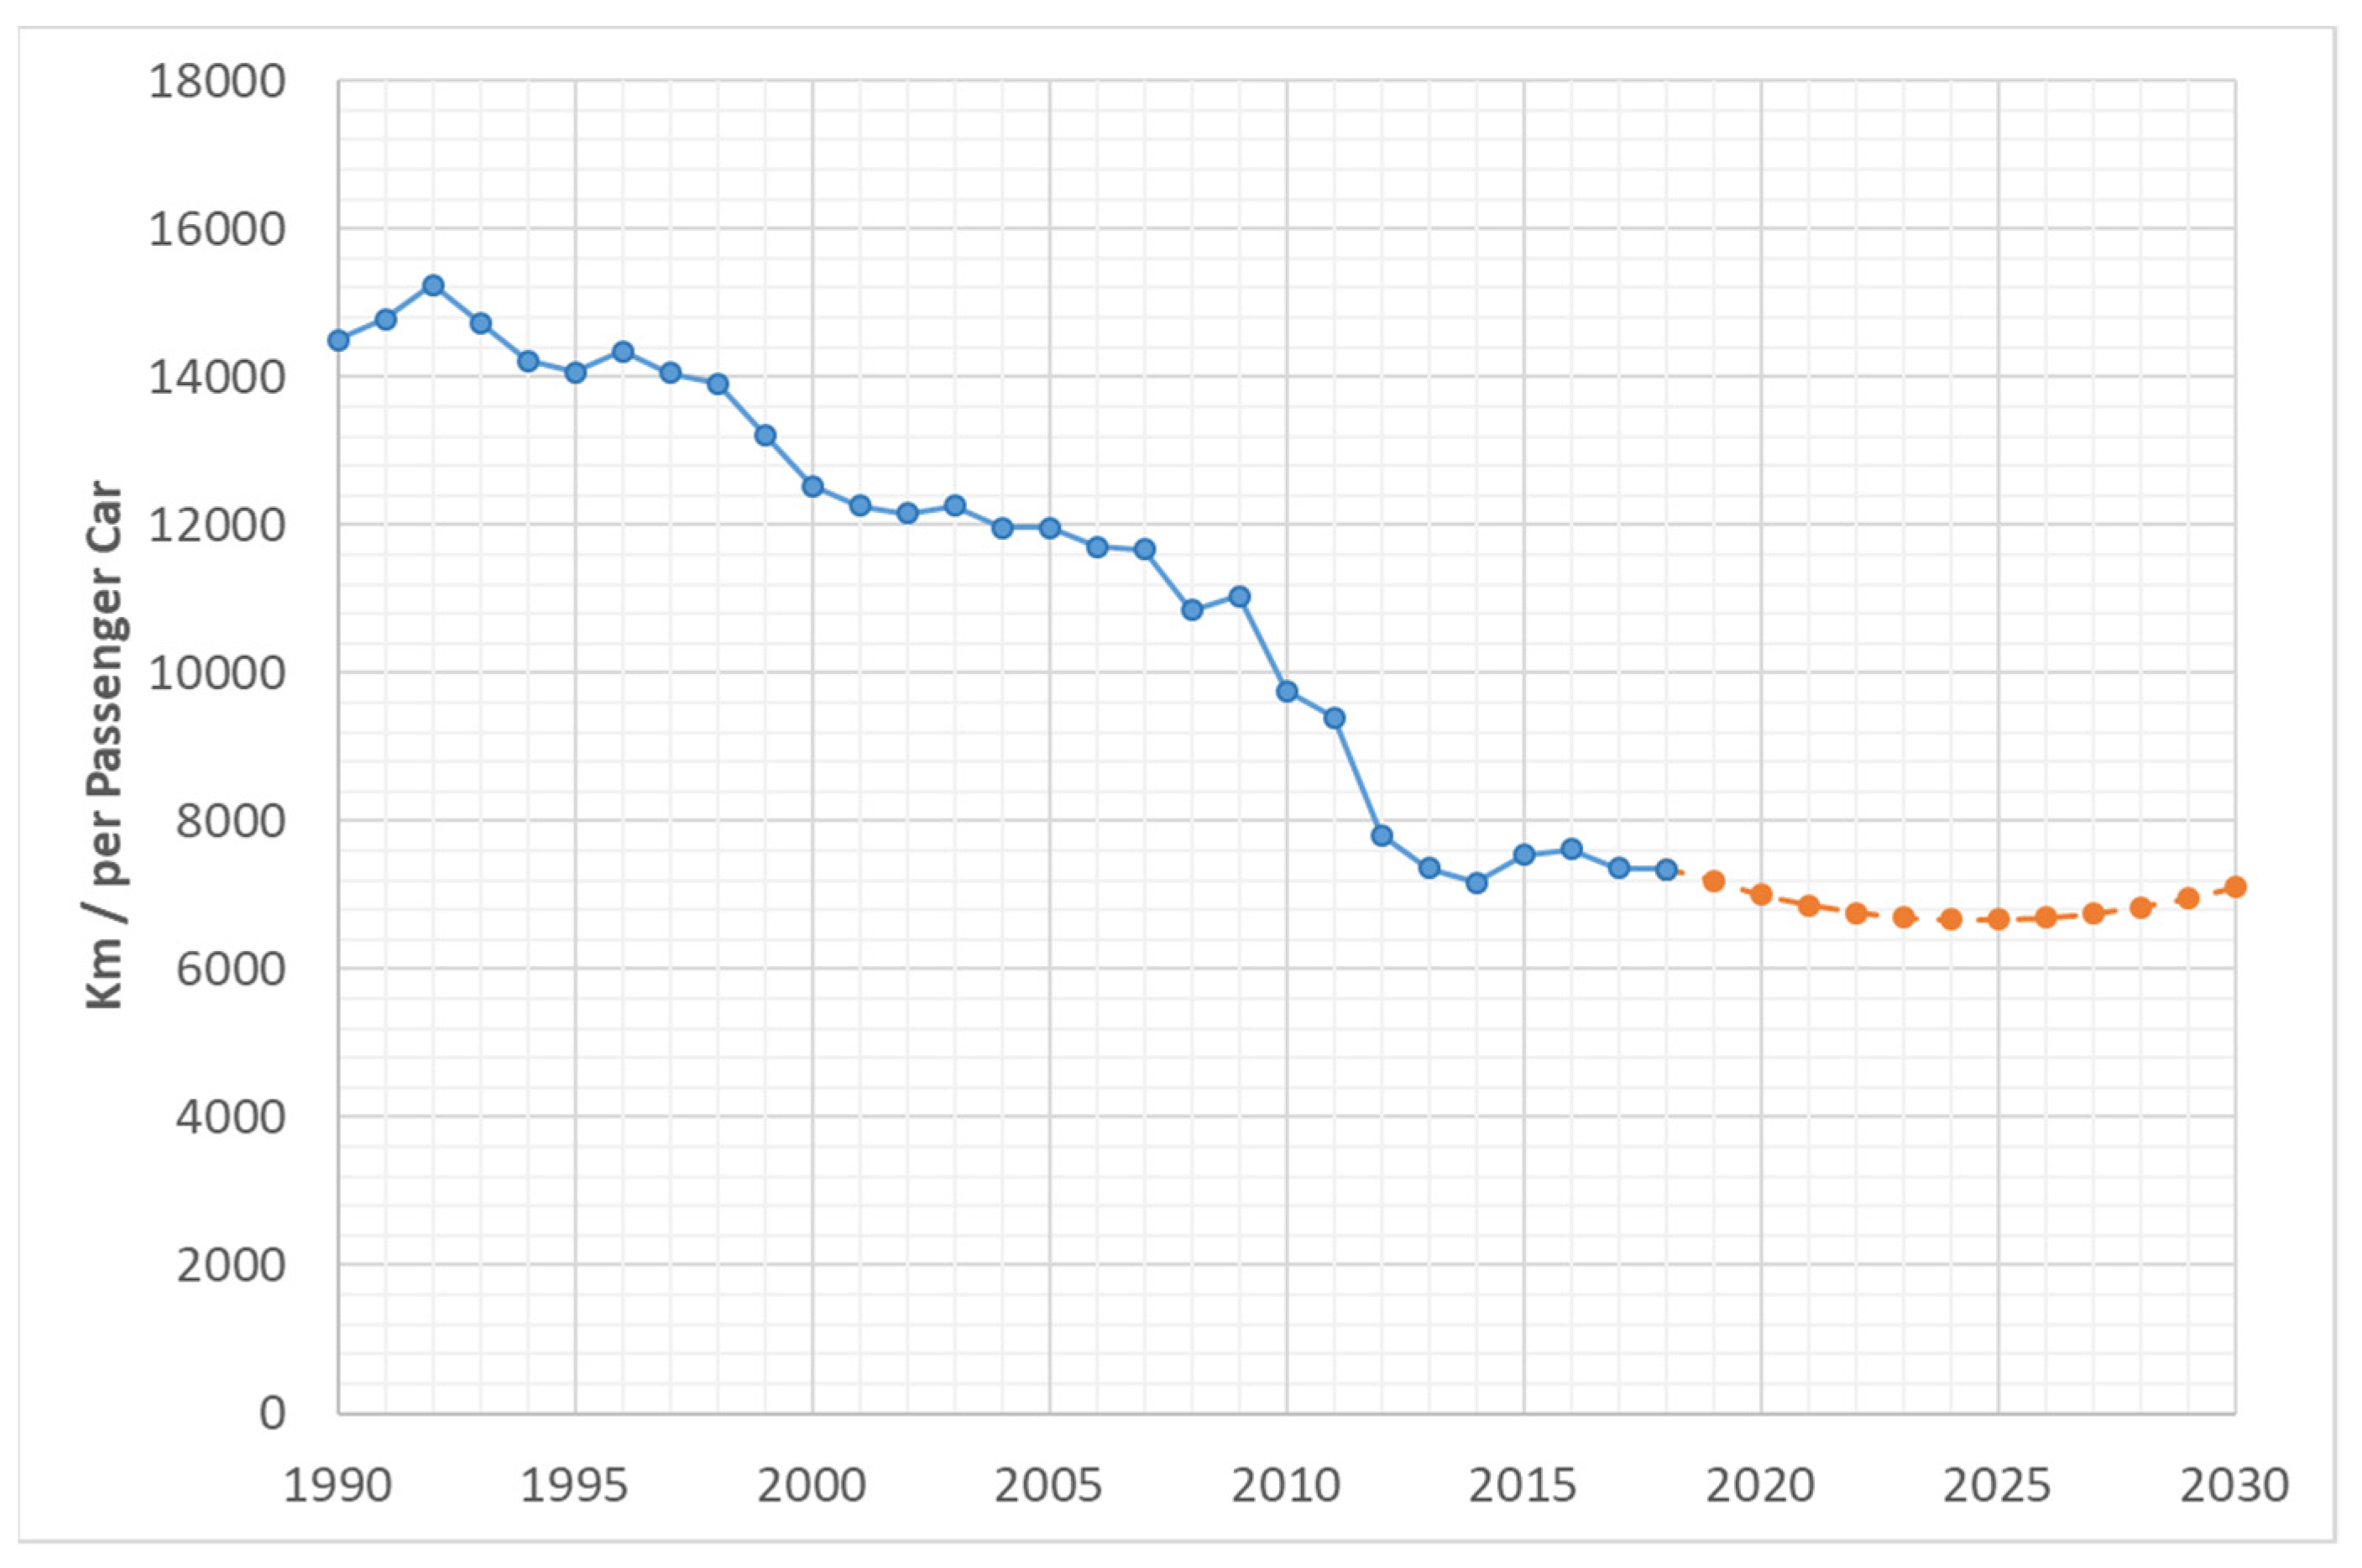
2.1. Mapping and Recording of Active Fleet
- The total EU passenger car fleet exceeded 242.7 million and had an average age of 11.5 years old, while the growing size of the fleet continued, with a rise of 1.8% compared to 2018. Alternative powered cars (Hybrid, LPG, Natural Gas, all types of electric cars) were just 4.6% of the total EU car fleet. The oldest vehicle fleets were in Lithuania (16.8 years old), Estonia (16.7 years old), Romania (16.5 years old), while Greece was in 4th place (16 years old), with an overall vehicle fleet of more than 6.4 million vehicles.
- The average vehicle ownership in the EU (motorization rates) corresponded to 569 cars per 1000 inhabitants, with Latvia having the lowest density (342 per 1000 inhabitants), Luxembourg had the highest (694 per 1000 inhabitants) and Greece had 489 cars per 1000 inhabitants, about 100 fewer than in 2018.
- 52.9% of all passenger cars in the EU used gasoline, while 42.3% used diesel. Another 0.8% were hybrid electric, 0.2% were exclusively electric, 0.2% were plug-in hybrids, and finally, the remaining 3.6% used natural gas, LPG, etc. Greece with more than 5.2 million passenger cars, differed significantly from any other country, and had the highest share (91.1%) in gasoline usage of all EU countries and the lowest share of diesel usage (8.1%), while the share of electric vehicles (all types) was at the level of 0.5%.
- There were more than 6.2 million medium and heavy-duty trucks in the EU, with an average age of 13 years. Notably, the oldest fleet operated in Greece, which had an average age of more than 21.2 years. Only 0.04% of all trucks in the EU had zero emissions, 97.8% ran on diesel and 1.3% on gasoline.
- The light commercial vehicles sector exceeded 28 million trucks, with an average age of 11.6 years, with 90% using diesel and only 0.3% being electric. Again, the oldest fleet operated in Greece, with an average age of 19.5 years.
- Finally, the bus sector that operated across the EU numbered 692,207 vehicles and had an average age of 11.7 years. A large percentage, in the order of 94.5%, relied on diesel fuel, while only 0.6% were electric, with the oldest EU bus fleet operating in Greece, with an average age of 19.9 years.
2.2. Models for the Estimation of Transportation Sector Pollutants
2.3. Vehicle Fleet Forecasting Scenarios
- Data collection and analysis: Requires data collection from cross-checked records and data cleaning for gaps and errors.
- Evaluation of demand parameters: Includes the identification and evaluation of internal and external parameters that might have a material impact to demand. Consideration will be given to technological development, political directives, affordability and others.
- Time horizon: Focus on near-term, mid-term and long-term demand forecasting.
- Forecasting evaluation: Forecasting scenarios will be evaluated as they are developed.
- (a).
- Qualitative forecasting methods such as Delphi, Market Research, Consensus Methods, Visionary Forecast Prediction and Historical Analogy.
- (b).
- Quantitative forecasting methods based on historical data with time series forecasting or causal models such as Multiple Regression Analysis, Econometric Models, Input-output Model, Economic Input-output Model and Leading Indicator Analysis.
- Vt = smoothened time series values Vt. For V0 = Y0 smoothened state of the time series estimates.
- α = data smoothing factor for values 0 ≤ α ≤ 1; Smoothing weight for the level of the time series, is estimated with MS Excel solver.
- t = time quantity as an annum, for t = 1 assume Y1 = V1 and subsequently t = 2, 3, …, n.
- Yt = the observed value at time.
- V′t = the smoothed values of the time series resulting from the application of the second smoothing.
- Fi,t+m = vehicle fleet i forecast for year t and every future time period m.
- αt = the estimated level at time t, .
- bt = the estimated trend at time t, .
3. Results
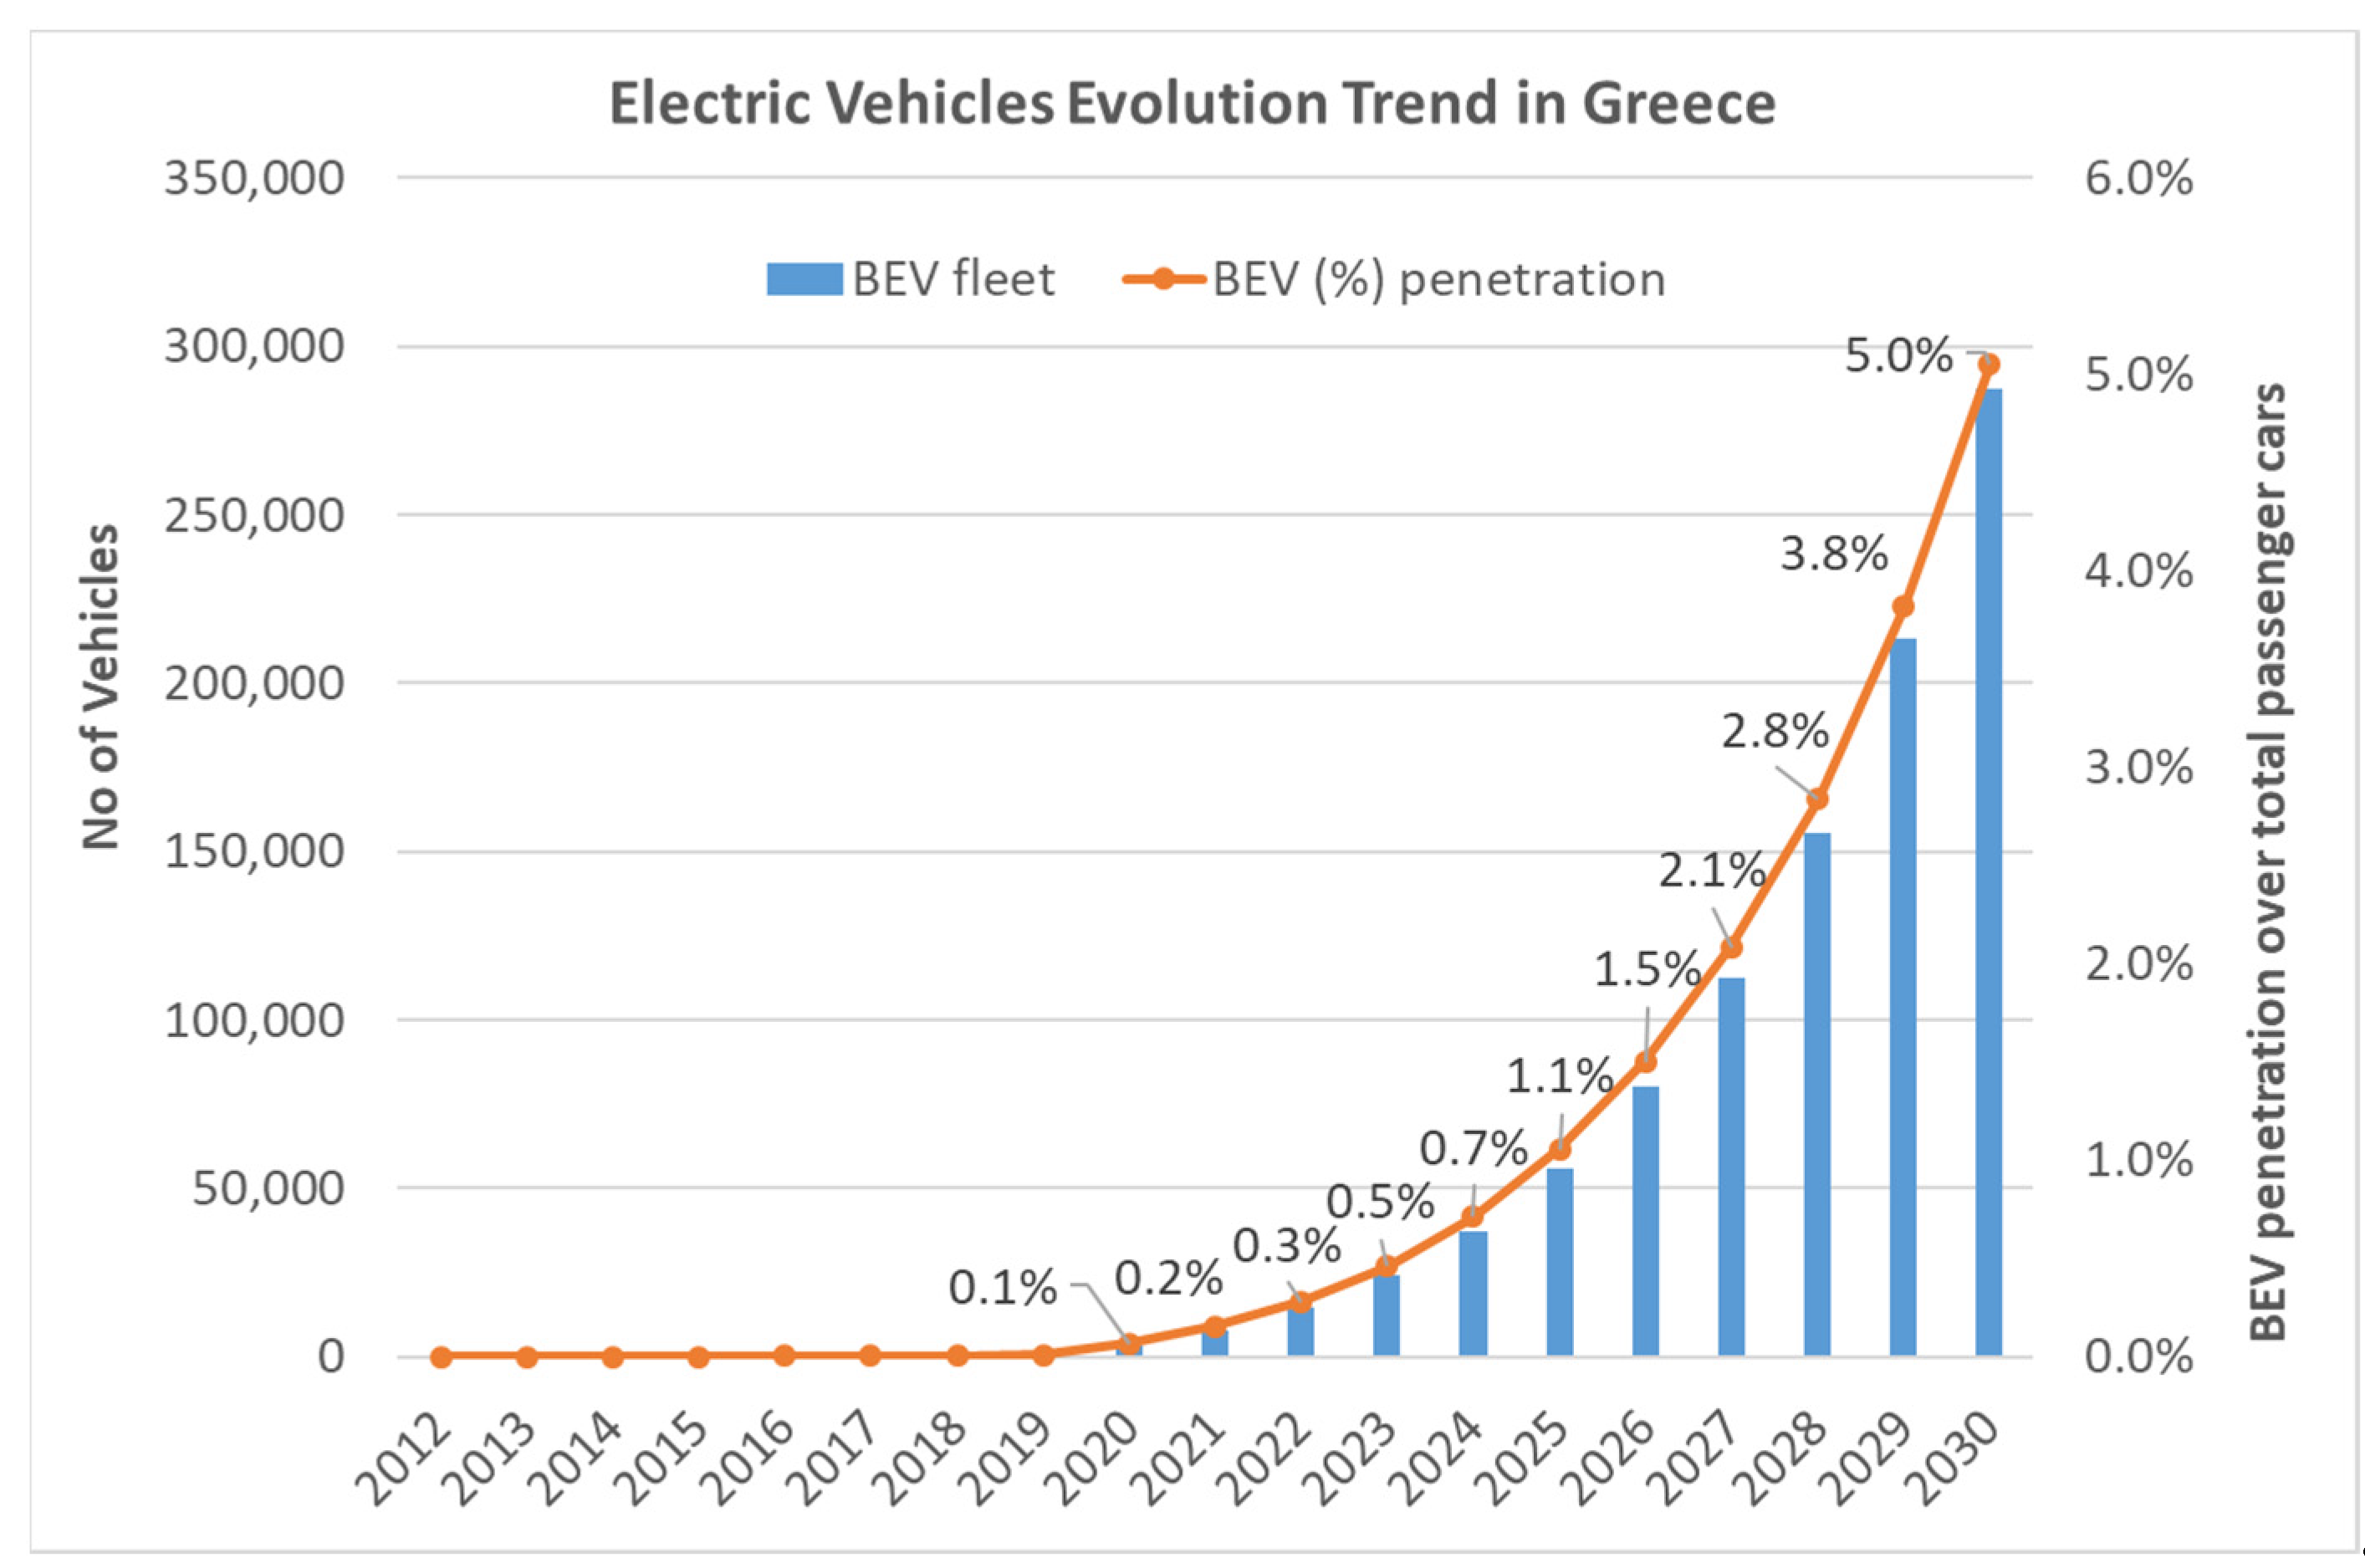
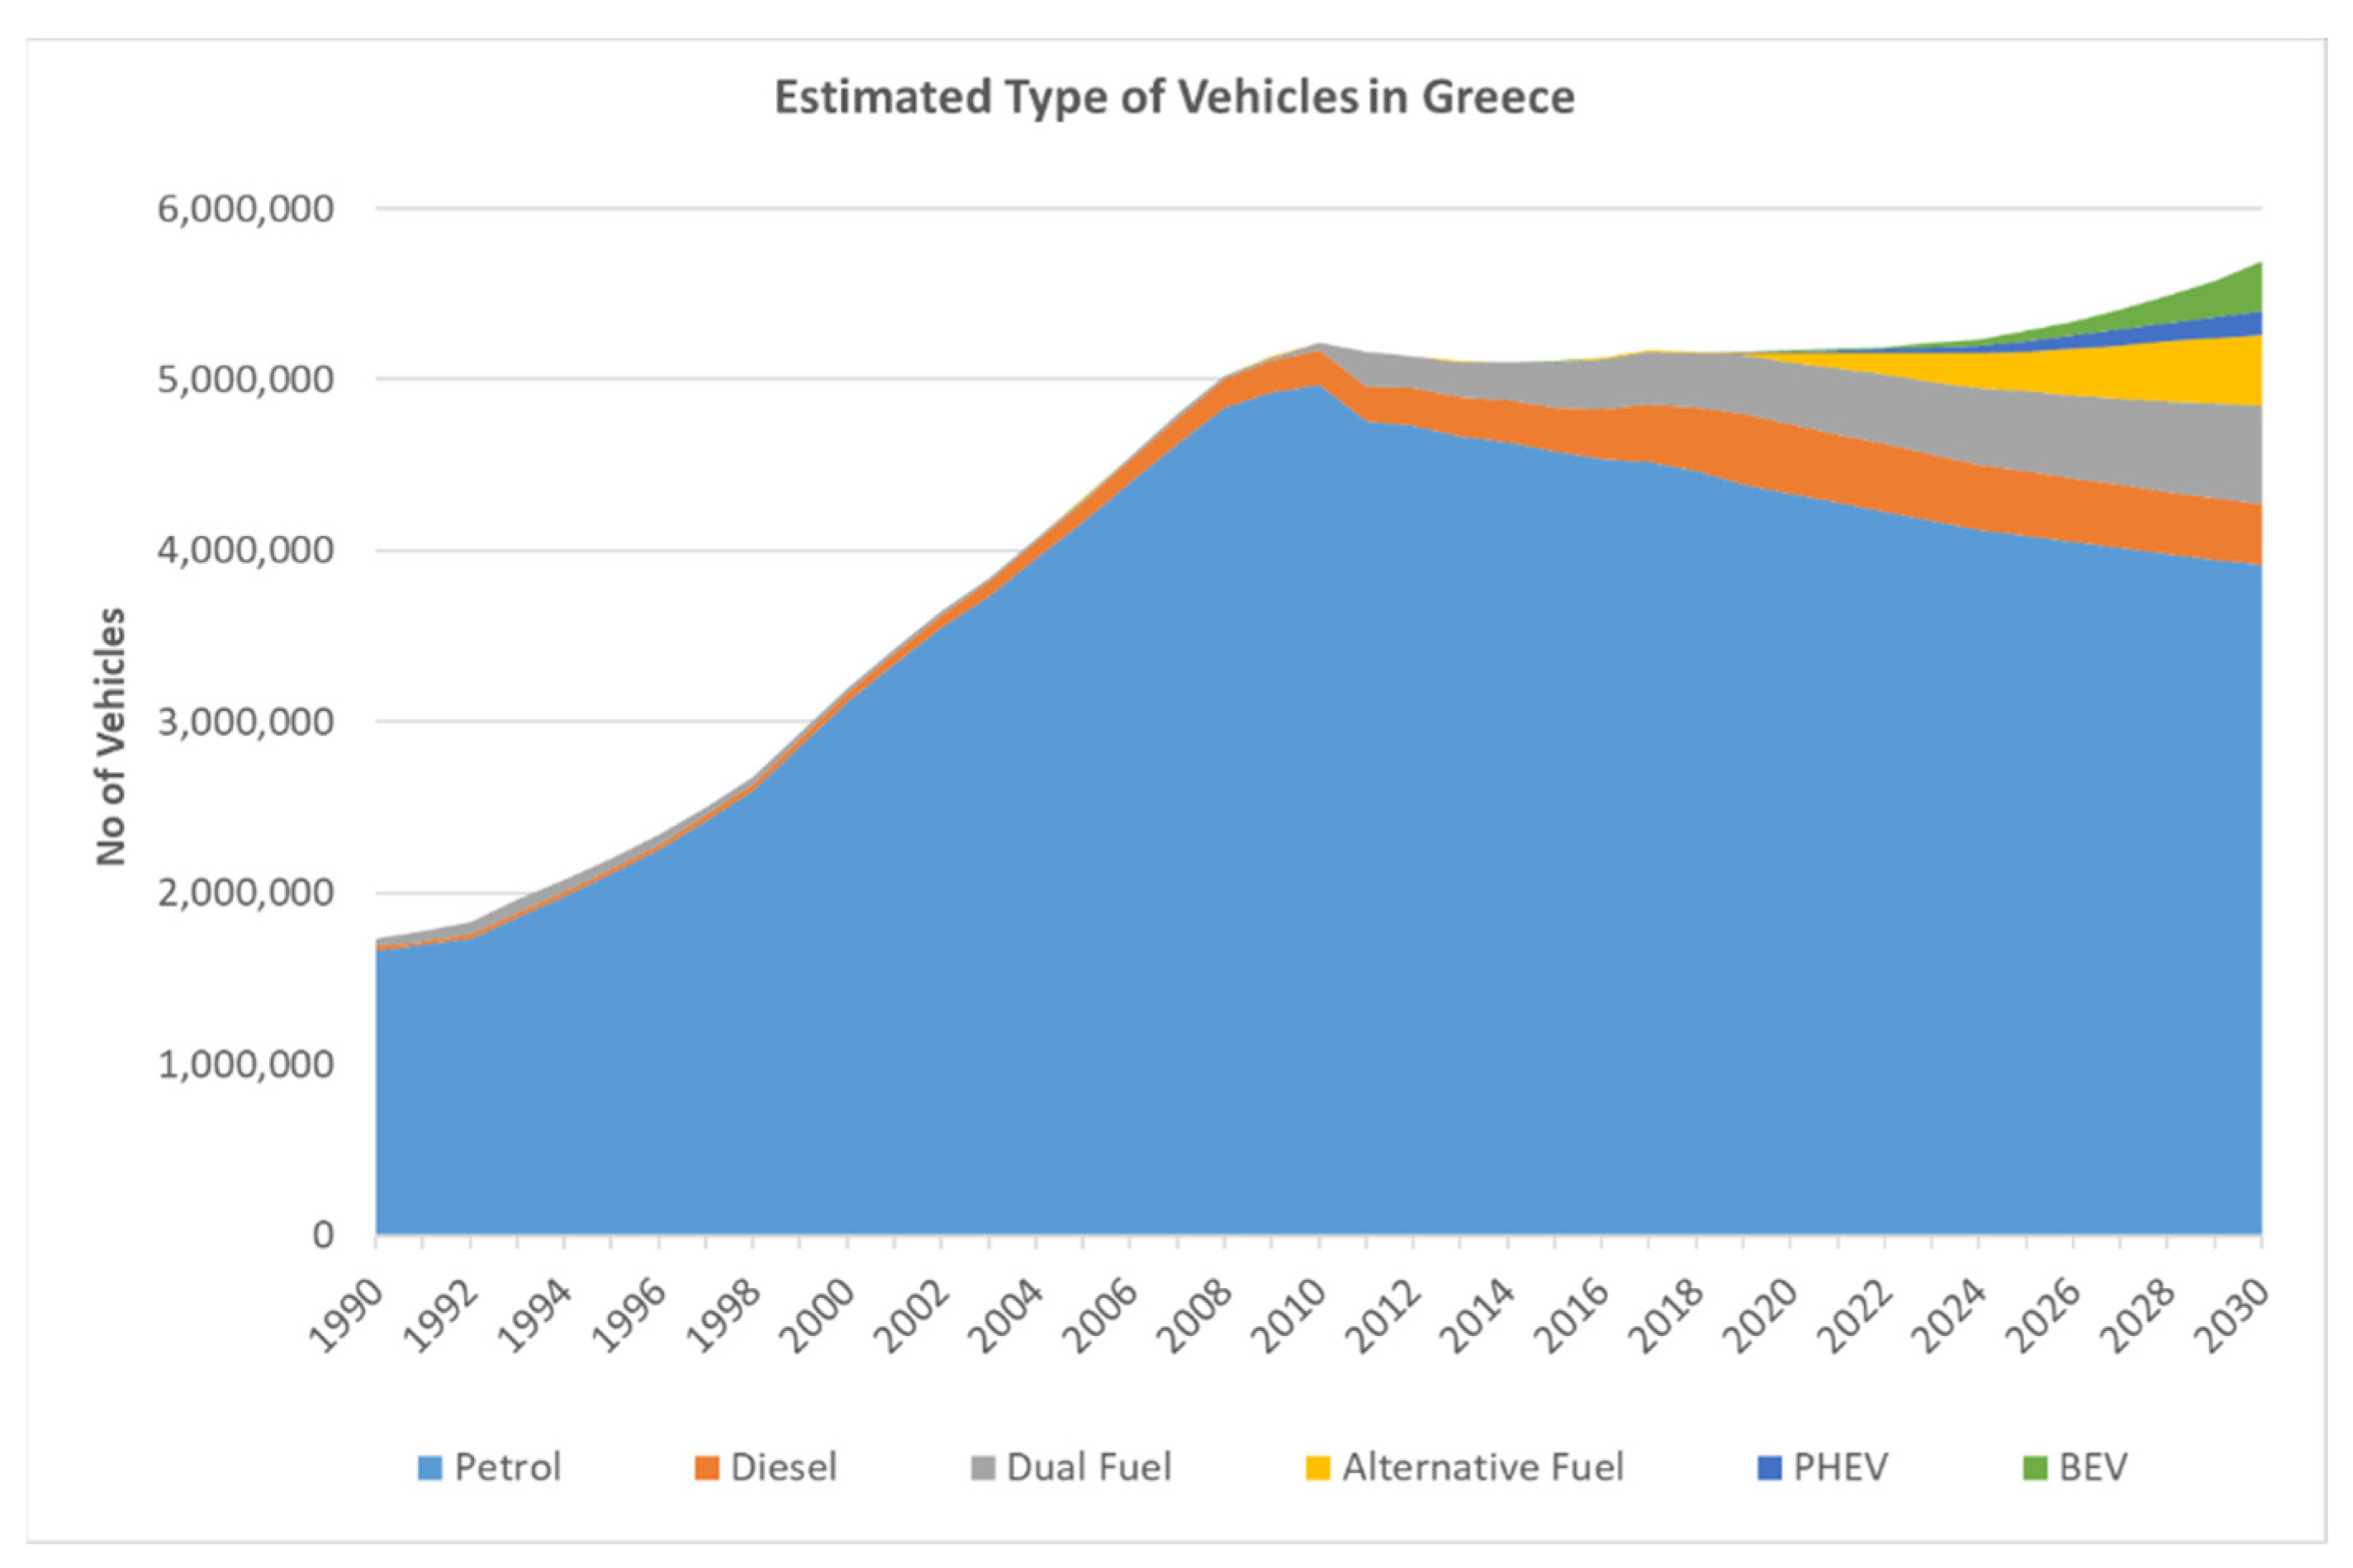
3.1. Forecasting of the Vehicle Fleet
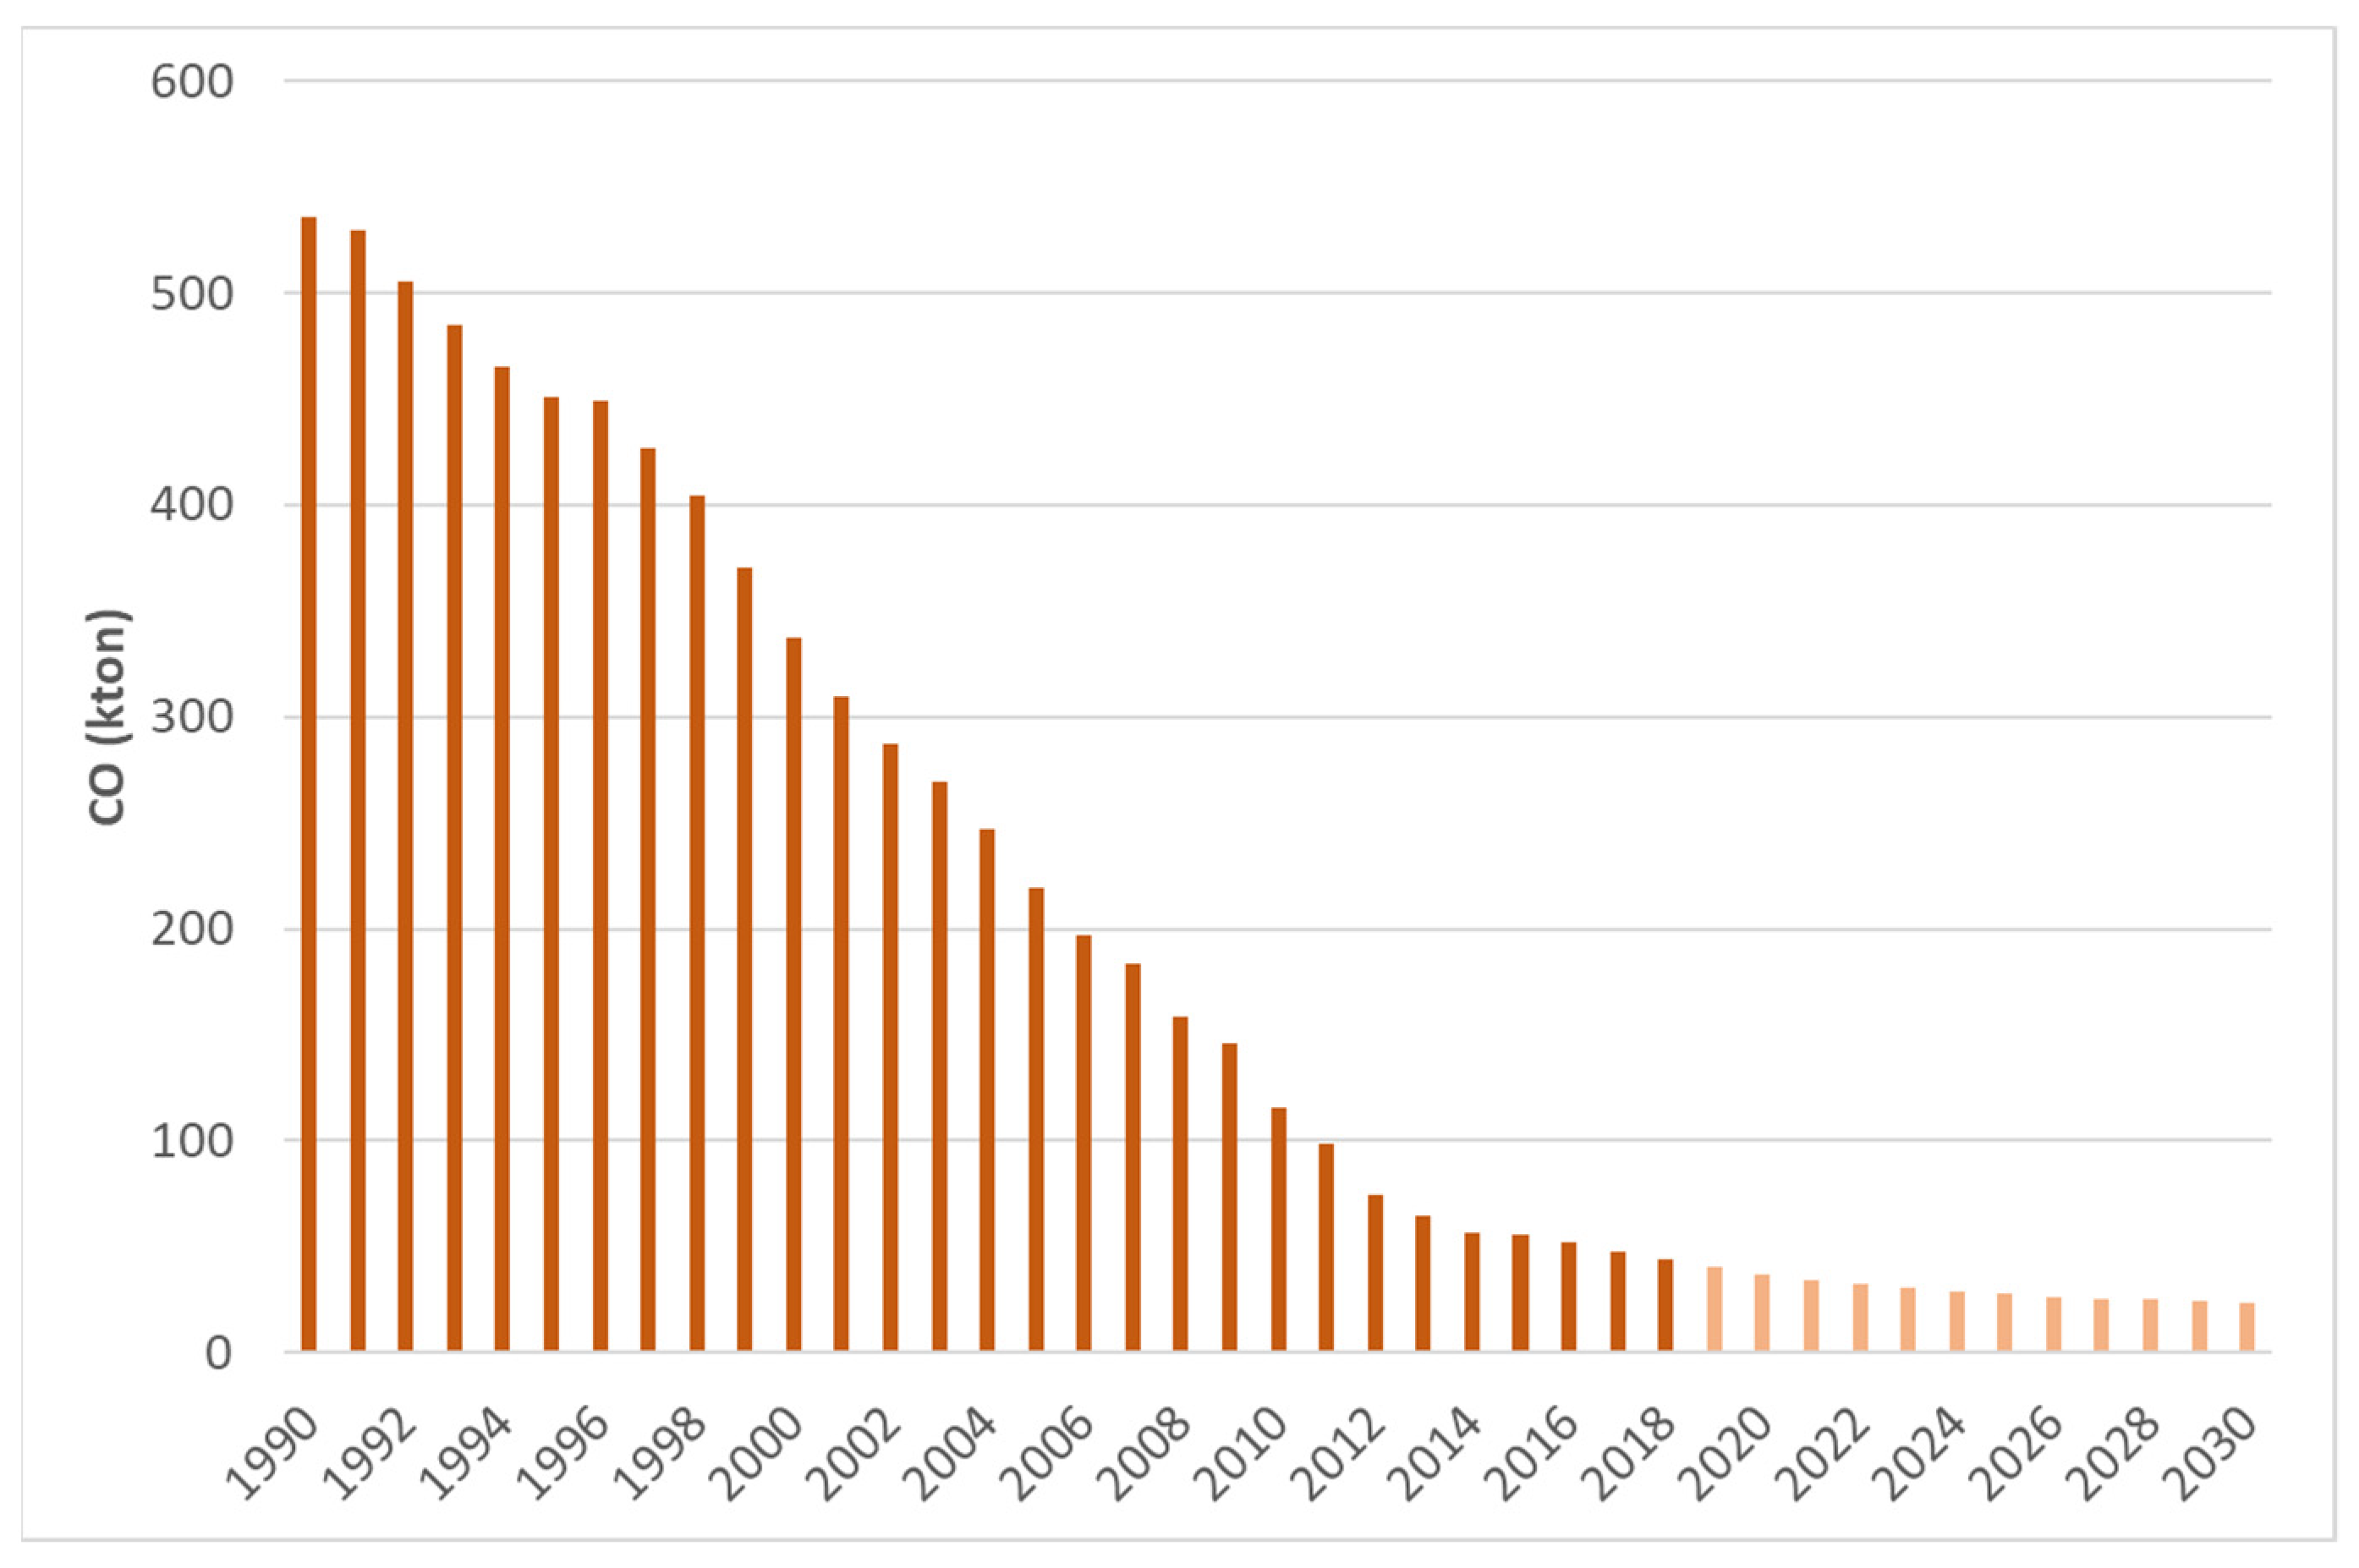
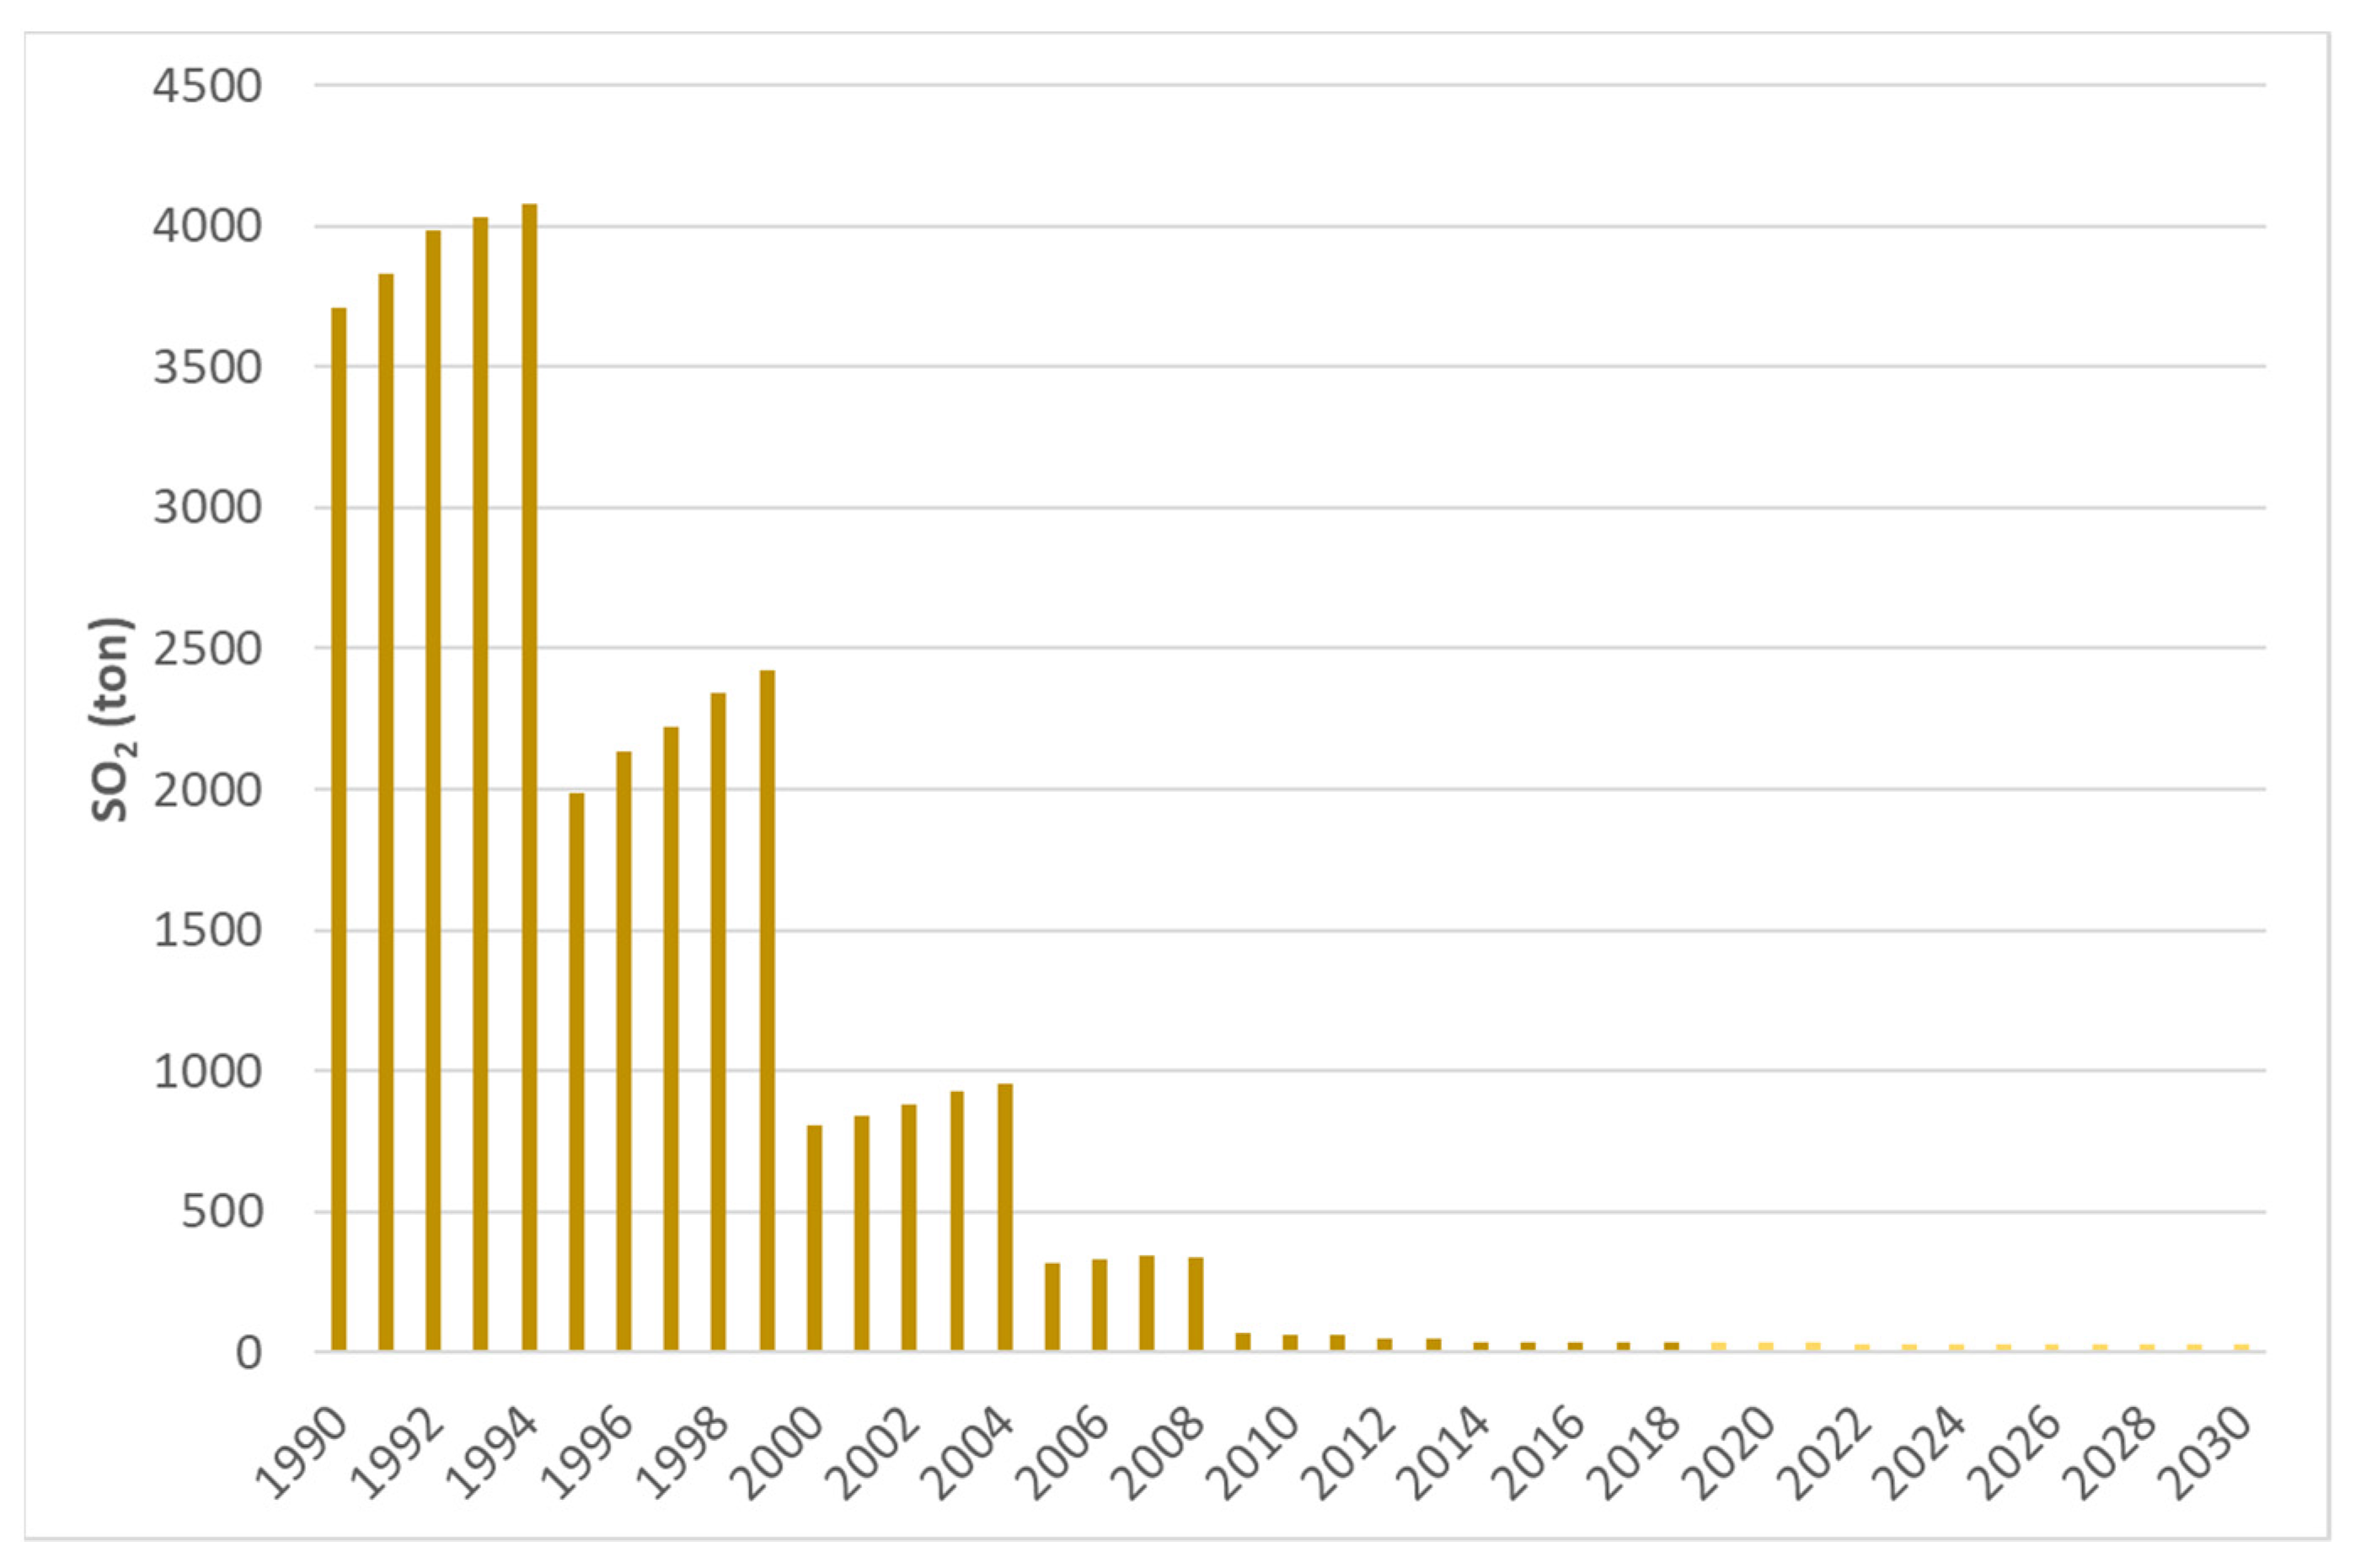
3.2. Prediction of Air Pollution Emissions
4. Discussion
5. Conclusions
Author Contributions
Funding
Data Availability Statement
Conflicts of Interest
References
- Ortiz, A.G.; Guerreiro, C.; Soares, J.; European Environment Agency. Air Quality in Europe: 2020 Report; European Environment Agency: København, Denmark, 2020; ISBN 978-92-9480-292-7. [Google Scholar]
- EEA. Greenhouse Gas Emissions from Transport in Europe—European Environment Agency. Available online: https://www.eea.europa.eu/data-and-maps/indicators/transport-emissions-of-greenhouse-gases-7/assessment (accessed on 10 October 2021).
- European Commission. Urban Europe: Statistics on Cities, Towns and Suburbs: 2016 Edition; Statistical Office of the European Union Publications Office: Luxembourg, 2016. [Google Scholar]
- Barter, P. Cars Are Parked 95% of the Time. Let’s Check! 2013. Available online: https://www.reinventingparking.org/2013/02/cars-are-parked-95-of-time-lets-check.html (accessed on 27 October 2021).
- Morris, D. Want to Know Why Uber and Automation Really Matter? Here’s Your Answer. Available online: https://fortune.com/2016/03/13/cars-parked-95-percent-of-time/ (accessed on 27 October 2021).
- Liu, L.; Miller, H.J.; Scheff, J. The impacts of COVID-19 pandemic on public transit demand in the United States. PLoS ONE 2020, 15, e0242476. [Google Scholar] [CrossRef] [PubMed]
- SES. Transport Experts: “The Road Network in Athens Attica Was Saturated Even before the Pandemic”. Available online: https://transportationgr.gr/sygkoinoniologoi-to-odiko-diktyo-sto-lekanopedio-itan-koresmeno-kai-prin-tin-pandimia/ (accessed on 10 November 2021).
- EIA. EIA Projects Global Conventional Vehicle Fleet Will Peak in 2038—Today in Energy—U.S. Available online: https://www.eia.gov/todayinenergy/detail.php?id=50096 (accessed on 16 November 2021).
- Dorocki, S.; Wantuch-Matla, D. Power Two-Wheelers as an Element of Sustainable Urban Mobility in Europe. Land 2021, 10, 618. [Google Scholar] [CrossRef]
- Colvile, R.N.; Hutchinson, E.J.; Mindell, J.S.; Warren, R.F. The transport sector as a source of air pollution. Atmos. Environ. 2001, 35, 1537–1565. [Google Scholar] [CrossRef] [Green Version]
- Belis, C.A.; Karagulian, F.; Larsen, B.R.; Hopke, P.K. Critical review and meta-analysis of ambient particulate matter source apportionment using receptor models in Europe. Atmos. Environ. 2013, 69, 94–108. [Google Scholar] [CrossRef]
- Soret, A.; Guevara, M.; Baldasano, J.M. The potential impacts of electric vehicles on air quality in the urban areas of Barcelona and Madrid (Spain). Atmos. Environ. 2014, 99, 51–63. [Google Scholar] [CrossRef]
- Ayalon, O.; Flicstein, B.; Shtibelman, A. Benefits of Reducing Air Emissions: Replacing Conventional with Electric Passenger Vehicles. JEP 2013, 4, 1035–1043. [Google Scholar] [CrossRef] [Green Version]
- Spyropoulos, G.C.; Nastos, P.T.; Moustris, K.P. Performance of Aether Low-Cost Sensor Device for Air Pollution Measurements in Urban Environments. Accuracy Evaluation Applying the Air Quality Index (AQI). Atmosphere 2021, 12, 1246. [Google Scholar] [CrossRef]
- Pistoia, G. Electric and Hybrid Vehicles: Power Sources, Models, Sustainability, Infrastructure and the Market, 1st ed.; Elsevier: Amsterdam, The Netherlands, 2010; ISBN 978-0-444-53565-8. [Google Scholar]
- Kostopoulos, E.; Spyropoulos, G.; Christopoulos, K.; Kaldellis, J.K. Solar energy contribution to an electric vehicle needs on the basis of long-term measurements. Procedia Struct. Integr. 2018, 10, 203–210. [Google Scholar] [CrossRef]
- Che, W.; Zheng, J.; Wang, S.; Zhong, L.; Lau, A. Assessment of motor vehicle emission control policies using Model-3/CMAQ model for the Pearl River Delta region, China. Atmos. Environ. 2011, 45, 1740–1751. [Google Scholar] [CrossRef]
- Gonçalves, M.; Jiménez-Guerrero, P.; Baldasano, J.M. High resolution modeling of the effects of alternative fuels use on urban air quality: Introduction of natural gas vehicles in Barcelona and Madrid Greater Areas (Spain). Sci. Total Environ. 2009, 407, 776–790. [Google Scholar] [CrossRef]
- Stephens-Romero, S.; Carreras-Sospedra, M.; Brouwer, J.; Dabdub, D.; Samuelsen, S. Determining Air Quality and Greenhouse Gas Impacts of Hydrogen Infrastructure and Fuel Cell Vehicles. Environ. Sci. Technol. 2009, 43, 9022–9029. [Google Scholar] [CrossRef] [Green Version]
- Liaquat, A.M.; Kalam, M.A.; Masjuki, H.H.; Jayed, M.H. Potential emissions reduction in road transport sector using biofuel in developing countries. Atmos. Environ. 2010, 44, 3869–3877. [Google Scholar] [CrossRef]
- Baldasano, J.M.; Gonçalves, M.; Soret, A.; Jiménez-Guerrero, P. Air pollution impacts of speed limitation measures in large cities: The need for improving traffic data in a metropolitan area. Atmos. Environ. 2010, 44, 2997–3006. [Google Scholar] [CrossRef]
- Jones, B.; Elliott, R.J.R.; Nguyen-Tien, V. The EV revolution: The road ahead for critical raw materials demand. Appl. Energy 2020, 280, 115072. [Google Scholar] [CrossRef]
- Hopkins, J.L.; McKay, J. Investigating ‘anywhere working’ as a mechanism for alleviating traffic congestion in smart cities. Technol. Forecast. Soc. Change 2019, 142, 258–272. [Google Scholar] [CrossRef]
- Sanchez, T.W. Exploring the Relationship between Combined Household Housing and Transportation Costs and Regional Economic Activity in Virginia. Land 2021, 10, 742. [Google Scholar] [CrossRef]
- Valavanidis, A.; Vlachogianni, T.; Loridas, S.; Fiotakis, C. Atmospheric Pollution in Urban Areas of Greece and Economic Crisis. Trends in Air Quality and Atmospheric Pollution Data, Research and Adverse Health Effects. 2015. Available online: https://www.researchgate.net/publication/284415702 (accessed on 17 November 2021).
- De Sousa Silva, C.; Viegas, I.; Panagopoulos, Τ.; Bell, S. Environmental Justice in Accessibility to Green Infrastructure in Two European Cities. Land 2018, 7, 134. [Google Scholar] [CrossRef] [Green Version]
- Symeonidis, P.; Ziomas, I.; Proyou, A. Emissions of air pollutants from the road transport sector in Greece: Year to year variation and present situation. Environ. Technol. 2003, 24, 719–726. [Google Scholar] [CrossRef] [PubMed]
- IEA. EMEP/CORINAIR Atmospheric Emission Inventory Guidebook. Available online: https://www.eea.europa.eu/publications/EMEPCORINAIR/page005.html (accessed on 17 November 2021).
- Poupkou, A.; Symeonidis, P.; Ziomas, I.; Melas, D.; Markakis, K. A Spatially and Temporally Disaggregated Anthropogenic Emission Inventory in the Southern Balkan Region. Water Air Soil Pollut. 2007, 185, 335–348. [Google Scholar] [CrossRef]
- Symeonidis, P.; Ziomas, I.; Proyou, A. Development of an emission inventory system from transport in Greece. Environ. Model. Softw. 2004, 19, 413–421. [Google Scholar] [CrossRef]
- Aleksandropoulou, V.; Lazaridis, M. Spatial Distribution of Gaseous And Particulate Matter Emissions in Greece. Water Air Soil Pollut. 2004, 153, 15–34. [Google Scholar] [CrossRef]
- Aleksandropoulou, V.; Torseth, K.; Lazaridis, M. Atmospheric Emission Inventory for Natural and Anthropogenic Sources and Spatial Emission Mapping for the Greater Athens Area. Water Air Soil Pollut. 2011, 219, 507–526. [Google Scholar] [CrossRef]
- Markakis, K.; Poupkou, A.; Melas, D.; Tzoumaka, P.; Petrakakis, M. A Computational Approach Based on GIS Technology for the Development of an Anthropogenic Emission Inventory of Gaseous Pollutants in Greece. Water Air Soil Pollut. 2010, 207, 157–180. [Google Scholar] [CrossRef]
- Progiou, A.; Ziomas, I. Twenty-Year Road Traffic Emissions Trend in Greece. Water Air Soil Pollut. 2012, 223, 305–317. [Google Scholar] [CrossRef]
- Progiou, A.G.; Ziomas, I.C. Road traffic emissions impact on air quality of the Greater Athens Area based on a 20year emissions inventory. Sci. Total Environ. 2011, 410–411, 1–7. [Google Scholar] [CrossRef]
- Fameli, K.-M.; Assimakopoulos, V.D. The new open Flexible Emission Inventory for Greece and the Greater Athens Area (FEI-GREGAA): Account of pollutant sources and their importance from 2006 to 2012. Atmos. Environ. 2016, 137, 17–37. [Google Scholar] [CrossRef]
- Fameli, K.M.; Assimakopoulos, V.D. Development of a road transport emission inventory for Greece and the Greater Athens Area: Effects of important parameters. Sci. Total Environ. 2015, 505, 770–786. [Google Scholar] [CrossRef] [Green Version]
- Olivier, J.G.J.; Bouwman, A.F.; Van der Hoek, K.W.; Berdowski, J.J.M. Global air emission inventories for anthropogenic sources of NOx, NH3 and N2O in 1990. Environ. Pollut. 1998, 102, 135–148. [Google Scholar] [CrossRef]
- Cai, H.; Xie, S. Estimation of vehicular emission inventories in China from 1980 to 2005. Atmos. Environ. 2007, 41, 8963–8979. [Google Scholar] [CrossRef]
- Wang, H.; Chen, C.; Huang, C.; Fu, L. On-road vehicle emission inventory and its uncertainty analysis for Shanghai, China. Sci. Total Environ. 2008, 398, 60–67. [Google Scholar] [CrossRef]
- Ramachandra, T.V.; Shwetmala. Emissions from India’s transport sector: Statewise synthesis. Atmos. Environ. 2009, 43, 5510–5517. [Google Scholar] [CrossRef]
- Spyropoulos, G.; Chalvatzis, K.; Paliatsos, A.; Kaldellis, J. Sulphur dioxide emissions due to electricity generation in the Aegean Islands: Real threat or overestimated danger. In Proceedings of the 9th International Conference on Environmental Science and Technology, Rhodes, Greece, 1–3 September 2005. [Google Scholar]
- Bellasio, R.; Bianconi, R.; Corda, G.; Cucca, P. Emission inventory for the road transport sector in Sardinia (Italy). Atmos. Environ. 2007, 41, 677–691. [Google Scholar] [CrossRef]
- Ministry of Infrastructure and Transport. Available online: https://www.yme.gov.gr/ (accessed on 1 November 2021).
- HAS Hellenic Statistical Authority (HSA). Available online: https://www.statistics.gr/ (accessed on 1 November 2021).
- European Commission Mobility and Transport Publications. Available online: https://transport.ec.europa.eu/media-corner/publications_en (accessed on 29 October 2021).
- ACEA. Vehicles in Use—Europe 2018; European Automobile Manufacturers Association: Brussels, Belgium, 2018. [Google Scholar]
- ACEA. Vehicles in Use—Europe 2019; European Automobile Manufacturers Association: Brussels, Belgium, 2019. [Google Scholar]
- ACEA. Vehicles in Use—Europe 2020; European Automobile Manufacturers Association: Brussels, Belgium, 2020. [Google Scholar]
- ACEA. Vehicles in Use—Europe 2021; European Automobile Manufacturers Association: Brussels, Belgium, 2021. [Google Scholar]
- AMVIR. Hellenic Association of Motor Vehicle Importers Representatives. Available online: https://seaa.gr/ (accessed on 1 November 2021).
- Emisia. A Spin-Off Company (EMISIA) of the Aristotle University of Thessaloniki. Available online: https://www.emisia.com (accessed on 1 November 2021).
- EEA. CO2 Emissions from New Passenger Cars—European Environment Agency. Available online: https://www.eea.europa.eu/themes/transport/co2-emissions-from-new-passenger-cars (accessed on 1 November 2021).
- Elkafoury, A.; Bady, M.; Aly, M.; Aly, F.; Negm, A. Emissions Modeling for Road Transportation in Urban Areas: State-of-Art Review. In Proceedings of the 23rd International Conference on―Environmental Protection is a Must, Alexandria, Egypt, 11–13 May 2013; Volume 23, p. 16. [Google Scholar]
- Waka Kotahi NZ Transport Agency Vehicle Emissions Prediction Model. Available online: https://www.nzta.govt.nz/roads-and-rail/highways-information-portal/technical-disciplines/air-quality-climate/planning-and-assessment/vehicle-emissions-prediction-model/ (accessed on 25 November 2021).
- Elkafoury, A.; Negm, A.M.; Bady, M.; Aly, M.H.F. Review of transport emission modeling and monitoring in urban areas- Challenge for developing countries. In Proceedings of the 2014 International Conference on Advanced Logistics and Transport (ICALT), Hammamet, Tunisia, 1–3 May 2014; pp. 23–28. [Google Scholar]
- Wang, H.; McGlinchy, I. Review of vehicle emission modelling and the issues for New Zealand. In Proceedings of the Australasian Transport Research Forum, Auckland, New Zealand, 29 September–1 October 2009. [Google Scholar]
- Fath, B.D.; Jørgensen, S.E. (Eds.) Environmental Management Handbook; Applied Ecology and Environmental Management, 2nd ed.; CRC Press: Boca Raton, FL, USA, 2020; ISBN 978-1-00-305351-4. [Google Scholar]
- Ntziachristos, L.; Gkatzoflias, D.; Kouridis, C.; Samaras, Z. COPERT: A European Road Transport Emission Inventory Model. In Information Technologies in Environmental Engineering; Athanasiadis, I.N., Rizzoli, A.E., Mitkas, P.A., Gómez, J.M., Eds.; Springer: Berlin/Heidelberg, Germany, 2009; pp. 491–504. [Google Scholar]
- Zachariadis, T.; Samaras, Z. An Integrated Modeling System for the Estimation of Motor Vehicle Emissions. J. Air Waste Manag. Assoc. 1999, 49, 1010–1026. [Google Scholar] [CrossRef] [PubMed] [Green Version]
- EEA. Road Transport 2019—European Environment Agency. Available online: https://www.eea.europa.eu/publications/emep-eea-guidebook-2019/part-b-sectoral-guidance-chapters/1-energy/1-a-combustion/1-a-3-b-i/view (accessed on 26 November 2021).
- Wesseling, J.H.; Faber, J.; Hekkert, M.P. How competitive forces sustain electric vehicle development. Technol. Forecast. Soc. Change 2014, 81, 154–164. [Google Scholar] [CrossRef] [Green Version]
- Yuan, X.; Cai, Y. Forecasting the development trend of low emission vehicle technologies: Based on patent data. Technol. Forecast. Soc. Change 2021, 166, 120651. [Google Scholar] [CrossRef]
- Onn, C.C.; Chai, C.; Abd Rashid, A.F.; Karim, M.R.; Yusoff, S. Vehicle electrification in a developing country: Status and issue, from a well-to-wheel perspective. Transp. Res. Part D Transp. Environ. 2017, 50, 192–201. [Google Scholar] [CrossRef]
- HMEE. Greek National Energy and Climate Plan Report; Hellenic Ministry of Environment and Energy (HMEE): Athens, Greece, 2019. Available online: http://www.opengov.gr/minenv/?p=10155 (accessed on 1 November 2021).
- Chambers, J.C.; Mullick, S.K.; Smith, D.D. How to Choose the Right Forecasting Technique. Harvard Business Review. 1 July 1971. Available online: https://hbr.org/1971/07/how-to-choose-the-right-forecasting-technique (accessed on 1 November 2021).
- Wang, C.; Cai, W.; Lu, X.; Chen, J. CO2 mitigation scenarios in China’s road transport sector. Energy Convers. Manag. 2007, 48, 2110–2118. [Google Scholar] [CrossRef]
- Heaps, C.G. LEAP: The Low Emissions Analysis Platform. [Software Version: 2020.1.50]; Stockholm Environment Institute: Somerville, MA, USA, 2021. [Google Scholar]
- Tsita, K.G.; Pilavachi, P.A. Decarbonizing the Greek road transport sector using alternative technologies and fuels. Therm. Sci. Eng. Prog. 2017, 1, 15–24. [Google Scholar] [CrossRef]
- Kouridis, C.; Vlachokostas, C. Towards decarbonizing road transport: Environmental and social benefit of vehicle fleet electrification in urban areas of Greece. Renew. Sustain. Energy Rev. 2022, 153, 111775. [Google Scholar] [CrossRef]
- Evans, J.R. Statistics, Data Analysis, and Decision Modeling, 3rd ed.; Pearson/Prentice Hall: Hoboken, NJ, USA, 2007; ISBN 978-0-13-188609-4. [Google Scholar]
- Agiakloglou, C.; Oikonomou, G. Methods of Forecasting and Analysis of Decisions, 3rd ed.; Benou: Athens, Greece, 2019; ISBN 978-960-359-146-7. [Google Scholar]
- Brown, R.G. Smoothing, Forecasting and Prediction of Discrete Time Series; Dover Publications: Mineola, NY, USA, 2004; ISBN 978-0-486-49592-7. [Google Scholar]
- Choi, J.; Roberts, D.C.; Lee, E.; Choi, J.; Roberts, D.C.; Lee, E. Forecast of CO2 Emissions From the U.S. Transportation Sector: Estimation From a Double Exponential Smoothing Model. J. Transp. Res. Forum 2014, 53, 63–81. [Google Scholar] [CrossRef]
- Chiang, C.-Y.; Lin, W.T.; Suresh, N.C. An empirically-simulated investigation of the impact of demand forecasting on the bullwhip effect: Evidence from U.S. auto industry. Int. J. Prod. Econ. 2016, 177, 53–65. [Google Scholar] [CrossRef]
- De la Fuente-Mella, H.; Paz-Cruz, A.; Conover, R.; Khan, A. Forecasting of Financial Series for the Nevada Department of Transportation Using Deterministic and Stochastic Methodologies. Procedia Manuf. 2015, 3, 3317–3324. [Google Scholar] [CrossRef] [Green Version]
- Pegkas, P. Government Debt and Economic Growth. A Threshold Analysis for Greece. Peace Econ. Peace Sci. Public Policy 2019, 25, 20180003. [Google Scholar] [CrossRef]
- Yükseltürk, A.; Wewer, A.; Bilge, P.; Dietrich, F. Recollection center location for end-of-life electric vehicle batteries using fleet size forecast: Scenario analysis for Germany. Procedia CIRP 2021, 96, 260–265. [Google Scholar] [CrossRef]
- Talluri, G.; Grasso, F.; Chiaramonti, D. Is Deployment of Charging Station the Barrier to Electric Vehicle Fleet Development in EU Urban Areas? An Analytical Assessment Model for Large-Scale Municipality-Level EV Charging Infrastructures. Appl. Sci. 2019, 9, 4704. [Google Scholar] [CrossRef] [Green Version]
- Azarafshar, R.; Vermeulen, W.N. Electric vehicle incentive policies in Canadian provinces. Energy Econ. 2020, 91, 104902. [Google Scholar] [CrossRef]
- Shafiei, E.; Dauphin, R.; Yugo, M. Optimal electrification level of passenger cars in Europe in a battery-constrained future. Transp. Res. Part D Transp. Environ. 2022, 102, 103132. [Google Scholar] [CrossRef]
- Eurostat. Eurostat Regional Yearbook; Statistical Books; European Commision: Luxembourg, 2016; ISBN 978-92-79-60090-6. [Google Scholar]
- EEA. Size of the Vehicle Fleet in Europe—European Environment Agency. Available online: https://www.eea.europa.eu/data-and-maps/indicators/size-of-the-vehicle-fleet/size-of-the-vehicle-fleet-10 (accessed on 8 December 2021).
- Triantafyllopoulos, G.; Dimaratos, A.; Ntziachristos, L.; Bernard, Y.; Dornoff, J.; Samaras, Z. A study on the CO2 and NOx emissions performance of Euro 6 diesel vehicles under various chassis dynamometer and on-road conditions including latest regulatory provisions. Sci. Total Environ. 2019, 666, 337–346. [Google Scholar] [CrossRef]
- Nanaki, E.A.; Koroneos, C.J.; Xydis, G.A.; Rovas, D. Comparative environmental assessment of Athens urban buses—Diesel, CNG and biofuel powered. Transp. Policy 2014, 35, 311–318. [Google Scholar] [CrossRef]
- Suarez-Bertoa, R.; Valverde, V.; Clairotte, M.; Pavlovic, J.; Giechaskiel, B.; Franco, V.; Kregar, Z.; Astorga, C. On-road emissions of passenger cars beyond the boundary conditions of the real-driving emissions test. Environ. Res. 2019, 176, 108572. [Google Scholar] [CrossRef] [PubMed]
- Vojtíšek-Lom, M.; Beránek, V.; Klír, V.; Jindra, P.; Pechout, M.; Voříšek, T. On-road and laboratory emissions of NO, NO2, NH3, N2O and CH4 from late-model EU light utility vehicles: Comparison of diesel and CNG. Sci. Total Environ. 2018, 616–617, 774–784. [Google Scholar] [CrossRef] [PubMed]
- Holmén, B.A.; Ayala, A. Ultrafine PM Emissions from Natural Gas, Oxidation-Catalyst Diesel, and Particle-Trap Diesel Heavy-Duty Transit Buses. Environ. Sci. Technol. 2002, 36, 5041–5050. [Google Scholar] [CrossRef]
- Giechaskiel, B. Solid Particle Number Emission Factors of Euro VI Heavy-Duty Vehicles on the Road and in the Laboratory. Int. J. Environ. Res. Public Health 2018, 15, 304. [Google Scholar] [CrossRef] [PubMed] [Green Version]
- Ntziachristos, L.; Samaras, Z. EMEP/EEA Air Pollutant Emission Inventory Guidebook, Emep, COPERT 5.5, Guidebook. 2019. Available online: https://www.eea.europa.eu/publications/emep-eea-guidebook-2019/part-b-sectoral-guidance-chapters/1-energy/1-a-combustion/1-a-3-b-i/at_download/file (accessed on 1 November 2021).
- EU. Regulation (EU) 2019/631 of the European Parliament and of the Council of 17 April 2019 Setting CO2 Emission Performance Standards for New Passenger Cars and for New Light Commercial Vehicles, and Repealing Regulations (EC) No 443/2009 and (EU) No 510/2011. 2019. Available online: https://www.eea.europa.eu/ims/co2-performance-of-new-passenger (accessed on 1 November 2021).
- EU. Regulation (EC) No 443/2009 of the European Parliament and of the Council of 23 April 2009 Setting Emission Performance Standards for New Passenger Cars as Part of the Community’s Integrated Approach to Reduce CO2 Emissions from Light-Duty Vehicles. 2009. Available online: https://www.eea.europa.eu/ims/co2-performance-of-new-passenger (accessed on 1 November 2021).
- Oroumiyeh, F.; Zhu, Y. Brake and tire particles measured from on-road vehicles: Effects of vehicle mass and braking intensity. Atmos. Environ. X 2021, 12, 100121. [Google Scholar] [CrossRef]
- Jeong, C.-H.; Traub, A.; Huang, A.; Hilker, N.; Wang, J.M.; Herod, D.; Dabek-Zlotorzynska, E.; Celo, V.; Evans, G.J. Long-term analysis of PM2.5 from 2004 to 2017 in Toronto: Composition, sources, and oxidative potential. Environ. Pollut. 2020, 263, 114652. [Google Scholar] [CrossRef]
- EEA. CO2 Performance of New Passenger Cars in Europe. Available online: https://www.eea.europa.eu/ims/co2-performance-of-new-passenger (accessed on 9 December 2021).
- Spyropoulos, G.; Petridou, K.; Liaros, S.; Kaldellis, J.K. Real World Driving Energy Consumption and Air Pollution Implications of Decarbonizing the Greek Transport Sector. In Proceedings of the 1st International Conference Energy in Transportation 2016, EinT2016, Athens, Greece, 12 November 2016. [Google Scholar]
- Spyropoulos, G.; Emmanouilidis, M.; Kaldellis, J.K. Investigating the long-term environmental performance of the Greek electricity sector on the basis of SO2 emissions. In Proceedings of the 12th International Conference on Environmental Science and Technology (CEST2011), Rhodes, Greece, 8–10 September 2011. [Google Scholar]
- Kaldellis, J.; Spyropoulos, G.; Liaros, S. Supporting Electromobility in Smart Cities Using Solar Electric Vehicle Charging Stations. In Mediterranean Green Buildings & Renewable Energy; Springer: Cham, Switzerland, 2017; pp. 501–513. [Google Scholar]
- Kostopoulos, E.D.; Spyropoulos, G.C.; Kaldellis, J.K. Real-world study for the optimal charging of electric vehicles. Energy Rep. 2020, 6, 418–426. [Google Scholar] [CrossRef]
- Worldenergy WEC. Energy Trilemma Index Tool. Available online: https://trilemma.worldenergy.org/#!/energy-index (accessed on 9 December 2021).
- Eurostat Population Structure and Ageing. Available online: https://ec.europa.eu/eurostat/statistics-explained/index.php?title=Population_structure_and_ageing (accessed on 5 January 2022).
- Eurostat Population and Population Change Statistics. Available online: https://ec.europa.eu/eurostat/statistics-explained/index.php?title=Population_and_population_change_statistics (accessed on 5 January 2022).
- European Union. Regulation (EU) 2021/1119 of the European Parliament and of the Council of 30 June 2021 Establishing the Framework for Achieving Climate Neutrality and Amending Regulations (EC) No 401/2009 and (EU) 2018/1999 (‘European Climate Law’); European Union: Maastricht, The Netherlands, 2021; Volume 243. [Google Scholar]
- European Commission. A European Green Deal. Available online: https://ec.europa.eu/info/strategy/priorities-2019-2024/european-green-deal_en (accessed on 15 October 2021).
- Cárcel-Carrasco, J.; Pascual-Guillamón, M.; Salas-Vicente, F. Analysis on the Effect of the Mobility of Combustion Vehicles in the Environment of Cities and the Improvement in Air Pollution in Europe: A Vision for the Awareness of Citizens and Policy Makers. Land 2021, 10, 184. [Google Scholar] [CrossRef]
- Kim, K.; Lee, J.; Kim, J. Can liquefied petroleum gas vehicles join the fleet of alternative fuel vehicles? Implications of transportation policy based on market forecast and environmental impact. Energy Policy 2021, 154, 112311. [Google Scholar] [CrossRef]
- Byun, H.; Shin, J.; Lee, C.-Y. Using a discrete choice experiment to predict the penetration possibility of environmentally friendly vehicles. Energy 2018, 144, 312–321. [Google Scholar] [CrossRef]
- Choi, H.; Shin, J.; Woo, J. Effect of electricity generation mix on battery electric vehicle adoption and its environmental impact. Energy Policy 2018, 121, 13–24. [Google Scholar] [CrossRef]
- Kim, I.; Kim, J.; Lee, J. Dynamic analysis of well-to-wheel electric and hydrogen vehicles greenhouse gas emissions: Focusing on consumer preferences and power mix changes in South Korea. Appl. Energy 2020, 260, 114281. [Google Scholar] [CrossRef]
- Aklilu, A.Z. Gasoline and diesel demand in the EU: Implications for the 2030 emission goal. Renew. Sustain. Energy Rev. 2020, 118, 109530. [Google Scholar] [CrossRef]


| Pollutant | 1990–2018 | 1990–2030 | 2018–2030 |
|---|---|---|---|
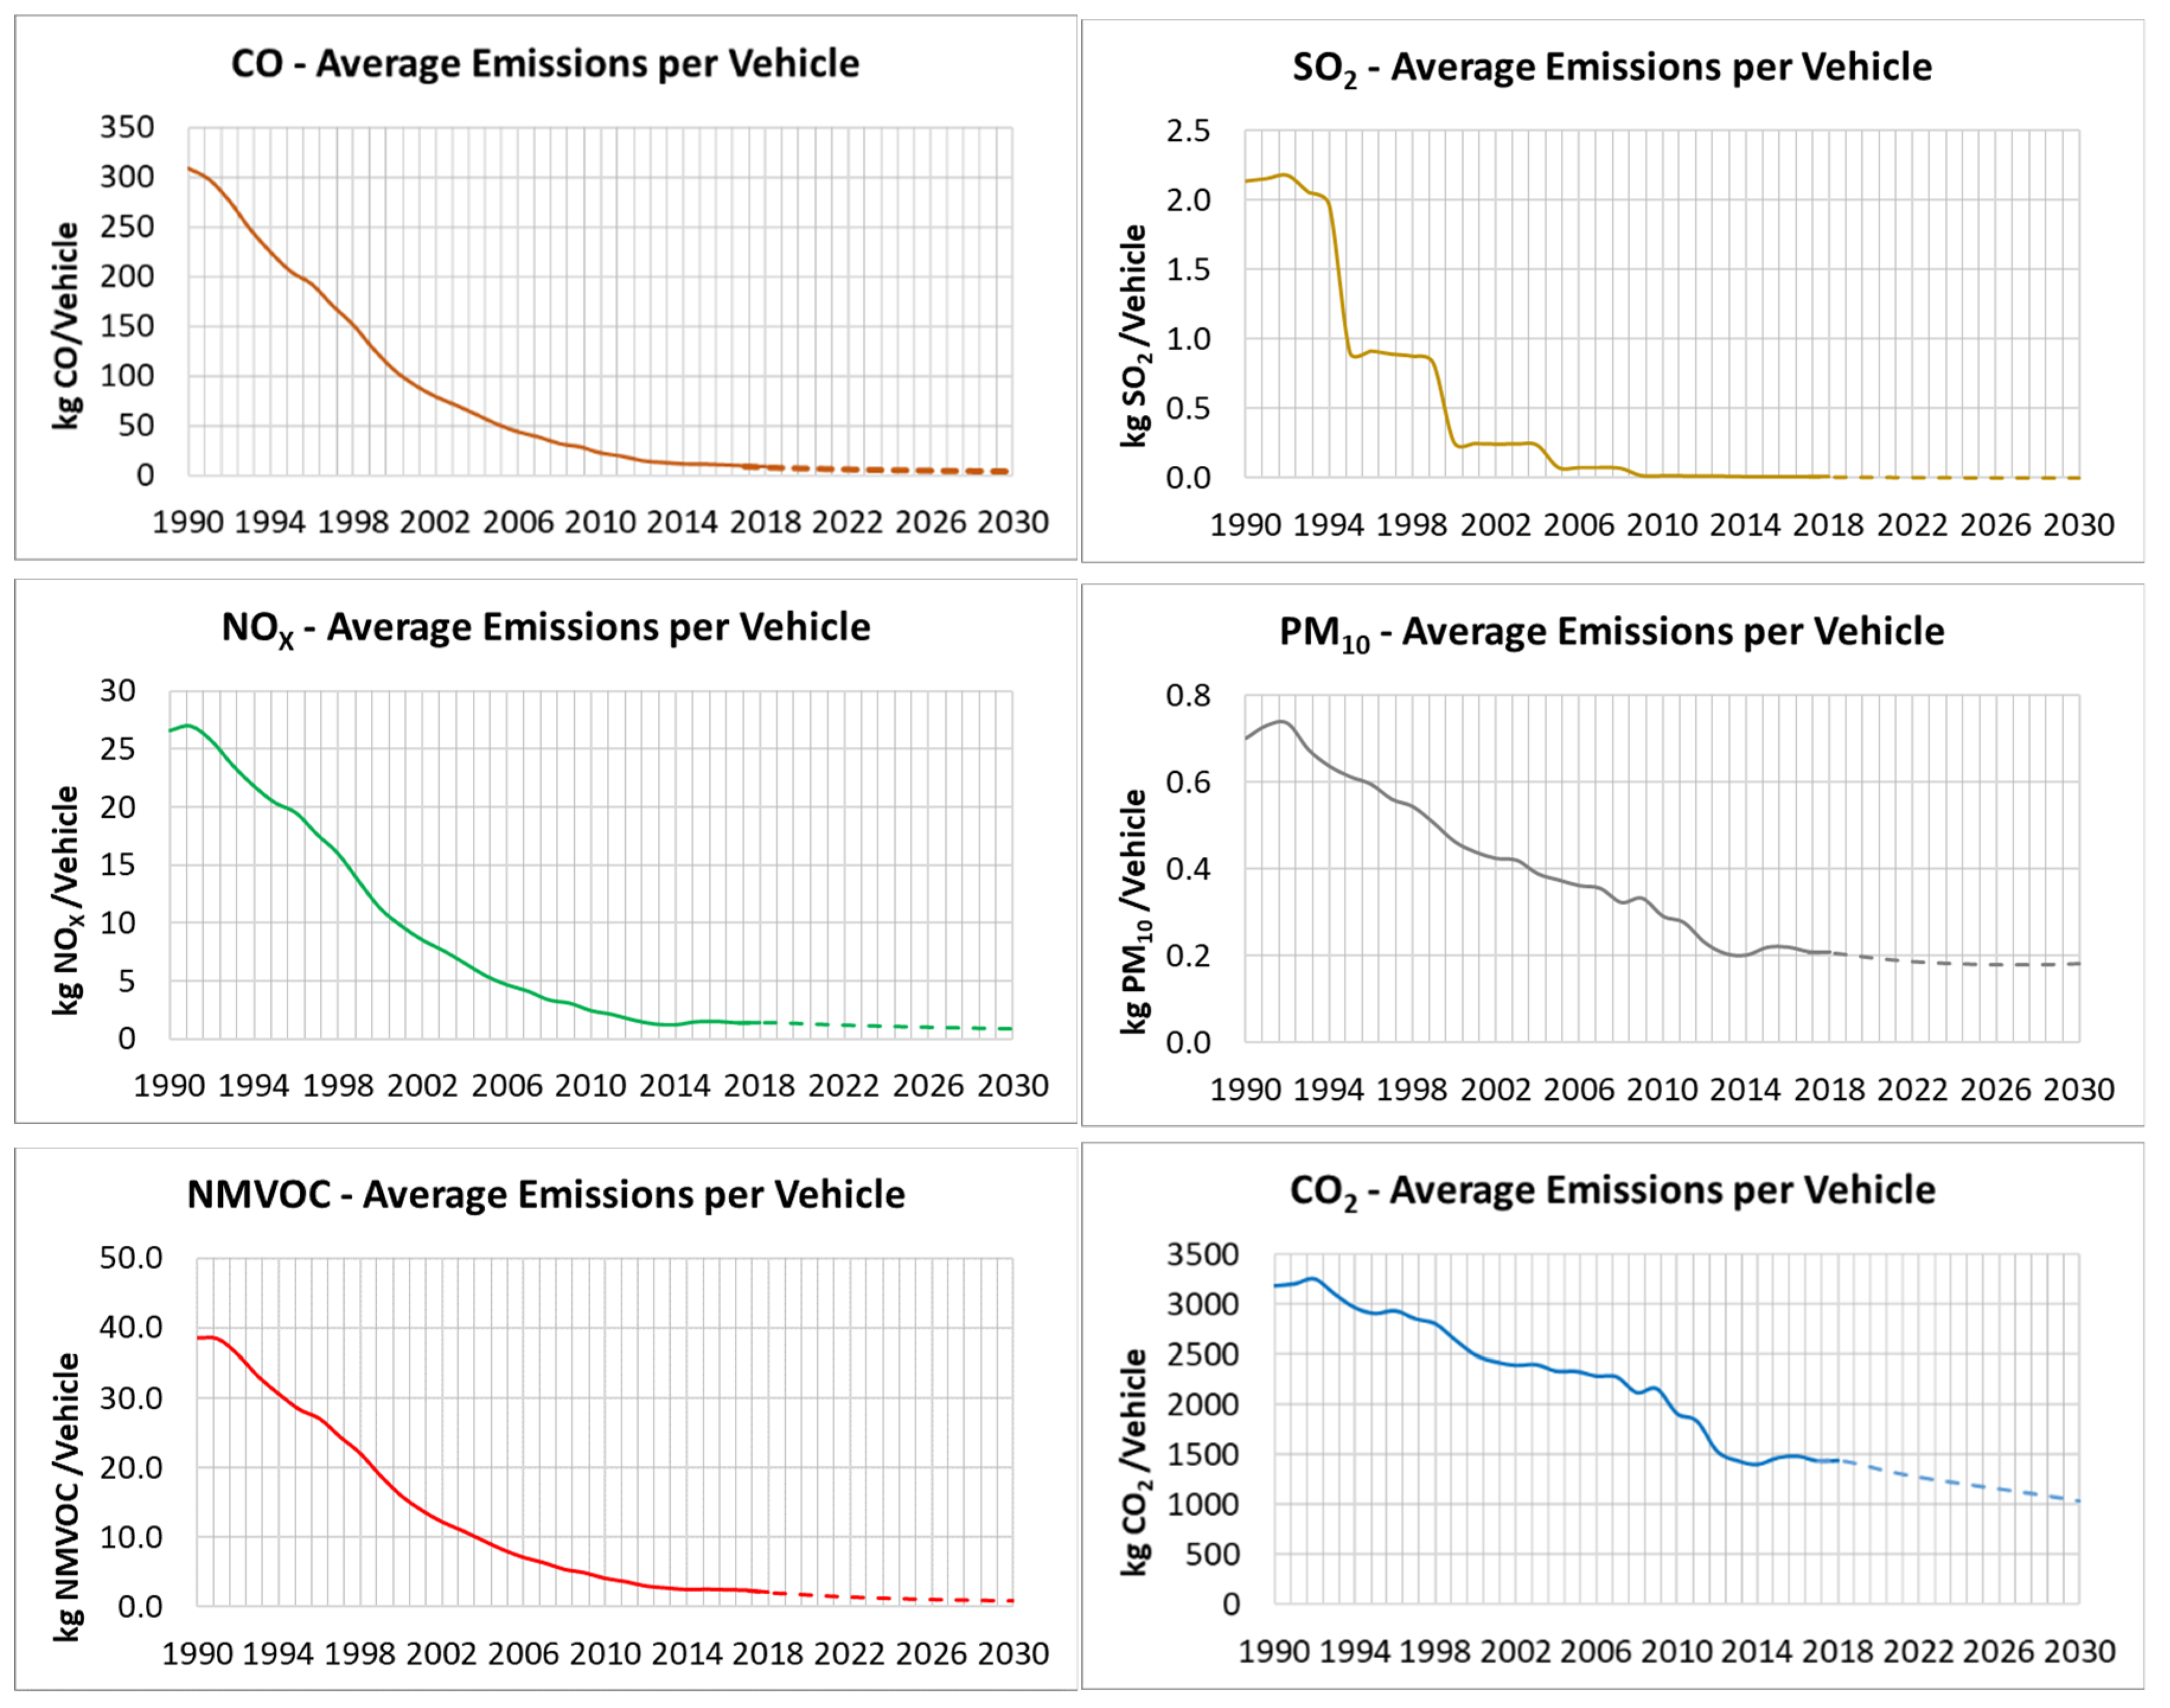
| CO | −97.2% | −98.7% | −51.1% |
| SO2 | −99.7% | −99.8% | −21.6% |
| NOX | −94.7% | −96.5% | −34.7% |
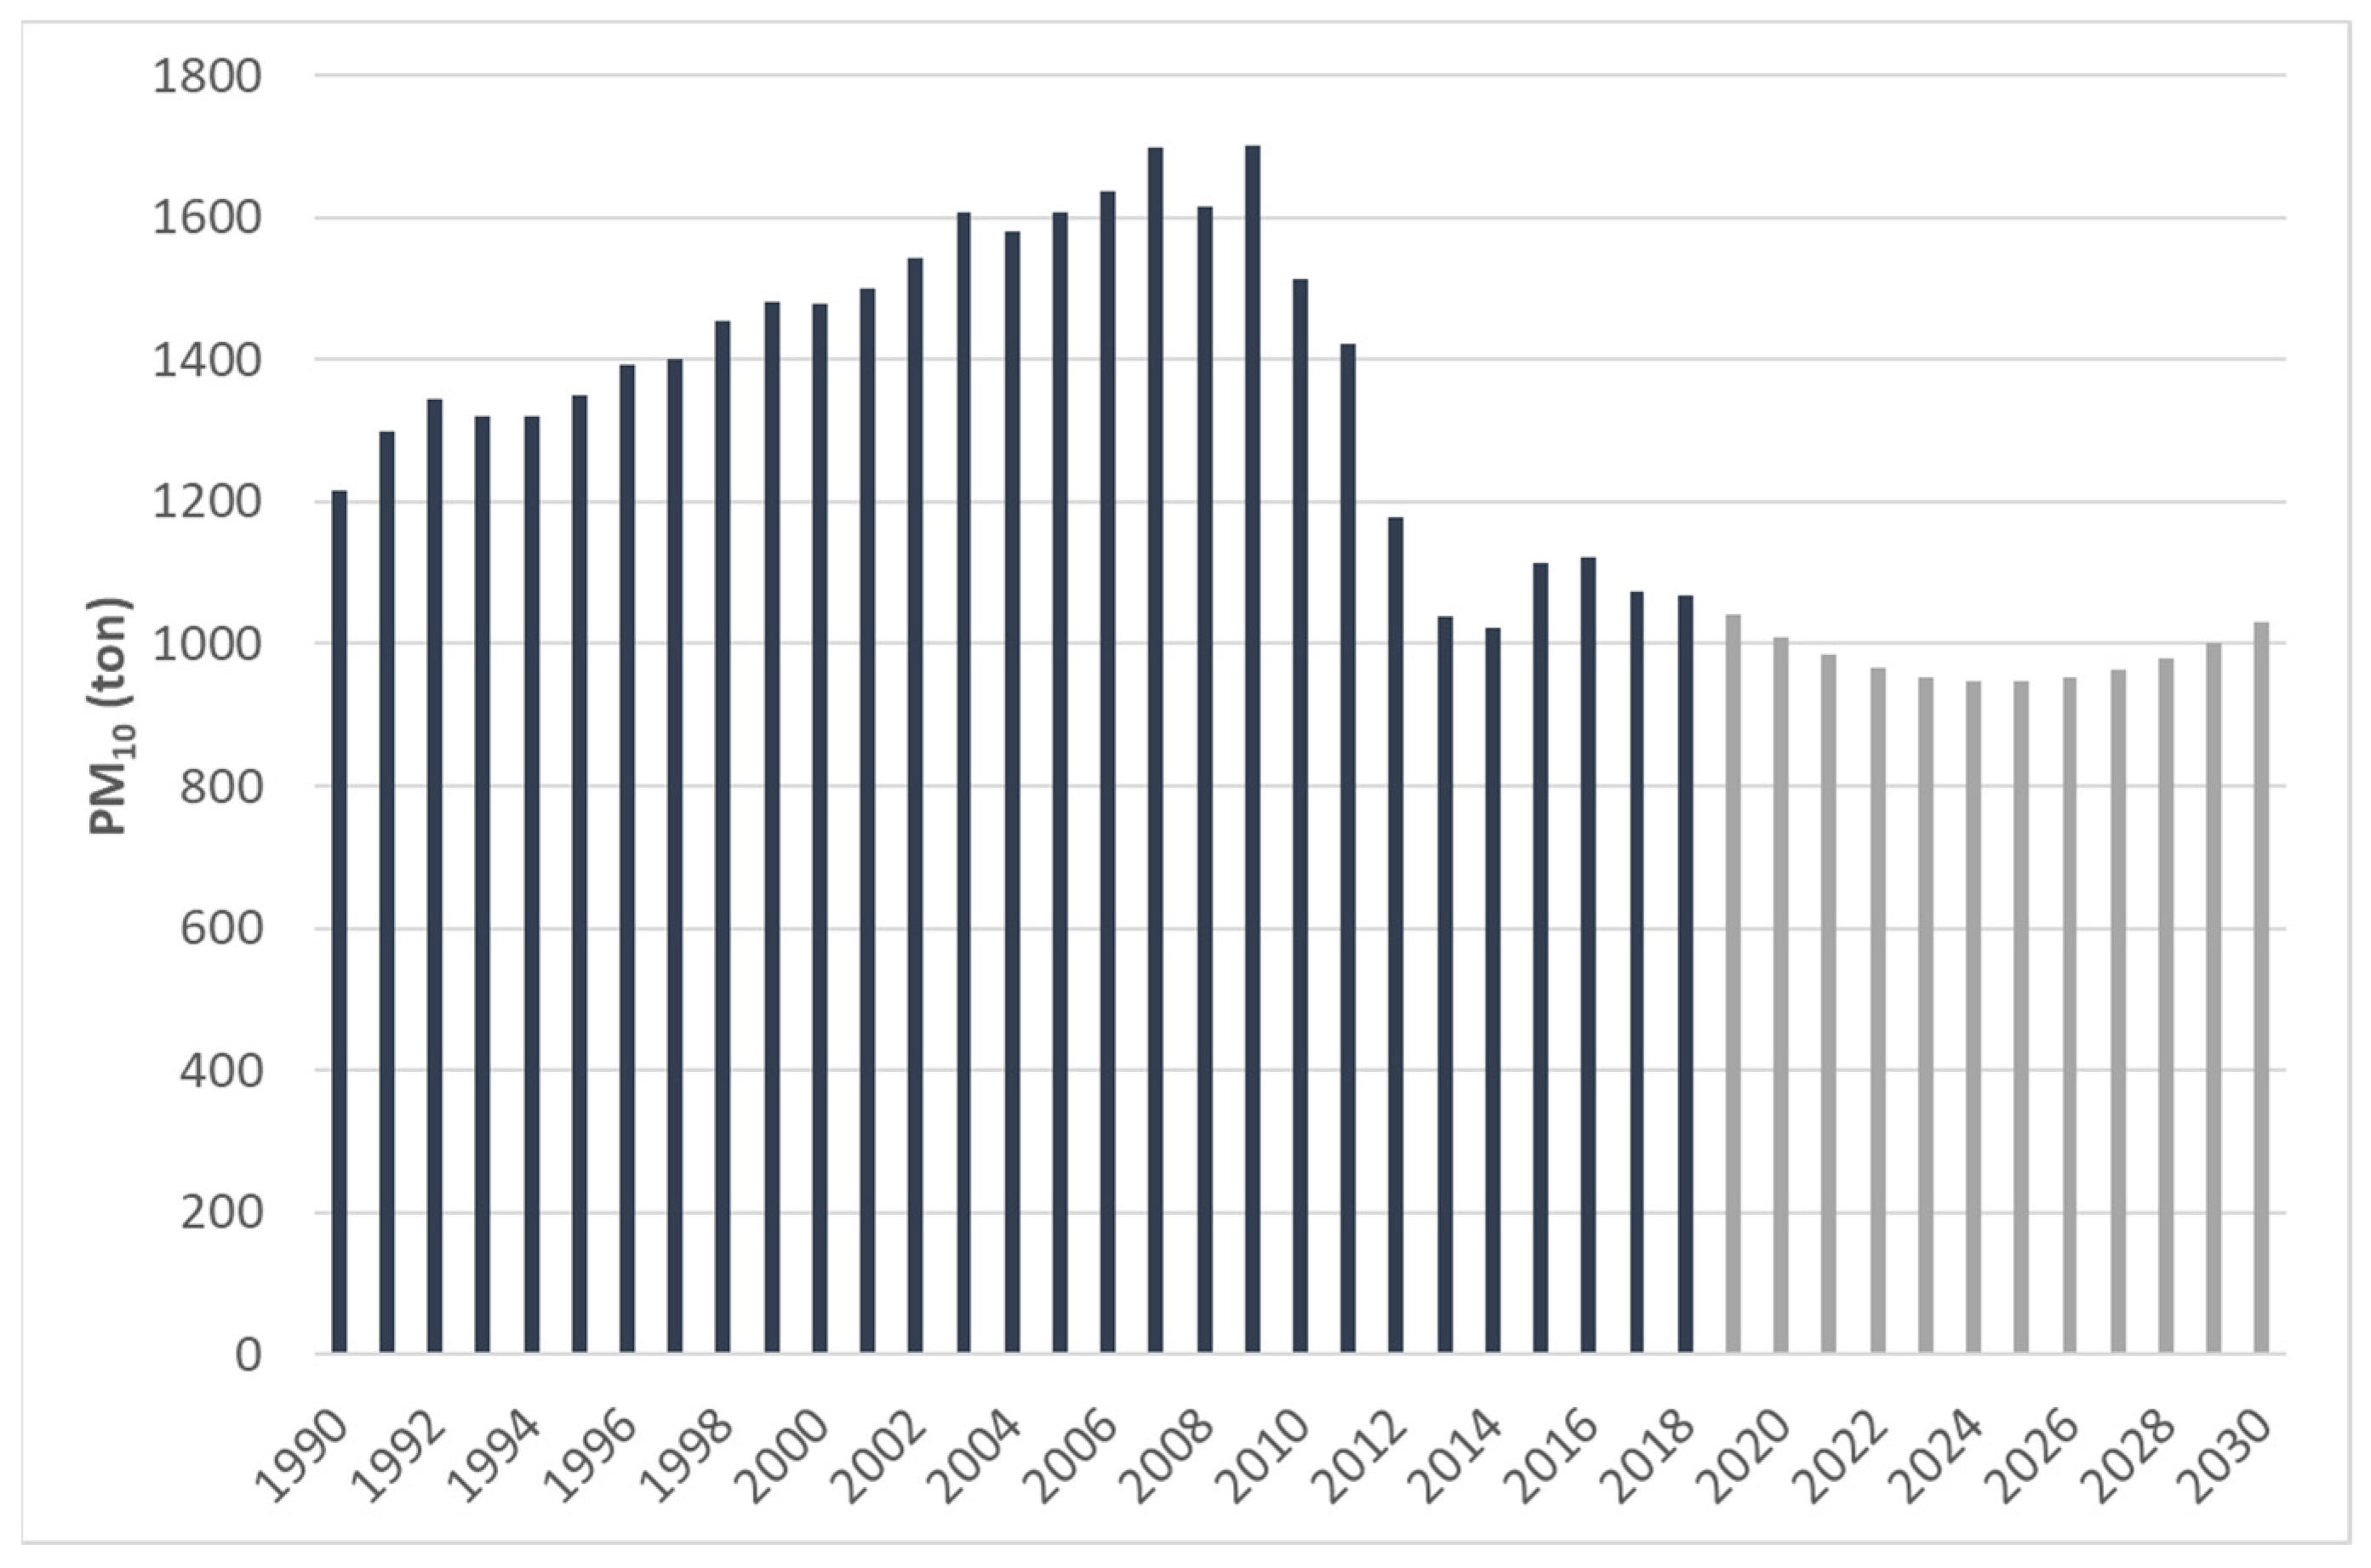
| PM10 | −70.5% | −74.2% | −12.6% |
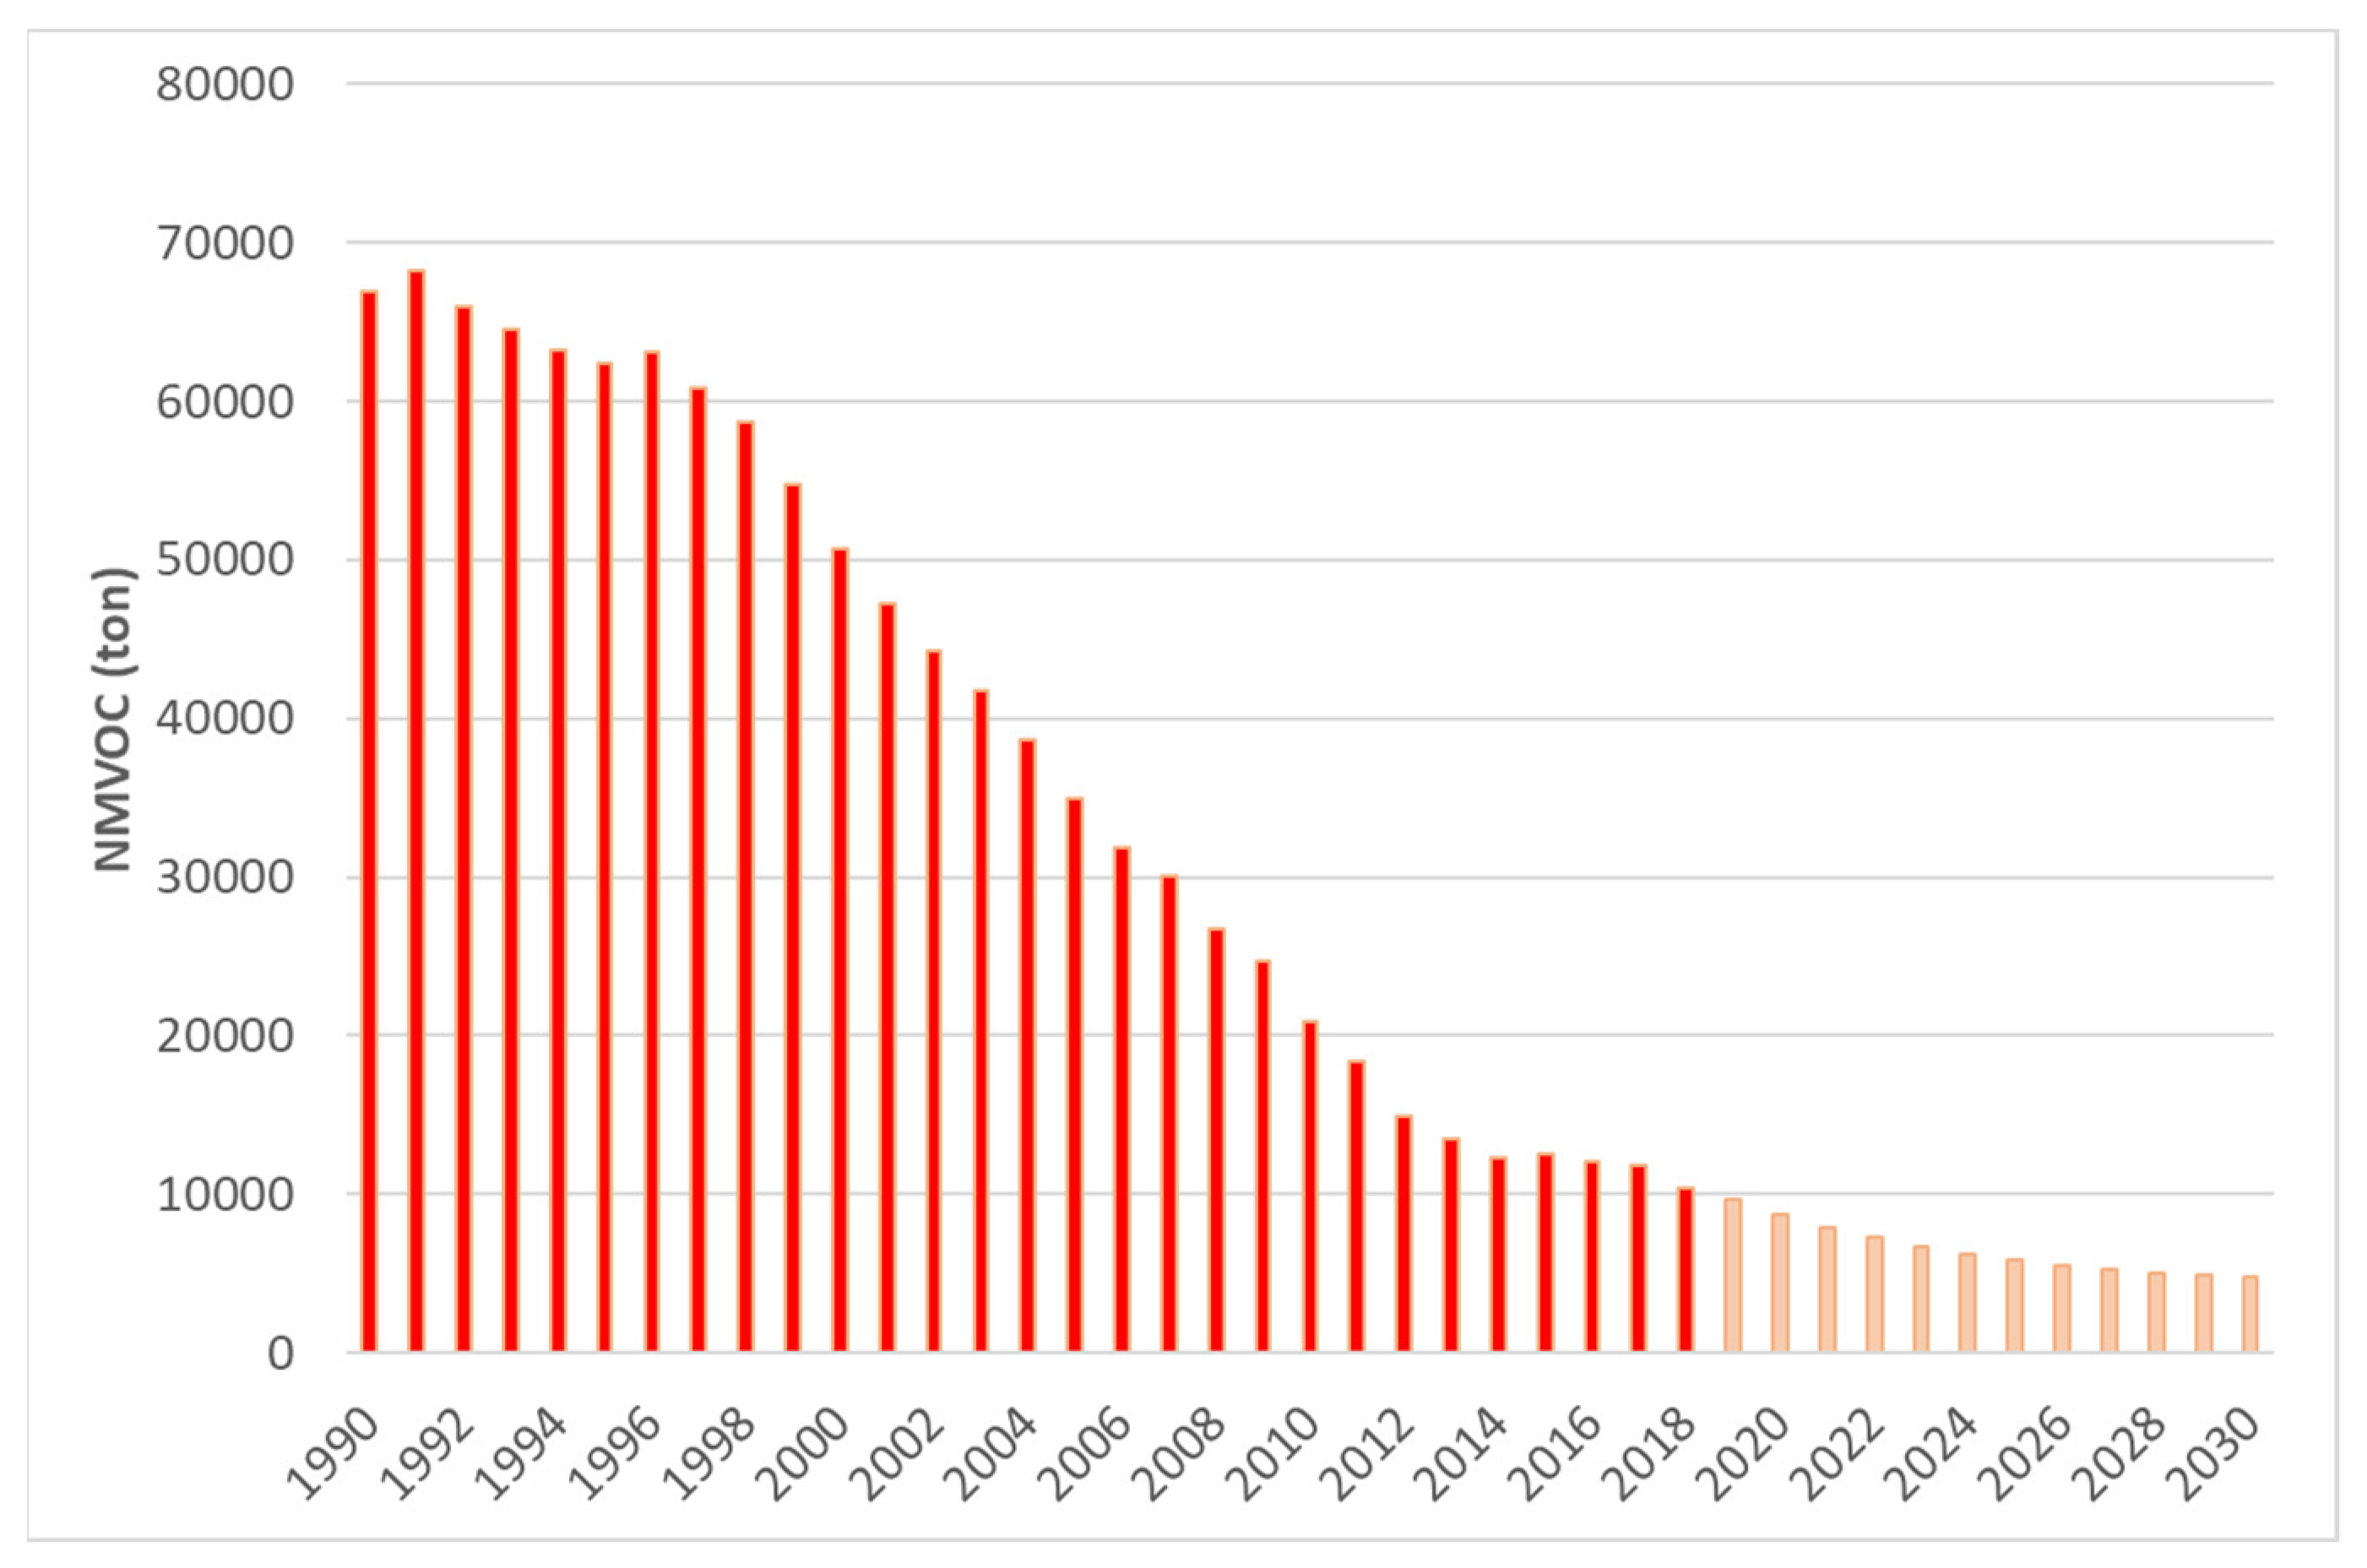
| NMVOC | −94.7% | −97.8% | −58.7% |
| CO2 | −54.8% | −67.4% | −27.9% |
| Year 2030 | CO | SO2 | NOX | PM10 | NMVOC | CO2 |
|---|---|---|---|---|---|---|
| Forecasting Scenario Total Emissions (tn) | 23,731 | 30 | 5271 | 1030 | 4753 | 5,904,070 |
| Total Emissions (tn) without BEVs | 25,242 | 33 | 5779 | 1126 | 5040 | 6,427,682 |
| Reduction (%) from BEVs Penetration | −6.0% | −8.5% | −8.8% | −8.6% | −8.1% | −5.7% |
Publisher’s Note: MDPI stays neutral with regard to jurisdictional claims in published maps and institutional affiliations. |
© 2022 by the authors. Licensee MDPI, Basel, Switzerland. This article is an open access article distributed under the terms and conditions of the Creative Commons Attribution (CC BY) license (https://creativecommons.org/licenses/by/4.0/).
Share and Cite
Spyropoulos, G.C.; Nastos, P.T.; Moustris, K.P.; Chalvatzis, K.J. Transportation and Air Quality Perspectives and Projections in a Mediterranean Country, the Case of Greece. Land 2022, 11, 152. https://doi.org/10.3390/land11020152
Spyropoulos GC, Nastos PT, Moustris KP, Chalvatzis KJ. Transportation and Air Quality Perspectives and Projections in a Mediterranean Country, the Case of Greece. Land. 2022; 11(2):152. https://doi.org/10.3390/land11020152
Chicago/Turabian StyleSpyropoulos, Georgios C., Panagiotis T. Nastos, Konstantinos P. Moustris, and Konstantinos J. Chalvatzis. 2022. "Transportation and Air Quality Perspectives and Projections in a Mediterranean Country, the Case of Greece" Land 11, no. 2: 152. https://doi.org/10.3390/land11020152
APA StyleSpyropoulos, G. C., Nastos, P. T., Moustris, K. P., & Chalvatzis, K. J. (2022). Transportation and Air Quality Perspectives and Projections in a Mediterranean Country, the Case of Greece. Land, 11(2), 152. https://doi.org/10.3390/land11020152