Land Use Change in the Cross-Boundary Regions of a Metropolitan Area: A Case Study of Tongzhou-Wuqing-Langfang
Abstract
1. Introduction
2. Methods
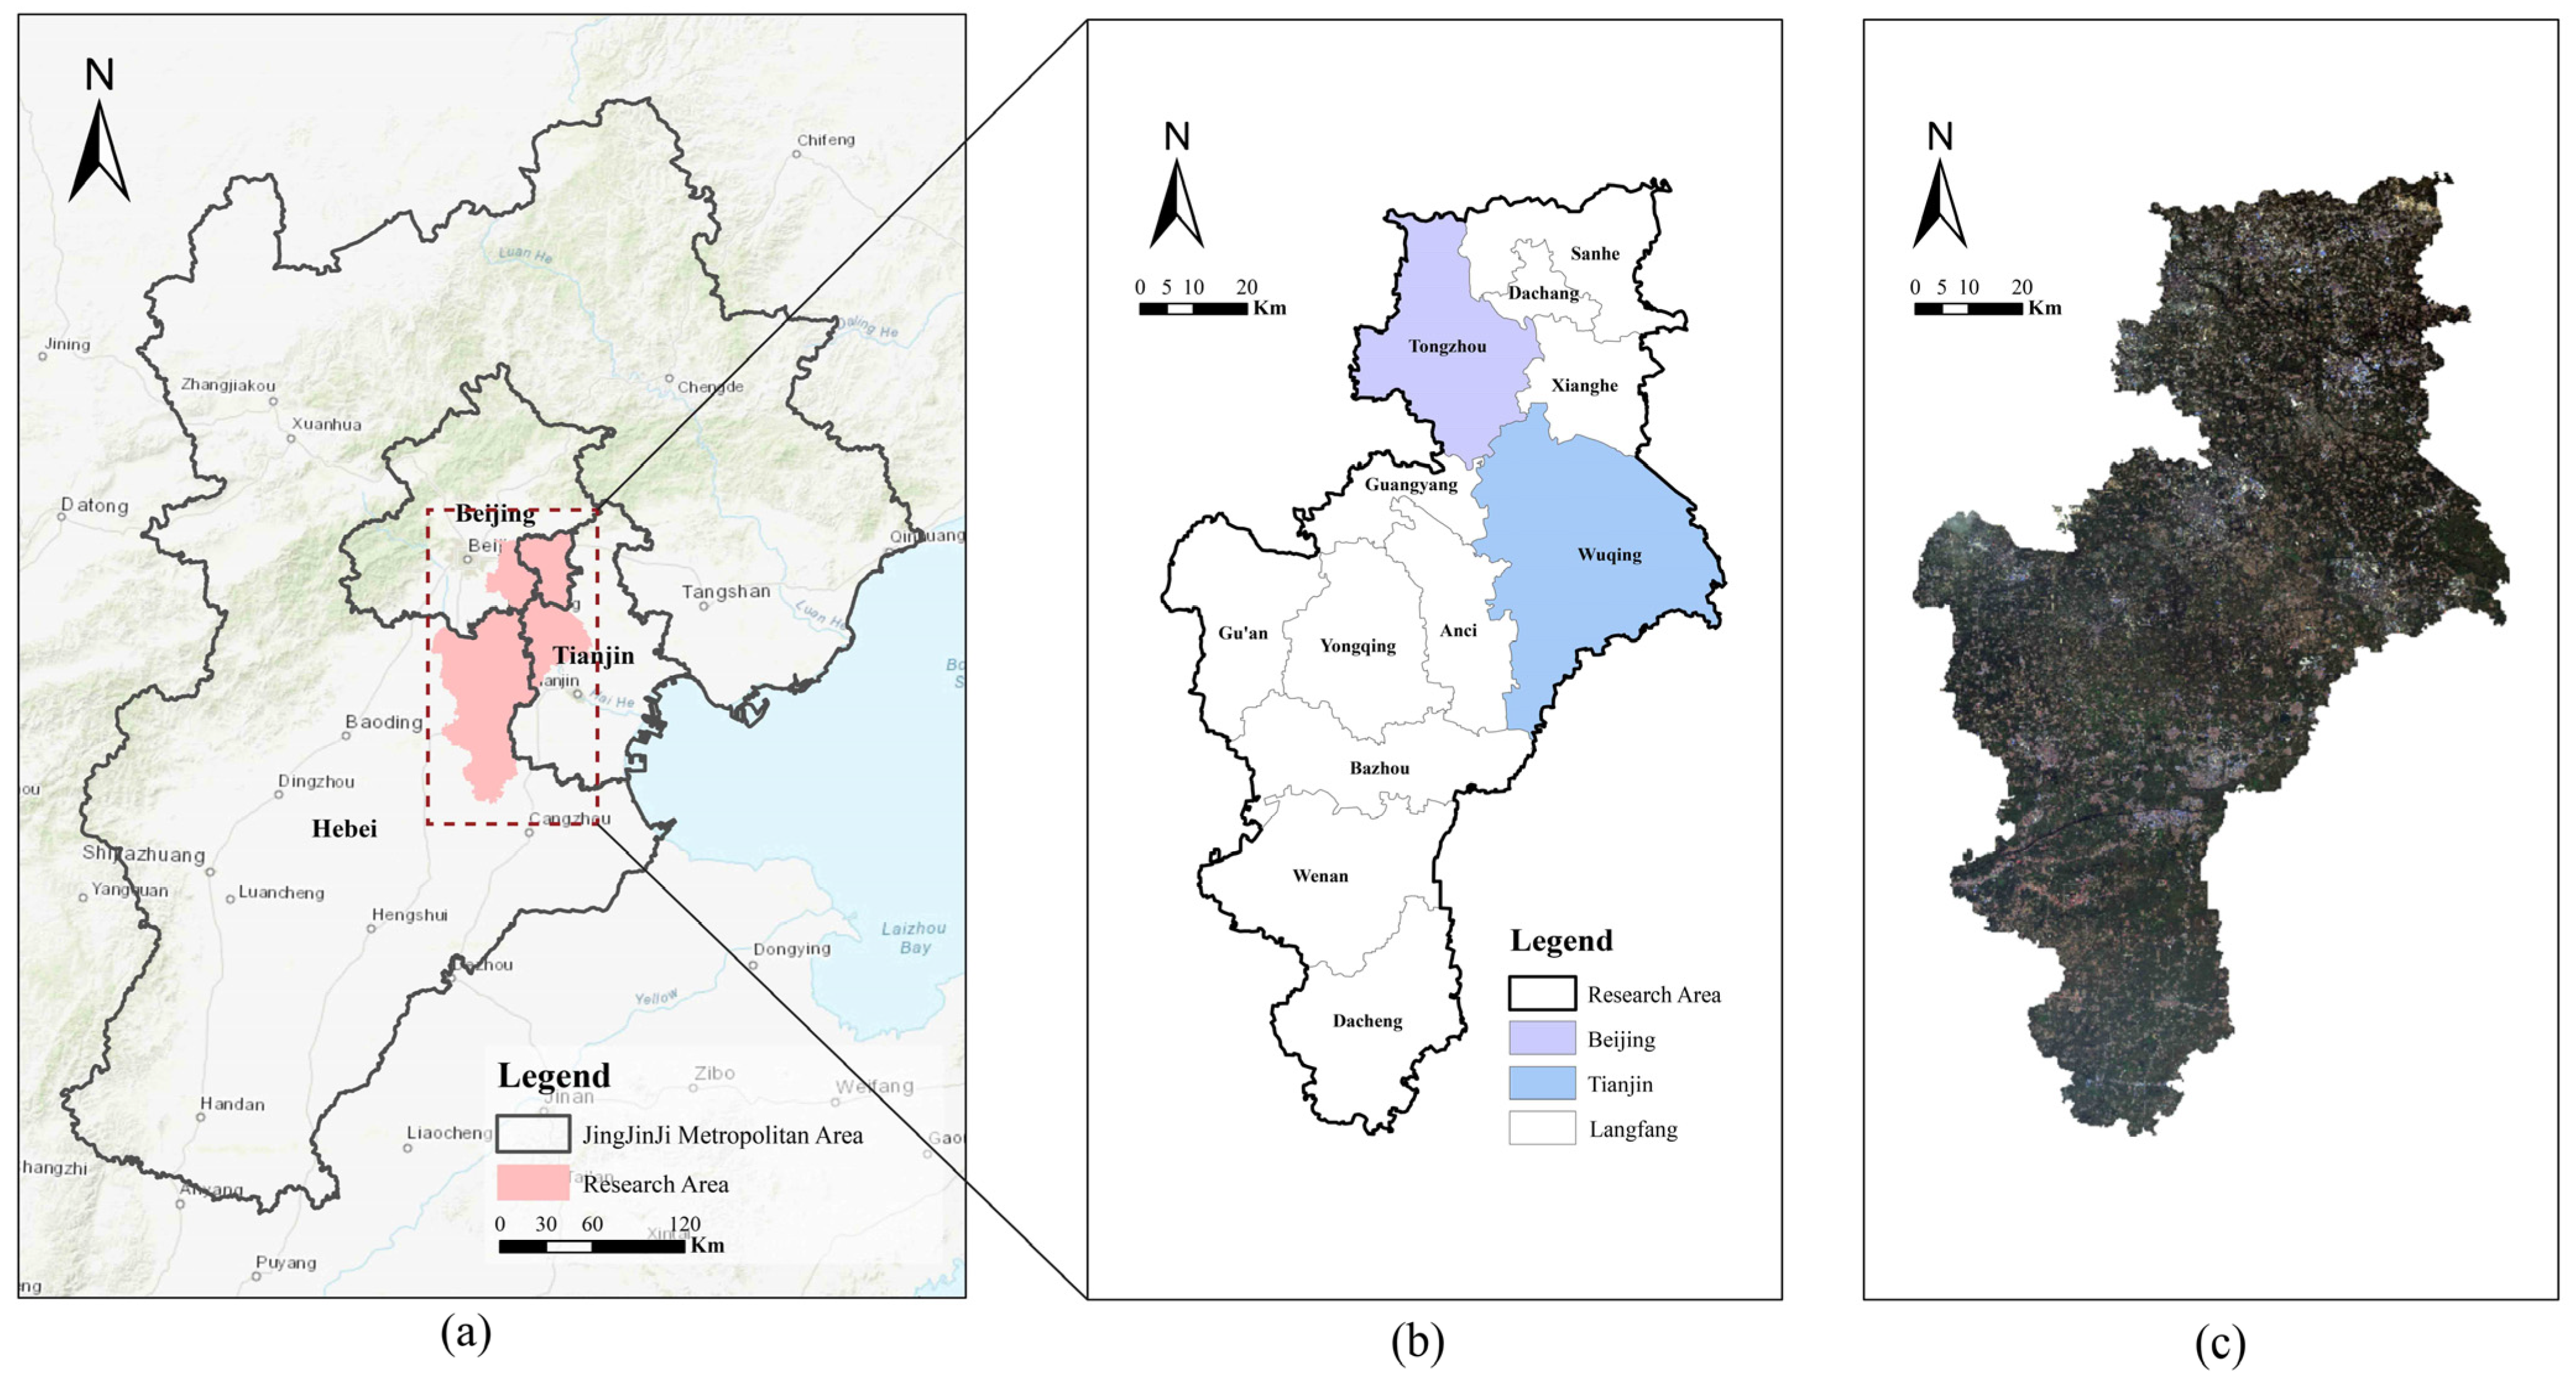
2.1. Research Area
2.2. Data Sources
2.3. Research Methods
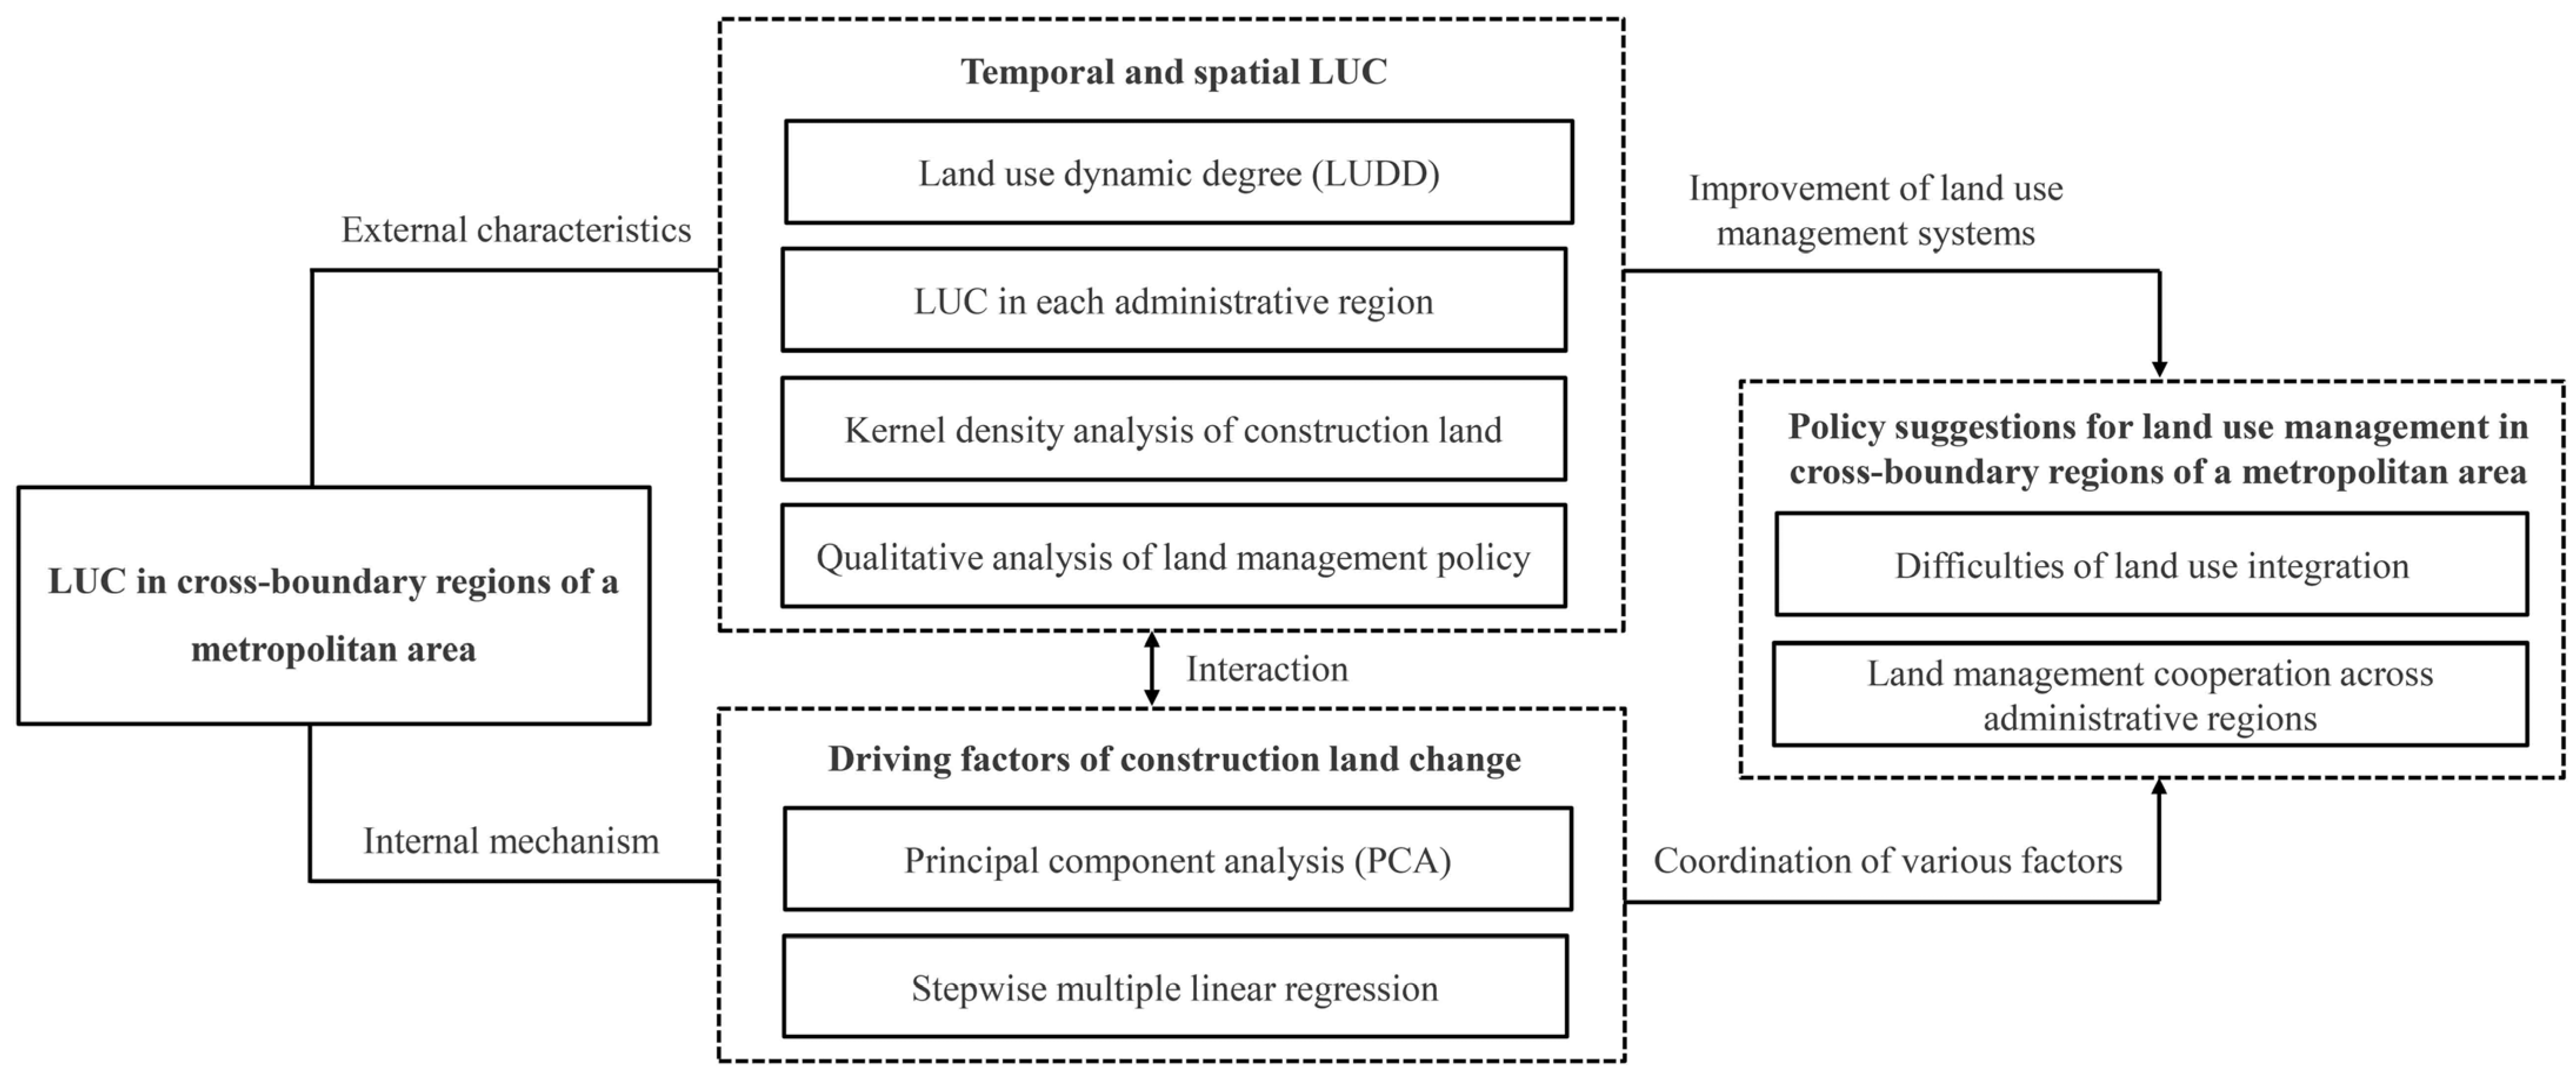
2.3.1. Research Framework
2.3.2. Pre-Treatment and Supervised Classification
2.3.3. Land-Use Dynamic Degree
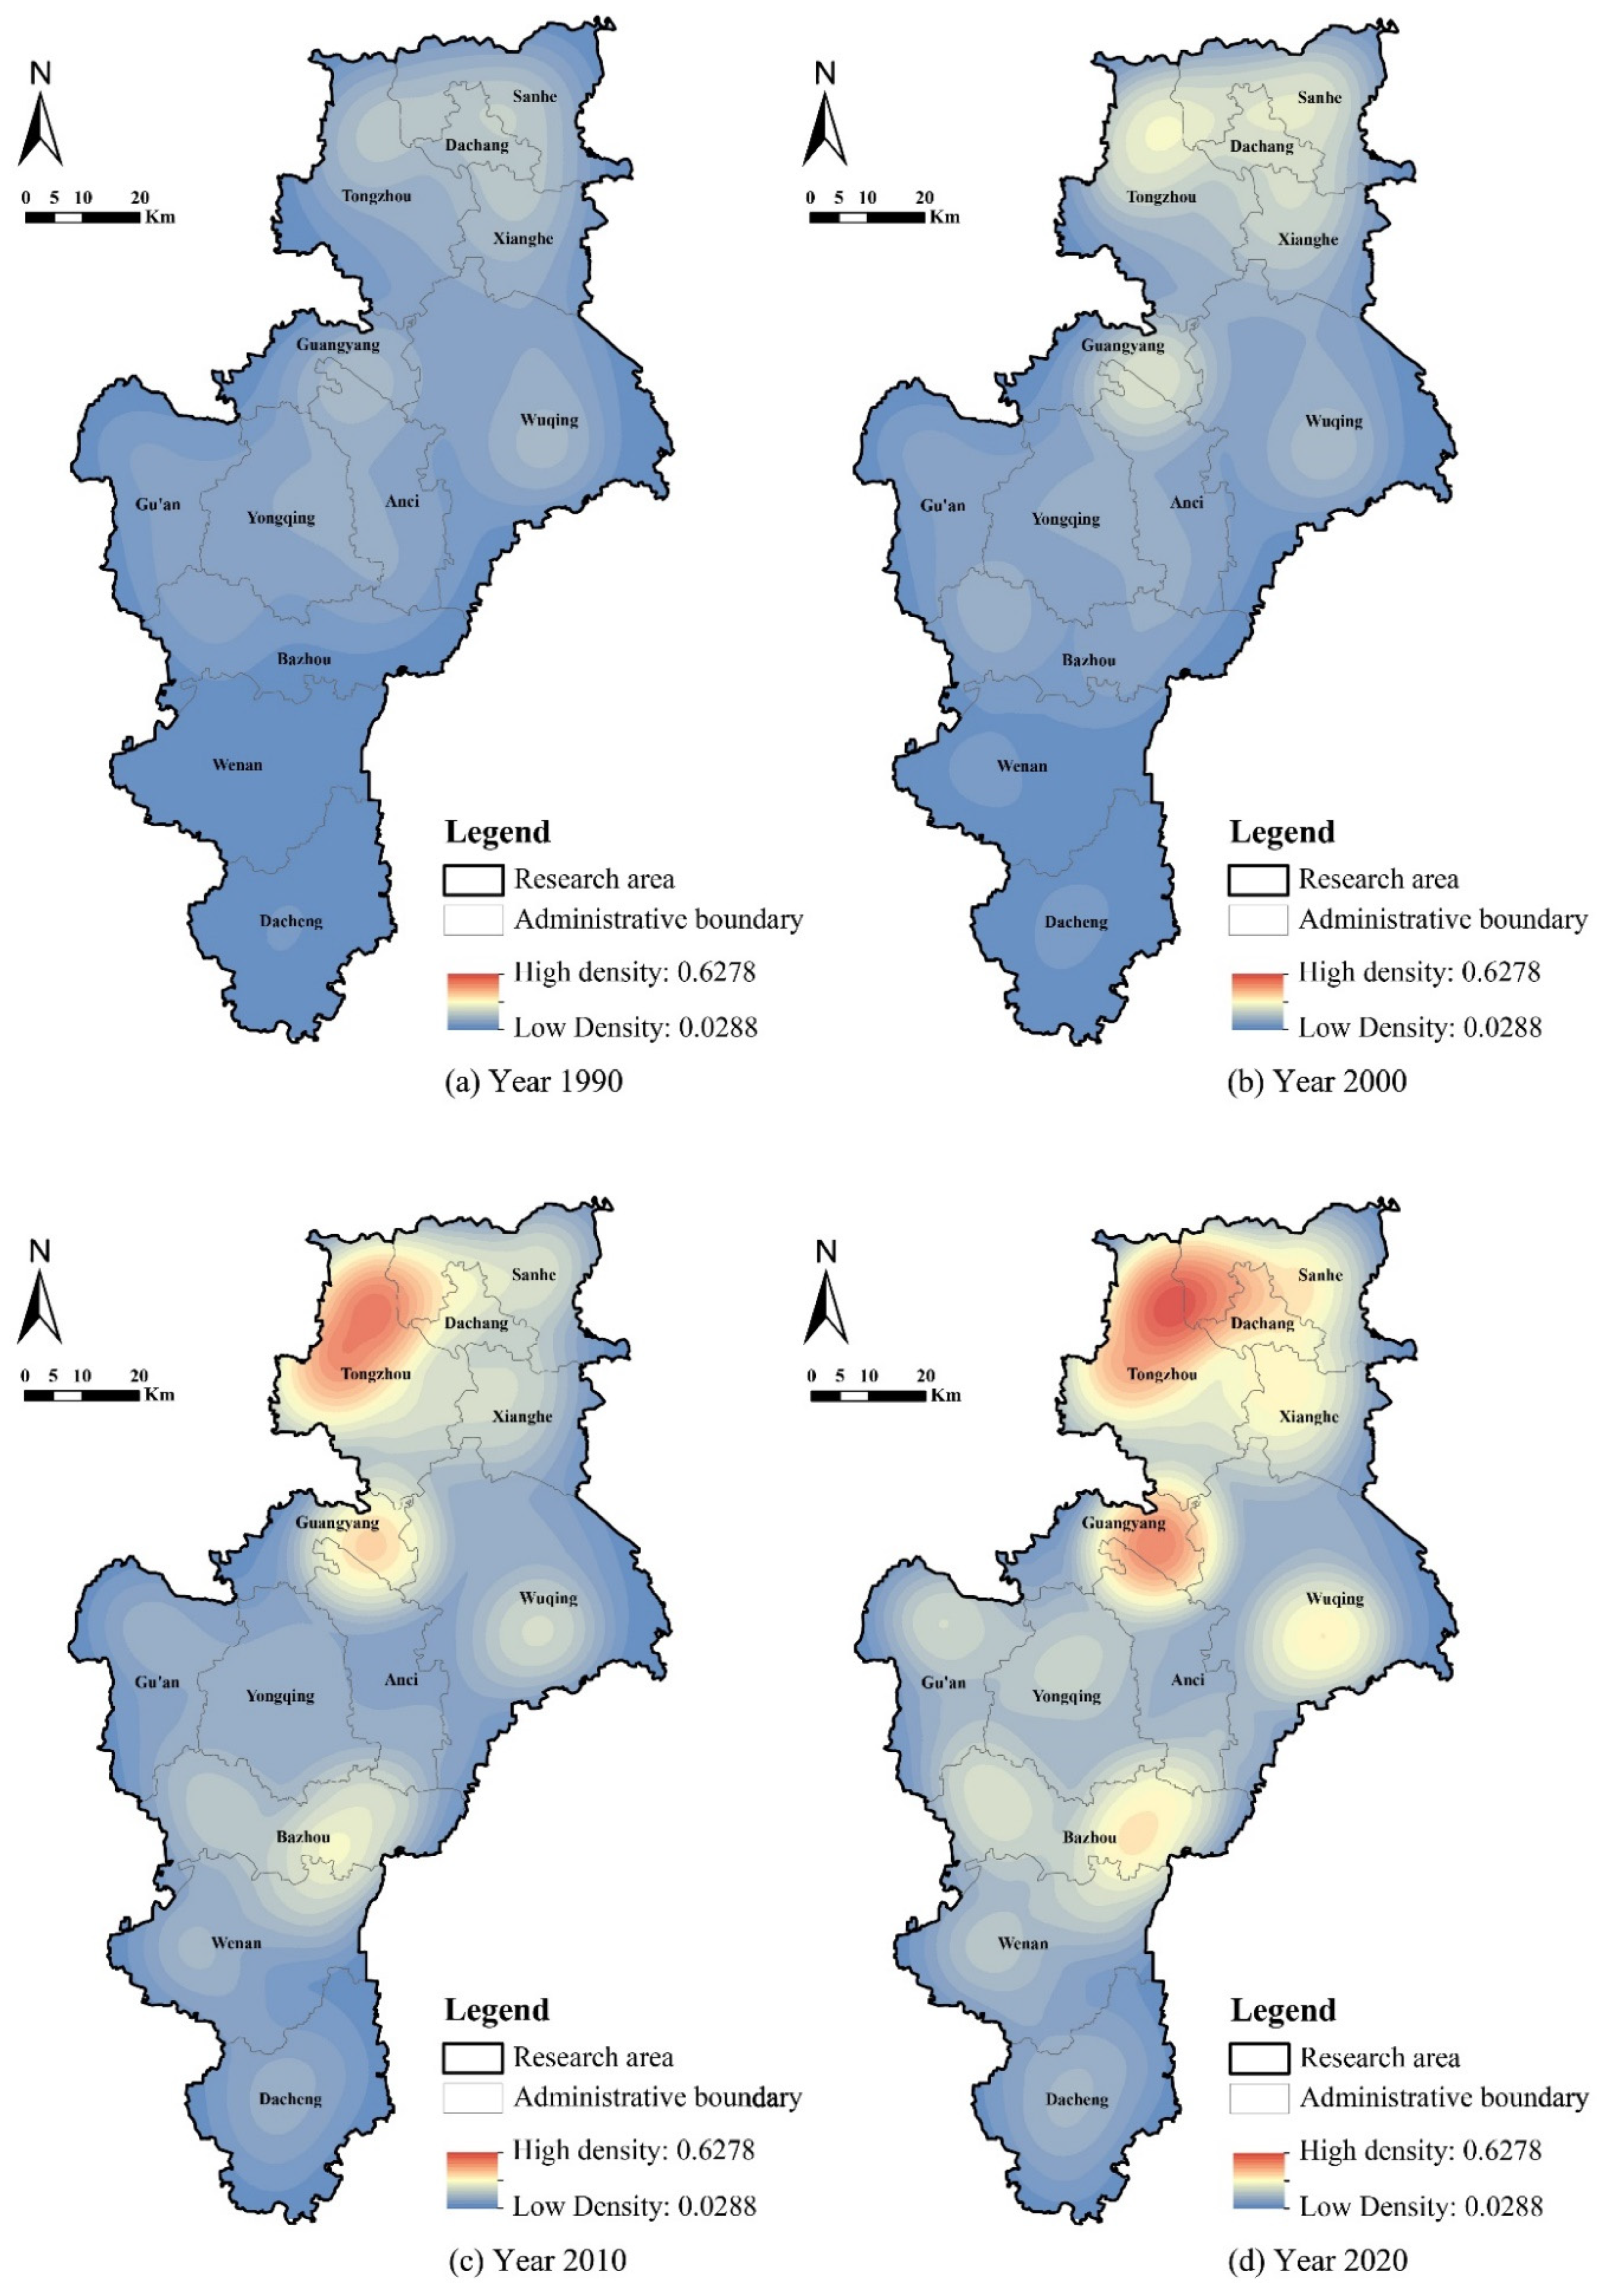
2.3.4. Kernel Density Analysis
2.3.5. Analysis of Driving Factors
3. Results and Analysis
3.1. Spatiotemporal Evolution of LUC
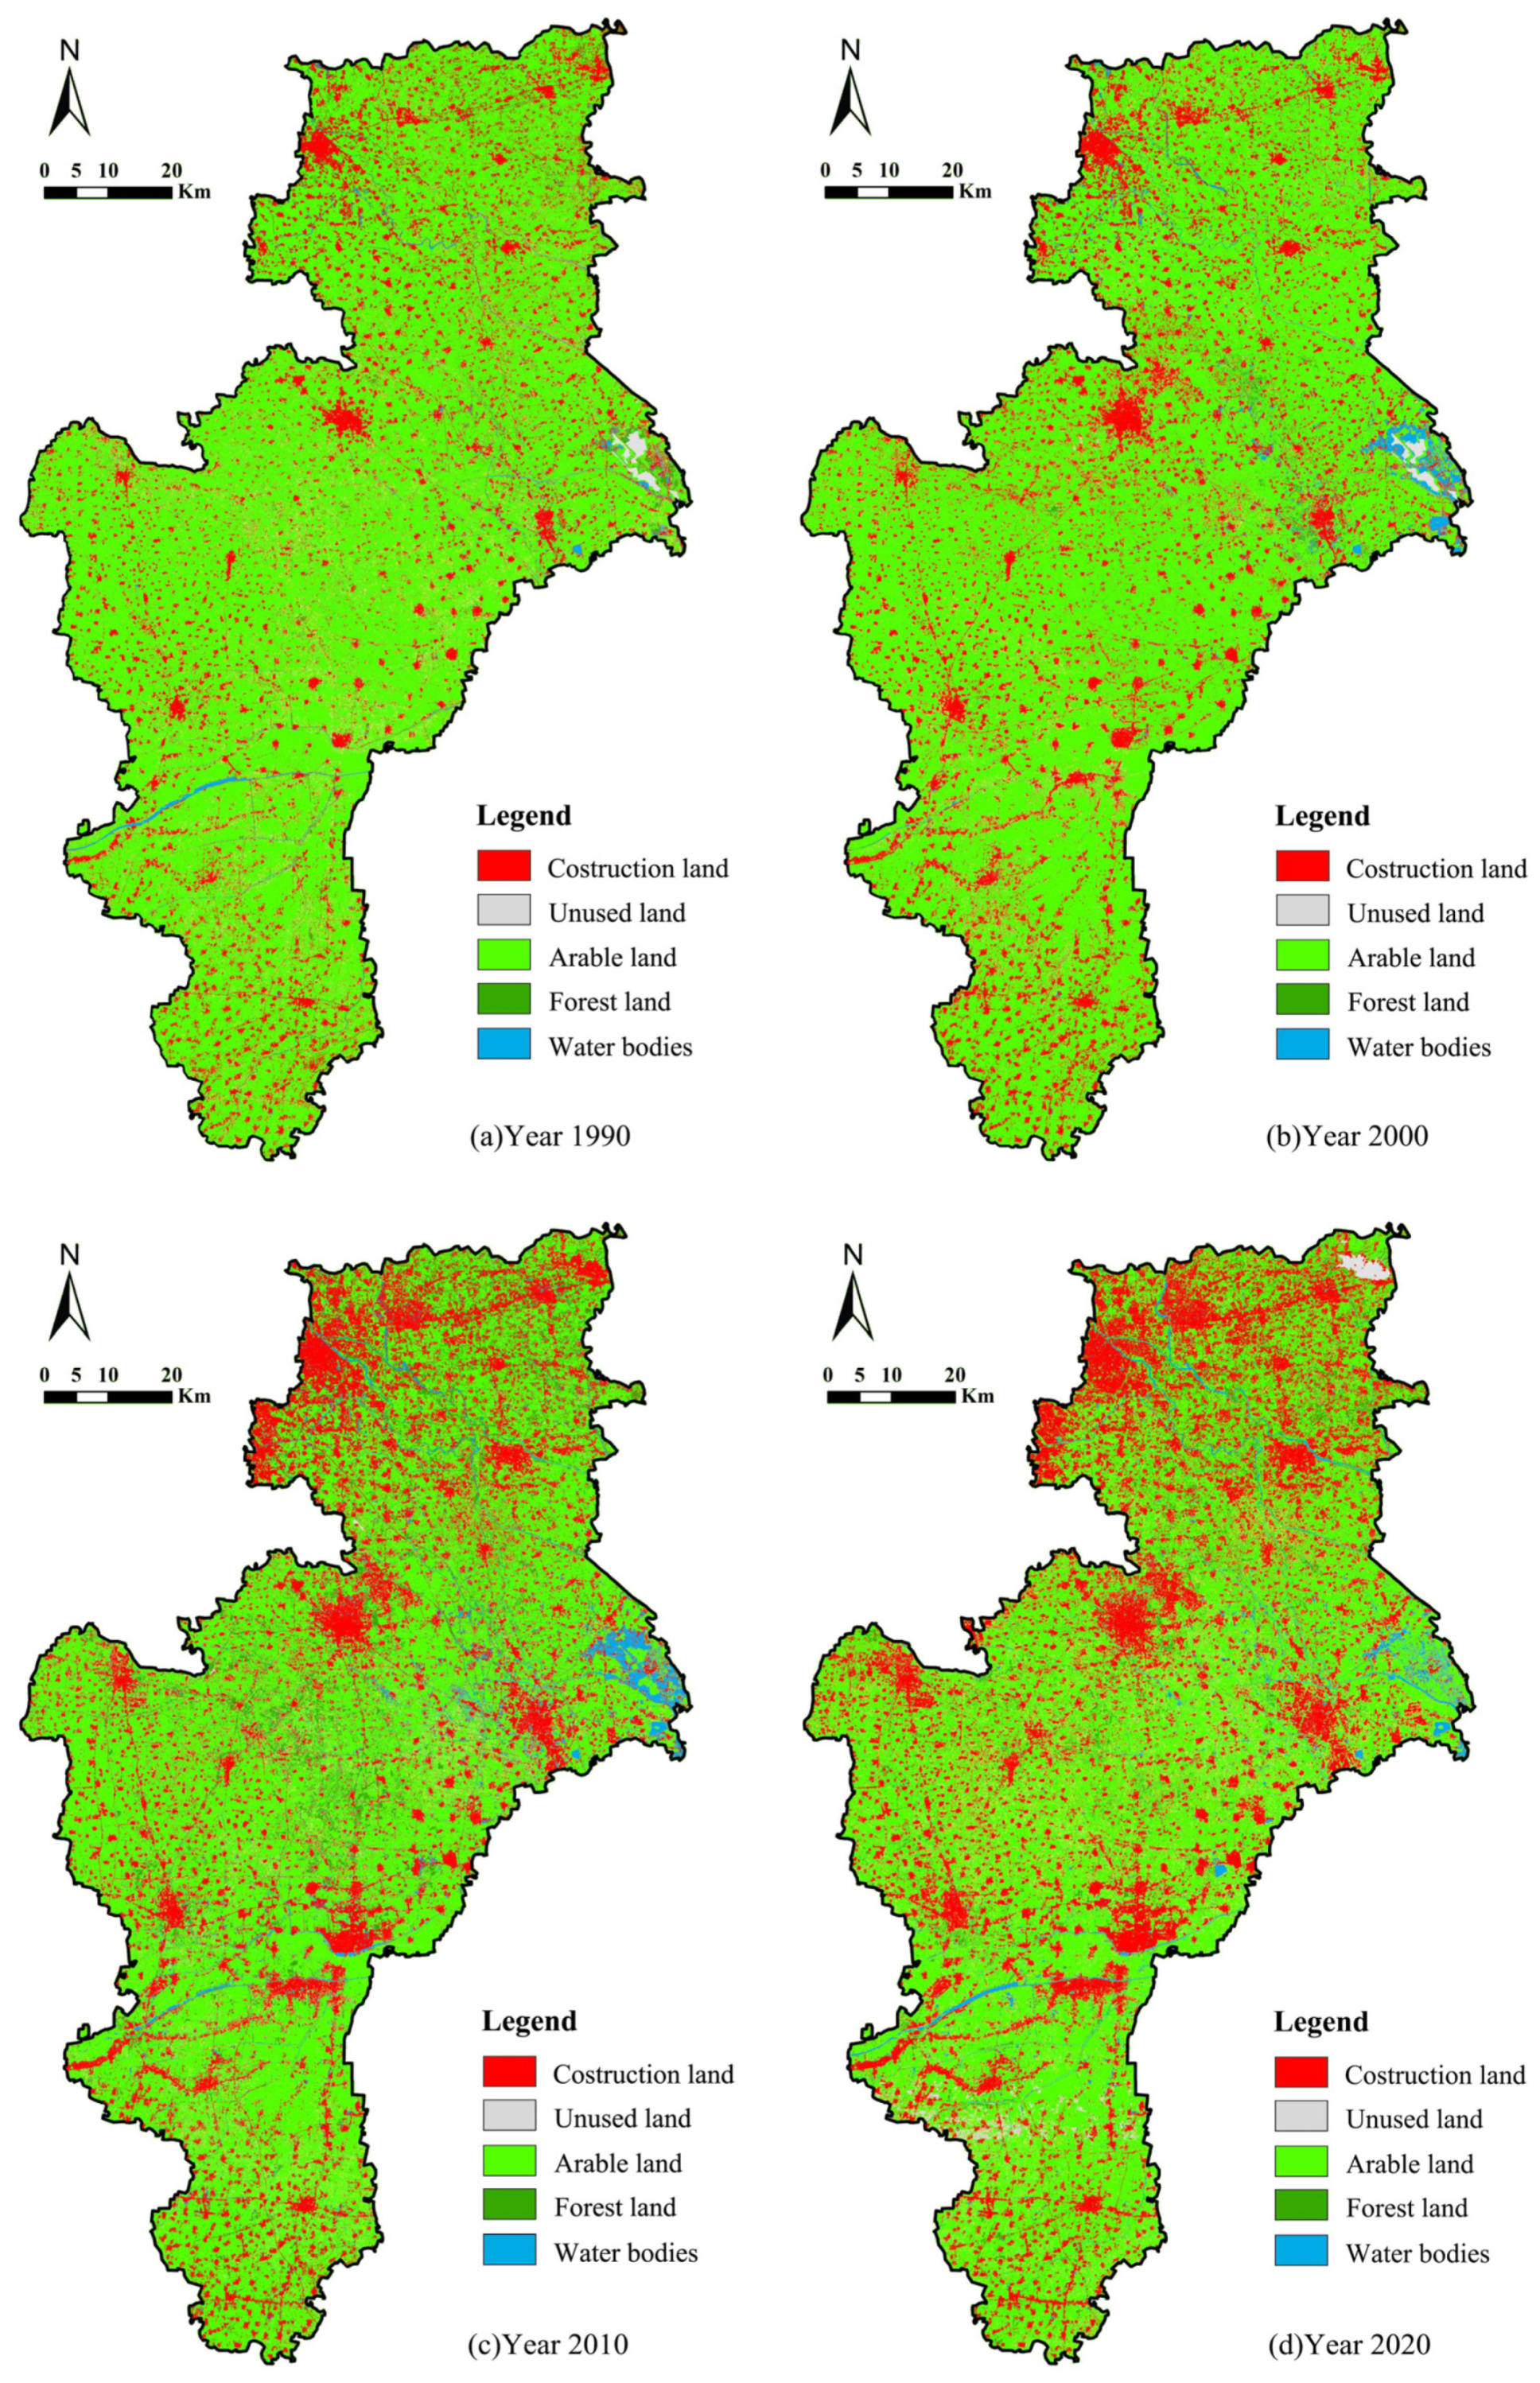
3.1.1. 1990–2000: Low-Level and Disorderly Expansion of Construction Land
3.1.2. 2000–2010: Rapid Expansion under the Influence of Multiple Policies
3.1.3. 2010–2020: Strict Control of the Scale of Incremental Construction Land
3.2. Driving Factors of Construction Land
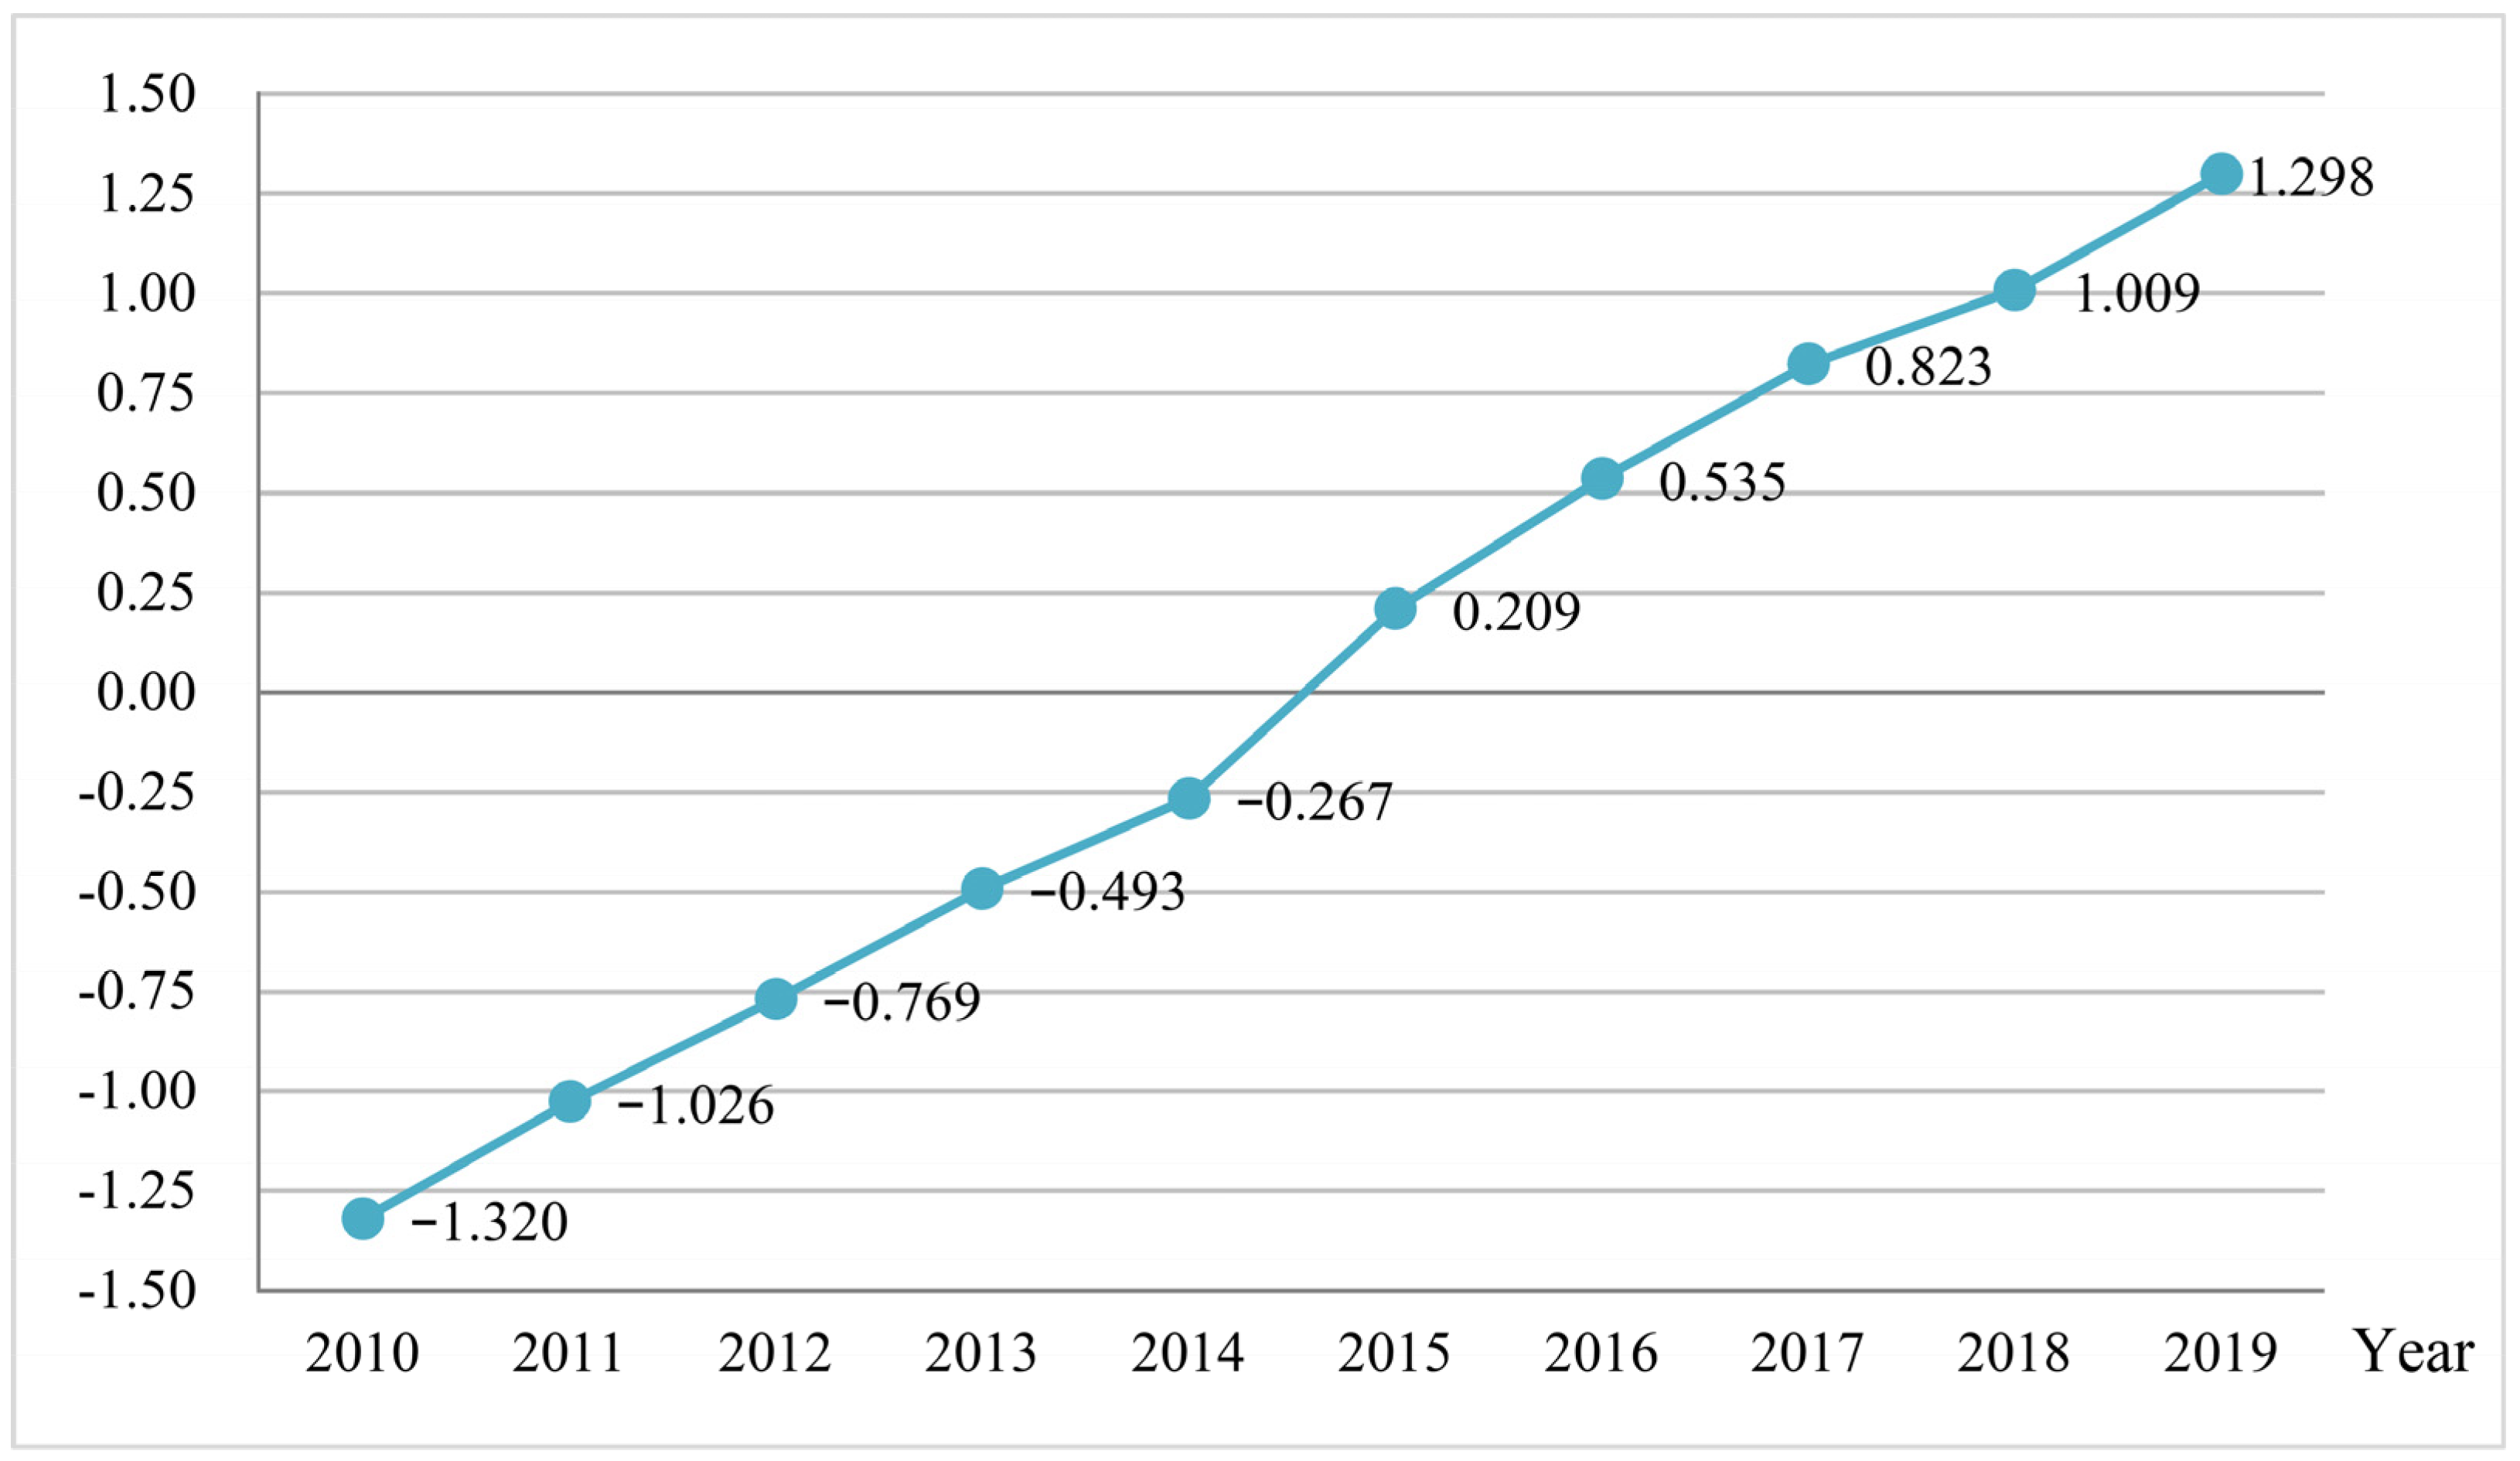
3.2.1. PCA of Driving Forces
3.2.2. Regression Analysis of Driving Factors
4. Discussion
5. Conclusions
Author Contributions
Funding
Institutional Review Board Statement
Informed Consent Statement
Data Availability Statement
Conflicts of Interest
References
- Mcdaniel, M.D.; Saha, D.; Dumont, M.G.; Hernandez, M.; Adams, M.A. The effect of land-use change on soil CH4 and N2O fluxes: A global meta-analysis. Ecosystems 2019, 22, 1424–1443. [Google Scholar] [CrossRef]
- Kiprotich, P.; Wei, X.; Zhang, Z.; Ngigi, T.; Qiu, F.; Wang, L. Assessing the impact of land use and climate change on surface runoff response using gridded observations and swat+. Hydrology 2021, 8, 48. [Google Scholar] [CrossRef]
- Hasan, S.S.; Zhen, L.; Miah, M.G.; Ahamed, T.; Samie, A. Impact of land use change on ecosystem services: A review. Environ. Dev. 2020, 34, 100527. [Google Scholar] [CrossRef]
- Newbold, T.; Adams, G.L.; Robles, G.A.; Boakes, E.H.; Ferreira, G.B.; Chapman, A.S.A.; Etard, A.; Gibb, R.; Millard, J.; Outhwaite, C.L.; et al. Climate and land-use change homogenise terrestrial biodiversity, with consequences for ecosystem functioning and human well-being. Emerg. Top. Life Sci. 2019, 3, 207–219. [Google Scholar] [CrossRef] [PubMed]
- Kassa, H.; Dondeyne, S.; Poesen, J.; Frankl, A.; Nyssen, J. Transition from forest-based to cereal-based agricultural systems: A review of the drivers of land use change and degradation in southwest Ethiopia. Land Degrad. Dev. 2017, 28, 431–449. [Google Scholar] [CrossRef]
- Hoekman, S.K.; Broch, A. Environmental implications of higher ethanol production and use in the us: A literature review. Part ii-biodiversity, land use change, ghg emissions, and sustainability. Renew. Sustain. Energy Rev. 2018, 81, 3159–3177. [Google Scholar] [CrossRef]
- Lambin, E.F.; Meyfroidt, P. Global land use change, economic globalization, and the looming land scarcity. Proc. Natl. Acad. Sci. USA 2011, 108, 3465–3472. [Google Scholar] [CrossRef] [PubMed]
- Fescenko, A.; Wohlgemuth, T. Spatio-temporal analyses of local biodiversity hotspots reveal the importance of historical land-use dynamics. Biodivers. Conserv. 2017, 26, 2401–2419. [Google Scholar] [CrossRef]
- Shi, P.; Zhang, Y.; Li, Z.; Li, P.; Xu, G. Influence of land use and land cover patterns on seasonal water quality at multi-spatial scales. Catena 2017, 151, 182–190. [Google Scholar] [CrossRef]
- Veldkamp, A.; Lambin, E.F. Predicting land-use change. Agric. Ecosyst. Environ. 2001, 85, 1–6. [Google Scholar] [CrossRef]
- Verburg, P.H.; Eickhout, B.; Van Meijl, H. A multi-scale, multi-model approach for analyzing the future dynamics of European land use. Ann. Reg. Sci. 2008, 42, 57–77. [Google Scholar] [CrossRef]
- Chen, Y.; Li, X.; Liu, X.; Zhang, Y.; Huang, M. Quantifying the teleconnections between local consumption and domestic land uses in china. Landsc. Urban Plan. 2019, 187, 60–69. [Google Scholar] [CrossRef]
- Liu, J.; Kuang, W.; Zhang, Z.; Xu, X.; Qin, Y.; Ning, J.; Zhou, W.; Zhang, S.; Li, R.; Yan, C.; et al. Spatiotemporal characteristics, patterns, and causes of land-use changes in china since the late 1980s. J. Geogr. Sci. 2014, 24, 195–210. [Google Scholar] [CrossRef]
- Meyfroidt, P.; Lambin, E.F.; Erb, K.H.; Hertel, T.W. Globalization of land use: Distant drivers of land change and geographic displacement of land use. Curr. Opin. Environ. Sustain. 2013, 5, 438–444. [Google Scholar] [CrossRef]
- Liu, W.; Zhan, J.; Zhao, F.; Yan, H.; Zhang, F.; Wei, X. Impacts of urbanization-induced land-use changes on ecosystem services: A case study of the pearl river delta metropolitan region, china. Ecol. Indic. 2019, 98, 228–238. [Google Scholar] [CrossRef]
- Tran, D.X.; Pla, F.; Latorre-carmona, P.; Myint, S.W.; Gaetano, M.; Kieu, H.V. Characterizing the relationship between land use land cover change and land surface temperature. ISPRS J. Photogramm. Remote Sens. 2017, 124, 119–132. [Google Scholar] [CrossRef]
- Wang, R.; Derdouri, A.; Murayama, Y. Spatiotemporal simulation of future land use/cover change scenarios in the Tokyo metropolitan area. Sustainability 2018, 10, 2056. [Google Scholar] [CrossRef]
- Aguilera, F.; Valenzuela, L.M.; Botequilha-Leitao, A. Landscape metrics in the analysis of urban land use patterns: A case study in a Spanish metropolitan area. Landsc. Urban Plan. 2011, 99, 226–238. [Google Scholar] [CrossRef]
- Gong, J.; Hu, Z.; Chen, W.; Liu, Y.; Wang, J. Urban expansion dynamics and modes in metropolitan Guangzhou, china. Land Use Policy 2018, 72, 100–109. [Google Scholar] [CrossRef]
- Pan, H.; Tong, X.; Xu, X.; Luo, X.; Jin, Y.; Xie, H.; Li, B. Updating of land cover maps and change analysis using globeland30 product: A case study in shanghai metropolitan area, china. Remote Sens. 2020, 12, 3147. [Google Scholar] [CrossRef]
- Wu, J.; Jenerette, G.D.; Buyantuyev, A.; Redman, C.L. Quantifying spatiotemporal patterns of urbanization: The case of the two fastest growing metropolitan regions in the united states. Ecol. Complex. 2011, 8, 1–8. [Google Scholar] [CrossRef]
- Dadashpoor, H.; Azizi, P.; Moghadasi, M. Land use change, urbanization, and change in landscape pattern in a metropolitan area. Sci. Total Environ. 2019, 655, 707–719. [Google Scholar] [CrossRef] [PubMed]
- Osman, T.; Divigalpitiya, P.; Arima, T. Driving factors of urban sprawl in Giza governorate of Greater Cairo Metropolitan Region using AHP method. Land Use Policy 2016, 58, 21–31. [Google Scholar] [CrossRef]
- Zeng, C.; Liu, Y.; Stein, A.; Jiao, L. Characterization and spatial modeling of urban sprawl in the Wuhan metropolitan area, china. Int. J. Appl. Earth Obs. Geoinf. 2015, 34, 10–24. [Google Scholar] [CrossRef]
- Kong, F.; Yin, H.; James, P.; Hutyra, L.R.; He, H.S. Effects of spatial pattern of greenspace on urban cooling in a large metropolitan area of eastern china. Landsc. Urban Plan. 2014, 128, 35–47. [Google Scholar] [CrossRef]
- Wu, K.; Ye, X.; Qi, Z.; Zhang, H. Impacts of land use/land cover change and socioeconomic development on regional ecosystem services: The case of fast-growing Hangzhou metropolitan area, china. Cities 2013, 31, 276–284. [Google Scholar] [CrossRef]
- Ye, Y.; Bryan, B.A.; Zhang, J.E.; Connor, J.D.; Chen, L.; Qin, Z.; He, M. Changes in land-use and ecosystem services in the Guangzhou-Foshan metropolitan area, china from 1990 to 2010: Implications for sustainability under rapid urbanization. Ecol. Indic. 2018, 93, 930–941. [Google Scholar] [CrossRef]
- Bose, A.; Chowdhury, I.R. Monitoring and modeling of spatio-temporal urban expansion and land-use/land-cover change using markov chain model: A case study in Siliguri Metropolitan Area, West Bengal, India. Model. Earth Syst. Environ. 2020, 6, 2235–2249. [Google Scholar] [CrossRef]
- Jun, M. A comparison of a gradient boosting decision tree, random forests, and artificial neural networks to model urban land use changes: The case of the Seoul metropolitan area. Int. J. Geogr. Inf. Sci. 2021, 35, 2149–2167. [Google Scholar] [CrossRef]
- Rahnama, M.R. Forecasting land-use changes in Mashhad Metropolitan area using cellular automata and markov chain model for 2016–2030. Sustain. Cities Soc. 2021, 64, 102548. [Google Scholar] [CrossRef]
- Sohn, C.; Reitel, B.; Walther, O. Cross-border metropolitan integration in Europe: The case of Luxembourg, Basel, and Geneva. Environ. Plan. C-Gov. Policy 2009, 27, 922–939. [Google Scholar] [CrossRef]
- Vandenberg, L.; Braun, E.; Vandermeer, J. The organising capacity of metropolitan regions. Environ. Plan. C-Gov. Policy 1997, 15, 253–272. [Google Scholar] [CrossRef]
- Chen, L.; Xu, L.; Yang, Z. Inequality of industrial carbon emissions of the urban agglomeration and its peripheral cities: A case in the pearl river delta, china. Renew. Sustain. Energy Rev. 2019, 109, 438–447. [Google Scholar] [CrossRef]
- Chen, Y.; Sun, B. Does “agglomeration shadow” exist in Beijing-Tianjin-Hebei region? Large cities’ impact on regional economic growth. Geogr. Res. 2017, 36, 1936–1946. [Google Scholar]
- Giannotti, M.; Barros, J.; Tomasiello, D.B.; Smith, D.; Pizzol, B.; Santos, B.M.; Zhong, C.; Shen, Y.; Marques, E.; Batty, M. Inequalities in transit accessibility: Contributions from a comparative study between global south and north metropolitan regions. Cities 2021, 109, 103016. [Google Scholar] [CrossRef]
- Han, H.; Yang, C.; Wang, E.; Song, J.; Zhang, M. Evolution of jobs-housing spatial relationship in Beijing metropolitan area: A job accessibility perspective. Chin. Geogr. Sci. 2015, 25, 375–388. [Google Scholar] [CrossRef]
- Peng, J.; Tian, L.; Liu, Y.; Zhao, M.; Hu, Y.N.; Wu, J. Ecosystem services response to urbanization in metropolitan areas: Thresholds identification. Sci. Total Environ. 2017, 607, 706–714. [Google Scholar] [CrossRef]
- Vicuna, M.; Orellana, A.; Truffello, R.; Moreno, D. Urban integration and quality of urban life: Dilemmas in metropolitan contexts. Rev. INVI 2019, 34, 17–47. [Google Scholar]
- Cho, J.; Kim, J.H.; Kim, Y. Metropolitan governance structure and growth-inequality dynamics in the united states. Environ. Plan. A-Econ. Space 2019, 51, 598–616. [Google Scholar] [CrossRef]
- Lin, G.C.S.; Zhang, A.Y. China’s metropolises in transformation: Neoliberalizing politics, land commodification, and uneven development in beijing. Urban Geogr. 2017, 38, 643–665. [Google Scholar] [CrossRef]
- Ávila Sánchez, H. Agricultura urbana y periurbana: Reconfiguraciones territoriales y potencialidades en torno a los sistemas alimentarios urbanos. Investig. Geográficas 2019, 98, 9. [Google Scholar] [CrossRef]
- Bao, W.; Yang, Y.; Zou, L. How to reconcile land use conflicts in mega urban agglomeration? A scenario-based study in the Beijing-Tianjin-Hebei region, china. J. Environ. Manag. 2021, 296, 113168. [Google Scholar] [CrossRef]
- Ma, W.; Jiang, G.; Chen, Y.; Qu, Y.; Zhou, T.; Li, W. How feasible is regional integration for reconciling land use conflicts across the urban-rural interface? Evidence from Beijing-Tianjin-Hebei metropolitan region in china. Land Use Policy 2020, 92, 104433. [Google Scholar] [CrossRef]
- Sukhwani, V.; Thapa, K.; Shaw, R.; Deshkar, S.; Mitra, B.K.; Yan, W. Addressing urban-rural water conflicts in Nagpur through benefit sharing. Water 2020, 12, 2979. [Google Scholar] [CrossRef]
- Bittencourt, T.A.; Giannotti, M.; Marques, E. Cumulative (and self-reinforcing) spatial inequalities: Interactions between accessibility and segregation in four Brazilian metropolises. Environ. Plan. B-Urban Anal. City Sci. 2021, 48, 1989–2005. [Google Scholar] [CrossRef]
- Blanco, J.; Apaolaza, R. Socio-territorial inequality and differential mobility. Three key issues in the Buenos Aires Metropolitan Region. J. Transp. Geogr. 2018, 67, 76–84. [Google Scholar] [CrossRef]
- Dutta, I.; Das, A. Exploring the dynamics of spatial inequality through the development of sub-city typologies in english bazar urban agglomeration and its peri urban areas. GeoJournal 2019, 84, 829–849. [Google Scholar] [CrossRef]
- Musterd, S.; Hochstenbach, C.; Boterman, W. Ripples of structural economic transformation: The changing social geographies of dutch metropolitan regions. Appl. Geogr. 2020, 116, 102151. [Google Scholar] [CrossRef]
- Dupont, V. Conflicting stakes and governance in the peripheries of large Indian metropolises-an introduction. Cities 2007, 24, 89–94. [Google Scholar] [CrossRef]
- Florida, R.; Adler, P. The patchwork metropolis: The morphology of the divided postindustrial city. J. Urban Aff. 2018, 40, 609–624. [Google Scholar] [CrossRef]
- Savitch, H.V.; Adhikari, S. Fragmented regionalism: Why metropolitan America continues to splinter. Urban Aff. Rev. 2017, 53, 381–402. [Google Scholar] [CrossRef]
- Durand, F.; Decoville, A.; Knippschild, R. Everything all right at the internal eu borders? The ambivalent effects of cross-border integration and the rise of Euroscepticism. Geopolitics 2020, 25, 587–608. [Google Scholar] [CrossRef]
- Gumy, A.; Drevon, G.; Kaufmann, V. Inequalities in access to cross-border resources? An analysis based on spatio-temporal behaviours in the cross-border area of Greater Geneva. Eur. Urban Reg. Stud. 2022, 29, 85–106. [Google Scholar] [CrossRef]
- Roeder, A.; Proepper, M.; Stellmes, M.; Schneibel, A.; Hill, J. Assessing urban growth and rural land use transformations in a cross-border situation in Northern Namibia and Southern Angola. Land Use Policy 2015, 42, 340–354. [Google Scholar] [CrossRef]
- Castanho, R.A. The relevance of political engagement and transparency in cross-border cooperation (CBC) environments: Analyzing border cities in Europe. Lex Localis-J. Local Self-Gov. 2020, 18, 487–502. [Google Scholar] [CrossRef]
- Oliveras González, X. Iniciativas de planificación territorial transfronteriza en Matamoros-Brownsville (México-Estados Unidos). Investig. Geográficas 2016, 2016, 154–167. [Google Scholar] [CrossRef][Green Version]
- Ulrich, P. Territorial cooperation, supraregionalist institution-building and national boundaries: The European grouping of territorial cooperation (EGTC) at the eastern and western German borders. Eur. Plan. Stud. 2020, 28, 57–80. [Google Scholar] [CrossRef]
- Yang, C. Multilevel governance in the cross-boundary region of Hong Kong-pearl river delta, China. Environ. Plan. A-Econ. Space 2005, 37, 2147–2168. [Google Scholar] [CrossRef]
- You, N.; Shen, Z.; Pai, J.; Kobayashi, F. Prospects for sub-regional cooperation in Fujian and Taiwan from perspective of urban planning system: A case study of Pingtan experimental area. Int. Rev. Spat. Plan. Sustain. Dev. 2017, 5, 60–79. [Google Scholar] [CrossRef][Green Version]
- Zhao, C.; Jensen, J.; Zhan, B. A comparison of urban growth and their influencing factors of two border cities: Laredo in the US and Nuevo Laredo in Mexico. Appl. Geogr. 2017, 79, 223–234. [Google Scholar] [CrossRef]
- Li, G.; Song, C. Research on interregional regulation in the border of Beijing-Tianjin-Hebei metropolitan region: A case study of Tongzhou-Wuqing-Langfang. Reg. Econ. Rev. 2017, 1, 52–59. [Google Scholar] [CrossRef]
- Alipbeki, O.; Alipbekova, C.; Sterenharz, A.; Toleubekova, Z.; Aliyev, M.; Mineyev, N.; Amangaliyev, K. A spatiotemporal assessment of land use and land cover changes in peri-urban areas: A case study of Arshaly District, Kazakhstan. Sustainability 2020, 12, 1556. [Google Scholar] [CrossRef]
- Li, K.M.; Feng, M.M.; Biswas, A.; Su, H.H.; Niu, Y.L.; Cao, J.J. Driving factors and future prediction of land use and cover change based on satellite remote sensing data by the LCM model: A case study from Gansu province, china. Sensors 2020, 20, 2757. [Google Scholar] [CrossRef]
- Alijani, Z.; Hosseinali, F.; Biswas, A. Spatio-temporal evolution of agricultural land use change drivers: A case study from Chalous region, Iran. J. Environ. Manag. 2020, 262, 13. [Google Scholar] [CrossRef] [PubMed]
- Zhou, Y.; Li, X.H.; Liu, Y.S. Land use change and driving factors in rural china during the period 1995-2015. Land Use Policy 2020, 99, 16. [Google Scholar] [CrossRef]
- Jiao, L.; Li, Z.; Xu, G.; Zhang, B.; Dong, T.; Gu, Y. The characteristics and patterns of spatially aggregated elements in urban areas of Wuhan. Acta Geogr. Sin. 2017, 72, 1432–1443. [Google Scholar]
- Zhang, J. Characteristics and driving factors of land use change in Beijing-Tianjin-Hebei region. Contemp. Econ. 2019, 7, 54–57. [Google Scholar]
- Li, C.; Wu, K.; Zha, L. Research on land use change characteristics and driving forces in Beijing, Tianjin and Hebei region. China Popul. Resour. Environ. 2016, 26, 252–255. [Google Scholar] [CrossRef] [PubMed]
- Lin, J. Urban-Rural Construction Land Growth in China; The Commercial Press: Beijing, China, 2009. [Google Scholar]
- Xia, F.; Li, Y.; Yan, J. The relationship between land finance and economic growth under the industrial structure perspective—based on dynamic panel data analysis with SYS-GMM methods. Econ. Geogr. 2014, 34, 85–92. [Google Scholar] [CrossRef]
- Guo, Z.; Gu, N. Institutional change, land finance and extended urban expansion: A new perspective to explain the phenomenon of urbanization and high industrial structure in China. Soc. Sci. Res. 2013, 1, 8–14. [Google Scholar]
- Dong, L.; Lin, J. The Thinking and Exploring of Integrated Land-Use Planning; China Architecture & Building Press: Beijing, China, 2010. [Google Scholar]
- Zhang, J.; Wang, S. Land consolidation strategies of collective construction land in the background of “less amount and improving quality” in Tongzhou District, Beijing. Planners 2015, 31, 29–35. [Google Scholar]
- Leck, H.; Simon, D. Local authority responses to climate change in South Africa: The challenges of transboundary governance. Sustainability 2018, 10, 2542. [Google Scholar] [CrossRef]
- Chen, X. The logical identification of “population orient land” planning method triggered by the tightening amount of construction land: Taking Hangzhou’ main district as an example. In Proceedings of the 2021 China Urban Planning Annual Conference, Chengdu, China, 25–30 September 2021; pp. 321–328. [Google Scholar]
- Piao, Y.; Ma, K. Economic driving force of urban built-up area expansion in Beijing: 1978–2002. Nat. Resour. Econ. China 2006, 7, 34–37. [Google Scholar]
- Li, X. The Fixed Assets Investment of Lanzhou and the Relation between Itself and the Spatial Expansion of City; Lanzhou University: Lanzhou, China, 2007. [Google Scholar]
- Deng, Y. Self-organization characteristics of urban extension and the planning effect evaluation: A case study of Beijing. Geogr. Res. 2016, 35, 353–362. [Google Scholar]
- Liu, H.; Ma, L. Space governances in Beijing-Tianjin-Hebei border region. Areal Res. Dev. 2020, 39, 36–40. [Google Scholar]
- Liu, F.; Fu, L.; Xu, K. Structure and effect measurement of inter-government and inter-city cooperation network of medical and health services: Taking Beijing-Tianjin-Hebei metropolitan region as an example. J. Northeast. Univ. (Soc. Sci. ) 2021, 23, 59–66. [Google Scholar] [CrossRef]
- Hu, Y. Difficulties of air pollution cooperative governance in Beijing-Tianjin-Hebei region and the solution paths: Relation network, action strategy and governance structure. J. Dalian Univ. Technol. (Soc. Sci.) 2020, 41, 48–56. [Google Scholar] [CrossRef]
| Land-Use Dynamic Degree | Land Use Type | Period | ||
|---|---|---|---|---|
| 1990–2000 | 2000–2010 | 2010–2020 | ||
| Comprehensive dynamic degree | Total | 0.99% | 2.54% | 0.78% |
| Single dynamic degree | Construction land | 3.91% | 4.97% | 1.91% |
| Unused land | 1.59% | 9.60% | 142.85% | |
| Arable land | 0.65% | 1.64% | 0.26% | |
| Forest land | 8.09% | 25.44% | 6.84% | |
| Water bodies | 11.52% | 12.98% | 6.08% | |
| Region | Time | Construction Land | Unused Land | Arable Land | Forest Land | Water Bodies | Total |
|---|---|---|---|---|---|---|---|
| TWL region | 1990 | 1011.94 | 22.53 | 7399.30 | 366.34 | 94.72 | 8894.82 |
| 2000 | 1367.05 | 19.85 | 7132.63 | 195.72 | 179.57 | 8894.82 | |
| (35.1%) | (−11.9%) | (−3.6%) | (−46.6%) | (89.6%) | |||
| 2010 | 1914.84 | 1.41 | 6023.56 | 602.57 | 352.45 | 8894.82 | |
| (40.1%) | (−92.9%) | (−15.5%) | (207.9%) | (96.3%) | |||
| 2020 | 2242.62 | 20.08 | 5983.72 | 449.88 | 198.52 | 8894.82 | |
| (17.1%) | (1328.5%) | (−0.7%) | (−25.3%) | (−43.7%) | |||
| Tongzhou District of Beijing | 1990 | 136.50 | 0.04 | 705.37 | 44.23 | 18.30 | 904.43 |
| 2000 | 168.75 | 0.04 | 690.93 | 10.34 | 34.37 | 904.43 | |
| (23.6%) | (0.0%) | (−2.0%) | (−76.6%) | (87.8%) | |||
| 2010 | 260.49 | 0.94 | 529.64 | 72.32 | 41.05 | 904.43 | |
| (54.4%) | (2242.3%) | (−23.3%) | (599.6%) | (19.4%) | |||
| 2020 | 301.57 | 0.03 | 530.60 | 48.43 | 23.80 | 904.43 | |
| (15.8%) | (−96.8%) | (0.2%) | (−33.0%) | (−42.0%) | |||
| Wuqing District of Tianjin | 1990 | 178.25 | 22.46 | 1232.33 | 118.17 | 24.23 | 1575.43 |
| 2000 | 242.43 | 19.79 | 1127.04 | 100.83 | 85.34 | 1575.43 | |
| (36.0%) | (−11.9%) | (−8.5%) | (−14.7%) | (252.2%) | |||
| 2010 | 325.44 | 0.02 | 1015.07 | 110.30 | 124.60 | 1575.43 | |
| (34.2%) | (−99.9%) | (−9.9%) | (9.4%) | (46.0%) | |||
| 2020 | 360.05 | 0.03 | 1042.23 | 106.47 | 66.65 | 1575.43 | |
| (10.6%) | (50.0%) | (2.7%) | (−3.5%) | (−46.5%) | |||
| Langfang City (Except the three northern counties) | 1990 | 530.84 | 0.01 | 4460.09 | 129.15 | 36.79 | 5156.88 |
| 2000 | 770.87 | 0.01 | 4317.54 | 39.15 | 29.32 | 5156.88 | |
| (45.2%) | (0.0%) | (−3.2%) | (−69.7%) | (−20.3%) | |||
| 2010 | 981.04 | 0.42 | 3749.61 | 284.35 | 141.46 | 5156.88 | |
| (27.3%) | (4085.0%) | (−13.2%) | (626.3%) | (382.5%) | |||
| 2020 | 1179.74 | 0.05 | 3689.74 | 206.42 | 80.94 | 5156.88 | |
| (20.3%) | (−88.1%) | (−1.6%) | (−27.4%) | (−42.8%) | |||
| Three northern counties of Langfang | 1990 | 166.35 | 0.02 | 1001.51 | 74.79 | 15.40 | 1258.08 |
| 2000 | 185.00 | 0.01 | 997.12 | 45.39 | 30.55 | 1258.08 | |
| (11.2%) | (−50.0%) | (−0.4%) | (−39.3%) | (98.4%) | |||
| 2010 | 347.86 | 0.03 | 729.24 | 135.60 | 45.35 | 1258.08 | |
| (88.0%) | (200.0%) | (−26.9%) | (198.7%) | (48.4%) | |||
| 2020 | 401.27 | 19.97 | 721.15 | 88.56 | 27.13 | 1258.08 | |
| (15.4%) | (66,454.9%) | (−1.1%) | (−34.7%) | (−40.2%) |
| Factor | X1 | X2 | X3 | X4 | X5 | X6 | X7 | X8 |
|---|---|---|---|---|---|---|---|---|
| X1 | 1.000 | |||||||
| X2 | 0.860 ** | 1.000 | ||||||
| X3 | 0.817 ** | 0.948 ** | 1.000 | |||||
| X4 | 0.831 ** | 0.967 ** | 0.936 ** | 1.000 | ||||
| X5 | 0.962 ** | 0.814 ** | 0.726 ** | 0.789 ** | 1.000 | |||
| X6 | 0.046 | 0.222 | 0.088 | 0.327 * | 0.097 | 1.000 | ||
| X7 | 0.100 | 0.235 | 0.260 | 0.379 * | 0.173 | 0.648 ** | 1.000 | |
| X8 | 0.793 ** | 0.923 ** | 0.878 ** | 0.957 ** | 0.732 ** | 0.431 ** | 0.466 ** | 1.000 |
| Code | DRIVING Factor | Unit | Composition 1 | Composition 2 |
|---|---|---|---|---|
| X1 | Output value of secondary industry | Billion RMB | 0.964 | 0.134 |
| X2 | Output value of tertiary Industry | Billion RMB | 0.958 | 0.195 |
| X3 | Investment in fixed assets | Billion RMB | 0.924 | 0.159 |
| X4 | Total retail sales of consumer goods | Billion RMB | 0.932 | 0.330 |
| X5 | Population of permanent resident | Thousand persons | 0.926 | 0.162 |
| X6 | Urbanization rate | % | 0.096 | 0.846 |
| X7 | Per capita disposable income of residents | RMB | 0.049 | 0.946 |
| X8 | General financial budget expenditure | Billion RMB | 0.881 | 0.437 |
| Code | Variable | Coefficient | Standardized Coefficient Beta | t | Significant |
|---|---|---|---|---|---|
| (constant) | 265.319 | 11.581 | 0.000 ** | ||
| X1 | Output value of secondary industry | 1.283 | 0.087 | 2.996 | 0.006 ** |
| X2 | Output value of tertiary Industry | 1.409 | 0.124 | 7.546 | 0.000 ** |
| X5 | Population of permanent residents | 0.277 | 0.801 | 27.496 | 0.000 ** |
| X6 | Urbanization rate | −436.674 | −0.075 | −7.420 | 0.000 ** |
| X7 | Per capita disposable income of residents | −0.005 | −0.073 | −5.944 | 0.000 ** |
| Region | Code | Variable | Coefficient | Standardized Coefficient Beta | t | Significant |
|---|---|---|---|---|---|---|
| Tongzhou | (constant) | 247.963 | 54.583 | 0.000 ** | ||
| X3 | Investment in fixed assets | 0.579 | 0.959 | 9.546 | 0.000 ** | |
| Wuqing | (constant) | 222.783 | 16.926 | 0.000 ** | ||
| X5 | Population of permanent residents | 0.112 | 0.959 | 9.549 | 0.000 ** | |
| Langfang | (constant) | 586.682 | 12.458 | 0.000 ** | ||
| X6 | Urbanization rate | 1624.448 | 0.989 | 18.758 | 0.000 ** |
Publisher’s Note: MDPI stays neutral with regard to jurisdictional claims in published maps and institutional affiliations. |
© 2022 by the authors. Licensee MDPI, Basel, Switzerland. This article is an open access article distributed under the terms and conditions of the Creative Commons Attribution (CC BY) license (https://creativecommons.org/licenses/by/4.0/).
Share and Cite
Dai, L.; Zhan, Z.; Shu, Y.; Rong, X. Land Use Change in the Cross-Boundary Regions of a Metropolitan Area: A Case Study of Tongzhou-Wuqing-Langfang. Land 2022, 11, 153. https://doi.org/10.3390/land11020153
Dai L, Zhan Z, Shu Y, Rong X. Land Use Change in the Cross-Boundary Regions of a Metropolitan Area: A Case Study of Tongzhou-Wuqing-Langfang. Land. 2022; 11(2):153. https://doi.org/10.3390/land11020153
Chicago/Turabian StyleDai, Linlin, Zixin Zhan, Yeshuo Shu, and Xiao Rong. 2022. "Land Use Change in the Cross-Boundary Regions of a Metropolitan Area: A Case Study of Tongzhou-Wuqing-Langfang" Land 11, no. 2: 153. https://doi.org/10.3390/land11020153
APA StyleDai, L., Zhan, Z., Shu, Y., & Rong, X. (2022). Land Use Change in the Cross-Boundary Regions of a Metropolitan Area: A Case Study of Tongzhou-Wuqing-Langfang. Land, 11(2), 153. https://doi.org/10.3390/land11020153


