Article

Soil Erosion across Scales: Assessing Its Sources of Variation in Sahelian Landscapes under Semi-Arid Climate

1
Laboratoire Eaux, Hydro-Systèmes et Agriculture (LEHSA), Institut International d’Ingénierie de l’Eau et de l’Environnement (2iE), Rue de la Science, P.O. Box 594, Ouagadougou 01, Burkina Faso
2
Australian River Institute and School of Engineering, Griffith University, Nathan, QLD 4111, Australia
3
Civil and Environmental Engineering Department, King Fahd University of Petroleum & Minerals, Dhahran 31261, Saudi Arabia
*
Author to whom correspondence should be addressed.
Land 2022, 11(12), 2302; https://doi.org/10.3390/land11122302
Submission received: 18 November 2022 / Revised: 7 December 2022 / Accepted: 14 December 2022 / Published: 15 December 2022
(This article belongs to the Special Issue Quantification of Soil Erosion and Sediment Transport in Basins)

Abstract

:
Soil erosion varies in space and time. As the contributing surface area increases, heterogeneity effects are amplified, inducing scale effects. In the present study, soil erosion processes as affected by the observation scale and the soil surface conditions are assessed. An experimental field scale setup of 18 plots (1–150 m2) with different soil surface conditions (bare and degraded, cultivated) and slopes (0.75–4.2%) are used to monitor soil losses between 2010 to 2018 under natural rainfall. The results showed that soil loss rates range between 2.5 and 19.5 t.ha−1 under cultivated plots and increase to 12–45 t.ha−1 on bare and degraded soils, which outlines the control of soil surface conditions on soil erosion. At a larger scale (38 km2), soil losses are estimated at 2.2–4.5 t.ha−1, highlighting the major contribution of scale. The scale effect is likely caused by the redistribution of sediments in the drainage network. These findings outline the nature and contribution of the emerging and dominant soil erosion processes at larger scales. At the plot scale, however, diffuse erosion remains dominant, since surface runoff is laminar and sediment transport capacity is limited, resulting in lower soil erosion rates.

1. Introduction

Soil erosion has been reported as the greatest form of land degradation, and is harmful to food security [1,2,3,4,5]. In the West African Sahel, soils are prone to runoff erosion due to their compaction and surface sealing, which further promotes surface runoff [6,7,8]. Moreover, erosion is heightened by the anthropogenic pressure on natural resources through the conversion of natural vegetation to cultivated areas, the use of non-adapted agricultural practices and overgrazing [1,9,10,11]. Yet, the region is largely dependent on rainfed agriculture [12,13], with land being the major factor in the food production. Assessing the processes and mechanisms by which surface runoff and further soil erosion are generated appears to be critical in such context for framing adapted water and soil conservation policies and practices [14,15,16,17,18].
Several previous studies have focused on the assessment of soil erosion driven by natural rainfall in the Western Sahel region, mostly on quantifying soil loss rates at the scale of experimental plots [14,19,20,21,22,23,24,25,26,27,28]. Likewise, sheet and rill erosion have been reported in some of these studies, while gully erosion has been rarely considered [29,30,31]. On the other hand, few studies addressed the estimation of soil losses at watershed outlets [20,21,32,33]. These studies generally provide global estimates of soil erosion at the watershed level, which merge together the overall complexity of hydrodynamic processes without providing sufficient details on the contribution of individual contributing factors [34,35]. However, analysing the soil erosion processes at such a detailed level is essential as these elementary units convey the contribution of agricultural practices and other heterogeneities found along the flow path [31,36]. Building upon this, a direct link between plot scale erosion and soil losses at the watershed level can be identified, which could be further explored through extrapolation methods [28,37,38,39,40].
In this regard, an intermediate observation scale, the sub-watershed, can be considered for monitoring and assessment of soil losses [20,24,28,38]. It is large enough to include specific contributing soil surface conditions such as agricultural practices, barren lands and natural vegetation, but also the interaction between heterogeneous soil surface conditions, morphologies and stemming processes such as delayed runoff [29]. Sub-watershed scale-based studies offer interesting advantages and appear to be complementary in bridging the gap in linking plot-scale to watershed-scale observations [41,42,43]. However, this scale brings new concerns, namely the representativeness of the hydrological connectivity and processes. The drainage density is a dynamic manifestation resulting from the effect of various factors affecting the genesis of surface runoff and its channelling in the network [43]. It is often used as a proxy to characterize the joint effect of climatic, lithological and hydrological factors [44]. In that regard, previous studies mentioned the term “Representative Elementary Areas” (REA) [45], which can be considered a spatial entity having a stable and homogeneous behaviour in terms of hydrological response. The REA, therefore, appears as the minimum size of discretization of the watershed scale for which the representativeness of processes remains simple to assess and at which the effects of local heterogeneities are lessened.
In past studies, it has been shown with a large consensus that soil losses per unit area decrease when the scale increases [6,14,24,34,46,47,48,49,50,51]. Other studies indicate that this general trend exhibits a large variability [52,53], with specific cases where this trend has not been observed [54], or even reported with the opposite behaviour [55,56]. Therefore, there is a need to analyse such scale issues to improve the actual knowledge and understanding of the sources of variation. The continuous monitoring of soil erosion at the plot scale, the sub-watershed scale and the watershed scale can serve in this regard to identify the processes and factors governing soil erosion at various spatial scales [19,46,57,58]. In this research, the aim is twofold: (i) to quantify soil loss rates as affected by spatial scales, soil surface conditions, slopes and soil hydrodynamic properties; (ii) to assess the sources of variations in soil losses at these scales. The experiment is carried out in the Sahelian watershed landscape of Tougou in northern Burkina Faso, located within the West African Sahel.

2. Material and Methods

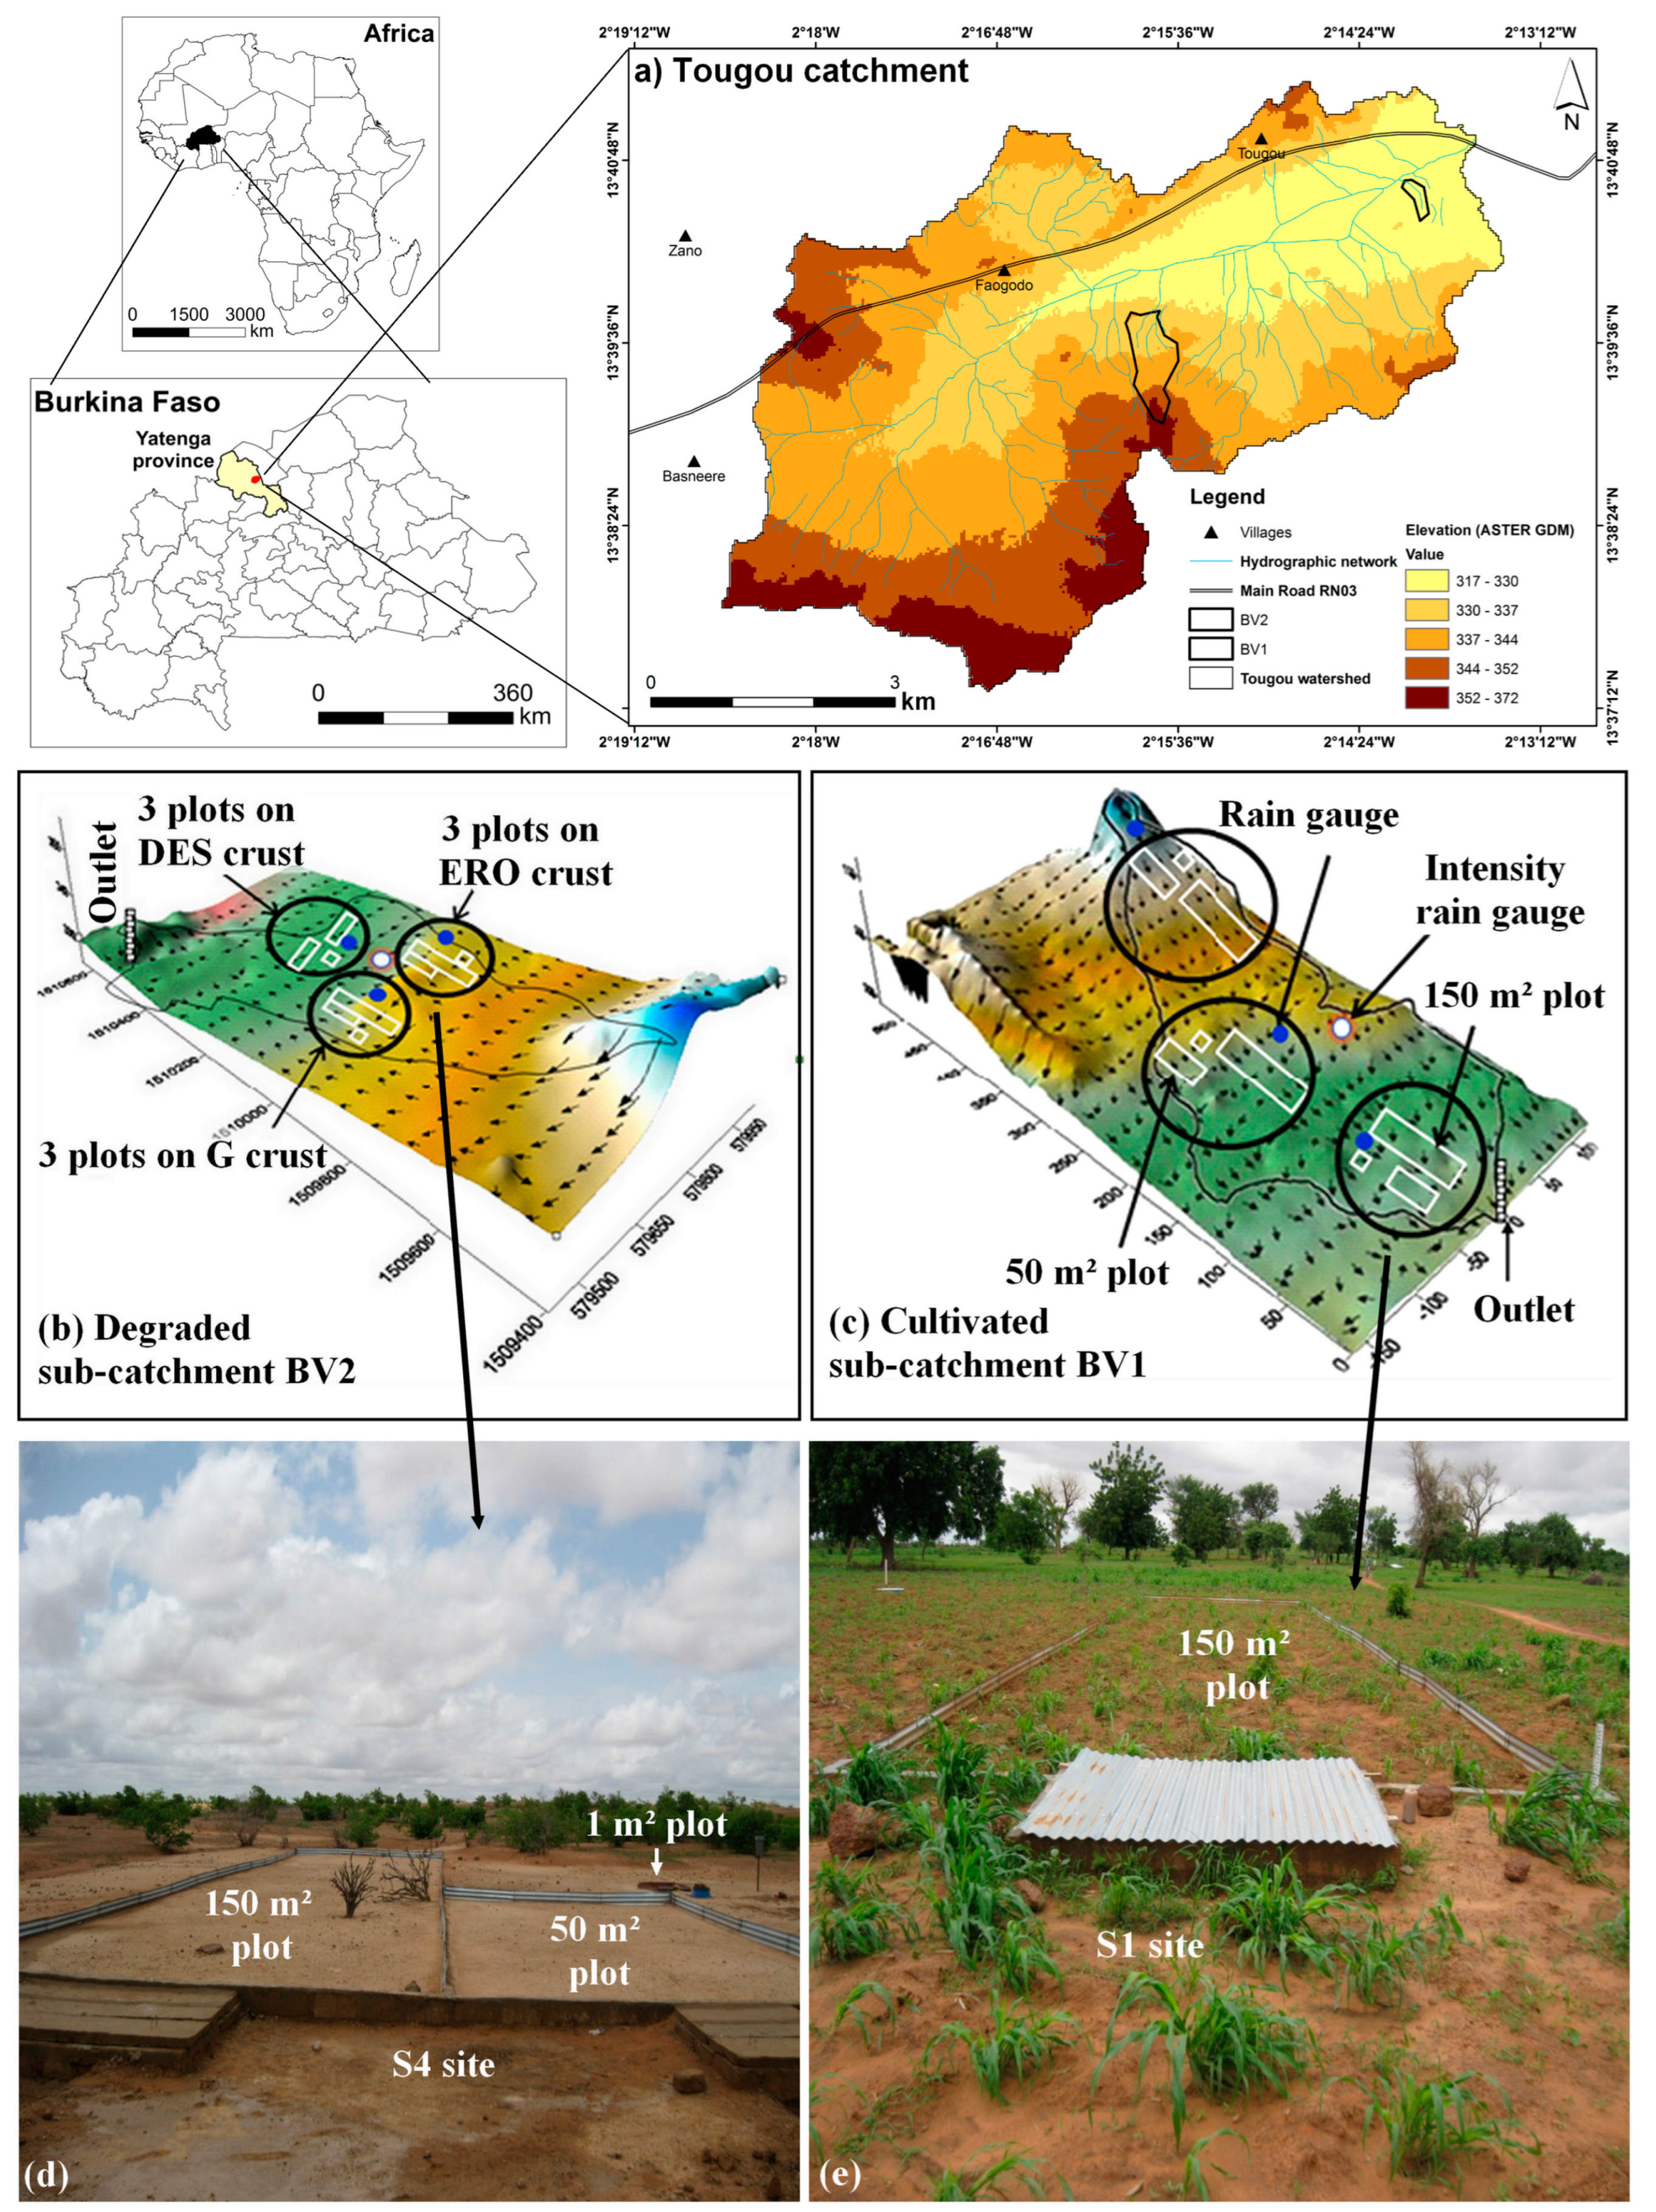
2.1. Study Area Description

The present study is carried out in the Tougou watershed (37 km2), located in northern Burkina Faso, 22 km northeast of Ouahigouya, the chief town of the Yatenga Province where the watershed lies (Figure 1). The landscape is part of the Sahelian zone and inherits the typical traits of its climate, which is dry and semi-arid. The daily average temperature ranges between 18 and 40 °C, with relative air humidity on average between 16% (in February during the dry season) and 77% (in August during the wet season) [26,59]. The rainfall is typically monomodal, with a dry season from November to May and a rainy season from June to October, during which 610 mm cumulative rainfall was observed in the watershed on average over the period 2004–2020 [59]. The months of July, August and September are the wettest and account for over 80% of annual rainfall on average in the Tougou watershed [59,60]. The rainfall intensities are high (due to the highly convective nature of rainfall) and can reach 90 mm.h−1 in 30 min and up to 130 mm.h−1 in 5 min [27].
The watershed hydrographic drainage network is dendritic and mainly depicted by intermittent watercourses, which collect surface runoff to the main river course in the watershed [27].
In the Tougou watershed, the altitudes range from 320 to 367 masl. The slopes are mostly gentle to flat, with values between 0.5 and 5%. The watershed is composed of three main different types of soils: (i) slightly evolved soils, which make up 25% of the watershed area and are mostly sandy to sandy-gravel; (ii) raw mineral soils, covering 35% of the watershed area; and (iii) hydromorphic soils, representing 40% of the watershed area and which are commonly located in alluvial terraces [11,20,26]. The vegetation in the watershed is sparse and composed of savannah bushes. Cultivated soils, bare and degraded soils, and natural vegetation are the three main land use categories in the watershed, representing 64%, 33% and 3% of the watershed area, respectively [11]. As in most Sahelian hydrosystems, surface runoff quickly onsets through Hortonian flow, while the limited infiltration and groundwater recharge supply only occurs through pathways at the bottom of small streambeds [61,62].

2.2. Experimental Design

The monitoring of surface runoff and soil loss rates in the Tougou watershed is carried out over the period 2010–2018 at the plot scale, sub-watershed scale and watershed scale. The outlets of the sub-watersheds are named BV1 (cultivated sub-watershed, 6.1 ha) and BV2 (bare and degraded sub-watershed, 33.8 ha). The outlet of the Tougou watershed (37 km2) is named BV0. A total of eighteen (18) plots, equally shared within 2 sub-watersheds (9 plots in BV1 and 9 plots in BV2) are set up in this regard. The 2 sub-watersheds are considered to be homogeneous when referring to the land use/land cover composition and soil surface conditions. The complete details regarding the physical setting of all the plots are presented in Table 1.
In each sub-watershed, the plots are grouped by sets of three (03), forming measurement sites. Sites S1 to S3 are located in BV1 (cultivated) and sites S4 to S6 are in BV2 (bare and degraded). The soil surface conditions in S1, S2 and S3 sites represent, respectively, 40, 25 and 35% of the area of BV1, while the soil surface conditions on S4, S5 and S6 sites, respectively, represent 35, 65, and 1% of the area of BV2. Each site consists of a set of three plots of increasing size (1 m2, 50 m2 and 150 m2). The downstream part of the 50 and 150 m² plots is equipped with a surface runoff collection tank and a sediment load trapping pond. It should be noted that, at site S6, there was no plot of 150 m2 installed, but rather two plots of 50 m². The reason behind this design is related to the fact that the soil surface conditions appearing at site S6 (mostly desiccation crust, DES) are seldom in the BV2 sub-watershed (<1% of the area in BV2) and therefore no patch of 150 m2 for such crust type could be found in the area.
The soil surface conditions presented in the present study refer to the different types of crusts, as defined in [63], which are developing at the soil surface: the erosion crust (ERO), desiccation crust (DES), agricultural crust (C) and gravel pavement crust (G). The term “crust” refers to a stratified thin layer forming the topsoil layer. One or two micro-horizons make up type C crusts, which typically occur on clayey or sandy soils. ERO crusts consist of a single, extremely thin clay-like micro-horizon, which cracks as it becomes dry. The DES type crust is sandy, made up of a fragile micro-horizon, while the G crust is composed of a micro-horizon with coarse sediments of about >2 mm median grain size diameter.
Nine (09) plots were installed in the cultivated sub-watershed BV1 (6 ha) (Figure 1c,e), while the remaining nine plots were set up in the second sub-watershed BV2 with bare and degraded soils (33.8 ha), (Figure 1b,d). Because of the variability of crust types found within BV2, the nine plots in BV2 have been equally shared between these crust types: three plots on ERO crusts, three plots on G crusts and three plots on DES crusts, as shown in Table 1.
The soil surface conditions were physically investigated as follows: nine soil samples were obtained from each site and subjected to texture analysis using the sieving and settling methodology (according to NF ISO 11277 [64]). The double-ring infiltrometer is used to estimate the saturated hydraulic conductivity Ksat [65]. Undisturbed soil samples were used to measure the bulk density ρB following a 24 h drying period at 105 °C [66]. Equation (1) was used to further estimate the soil porosity [66]:
p = 1 − ρSB
where p is the soil porosity [-], ρB is bulk density [g.cm−3], ρS is the particle density (=2.65 [g.cm−3]) [20,66]. The Manning’s roughness (n) values for overland surface runoff on plots are estimated through an empirical function of the median grain size diameter d50 of the soil sample at each site, given by Equation (2) [67]:
n = 21.1(d50)−1/6
where n [m.s−1/3] is the Manning roughness coefficient and d50 m is the median grain size diameter.

2.3. Monitoring and Data Collection

Over the period 2010–2018, the rainfall is monitored on an event basis using an array of rain gauges distributed within the watershed. In both sub-watersheds BV1 and BV2, each site is equipped with a rain gauge. The average rainfall for each sub-watershed is further estimated from the rain gauge measurements at the three sites located within that sub-watershed. Moreover, three other rain gauges spread within the watershed of Tougou are used to estimate the average rainfall for the whole watershed, calculated through Thiessen’s polygon averaging method [68].
A Thalimedes water level recorder has been installed at the outlet of each sub-watershed, and also at the watershed outlet to monitor surface runoff. The daily soil loss is estimated using water samples manually collected at variable time intervals (10 to 30 min, depending on the rising and recession time of the hydrograph).
At the plot level, the surface runoff for each rainfall event is estimated from the collection tank downstream of the plot. Likewise, for each plot, sub-watershed and watershed, the annual total soil loss is determined as a sum of the dry masses of the bedload and suspended soil losses exported from the plot for all the rainfall events in a year. These dry masses are determined from sediment concentration measured in bottled water samples coupled to surface runoff volumes monitored through the collection ponds (for the plots), or the continuous discharge measurements from the Thalimedes at the outlets of sub-watersheds (BV1 and BV2) and the Tougou watershed (BV0). The total soil loss values are further converted per unit hectare through Equation (3):
SL = λ(SL′)
λ = 10,000 [m2.ha−1]/(1000 [kg.t−1]*Observation scale [m2])
where SL′ is the annual total soil loss [in kg] measured at a given spatial scale (plot, sub-watershed or watershed), SL is the corresponding soil loss [in t.ha−1], and λ is a conversion factor.

2.4. Statistical Analysis of the Effect of Scale and Plot Location on Soil Loss Rates

In the present study, the observation scale and the plot location are considered to be the major sources of variation in soil losses. The plot location embodies various effects, including the soil surface conditions as denoted by crust types found within the plot, the associated soil surface hydrodynamic properties and variation in plot slopes. The non-parametric Kruskal–Wallis test at α = 5% significance level is used to assess such effects. The following questions are therefore investigated:
  • Given a specific location, are there significant differences in soil loss measurements and associated processes at different observation scales?
  • Given a specific observation scale, are there significant differences in soil loss measurements and associated processes at different locations?
For both questions, the null hypothesis (H0) is defined as the “equality of median rank of soil losses for different groups”. The Mann–Whitney U test (at α = 5% significance level) is further used to assess significant differences between pairs as a post hoc test. For each analysis, the statistical power of the test (1-β) is also evaluated in order to assess the effect size and further quantify the confidence level in the decision made from the statistical test result, especially when the outcome of the test is not significant (p-value > α).

3. Results

3.1. Physical Description of Soil Types in the Experimental Setup

The physical description of the soil types and properties of all the plots installed on sites S1 to S6 is presented in Table 2.
The Ksat values measured on the monitoring plots in Table 2 are similar to previous observations reported by [14,23,24,63] for Sahelian soil crusts. The variability of Ksat values across the different crust types is thought to be affected by the soil slope and microrelief (surface roughness and surface storage capacity).
In bare and degraded soils, due to surface sealing and crusting, infiltration is limited, as shown by the lower values of Ksat on these soil surface conditions. Moreover, without any consideration given to the soil types, bare and degraded soils are almost similar in terms of infiltration, as suggested by the low variability in Ksat values on S4, S5 and S6 sites. Additionally, from the bulk density measurements and the porosity values, it appears that the soil compaction is higher in bare and degraded areas than in cultivated areas.
In cultivated areas, ploughing is the primary tillage operation, followed by sowing, hoe weeding or weeding carried out with animal traction [26,69]. These practices aim at breaking down the topsoil crusts to promote infiltration and further reduce surface runoff and limit soil erosion [70,71,72].

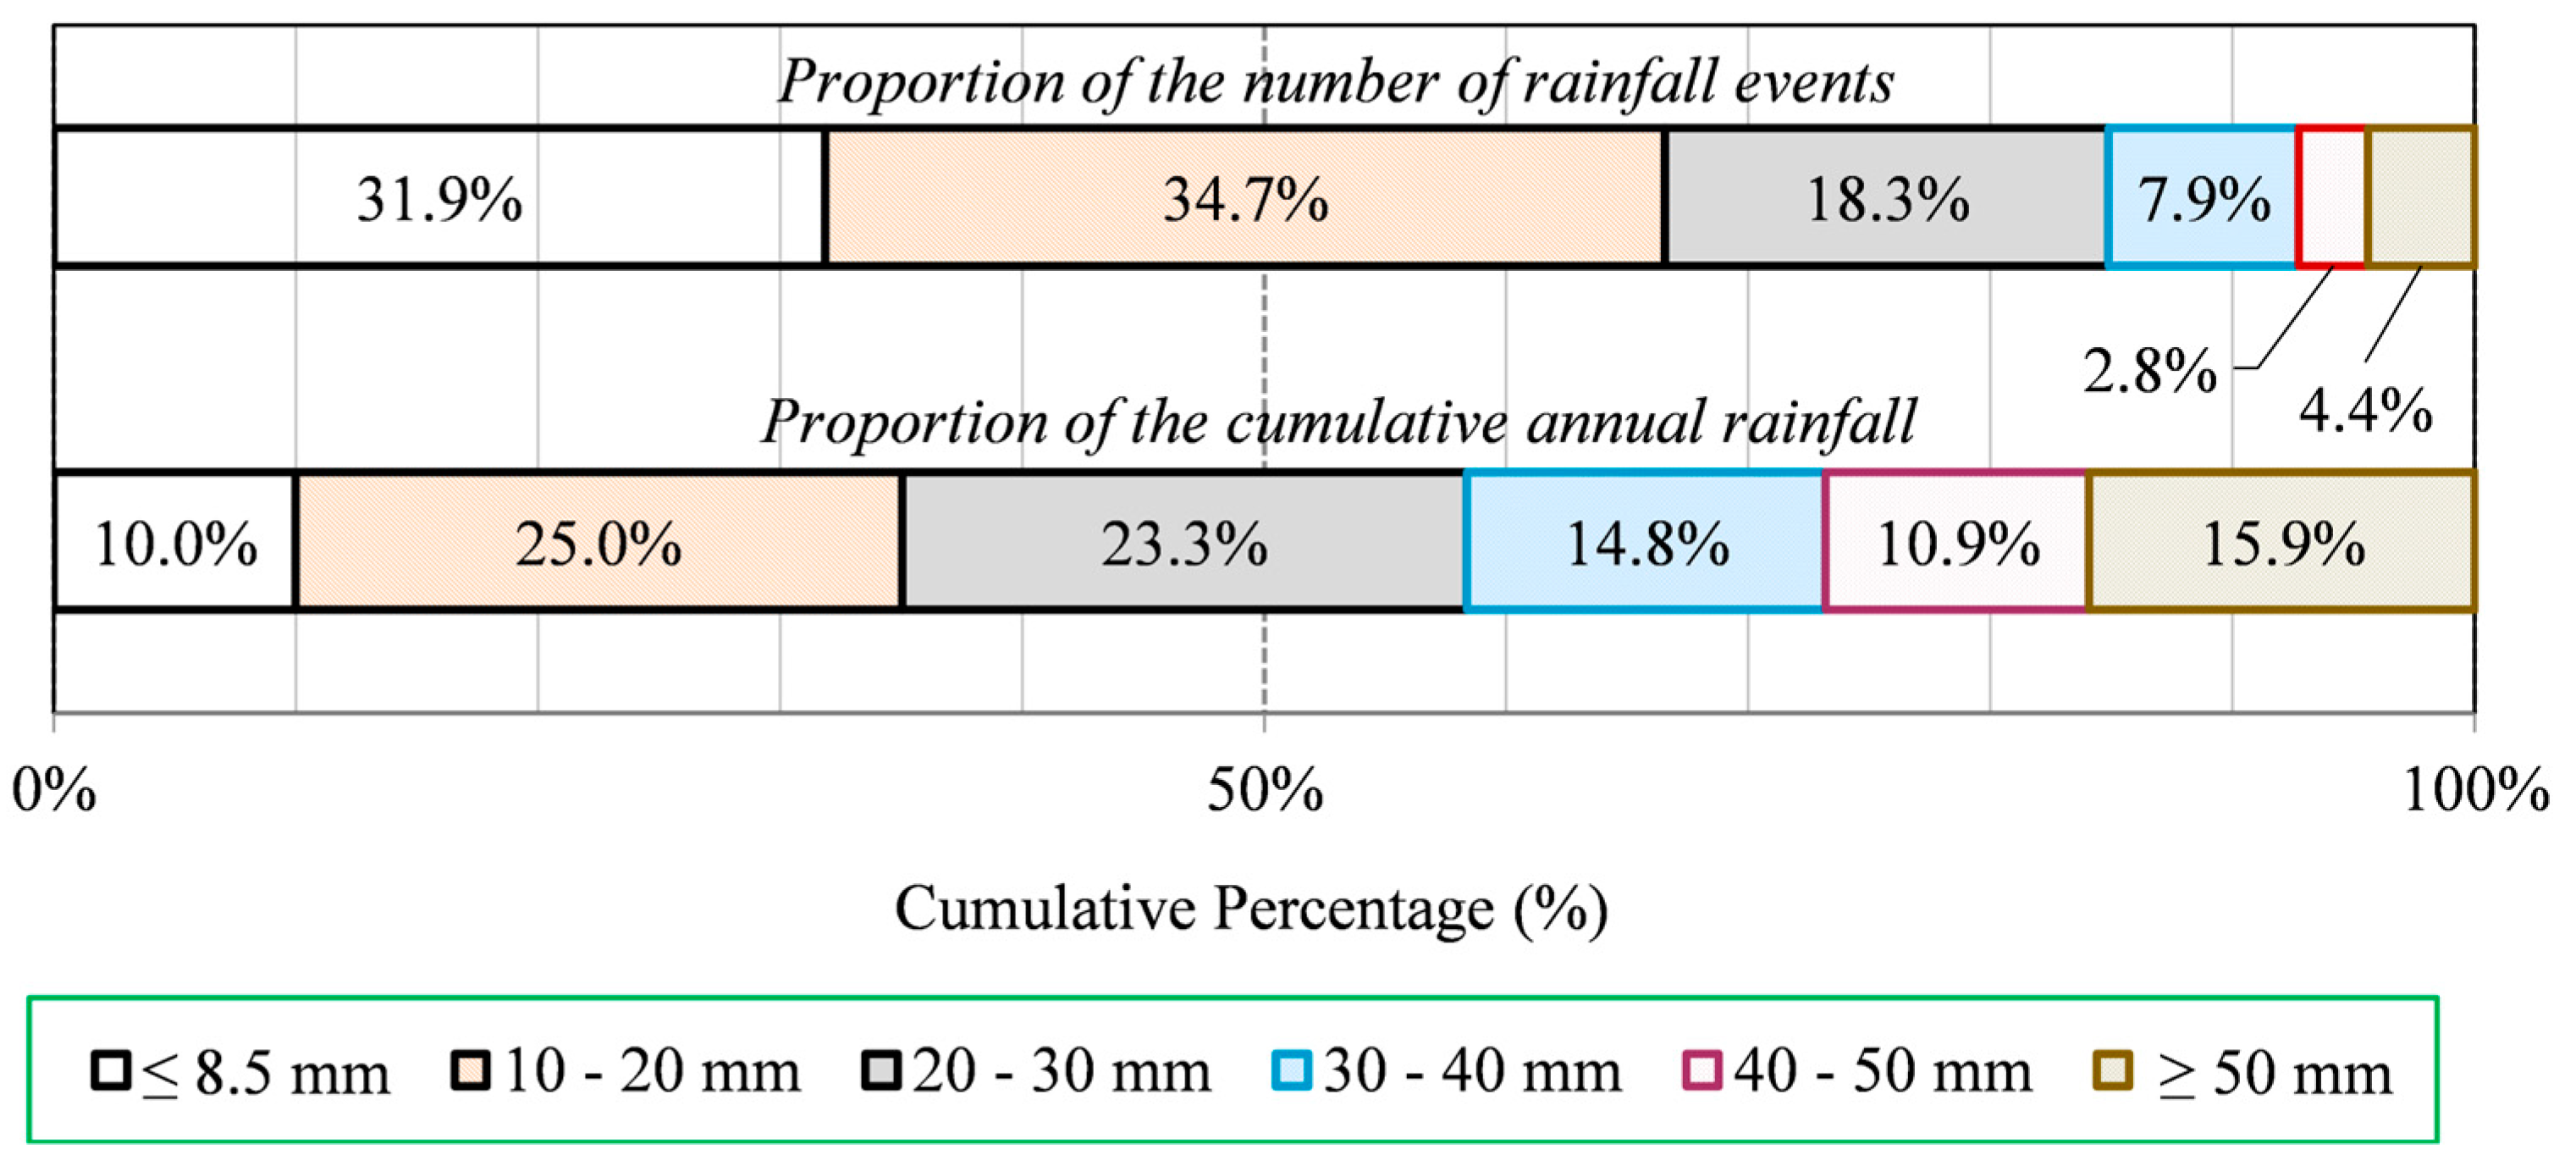
3.2. Analysis of Rainfall over the Period 2010–2018

Table 3 summarizes the rainfall characteristics in the Tougou watershed over the period 2010–2018. The annual rainfall varies between 460 and 730 mm, with nearly 35% of the daily events occurring between 10 and 20 mm and 15.1% of these events exceeding 30 mm, representing 42% of the cumulative annual rainfall on average. The average rainfall intensity in 30 min varies between 35 and 70 mm.h−1. Considering the annual average rainfall over the period 2010–2018 at the nearest synoptic station, which is Ouahigouya, located 25 km from the Tougou watershed, the years 2010, 2012, 2014, 2015 and 2018 can be considered as “wet years” (annual rainfall in Tougou watershed above the annual average at Ouahigouya station), while the years 2011, 2013, 2016 and 2017 are referred to as “dry years” (annual rainfall in Tougou watershed less than the annual average at Ouahigouya station). It can be further noted that, for the wet years, the cumulative rainfall for rainfall events above 30 mm reaches 50% of the annual rainfall. These events occur generally in June and August with high intensity and often high erodibility, as they can produce up to 75% of the annual sediment yield of the watershed [20].
Figure 2 shows the distribution of rainfall events. It shows that, for instance, 31.9% of the rainfall events are below 8.5 mm and produce 10% of the yearly rainfall volume. Additionally, 7.2% of the events are above 40 mm and account for 26.8% of the yearly rainfall volume. The rainfall events above 30 mm, considered as erosive events, occur 15.1% of the time and account for 41.6% of the yearly rainfall volume.

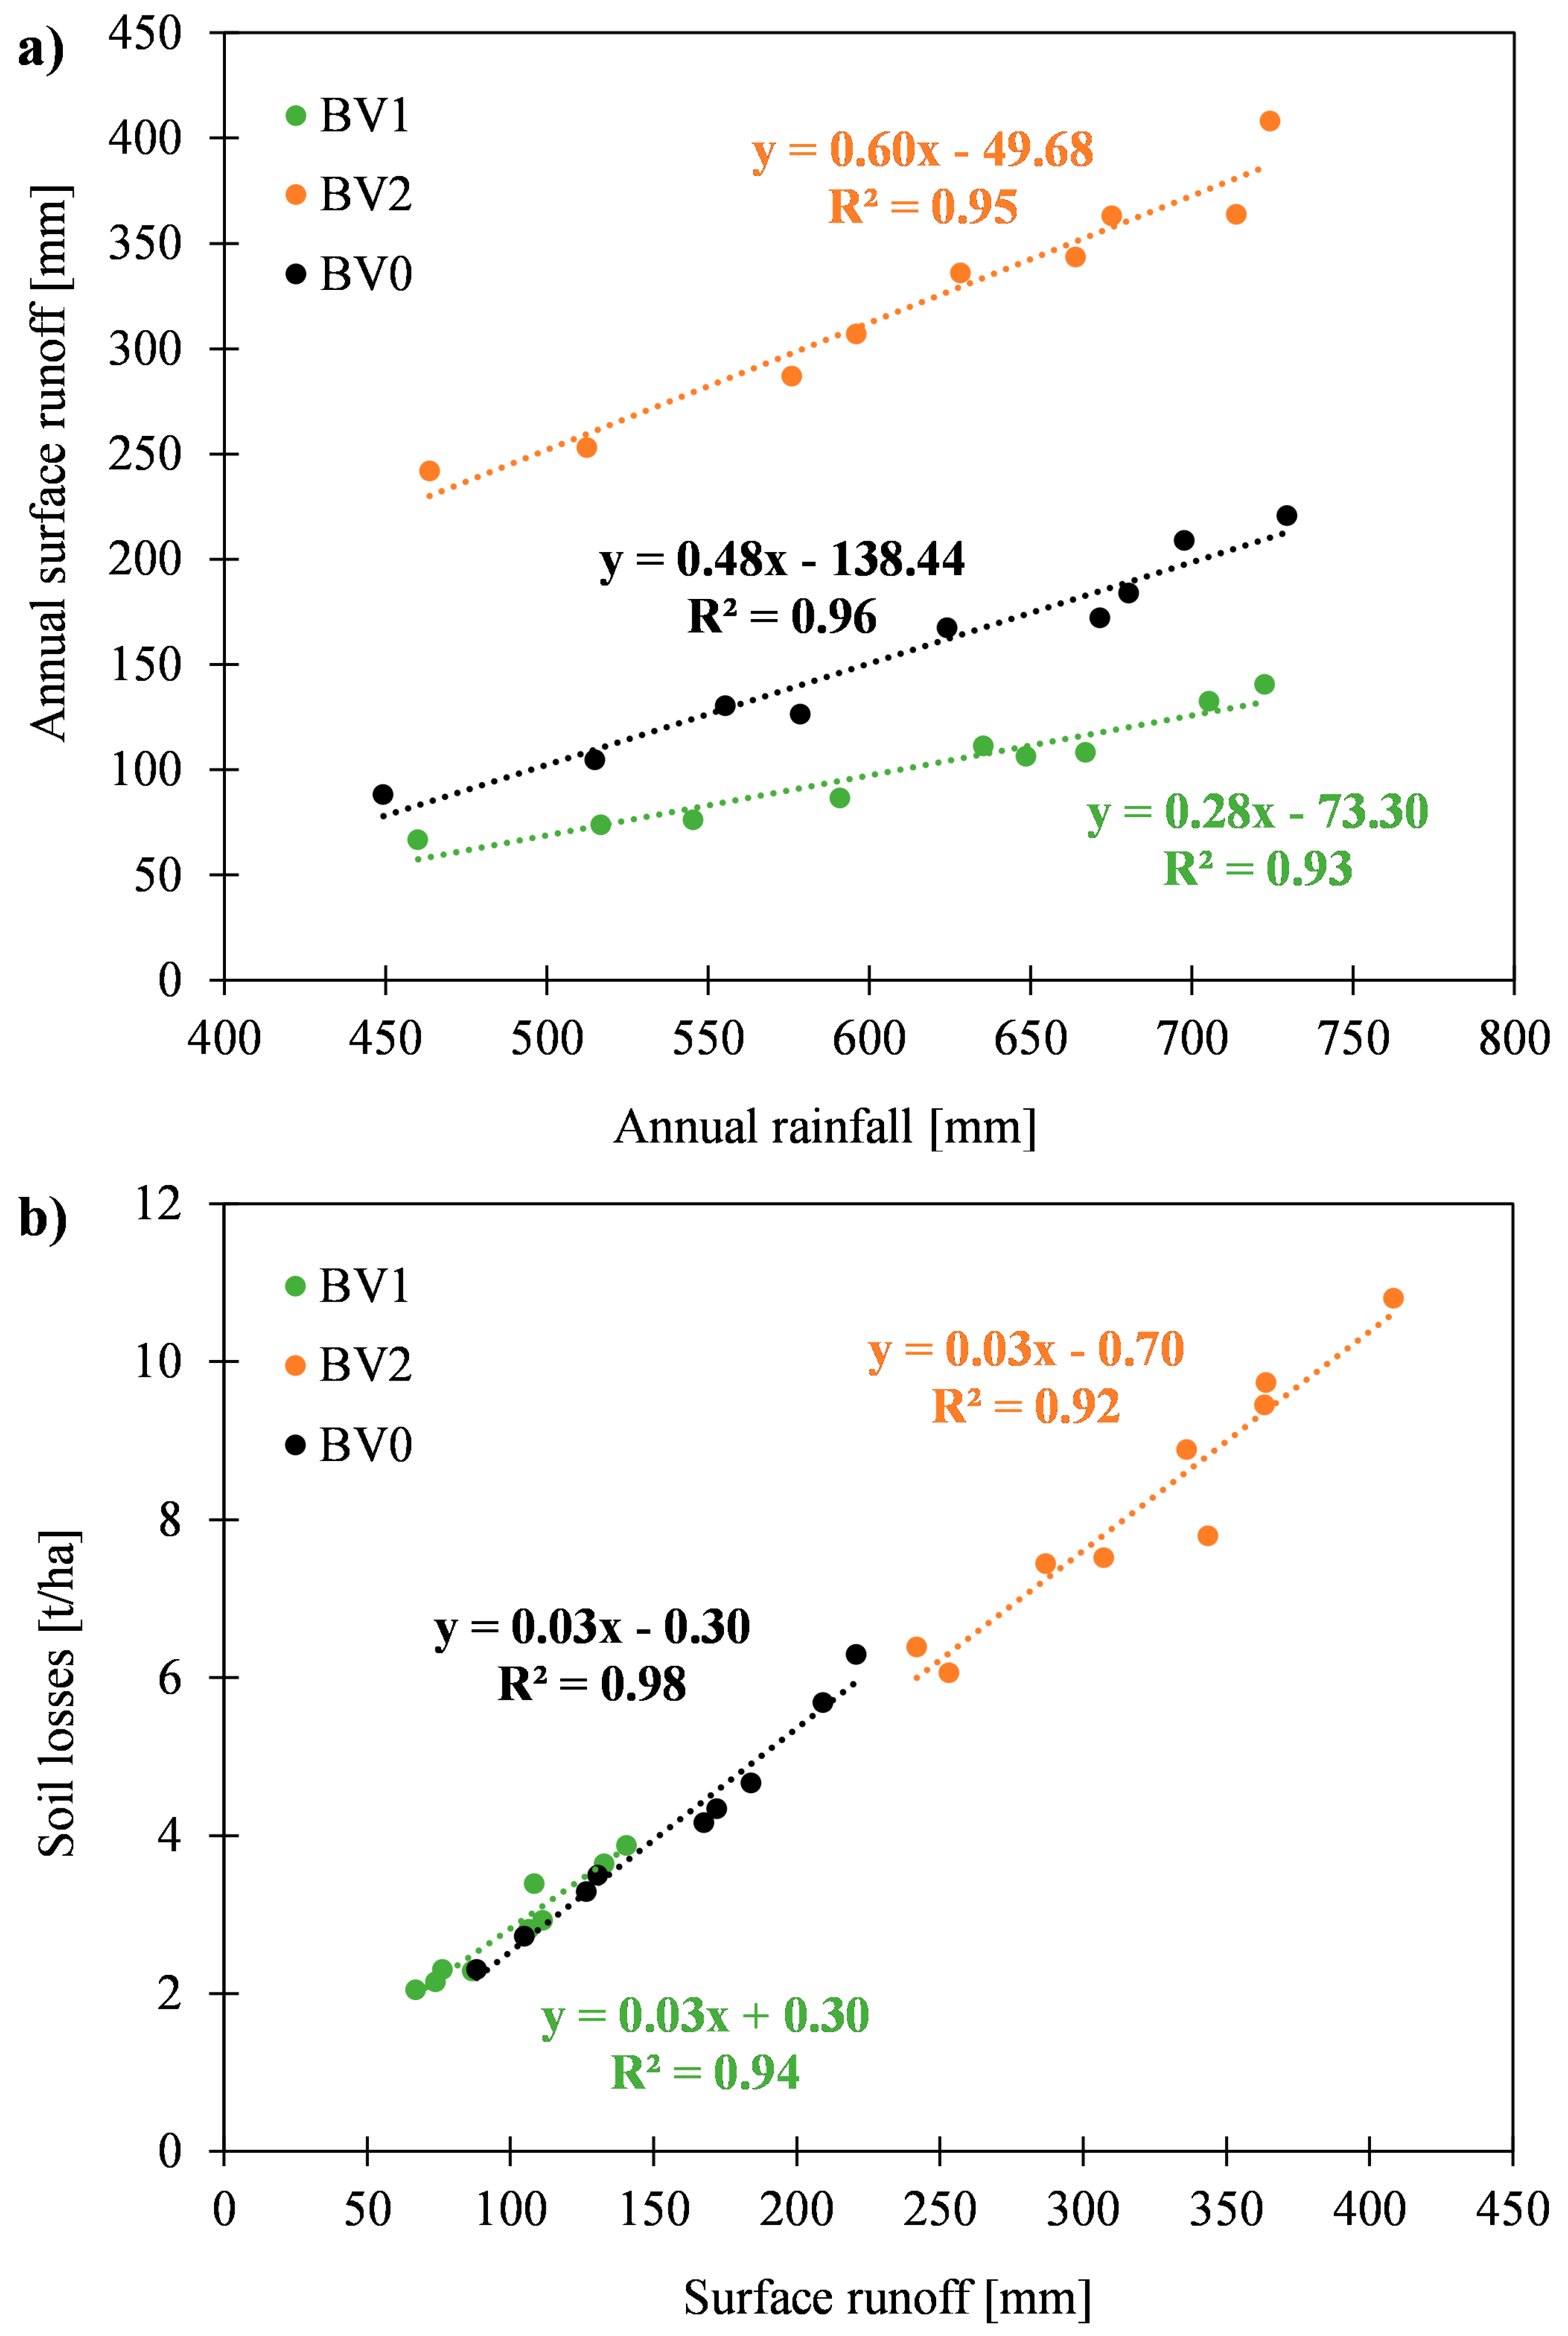
3.3. Relationship between Annual Rainfall, Surface Runoff and Soil Loss Rates in the Tougou Watershed

Figure 3 shows the relationship between annual rainfall, surface runoff and soil loss rates at the scale of the cultivated sub-watershed (BV1), the bare and degraded sub-watershed (BV2) and the Tougou watershed (BV0), as monitored over the period 2010–2018. It appears that annual surface runoff, as shown in Figure 3a, is highly linear to annual rainfall (R2 = 0.93–0.96). Additionally, cultivated areas produce less surface runoff (runoff coefficient = 13.97–19.43%), while bare and degraded soils produce higher surface runoff values in comparison (runoff coefficient = 49.38–56.36%), similarly to [73]. The watershed (BV0) shows intermediate values, with annual surface runoff slightly higher than in cultivated areas (runoff coefficient = 19.62–30.23%). Soil loss rates also have a significant linear relationship with surface runoff, as shown in Figure 3b (R2 = 0.92–0.98), with cultivated areas producing lower annual soil loss rates (2.05–3.88 t.ha−1), while bare and degraded areas produce the largest soil loss rates in comparison (between 6.07 and 10.80 t.ha−1). Likewise, the annual sediment yield at the watershed scale (BV0) is slightly larger than that of cultivated areas (between 2.31 and 6.30 t.ha−1).

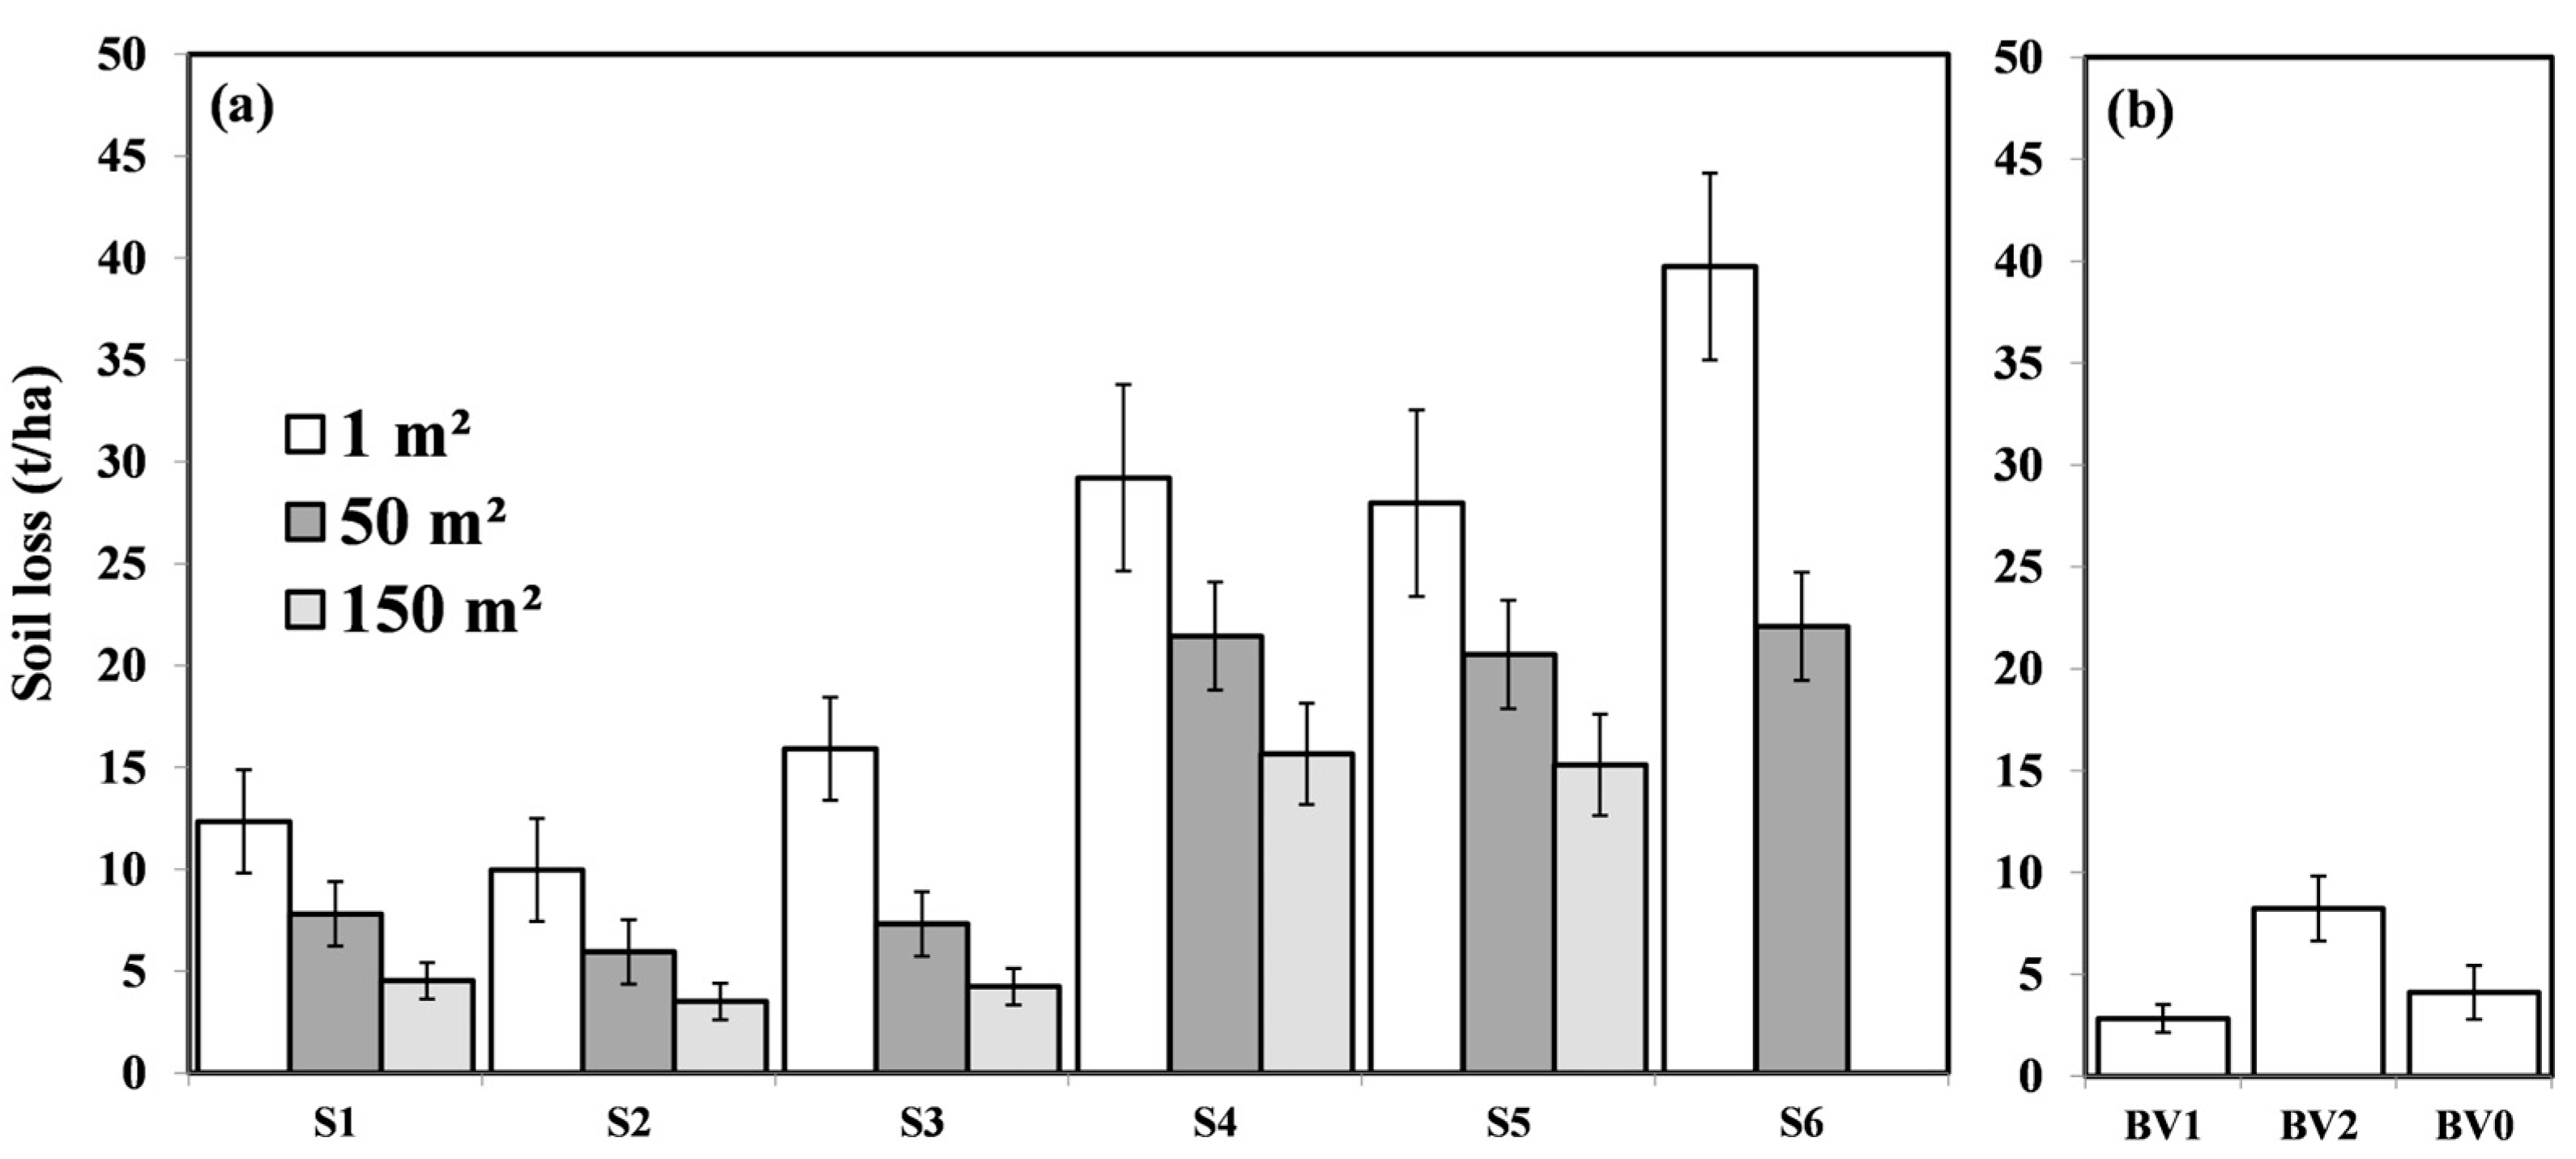
3.4. Effect of Observation Scale and Soil Surface Condition on Soil Loss Rates

The soil loss measurements carried out at different observation scales on all sites are compared in Figure 4.
The analysis of Figure 4a shows that soil losses are in general 2–3 times higher on bare and degraded soils, in comparison to cultivated soils, at all spatial scales. Such findings are similar to those of [43,53,74,75,76]. However, considering the similar soil surface condition, it also clearly appears that soil loss decreases when the spatial scale of observation increases. The latter trend seems to support the idea that soil erosion processes are affected by various factors, some of which are particularly sensitive to scale [19,46,77,78,79].
The average coefficient of variation on cultivated soils (21.3%) is higher than that observed on bare and degraded soils (14.2%). The variability in soil loss erosion on cultivated soils is likely due to the differences in soil types, cultivation practices and hydrodynamic properties (see Table 2). At the plot scale, various factors such as the soil texture, micro-relief and cultivation practices strongly influence the elementary soil erosion processes [63]. On bare and degraded soils, ERO and G-type crusts have similar behaviour. The reported values vary between 12 t.ha−1 and 34 t.ha−1, with the highest erosion values reported on DES crusts with values up to 45 t.ha−1 at the unit scale.
At the sub-watershed scale (Figure 4b), the average soil loss is, respectively, 2.83 and 8.24 t.ha−1 on BV1 and BV2, with the average coefficient of variation estimated at 24.1% and 19.3%, respectively. These values also illustrate that the variability in soil losses is still higher in the context of cultivated soils. In comparison with the soil loss values measured on plots of 150 m2, a relative reduction of 33% and 47% at the sub-watershed scale is observed (for BV1 and BV2, respectively), suggesting that sediment deposition is higher in bare and degraded areas than in cultivated areas. This finding is likely due to the fact that crusts patches are found in decreasing occurrence from upstream to downstream in each sub-watershed, with the decrease being more significant in BV2 than in BV1. In addition, the size of the cultivated sub-watershed BV1 (which is 5.5 times smaller than the bare and degraded sub-watershed BV2) seems to explain the difference in sediment deposition amount between the two scale units.
At the Tougou watershed scale, the interannual average of soil loss is 4.11 t.ha−1 with an average coefficient of variation of 32%, which appears to be intermediate between the values reported for the cultivated and bare/degraded sub-watersheds. Additionally, the fact that the average soil loss for the entire watershed of Tougou is closer to that of the cultivated (BV1) sub-watershed is likely due to the dominant proportion of cultivated areas (64% of the watershed area), which is almost twice the proportion covered by bare and degraded areas (33% of the watershed area). The specific erosion rates reported in the present study are compared to the outside literature in other African watersheds, as follows: 0.1 t.ha−1 in Amitioro (south Ivory Coast) [80], 0.37 t.ha−1, 0.70 t.ha−1 and 0.15 t.ha−1, respectively, in Dounfing, Djitiko and Belekoni (south Mali) [81,82], 2.21 t.ha−1, 2.10 t.ha−1 and 5.25 t.ha−1, respectively, in Mayo Boula [83], Mayo Tsanaga [84] and Mouda (north Cameroon) [85] and 4.70 t.ha−1 in Oued Haddad (Algeria) [86].

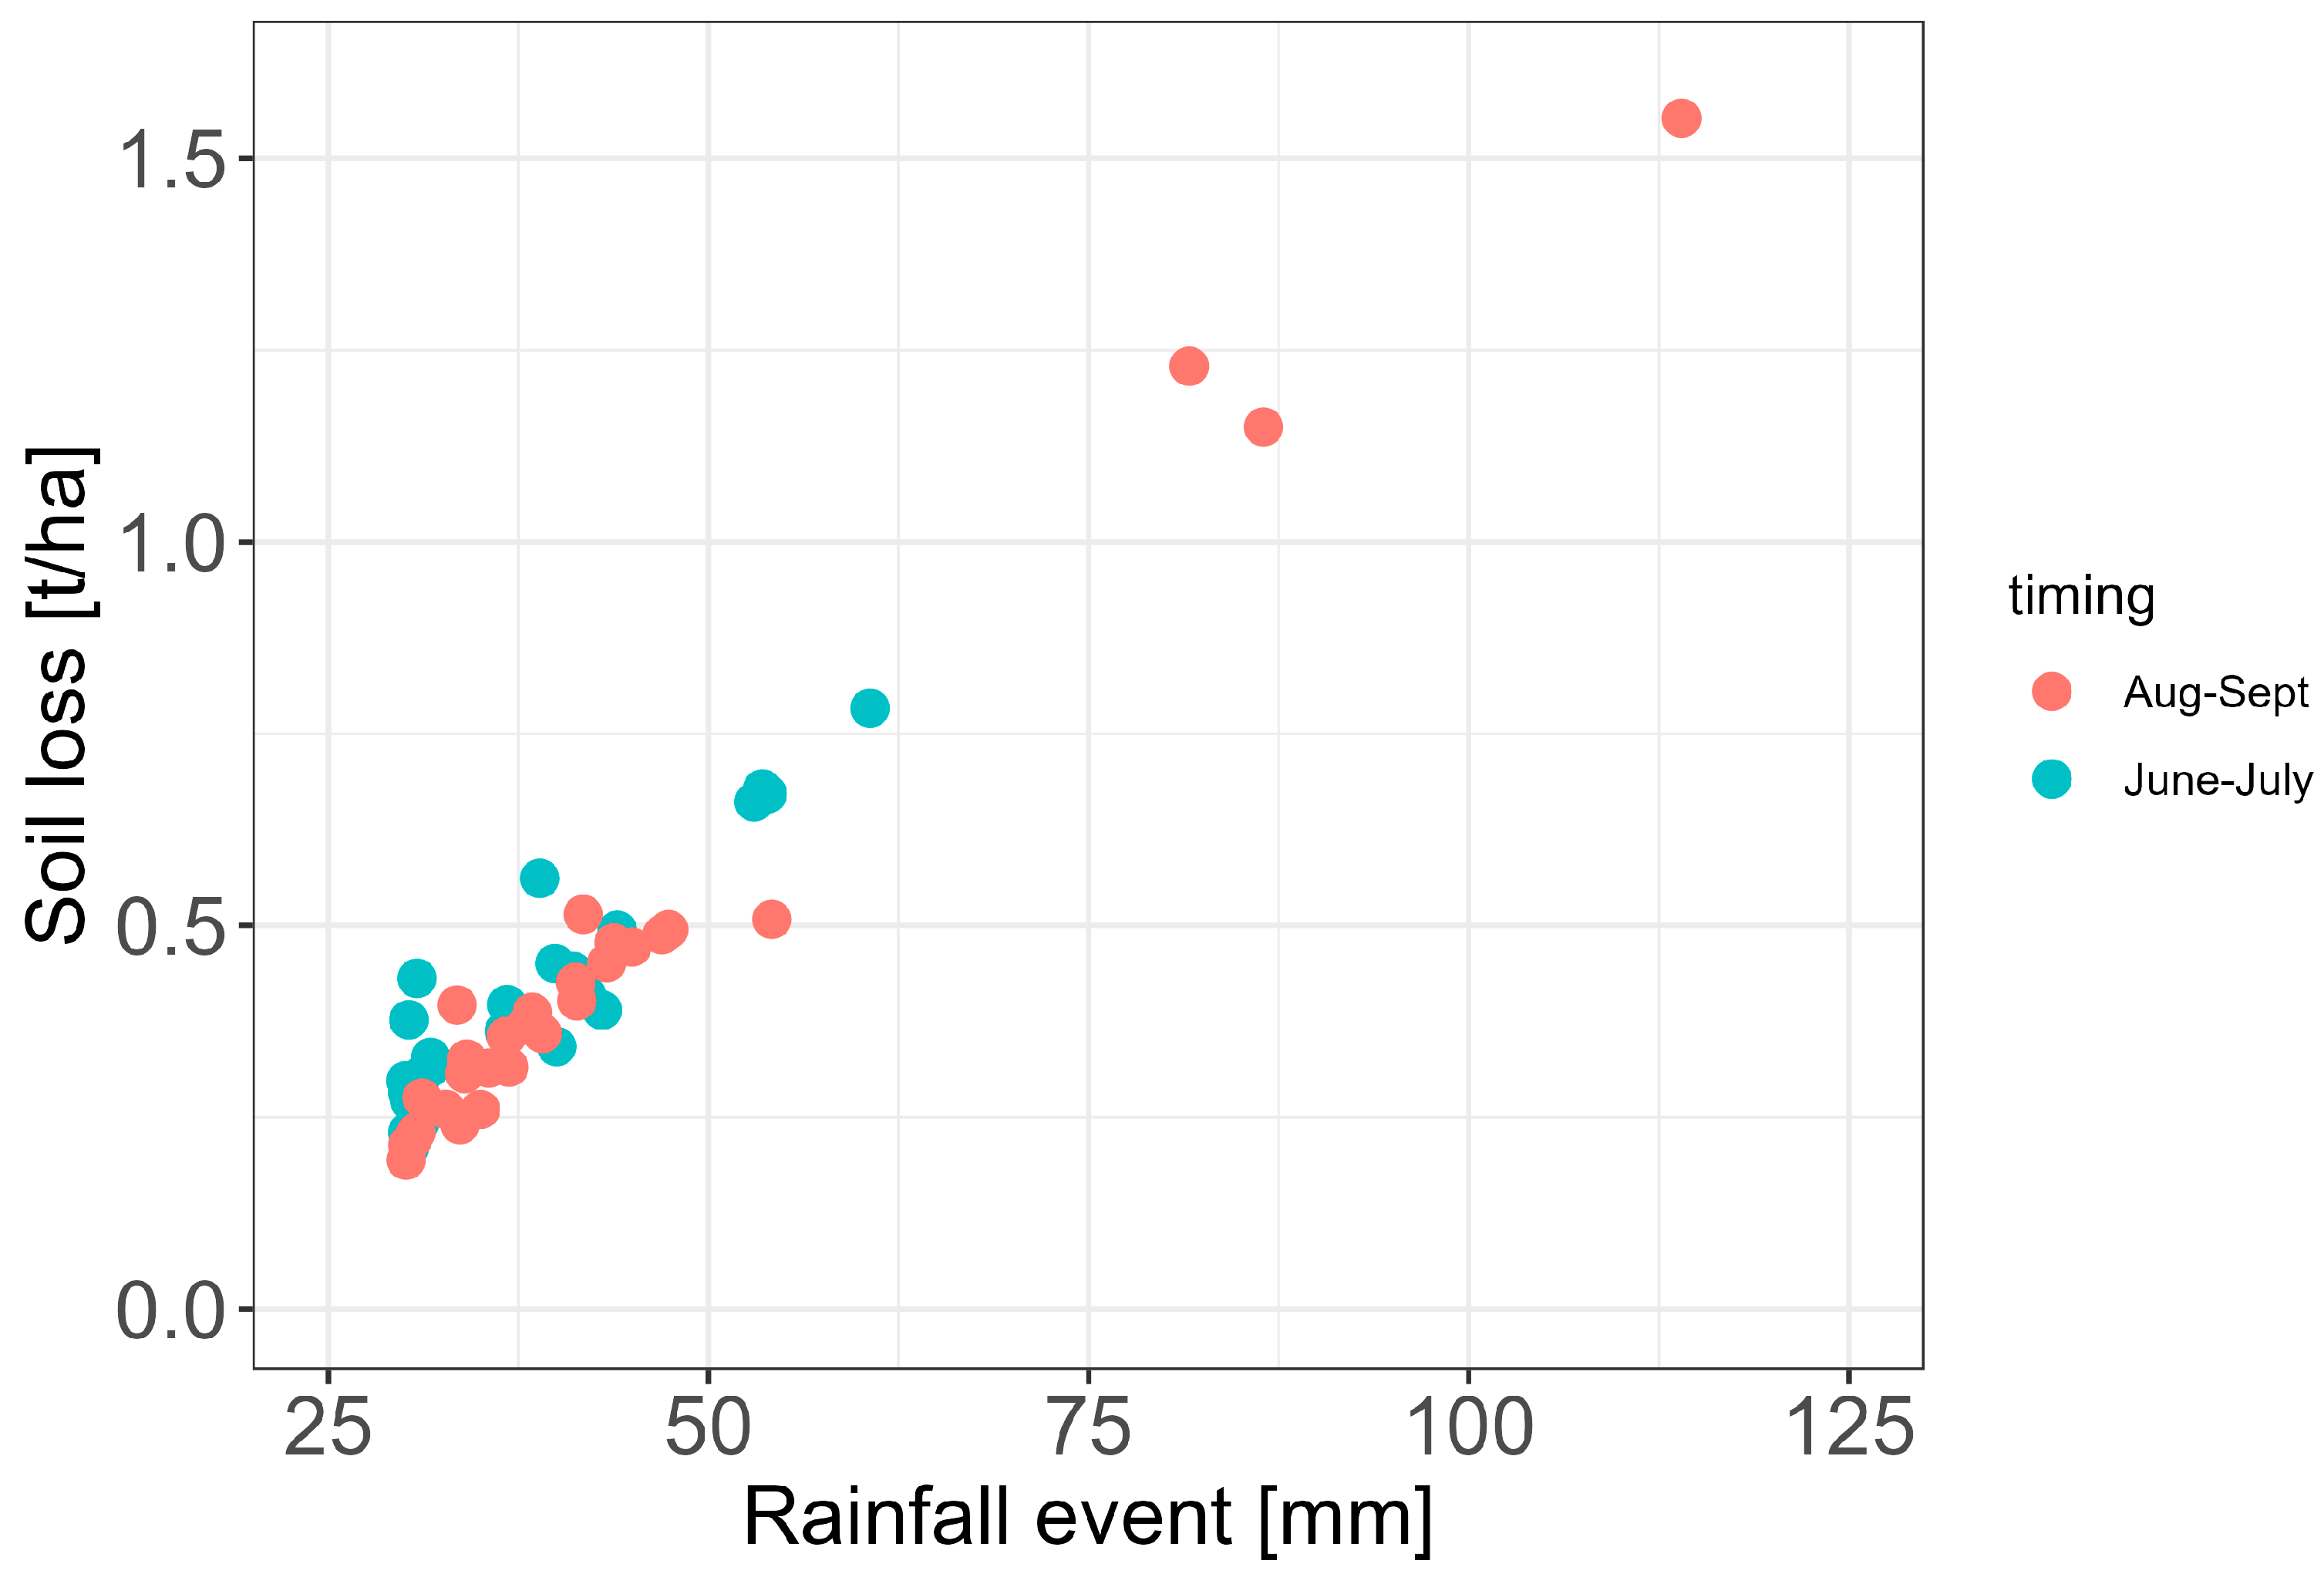
3.5. Effect of the Timing of Rainfall Events on Soil Loss Rates in Tougou Watershed

In this section, the focus is carried out on the high soil loss values monitored at the sub-watersheds and the watershed scale for specific dry years over the study period 2010–2018. The analysis reveals that some extreme rainfall events generated significant soil loss rates. On average, rainfall events above 30 mm account for 41.6% of the annual rainfall over the period 2010–2018 and are responsible for 65% of the annual soil loss exported from the Tougou watershed. In Figure 5, the soil loss rates generated from rainfall events are presented, according to the timing of the occurrence of the rainfall event. It can be seen that, for a given rainfall amount, the amount of soil loss from rainfall events occurring at the onset of the rainy season (June–July) is slightly higher on average than that occurring from rainfall events occurring in the middle-end of the rainy season (August–September). This could be further largely explained by the availability of sediment material, which is higher at the onset of the rainy season, and decreases towards the middle-end of the season [60].

3.6. Statistical Analysis of the Effect of the Observation Scale and the Plot Location on Soil Loss Rates

3.6.1. Effect of Observation Scale on Soil Loss Rates

Table 4 shows the results of the statistical analysis of the effect of the observation scale on soil loss in the Tougou watershed. The null hypothesis (H0), which states that soil loss rates distributions from plots of different sizes (within the same land use type) come from the same population, is rejected on all six observation sites. This means that on each site (S1 through S6), at least one of the group distributions of soil loss rates is significantly different from the others being compared. Furthermore, the power (1-β) of the Kruskal–Wallis test is satisfactory for all sites as the value of 80% (deemed to be suitable) is reached.
Considering the analysis of the different pairs, it appears that all three distributions are significantly different at all sites with high power values (1-β > 94%). This means that the erosive processes at the unit scale are significantly different from those observed on the 50 and 150 m2 plots, which are themselves different. In other words, it reveals that soil loss rates measured at a given scale are not necessarily representative of those obtained at other scales. At the unit scale, soil erosion is mostly due to the splash effect and/or the supply of aeolian material, given the short runoff length. At this scale, only diffuse erosion is measured since the surface runoff depth is shallow, with a low flow velocity. On the other hand, on the 50 and 150 m2 plots, the soil loss measured is essentially sheet erosion as the surface runoff accumulates along the plot length. Therefore, the difference in plot length increases the complexity of the process, as surface runoff energy is sometimes washed over the soil surface roughness (due to heterogeneities such as clods, stems, mulch, pebbles, etc.). Such findings highlight the complexity of soil erosion processes even at the plot scale, but also highlight that the average soil loss values depend on the size of the observation scale [34,51].

3.6.2. Effect of Plot Location on Soil Loss Rates

Table 5 shows the results of the statistical tests of the effect of the plot location on observed soil loss rates. At the unit scale, the null hypothesis (H0) is rejected with high power test values (1-β > 93%). At the 50 and 150 m2 plot scale, the null hypothesis (H0) cannot be rejected. However, the values of the test power appear to be below 80%, commonly deemed as the minimum threshold required for a type II error (not rejecting H0 when it is false). There are 51% and 90% odds (on cultivated and on bare and degraded soils, respectively) of wrongly accepting the null hypothesis (H0) when it is false.
From these results, it can therefore be suggested that the location of the plot appears to be affecting the soil loss observations. Considering the field scale experiment used in the present study, the plot location embodies various effects including variations in the plot average longitudinal slope and also in soil surface hydrodynamic properties, as also reported by [34].

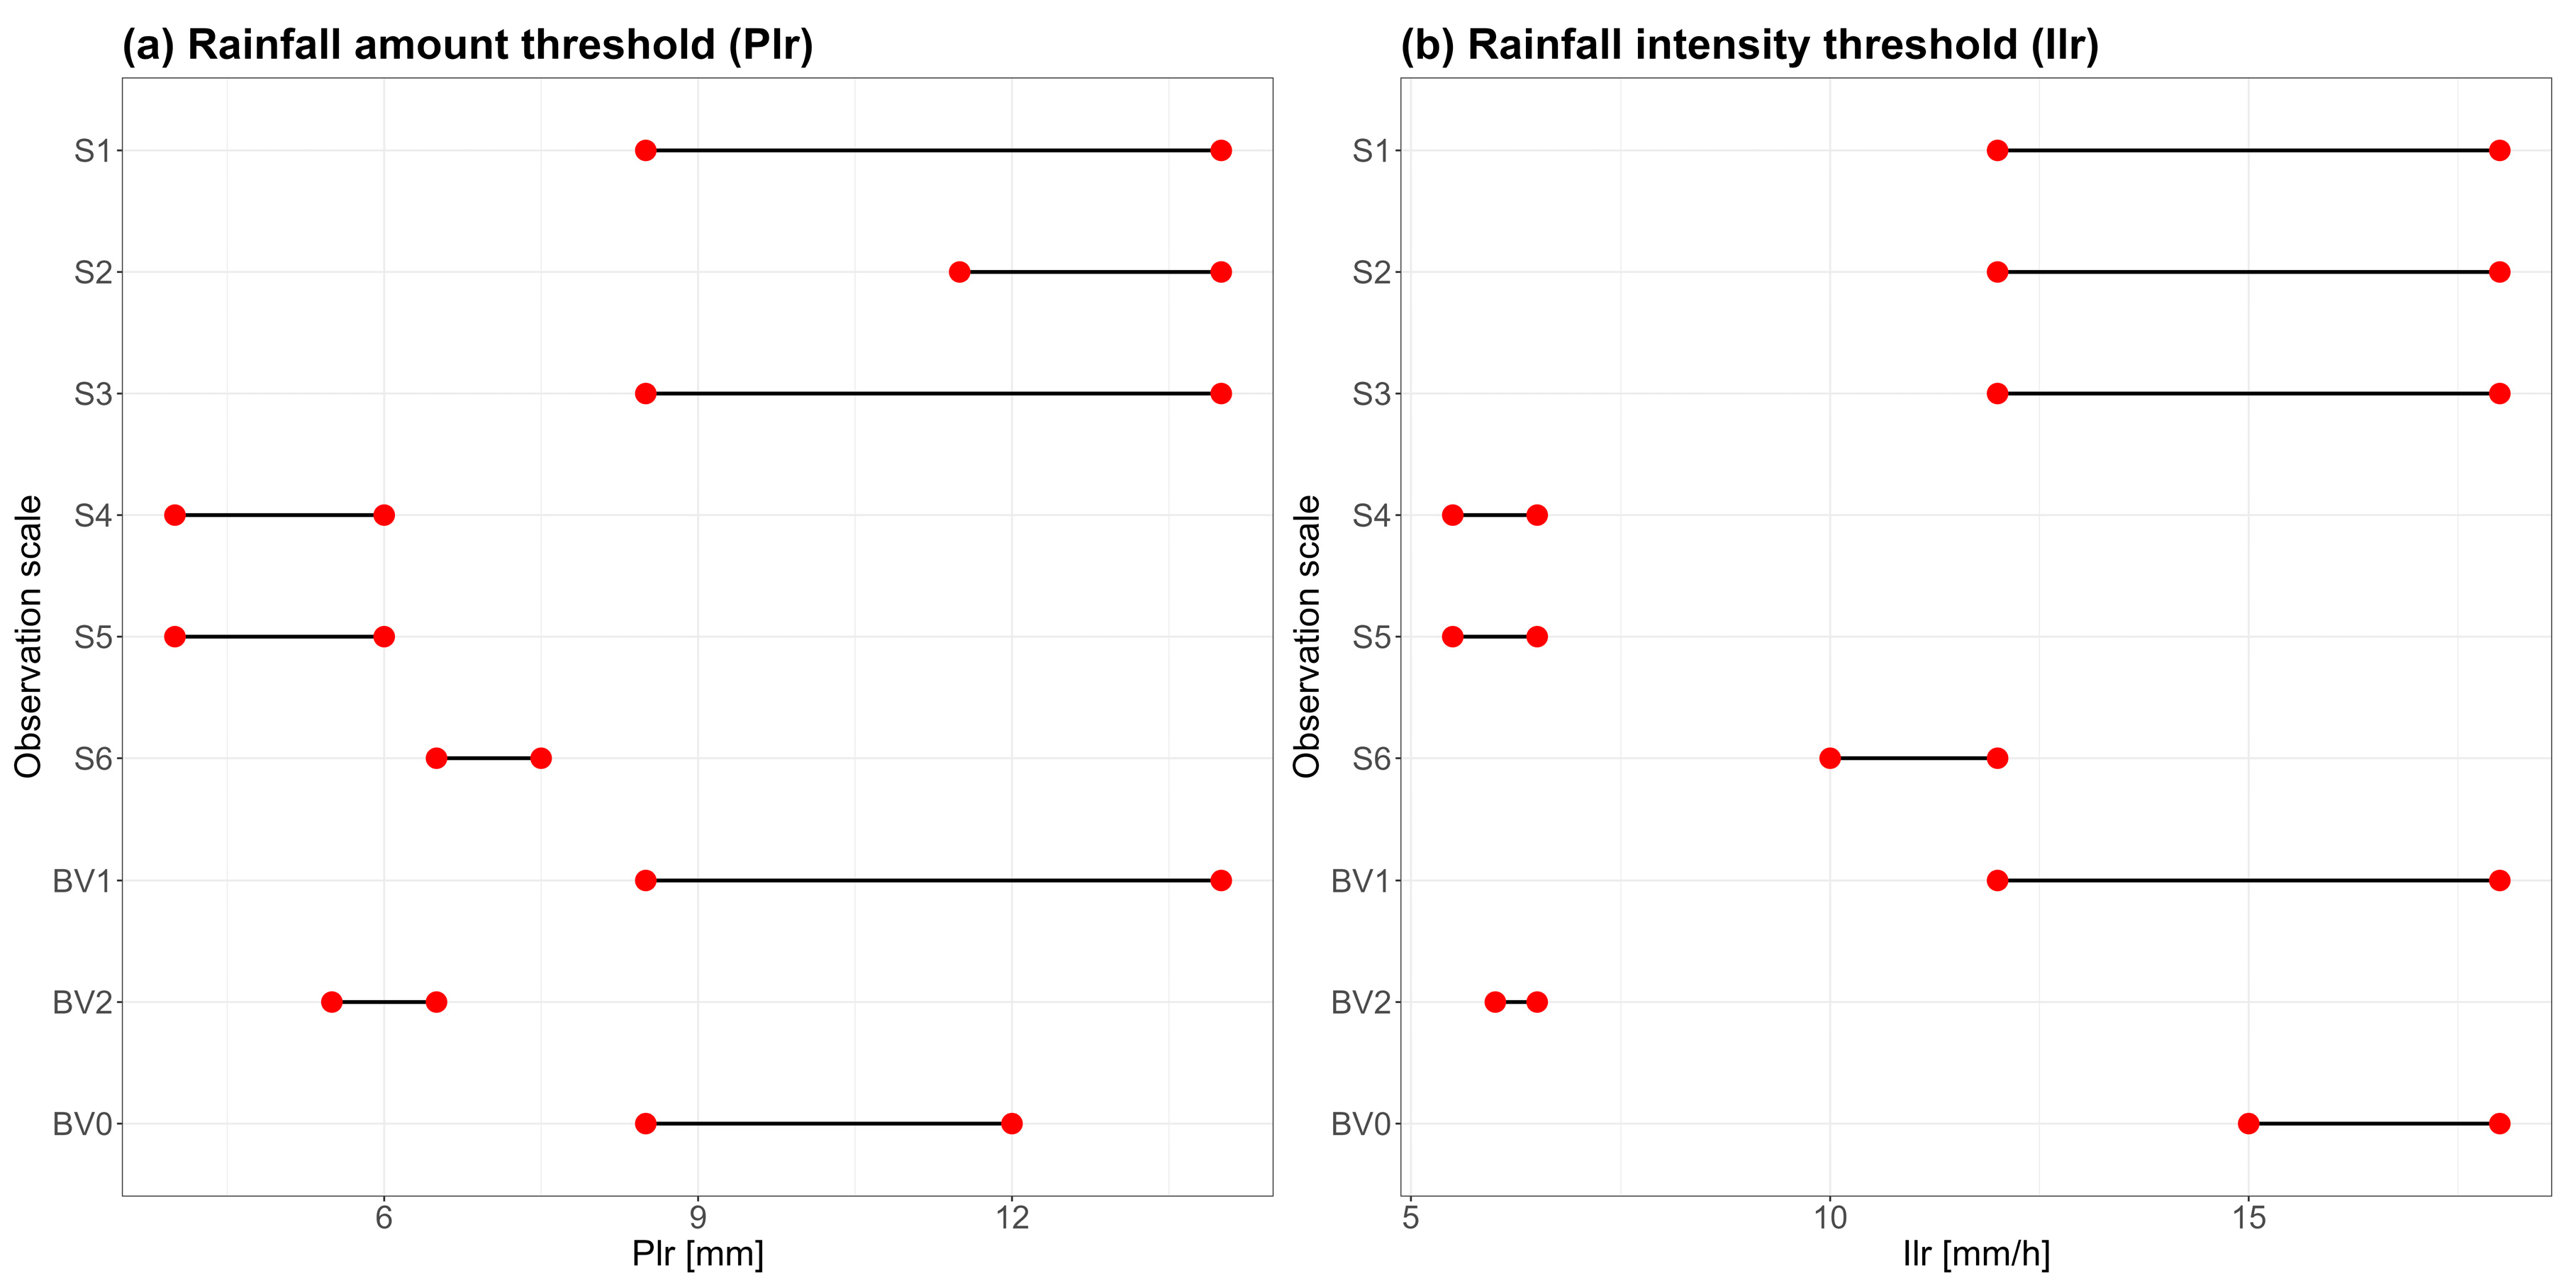
3.7. Sources of Variation in Soil Loss at Different Scales

From the statistical analysis presented in Table 4 and Table 5, it appears that complex interactions between the plot location, the surface runoff length, the slope gradient, the soil surface conditions, and hydrodynamic properties (affected by tillage depth, frequency, orientation) affect soil erosion, which significantly varies from one site to another.
Fine erosive processes can be directly observed at the plot scale. At this scale, rainfall plays a major role in driving soil erosion processes. Under experimental conditions, diffuse and sheet erosion are the only observable forms of erosion, due to the short slope length. The soil type, plot length and slope inclination are the factors that mainly affect these processes. Therefore, at the plot scale, the major sources of variation in soil erosion appear to be the intrinsic properties of the plot itself [2].
At a larger scale (sub-watershed), the dominant erosion process is the removal of soil particles by surface runoff, termed linear erosion. The spatial distribution of land use, the direction of the steepest slope, the spatial distribution of the main drainage collectors and their hydrological connectivity appear to be the dominant factors affecting surface runoff and linear erosion [31].
Soil erosion, at the watershed scale, is the response of cascading effects which include detachment–transport–deposition processes [87]. In the absence of extreme rainfall events, the dominant process driving sediment transport mechanisms is the redistribution of bedload material along the hillslopes into the streambed [55]. At this scale, sediment transport depends on a wide range of variables such as topography, spatial distribution of soil elementary units, soil hydrodynamic properties, sediment availability and hydrological connectivity [88]. The erosive response thus observed reflects the combined effect of the spatial heterogeneity of these parameters, the spatial and temporal patterns of rainfall and the interaction between the different erosive processes (detachment, transport, deposition).
Another source of variation in soil loss observations reported in the present study is related to specific thresholds: the minimum daily rainfall amount, which triggers surface runoff (Plr), and the minimum rainfall intensity, also triggering surface runoff (Ilr), determined as in [27]. Figure 6 shows the range of values for these thresholds for all the observation scales (sites S1 through S6, sub-watersheds BV1 and BV2 and the Tougou watershed BV0). Over the monitoring period 2010–2018, a total of 328 rainfall events are recorded in the watershed, of which 191 and 268 triggered surface runoff on cultivated soils and bare and degraded soils, respectively.
It can be observed that, on cultivated soils (sites S1, S2 and S3), the Plr threshold is between 8.5 mm and 14.0 mm and decreases between 4.0 mm and 7.5 mm for bare and degraded soils (sites S4, S5 and S6). For rainfall intensities thresholds (Ilr), the values range between 12.0 mm.h−1 and 18.0 mm.h−1 and decrease between 5.5 mm.h−1 and 12.0 mm.h−1, respectively, for the same sites. The lower values for both Plr and Ilr thresholds triggering surface runoff on bare and degraded soils can be explained by the nature of the impervious crust types developing on such soils, which increase their runoff potential. As compared to cultivated soils, where tillage is often applied, infiltration is favoured, which tends to increase the rainfall thresholds (Plr, Ilr) at which surface runoff is triggered. The thresholds reported for BV1 (cultivated) and BV2 (bare and degraded) sub-watersheds are similar to those observed for the corresponding sites. At the watershed level (BV0), the Plr (8.5–12.0 mm) and Ilr (15.0–18.0 mm.h−1) thresholds appear to be affected by the heterogeneous composition of soil surface conditions.

4. Discussion

In the present study, soil loss estimates from the plot scale to the watershed scale, under various soil surface conditions and average longitudinal slopes, have been systematically monitored on a rainfall event basis for nine years (2010 to 2018) in a typical Sahelian landscape. The results showed that soil loss rates are substantially higher on bare and degraded plots than on cultivated plots. Depending on the scale of observation, soil loss is reduced by orders of 2.5 to 4.5 times on cultivated soils, in comparison to bare and degraded soils. Similar findings regarding soil erosion rates have been reported in the Tondi Kiboro watershed, the Fakara region (both near Banibouzou, Niger) during field monitoring carried out under the AMMA programme [89], in Melé Haoussa (in Tillabéry region, Niger) [90], in Wankama watershed (Niger) [30], and in Djitiko, Belekonu, and Dounfing watersheds (Mali) [81,82].
Furthermore, the results show that soil erosion decreases with the increase in the active contributing area or spatial scale of observation. On cultivated soils, previous studies highlighted that the protective effect of vegetation cover [91] and the suitable agricultural practices implemented by the farmers could explain the lower rates of soil erosion in such land use conditions [43,73,74,92,93]. In the case of the Tougou watershed, the spectrum of these agricultural practices being used (row sowing, ploughing, weeding, hoeing, ridging) is wide. Moreover, the intrinsic characteristics of the observation scales where the plots were set up (slope location, plot shape and length, plot slope inclination) further add up to the variability of the reported estimates.
Additionally, it has been observed that erosion rates can be significantly different for plots of similar size. It can, therefore, be inferred that erosion rates obtained on such plots are only representative of those of plots of both similar size and soil surface conditions, and therefore extrapolation beyond such context might be flawed by large orders of magnitude [2]. Interestingly, the finding that soil erosion and sediment supply are also affected by extreme and/or highly intense rainfall events has been observed in the present study, as shown by the analysis of rainfall events over 30 mm at the watershed scale. As highlighted by [35,94,95,96], the driving forces and mechanisms behind soil erosion variability across scales might result from a complex interplay between several major factors such as the intrinsic properties of the observation plot, the differences in erosive scale-dependent processes and the hydrological connectivity between sediment production areas (having a higher erodible topsoil). Such variability becomes more complex when soil conservation techniques are implemented [15,26], further amplified by the spatial and temporal distribution of rainfall during a rainfall event and also throughout the rainy season, which is the last factor contributing to the amplification of the variability of soil erosion across spatial scales.
Our results highlight the significant contribution of the scale effect on soil erosion, especially from the plot to the watershed. A likely explanation is that the dominant processes are not the same at increasing scales. Indeed, the question of the relationship between soil loss, sediment yield and observation spatial scale has been framed simply through the decrease in soil loss with the increase of the observation scale. Among the reasons put forward in this regard are, in particular, the decrease in average longitudinal slope with the increase in the watershed size, which likely causes increasing amounts of sediment yield to be trapped within the watershed, especially through the decreasing distribution of erosive forces between the upstream and downstream locations [42,54,56]. Such consideration should, however, be called into question, especially considering that the direction of the active contributing area–soil erosion relationship varies with the dominant processes at play: when slope erosion is dominant (and in particular gullying), soil loss and sediment yield decrease with the size of the watershed; however, if bank erosion is dominant, soil loss and sediment yield increase with the watershed size [97]. This relationship also becomes more complex when vegetation cover is unevenly distributed across space in the watershed [98] and when profound changes in the hydrological alteration occur in hydrosystems (e.g., changes in land use/land cover such as restoration of degraded soils, conversion of cultivated soils to natural vegetation), which can ultimately reverse the trend [11,60,98,99].

5. Conclusions

In the present study, the estimation of soil erosion according to spatial scale and surface soil conditions in the Tougou watershed was monitored during nine years under natural rainfall on various soil surface conditions and at different observation scales in a typical Sahelian landscape. The significant differences observed are explained by the protective effect of the vegetation cover and the agricultural practices implemented in cultivated areas. Soil losses measured at the plot level vary between 2.5 t.ha−1 and 45 t.ha−1 depending on the soil properties. The sediment yield of the watershed varies from 2.5 to 4.5 t.ha−1, which is lower in comparison, highlighting the scale effect between the plot and the watershed. The scale effect is due to the redistribution of sediments detached from the hillslopes and transported in the drainage network. This trend is mainly due to threshold effects and the emergence of new dominant processes with increasing scale. These findings highlight the fact that new processes emerge and become dominant at increasing scales, which makes surface runoff and soil erosion both complex in nature. However, the study sheds light on how eventual pathways relate plot scale to watershed scale, especially in typical Sahelian landscapes. This can serve to develop similarity indices of soil erodibility across scales, accounting for soil surface conditions and further improving quantitative estimations of soil losses in distributed hydrological modelling.

Author Contributions

Conceptualization, L.A.M., R.Y., F.T., G.T.A. and Z.M.Y.; methodology, L.A.M., R.Y., F.T., G.T.A. and Z.M.Y.; validation, L.A.M., R.Y., F.T., G.T.A. and Z.M.Y.; formal analysis, L.A.M.; investigation, L.A.M., R.Y. and G.T.A.; data curation, L.A.M., F.T. and R.Y.; resource, G.T.A.; writing—original draft preparation, L.A.M., R.Y., F.T., G.T.A., Z.M.Y., H.K. and H.Y.; writing—review and editing, L.A.M., R.Y., F.T., G.T.A., Z.M.Y., H.K. and H.Y.; visualization, L.A.M. and R.Y.; supervision, H.K. and H.Y.; project administration, H.K. and H.Y.; funding acquisition, G.T.A. All authors have read and agreed to the published version of the manuscript.

Funding

Gebiaw T. Ayele received funding and acknowledges Griffith Graduate Research School, the Australian Rivers Institute and School of Engineering, Griffith University, Queensland, Australia. Gebiaw T. Ayele funded the APC.

Data Availability Statement

The data presented in this study are private and under the intellectual property of 2iE Institute. However, the data can be made available upon request to Lawani Adjadi Mounirou ([email protected]).

Acknowledgments

Gebiaw T. Ayele acknowledges Griffith Graduate Research School, the Australian Rivers Institute and School of Engineering, Griffith University, Queensland, Australia.

Conflicts of Interest

The authors declare no conflict of interest.

References

  1. Borrelli, P.; Robinson, D.A.; Fleischer, L.R.; Lugato, E.; Ballabio, C.; Alewell, C.; Meusburger, K.; Modugno, S.; Schütt, B.; Ferro, V.; et al. An Assessment of the Global Impact of 21st Century Land Use Change on Soil Erosion. Nat. Commun. 2017, 8, 2013. [Google Scholar] [CrossRef] [PubMed] [Green Version]
  2. Parsons, A.J. How Reliable Are Our Methods for Estimating Soil Erosion by Water? Sci. Total Environ. 2019, 676, 215–221. [Google Scholar] [CrossRef] [PubMed]
  3. Pennock, D.J. Soil Erosion: The Greatest Challenge for Sustainable Soil Management; Lefevre, C., Ed.; Food and Agriculture Organization of the United Nations: Rome, Italy, 2019; ISBN 978-92-5-131426-5. [Google Scholar]
  4. Borrelli, P.; Robinson, D.A.; Panagos, P.; Lugato, E.; Yang, J.E.; Alewell, C.; Wuepper, D.; Montanarella, L.; Ballabio, C. Land Use and Climate Change Impacts on Global Soil Erosion by Water (2015–2070). Proc. Natl. Acad. Sci. USA 2020, 117, 21994–22001. [Google Scholar] [CrossRef] [PubMed]
  5. de Teixeira, D.B.S.; Cecílio, R.A.; Moreira, M.C.; Pires, G.F.; Fernandes Filho, E.I. Recent Advancements in Rainfall Erosivity Assessment in Brazil: A Review. CATENA 2022, 219, 106572. [Google Scholar] [CrossRef]
  6. Descroix, L.; Viramontes, D.; Vauclin, M.; Gonzalez Barrios, J.L.; Esteves, M. Influence of Soil Surface Features and Vegetation on Runoff and Erosion in the Western Sierra Madre (Durango, Northwest Mexico). CATENA 2001, 43, 115–135. [Google Scholar] [CrossRef]
  7. Amogu, O.; Descroix, L.; Yéro, K.S.; Le Breton, E.; Mamadou, I.; Ali, A.; Vischel, T.; Bader, J.-C.; Moussa, I.B.; Gautier, E.; et al. Increasing River Flows in the Sahel? Water 2010, 2, 170–199. [Google Scholar] [CrossRef] [Green Version]
  8. Moussa Ibrahim, B.; Moussa, M.A.; Aghali, I.W.; Abdoulaye, B.N.-A.; Mahamadou, B.I.; Ibrahim, M.; Luc, D.; Eric, L.B.; Jean-Pierre, V. Dynamique Hydro-Érosive Actuelle Des Bassins Versants Endoreiques de La Région de Niamey (Sud-Ouest Du Niger). ESJ 2020, 16, 149. [Google Scholar] [CrossRef]
  9. Mahé, G.; Paturel, J.-E.; Servat, E.; Conway, D.; Dezetter, A. The Impact of Land Use Change on Soil Water Holding Capacity and River Flow Modelling in the Nakambe River, Burkina-Faso. J. Hydrol. 2005, 300, 33–43. [Google Scholar] [CrossRef]
  10. Di Stefano, C.; Pampalone, V.; Todisco, F.; Vergni, L.; Ferro, V. Testing the Universal Soil Loss Equation-MB Equation in Plots in Central and South Italy. Hydrol. Process. 2019, 33, 2422–2433. [Google Scholar] [CrossRef]
  11. Yonaba, R.; Koïta, M.; Mounirou, L.A.; Tazen, F.; Queloz, P.; Biaou, A.C.; Niang, D.; Zouré, C.; Karambiri, H.; Yacouba, H. Spatial and Transient Modelling of Land Use/Land Cover (LULC) Dynamics in a Sahelian Landscape under Semi-Arid Climate in Northern Burkina Faso. Land Use Policy 2021, 103, 105305. [Google Scholar] [CrossRef]
  12. Doto, C.V.; Niang, D.; Zorom, M.; Yacouba, H. Statistical Study of Dry Spells and Their Impact on Rainfed Corn in the Burkinabe Sahel. Am. J. Water Resour. 2020, 8, 31–37. [Google Scholar]
  13. Lèye, B.; Zouré, C.O.; Yonaba, R.; Karambiri, H. Water resources in the Sahel and adaptation of agriculture to climate change: Burkina Faso. In Climate Change and Water Resources in Africa; Diop, S., Scheren, P., Niang, A., Eds.; Springer International Publishing: Cham, Switzerland, 2021; pp. 309–331. ISBN 978-3-030-61224-5. [Google Scholar]
  14. Malam Abdou, M. Etats de Surface et Fonctionnement Hydrodynamique Multi-échelles des Bassins Sahéliens; études Expérimentales en Zones Cristalline et sédimentaire. Ph.D. Thesis, Université de Grenoble 1 et Université de Niamey, Niamey, Niger, 2014. [Google Scholar]
  15. Nyamekye, C.; Thiel, M.; Schönbrodt-Stitt, S.; Zoungrana, B.; Amekudzi, L. Soil and Water Conservation in Burkina Faso, West Africa. Sustainability 2018, 10, 3182. [Google Scholar] [CrossRef] [Green Version]
  16. Mamedov, A.I.; Levy, G.J. Soil Erosion–Runoff Relations on Cultivated Land: Insights from Laboratory Studies. Eur. J. Soil Sci. 2019, 70, 686–696. [Google Scholar] [CrossRef]
  17. Santos, A.B.M.; Maia, V.A.; de Souza, C.R.; de Aguiar-Campos, N.; de Jesus Rodrigues Pais, A.; da Silva, W.B.; Fagundes, N.C.A.; Morel, J.D.; dos Santos, R.M. Hydrological Variability and Long-Term Floristic-Structural Modifications in Different Habitats of a Tropical Semi-Deciduous Forest. J. For. Res. 2022, 33, 801–811. [Google Scholar] [CrossRef]
  18. Zhou, W.; Sun, X.; Li, S.; Du, T.; Zheng, Y.; Fan, Z. Effects of Organic Mulching on Soil Aggregate Stability and Aggregate Binding Agents in an Urban Forest in Beijing, China. J. For. Res. 2022, 33, 1083–1094. [Google Scholar] [CrossRef]
  19. Wischmeier, W.H.; Smith, D.D. Predicting Rainfall Erosion Losses: A Guide to Conservation Planning; Department of Agriculture, Science and Education Administration: Washington, DC, USA, 1978. [Google Scholar]
  20. Mounirou, L.A. Etude du ruissellement et de l’érosion à différentes échelles spatiales sur le bassin versant de Tougou en zone sahélienne du Burkina Faso: Quantification et transposition des données. Ph.D. Thesis, Montpellier 2 University, Montpellier, France, 2012. [Google Scholar]
  21. Mounirou, L.A.; Yacouba, H.; Karambiri, H.; Paturel, J.-E.; Mahé, G. Measuring Runoff by Plots at Different Scales: Understanding and Analysing the Sources of Variation. Comptes Rendus Geosci. 2012, 344, 441–448. [Google Scholar] [CrossRef]
  22. Maïga-Yaleu, S.B.; Chivenge, P.; Yacouba, H.; Guiguemde, I.; Karambiri, H.; Ribolzi, O.; Bary, A.; Chaplot, V. Impact of Sheet Erosion Mechanisms on Organic Carbon Losses from Crusted Soils in the Sahel. CATENA 2015, 126, 60–67. [Google Scholar] [CrossRef]
  23. Malam Abdou, M.; Vandervaere, J.P.; Descroix, L.; Bouzou Moussa, I.; Faran Maiga, O.; Abdou, S.; Bodo Seyni, B.; Ousseini Daouda, M.L. Evolution de la conductivité hydraulique d’un sol sableux cultivé dans l’Ouest du Niger. Biotechnol. Agron. Société Et Environ. 2015, 19, 270–280. [Google Scholar]
  24. Malam-Abdou, M.; Vandervaere, J.-P.; Bouzou-Moussa, I.; Descroix, L.; Mamadou, I.; Faran-Maiga, O. Genèse Des Écoulements Sur Deux Petits Bassins Versants Cristallins de l’Ouest Du Niger: Approche Multi-Échelles Du Fonctionnement Hydrodynamique. Geomorphologie 2016, 22, 363–375. [Google Scholar] [CrossRef]
  25. Kagambèga, F.W.; Traoré, S.; Thiombiano, A.; Lykke, A.M.; Boussim, J.I. Effects of Soil and Water Conservation Techniques on Soil Properties under Degraded Lands in Burkina Faso. JAES 2017, 6, 8. [Google Scholar] [CrossRef]
  26. Zouré, C.; Queloz, P.; Koïta, M.; Niang, D.; Fowé, T.; Yonaba, R.; Consuegra, D.; Yacouba, H.; Karambiri, H. Modelling the Water Balance on Farming Practices at Plot Scale: Case Study of Tougou Watershed in Northern Burkina Faso. CATENA 2019, 173, 59–70. [Google Scholar] [CrossRef] [Green Version]
  27. Mounirou, L.A.; Zouré, C.O.; Yonaba, R.; Paturel, J.-E.; Mahé, G.; Niang, D.; Yacouba, H.; Karambiri, H. Multi-Scale Analysis of Runoff from a Statistical Perspective in a Small Sahelian Catchment under Semi-Arid Climate. Arab. J. Geosci. 2020, 13, 154. [Google Scholar] [CrossRef]
  28. Mounirou, L.A.; Yonaba, R.; Koïta, M.; Paturel, J.-E.; Mahé, G.; Yacouba, H.; Karambiri, H. Hydrologic Similarity: Dimensionless Runoff Indices across Scales in a Semi-Arid Catchment. J. Arid. Environ. 2021, 193, 104590. [Google Scholar] [CrossRef]
  29. Esteves, M.; Lapetite, J.M. A Multi-Scale Approach of Runoff Generation in a Sahelian Gully Catchment: A Case Study in Niger. CATENA 2003, 50, 255–271. [Google Scholar] [CrossRef]
  30. Peugeot, C.; Cappelaere, B.; Vieux, B.E.; Séguis, L.; Maia, A. Hydrologic Process Simulation of a Semiarid, Endoreic Catchment in Sahelian West Niger. 1. Model-Aided Data Analysis and Screening. J. Hydrol. 2003, 279, 224–243. [Google Scholar] [CrossRef] [Green Version]
  31. Fiener, P.; Wilken, F.; Auerswald, K. Filling the Gap between Plot and Landscape Scale—Eight Years of Soil Erosion Monitoring in 14 Adjacent Watersheds under Soil Conservation at Scheyern, Southern Germany. Adv. Geosci. 2019, 48, 31–48. [Google Scholar] [CrossRef] [Green Version]
  32. Karambiri, H. Crues et érosion Hydrique au Sahel: Étude et modélisation des Flux d’eau et de Matières sur un Petit Bassin Versant Pastoral au nord du Burkina Faso. Ph.D. Thesis, UPMC, Paris, France, 2003. [Google Scholar]
  33. Karambiri, H.; Ribolzi, O.; Delhoume, J.P.; Ducloux, J.; Coudrain-Ribstein, A.; Casenave, A. Importance of Soil Surface Characteristics on Water Erosion in a Small Grazed Sahelian Catchment. Hydrol. Process. 2003, 17, 1495–1507. [Google Scholar] [CrossRef]
  34. Cerdan, O.; Landemaine, V.; Laignel, B.; Evrard, O.; Salavador-Blanes, S.; Grangeon, T.; Vandromme, R.; Laceby, P. The Scale Dependency of Erosion and Runoff for Two Agricultural Catchments in the Western Paris Basin, France. Geophys. Res. Abstr. 2019, 21, 1. [Google Scholar]
  35. Ayele, G.T.; Kuriqi, A.; Jemberrie, M.A.; Saia, S.M.; Seka, A.M.; Teshale, E.Z.; Daba, M.H.; Ahmad Bhat, S.; Demissie, S.S.; Jeong, J.; et al. Sediment Yield and Reservoir Dedimentation in Highly Dynamic Watersheds: The Case of Koga Reservoir, Ethiopia. Water 2021, 13, 3374. [Google Scholar] [CrossRef]
  36. Roose, É. Évolution Historique Des Stratégies de Lutte Antiérosive—Vers La Gestion Conservatoire de l ‘Eau, de La Biomasse et de La Fertilité Des Sols (GCES). Sci. Et Chang. Planétaires/Sécheresse 2004, 15, 9–18. [Google Scholar]
  37. Planchon, O. Transferts d’échelle et étude des écoulements de surface sur une pente. In Le transfert d’échelle; Colloques et Séminaires; ORSTOM: Paris, France, 1991; pp. 79–94. ISBN 2-7099-1029-2. [Google Scholar]
  38. Blöschl, G. Scaling in Hydrology: Invited Commentary. Hydrol. Process. 2001, 15, 709–711. [Google Scholar] [CrossRef]
  39. Sivapalan, M. Pattern, process and function: Elements of a unified theory of hydrology at the catchment scale. In Encyclopedia of Hydrological Sciences; Anderson, M.G., McDonnell, J.J., Eds.; John Wiley & Sons, Ltd.: Chichester, UK, 2005; p. hsa012. ISBN 978-0-471-49103-3. [Google Scholar]
  40. Sidle, R.C. Field Observations and Process Understanding in Hydrology: Essential Components in Scaling. Hydrol. Process. 2006, 20, 1439–1445. [Google Scholar] [CrossRef]
  41. Sidle, R.C.; Gomi, T.; Loaiza Usuga, J.C.; Jarihani, B. Hydrogeomorphic Processes and Scaling Issues in the Continuum from Soil Pedons to Catchments. Earth-Sci. Rev. 2017, 175, 75–96. [Google Scholar] [CrossRef]
  42. Zhao, G.; Gao, P.; Tian, P.; Sun, W.; Hu, J.; Mu, X. Assessing Sediment Connectivity and Soil Erosion by Water in a Representative Catchment on the Loess Plateau, China. CATENA 2020, 185, 104284. [Google Scholar] [CrossRef]
  43. Zhang, X.; Song, J.; Wang, Y.; Deng, W.; Liu, Y. Effects of Land Use on Slope Runoff and Soil Loss in the Loess Plateau of China: A Meta-Analysis. Sci. Total Environ. 2021, 755, 142418. [Google Scholar] [CrossRef]
  44. Belemtougri, A.P.; Ducharne, A.; Tazen, F.; Oudin, L.; Karambiri, H. Understanding Key Factors Controlling the Duration of River Flow Intermittency: Case of Burkina Faso in West Africa. J. Hydrol. Reg. Stud. 2021, 37, 100908. [Google Scholar] [CrossRef]
  45. Wood, E.F.; Sivapalan, M.; Beven, K. Similarity and Scale in Catchment Storm Response. Rev. Geophys. 1990, 28, 1. [Google Scholar] [CrossRef] [Green Version]
  46. Roose, E. Erosion et Ruissellement en Afrique de l’Ouest: Vingt Annees de Mesures en Petites Parcelles Expérimentales; ORSTOM: Abidjan, Côte d’Ivoire, 1975; p. 74 multigr. [Google Scholar]
  47. Cerdan, O.; Le Bissonnais, Y.; Govers, G.; Lecomte, V.; van Oost, K.; Couturier, A.; King, C.; Dubreuil, N. Scale Effect on Runoff from Experimental Plots to Catchments in Agricultural Areas in Normandy. J. Hydrol. 2004, 299, 4–14. [Google Scholar] [CrossRef]
  48. Parsons, A.J.; Brazier, R.E.; Wainwright, J.; Powell, D.M. Scale Relationships in Hillslope Runoff and Erosion. Earth Surf. Process. Landforms 2006, 31, 1384–1393. [Google Scholar] [CrossRef]
  49. Bagarello, V.; Ferro, V. Analysis of Soil Loss Data from Plots of Differing Length for the Sparacia Experimental Area, Sicily, Italy. Biosyst. Eng. 2010, 105, 411–422. [Google Scholar] [CrossRef]
  50. García-Ruiz, J.M.; Beguería, S.; Nadal-Romero, E.; González-Hidalgo, J.C.; Lana-Renault, N.; Sanjuán, Y. A Meta-Analysis of Soil Erosion Rates across the World. Geomorphology 2015, 239, 160–173. [Google Scholar] [CrossRef] [Green Version]
  51. Bagarello, V.; Ferro, V.; Keesstra, S.; Comino, J.R.; Pulido, M.; Cerdà, A. Testing Simple Scaling in Soil Erosion Processes at Plot Scale. CATENA 2018, 167, 171–180. [Google Scholar] [CrossRef]
  52. Moreno-de las Heras, M.; Nicolau, J.M.; Merino-Martín, L.; Wilcox, B.P. Plot-scale Effects on Runoff and Erosion along a Slope Degradation Gradient. Water Resour. Res. 2010, 46, W04503. [Google Scholar] [CrossRef] [Green Version]
  53. Chen, J.; Li, Z.; Xiao, H.; Ning, K.; Tang, C. Effects of Land Use and Land Cover on Soil Erosion Control in Southern China: Implications from a Systematic Quantitative Review. J. Environ. Manag. 2021, 282, 111924. [Google Scholar] [CrossRef]
  54. Mathier, L.; Roy, A.G. A Study on the Effect of Spatial Scale on the Parameters of a Sediment Transport Equation for Sheetwash. CATENA 1996, 26, 161–169. [Google Scholar] [CrossRef]
  55. Boix-Fayos, C.; Martínez-Mena, M.; Calvo-Cases, A.; Arnau-Rosalén, E.; Albaladejo, J.; Castillo, V. Causes and Underlying Processes of Measurement Variability in Field Erosion Plots in Mediterranean Conditions. Earth Surf. Process. Landforms 2007, 32, 85–101. [Google Scholar] [CrossRef]
  56. de Vente, J.; Poesen, J.; Arabkhedri, M.; Verstraeten, G. The Sediment Delivery Problem Revisited. Prog. Phys. Geogr. Earth Environ. 2007, 31, 155–178. [Google Scholar] [CrossRef] [Green Version]
  57. Roose, É.; De Noni, G. Recherches Sur l ‘érosion Hydrique En Afrique: Revue et Perspectives. Sci. Et Chang. Planétaires/Sécheresse 2004, 15, 121–129. [Google Scholar]
  58. Roose, É.; Sabir, M.; Arabi, M.; Morsli, B.; Mazour, M. Soixante Années de Recherches En Coopération Sur l’érosion Hydrique et La Lutte Antiérosive Au Maghreb. Physio-Géo 2012, 6, 43–69. [Google Scholar] [CrossRef]
  59. Yonaba, R.O. Dynamique Spatio-Temporelle des états de Surface et Influence sur le Ruissellement sur un Bassin de Type sahélien: Cas du Bassin de Tougou (Nord Burkina Faso). Ph.D. Thesis, Institut International d’Ingénierie de l’Eau et de l’Environnement, Ouagadougou, Burkina Faso, 2020. [Google Scholar]
  60. Yonaba, R.; Biaou, A.C.; Koïta, M.; Tazen, F.; Mounirou, L.A.; Zouré, C.O.; Queloz, P.; Karambiri, H.; Yacouba, H. A Dynamic Land Use/Land Cover Input Helps in Picturing the Sahelian Paradox: Assessing Variability and Attribution of Changes in Surface Runoff in a Sahelian Watershed. Sci. Total Environ. 2021, 757, 143792. [Google Scholar] [CrossRef]
  61. Koïta, M.; Sandwidi, W.J.P.; Dara, A.E. Recharge Estimation of Hard Rock Aquifers under Sahelian Climate Conditions Using Water Table Fluctuation: Case Study of Tougou Catchment, Burkina Faso. JWARP 2017, 09, 1428–1448. [Google Scholar] [CrossRef] [Green Version]
  62. Rusagara, R.; Koïta, M.; Plagnes, V.; Jost, A. Groundwater Recharge Pathways to a Weathered-Rock Aquifer System in a Dryland Catchment in Burkina Faso. Hydrogeol. J. 2022, 30, 1489–1512. [Google Scholar] [CrossRef]
  63. Casenave, A.; Valentin, C. A Runoff Capability Classification System Based on Surface Features Criteria in Semi-Arid Areas of West Africa. J. Hydrol. 1992, 130, 231–249. [Google Scholar] [CrossRef]
  64. AFNOR ISO 11277:2020. Available online: https://www.iso.org/fr/standard/69496.html (accessed on 29 November 2022).
  65. Reynolds, W.; Topp, G.C.; Carter, M.; Gregorich, E. Soil Water Analyses: Principles and Parameters. In Soil Sampling and Methods of Analysis, 2nd ed.; CRC Press: Boca Raton, FL, USA, 2008; pp. 913–939. [Google Scholar]
  66. Jawuoro, S.O.; Koech, O.K.; Karuku, G.N.; Mbau, J.S. Effect of Piospheres on Physio-Chemical Soil Properties in the Southern Rangelands of Kenya. Ecol Process 2017, 6, 14. [Google Scholar] [CrossRef] [Green Version]
  67. Strickler, A. Beiträge Zur Frage Der Geschwindigkeitsformel Und Der Rauhigkeitszahlen Für Ströme, Kanäle Und Geschlossene Leitungen. (Contributions to the Question of a Velocity Formula and Roughness Data for Streams, Channels and Closed Pipelines); Amtes für Wasserwirtschaft: Bern, Switzerland, 1923. [Google Scholar]
  68. Fiedler, F.R. Simple, Practical Method for Determining Station Weights Using Thiessen Polygons and Isohyetal Maps. J. Hydrol. Eng. 2003, 8, 219–221. [Google Scholar] [CrossRef]
  69. Barbier, B.; Yacouba, H.; Karambiri, H.; Zoromé, M.; Somé, B. Human Vulnerability to Climate Variability in the Sahel: Farmers’ Adaptation Strategies in Northern Burkina Faso. Environ. Manag. 2009, 43, 790–803. [Google Scholar] [CrossRef]
  70. Vandervaere, J.-P.; Vauclin, M.; Haverkamp, R.; Peugeot, C.; Thony, J.-L.; Gilfedder, M. Prediction of Crust-Induced Surface Runoff with Disc Infiltrometer Data. Soil Sci. 1998, 163, 9–21. [Google Scholar] [CrossRef]
  71. Kafando, M.B.; Koïta, M.; Le Coz, M.; Yonaba, O.R.; Fowe, T.; Zouré, C.O.; Faye, M.D.; Leye, B. Use of Multidisciplinary Approaches for Groundwater Recharge Mechanism Characterization in Basement Aquifers: Case of Sanon Experimental Catchment in Burkina Faso. Water 2021, 13, 3216. [Google Scholar] [CrossRef]
  72. Kafando, M.B.; Koïta, M.; Zouré, C.O.; Yonaba, R.; Niang, D. Quantification of Soil Deep Drainage and Aquifer Recharge Dynamics According to Land Use and Land Cover in the Basement Zone of Burkina Faso in West Africa. Sustainability 2022, 14, 14687. [Google Scholar] [CrossRef]
  73. Boubacar, A.; Malam Abdou, M.; Warzagan, A.I.; Mamadou, I.; Faran Maiga, O.; Bouzou Moussa, I.; Descroix, L. Efficacité Du Sous-Solage Dans La Restauration Des Sols Sahéliens Dégradés: Étude Expérimentale Sur Le Site de Tondi Kiboro, Niger. Afr. Sci. 2017, 13, 189–201. [Google Scholar]
  74. Fonseca, M.R.S.; Uagoda, R.; Chaves, H.M.L. Rates, Factors, and Tolerances of Water Erosion in the Cerrado Biome (Brazil): A Meta-analysis of Runoff Plot Data. Earth Surf. Process. Landf. 2022, 47, 582–595. [Google Scholar] [CrossRef]
  75. Yu, Y.; Zhu, R.; Ma, D.; Liu, D.; Liu, Y.; Gao, Z.; Yin, M.; Bandala, E.R.; Rodrigo-Comino, J. Multiple Surface Runoff and Soil Loss Responses by Sandstone Morphologies to Land-Use and Precipitation Regimes Changes in the Loess Plateau, China. CATENA 2022, 217, 106477. [Google Scholar] [CrossRef]
  76. Zhao, J.; Wang, Z.; Dong, Y.; Yang, Z.; Govers, G. How Soil Erosion and Runoff Are Related to Land Use, Topography and Annual Precipitation: Insights from a Meta-Analysis of Erosion Plots in China. Sci. Total Environ. 2022, 802, 149665. [Google Scholar] [CrossRef] [PubMed]
  77. Roose, E.; Lelong, F. Les Facteurs de l’érosion Hydrique En Afrique Tropicale. Études Sur Petites Parcelles Expérimentales de Sol. Revue de Géographie Physique et de Géologie Dynamique 1976, 18, 365–374. [Google Scholar]
  78. Anache, J.A.A.; Wendland, E.C.; Oliveira, P.T.S.; Flanagan, D.C.; Nearing, M.A. Runoff and Soil Erosion Plot-Scale Studies under Natural Rainfall: A Meta-Analysis of the Brazilian Experience. CATENA 2017, 152, 29–39. [Google Scholar] [CrossRef]
  79. Martinez, G.; Weltz, M.; Pierson, F.B.; Spaeth, K.E.; Pachepsky, Y. Scale Effects on Runoff and Soil Erosion in Rangelands: Observations and Estimations with Predictors of Different Availability. CATENA 2017, 151, 161–173. [Google Scholar] [CrossRef]
  80. Mathieu, P. Erosion et Transport Solide sur le Bassin Versant de l’Amitioro, Côte d’Ivoire; ORSTOM: Yaounde, Cameroon, 1969. [Google Scholar]
  81. Diallo, D. Erosion des sols en zone soudanienne du Mali: Transfert des matériaux érodés dans le bassin versant de Djitiko (Haut-Niger). Ph.D. Thesis, Joseph Fourier University, Grenoble, France, 2000. [Google Scholar]
  82. Droux, J.; Mietton, M.; Olivry, J.-C. Suspended Sediment Yields in the Sudanian Savanna Zone: Examples from Three Representative Catchments in Mali. Géomorphologie-Paris 2003, 2, 99–110. [Google Scholar] [CrossRef]
  83. Naah, E. Hydrologie Du Grand Yaéré Du Nord-Cameroun. Ph.D. Thesis, Université de Yaoundé, Yaounde, Cameroon, 1990. [Google Scholar]
  84. Olivry, J.-C.; Hoorelbecke, R.; Andiga, J. Quelques Mesures Complémentaires de Transports Solides En Suspension Au Cameroun: Le Mayo Tsanaga à Bogo: 1973. Le Mbam à Goura: 1970–1974; ORSTOM: Yaounde, Cameroon, 1974. [Google Scholar]
  85. Thébé, B. Hydrodynamique de quelques sols du Nord-Cameroun: Bassins versants de Mouda: Contribution à l’étude des transferts d’échelles. Ph.D. Thesis, Université des Sciences et Techniques du Languedoc, Montpellier, France, 1987. [Google Scholar]
  86. Achite, M.; Meddi, M. Estimation Du Transport Solide Dans Le Bassin-Versant de l’Oued Haddad (Nord-Ouest Algérien). Sci. Et Chang. Planétaires/Sécheresse 2004, 15, 367–373. [Google Scholar]
  87. Huang, X.; Wang, K.-R.; Zou, Y.; Cao, X.-C. Development of Global Soil Erosion Research at the Watershed Scale: A Bibliometric Analysis of the Past Decade. Environ. Sci. Pollut. Res. 2021, 28, 12232–12244. [Google Scholar] [CrossRef]
  88. Arnau-Rosalén, E.; Calvo-Cases, A.; Boix-Fayos, C.; Lavee, H.; Sarah, P. Analysis of Soil Surface Component Patterns Affecting Runoff Generation. An Example of Methods Applied to Mediterranean Hillslopes in Alicante (Spain). Geomorphology 2008, 101, 595–606. [Google Scholar] [CrossRef]
  89. Descroix, L.; Mamadou, I.; Malam Abdou, M.; Bachir, A.; Bouzou Moussa, I.; Lebreton, E.; Souley Yero, K. Etat des lieux et proposition de restauration des sols sur le bassin versant de Tondi Kiboro (Niger). In Lutte antiérosive: Réhabilitation des sols Tropicaux et Protection Contre les Pluies Exceptionnelles; Colloques et Séminaires; IRD: Marseille, France, 2012; p. 10. ISBN 978-2-7099-1728-5. [Google Scholar]
  90. Malam Abdou, M. Caractéristiques de l’encroutement Des Sols et Ses Conséquences Socio-Environnementales Dans La Région de Tillaberi (Niger). DALOGÉO 2020. Available online: https://www.revuegeo-univdaloa.net/fr/publication/caracteristiques-de-lencroutement-des-sols-et-ses-consequences-socio-environnementales (accessed on 29 November 2022).
  91. Malam Abdou, M.; Vandervaere, J.-P.; Descroix, L.; Bouzou Moussa, I. Comparative Hydrodynamic Study of Granitic and Sedimentary Catchments in Western Niger. Hydrol. Sci. J. 2021, 66, 1541–1551. [Google Scholar] [CrossRef]
  92. Chiang, L.-C.; Chuang, Y.-T.; Han, C.-C. Integrating Landscape Metrics and Hydrologic Modeling to Assess the Impact of Natural Disturbances on Ecohydrological Processes in the Chenyulan Watershed, Taiwan. Int. J. Environ. Res. Public Health 2019, 16, 266. [Google Scholar] [CrossRef] [PubMed] [Green Version]
  93. Langhans, C.; Diels, J.; Clymans, W.; Van den Putte, A.; Govers, G. Scale Effects of Runoff Generation under Reduced and Conventional Tillage. CATENA 2019, 176, 1–13. [Google Scholar] [CrossRef]
  94. Wei, W.; Chen, L.; Yang, L.; Fu, B.; Sun, R. Spatial Scale Effects of Water Erosion Dynamics: Complexities, Variabilities, and Uncertainties. Chin. Geogr. Sci. 2012, 22, 127–143. [Google Scholar] [CrossRef]
  95. Ayele, G.; Teshale, E.; Yu, B.; Rutherfurd, I.; Jeong, J. Streamflow and Sediment Yield Prediction for Watershed Prioritization in the Upper Blue Nile River Basin, Ethiopia. Water 2017, 9, 782. [Google Scholar] [CrossRef] [Green Version]
  96. Ayele, G.T.; Seka, A.M.; Taddese, H.; Jemberrie, M.A.; Ndehedehe, C.E.; Demissie, S.S.; Awange, J.L.; Jeong, J.; Hamilton, D.P.; Melesse, A.M. Relationship of Attributes of Soil and Topography with Land Cover Change in the Rift Valley Basin of Ethiopia. Remote Sens. 2022, 14, 3257. [Google Scholar] [CrossRef]
  97. Dedkov, A.P.; Mozzherin, V.I. Erosion and Sediment Yield on the Earth. IAHS Publ.-Ser. Proc. Rep.-Intern Assoc Hydrol. Sci. 1996, 236, 29–36. [Google Scholar]
  98. Figueiredo, E.; Bathurst, J.C. Relationship between Simulated Sediment Yield and Scale in a Semiarid Region of Brazil. Sediment Budg. 2005, 2, 110–118. [Google Scholar]
  99. Gbohoui, Y.P.; Paturel, J.-E.; Fowe Tazen; Mounirou, L.A.; Yonaba, R.; Karambiri, H.; Yacouba, H. Impacts of Climate and Environmental Changes on Water Resources: A Multi-Scale Study Based on Nakanbé Nested Watersheds in West African Sahel. J. Hydrol. Reg. Stud. 2021, 35, 100828. [Google Scholar] [CrossRef]
Figure 1. The experimental design used in the present study and the location of the Tougou watershed. (a) Location of Tougou watershed in Burkina Faso. The black contour lines indicate the locations of the sub-watersheds BV1 (which is cultivated) and BV2 (with bare and degraded soils). The ASTER GDEM Digital Elevation Model, 30 m resolution, tile number N13W003, obtained from USGS Earth Explorer (https://gdemdl.aster.jspacesystems.or.jp/index_en.html (accessed on 12 September 2020)), is used to calculate the elevation for the entire watershed. (b) Detailed representation of the experimental design in BV2. (c) Detailed representation of the experimental design in BV1. (d) Field images of the experimental design at S4 site in BV2. (e) Field images of the experimental design at S1 site in BV1.
Land 11 02302 g001
Figure 2. Distribution of rainfall events monitored in the Tougou watershed over the period 2010–2018. The distribution in terms of number of events is presented in the upper bar and the distribution in terms of rainfall volume is presented in the lower bar.
Land 11 02302 g002
Figure 3. Relationship between annual rainfall, surface runoff and soil loss rates in Tougou watershed. (a) Linear relationship between annual rainfall and surface runoff. (b) Linear relationship between surface runoff and soil losses. BV1 is the cultivated sub-watershed, BV2 is the bare and degraded sub-watershed and BV0 is the Tougou watershed.
Land 11 02302 g003
Figure 4. Average soil loss rates monitored in Tougou watershed over the period 2010–2018. (a) Soil loss rates measured on plots: sites S1 through S3, located on cultivated areas; sites S4 through S6, located on bare and degraded areas. (b) Soil loss rates for sub-watersheds (BV1 and BV2) and the Tougou watershed (BV0). The error bars on all histograms are defined based on nine values.
Land 11 02302 g004
Figure 5. Effect of the timing of the rainfall event on soil loss rates in the Tougou watershed over the period 2010–2018. Rainfall events occurring at the onset of the rainy season (June–July) generate slightly higher soil loss rates than rainfall events occurring at the middle-end of the rainy season (August–September).
Land 11 02302 g005
Figure 6. Minimum rainfall amount (a-Plr) and intensity (b-Ilr) thresholds triggering surface runoff according to plot location and observation scale in the Tougou watershed.
Land 11 02302 g006
Table 1. Description of the experimental setup used in the present study.
Site NameUnit
Name
Hydrological
Unit Type
Size
(Width × Length *)
Average
Slope %
Soil Surface
Condition
Land Use
S1S1-1Plot1 m2 (1 × 1)1.60 ± 0.43C (agricultural crust)Cultivated
S1-50Plot50 m2 (5 × 10)1.80 ± 0.14
S1-150Plot150 m2 (6 × 25)1.35 ± 0.15
S2S2-1Plot1 m2 (1 × 1)1.70 ± 0.50
S2-50Plot50 m2 (5 × 10)1.40 ± 0.19
S2-150Plot150 m2 (6 × 25)1.60 ± 0.10
S3S3-1Plot1 m2 (1 × 1)4.00 ± 0.52
S3-50Plot50 m2 (5 × 10)4.20 ± 0.59
S3-150Plot150 m2 (6 × 25)2.85 ± 0.15
S4S4-1Plot1 m2 (1 × 1)0.75 ± 0.16ERO (erosion crust)Degraded and uncultivated
S4-50Plot50 m2 (5 × 10)1.25 ± 0.09
S4-150Plot150 m2 (6 × 25)0.93 ± 0.08
S5S5-1Plot1 m2 (1 × 1)0.90 ± 0.31G (gravel crust)
S5-50Plot50 m2 (5 × 10)0.96 ± 0.11
S5-150Plot150 m2 (6 × 25)0.80 ± 0.14
S6S6-1Plot1 m2 (1 × 1)2.30 ± 0.24DES (desiccation crust)
S6-501Plot50 m2 (5 × 10)2.10 ± 0.28
S6-502Plot50 m2 (5 × 10)3.55 ± 0.32
BV1sub-watershed6.1 ha1.91 ± 0.28C (agricultural crust)Cultivated
BV2sub-watershed33.8 ha1.18 ± 0.16ERO, G, DESDegraded and uncultivated
BV0watershed37 km20.60 ± 0.11C, ERO, G, DESHeterogeneous
* The plot length is also termed as the runoff length.
Table 2. Physical properties of the soil on the monitoring sites in the Tougou watershed.
SiteSoil TypeTillage OperationsCrop TypeKsat *
(mm.h−1)
Ksat (mm.h−1),
Reported in [63]
Bulk Density ρb (g.cm−3)Porosity
p (%)
n
(s.m−1/3)
S1LoamRow sowing + ploughing + weeding + hoeingMillet, sorghum and cowpea21–2515–351.40–1.4645–470.050
S2SandyRow sowing + ploughing + ridgingMillet, sorghum and cowpea27–331.36–1.4446–490.060
S3Sandy gravellyRow sowing + weeding + hoeingMillet, sorghum and peanut16–191.46–1.4844–450.065
S4Dry clayNo tillage 2–2.52–41.58–1.6139–400.015
S5GravellyNo cropping3–3.53–51.88–1.9427–290.020
S6Sand 12–1510–201.66–1.7036–370.025
* Ksat is the measured soil saturated hydraulic conductivity. Twelve soil infiltration measurements are carried out for each site, while nine soil samples are used to estimate soil porosity for each site.
Table 3. Rainfall event description over the monitoring period 2010–2018 in the Tougou watershed.
YearsCultivated Sub-Watershed (BV1)Bare and Degraded Sub-Watershed (BV2)Watershed (BV0)
Ann. RfMax. Daily Rf.N. Rf ≥ 30Cum. Rf ≥ 30Ann. RfMax. Daily Rf.N. Rf ≥ 30Cum. Rf ≥ 30Ann. RfMax. Daily Rf.N. Rf ≥ 30Cum. Rf ≥ 30
mmmm-mmmmmm-mmmmmm-mm
2010649455203664426291672546253
2011460804192464523173449544156
2012705651242667599104256988211412
2013591424141596424142579423110
2014636496248628518325624477280
2015723114742272411674247301147424
2016517463126513363130515383115
2017546516201576577255555477265
2018667608315714768391681878370
Legend: Ann. Rf: cumulative annual rainfall; Max. Daily Rf.: maximum daily rainfall; N. Rf ≥ 30: Number of daily rainfall events above 30 mm; Cum. Rf ≥ 30: cumulative volume for rainfall events above 30 mm.
Table 4. Analysis of the plot size effect on soil loss values in the Tougou watershed.
SitePlot SizeKruskal–Wallis Test
(α = 5% Significance Level)
Mann–Whitney U Test
(α = 5% Significance Level)
p-ValueDecision (H0)1-βHypothesis H0p-ValueDecision (H0)1-β
S1
(cultivated)
1 m2<0.01%Rejected95%μ(1m²) = μ(50m²)<0.27%Rejected94%
50 m2μ(1m²) = μ(150m²)<0.01%Rejected95%
150 m2μ(50m²) = μ(150m²)<0.11%Rejected95%
S2
(cultivated)
1 m2<0.01%Rejected95%μ(1m²) = μ(50m²)<0.08%Rejected95%
50 m2μ(1m²) = μ(150m²)<0.01%Rejected95%
150 m2μ(50m²) = μ(150m²)<0.11%Rejected95%
S3
(cultivated)
1 m2<0.01%Rejected95%μ(1m²) = μ(50m²)<0.01%Rejected95%
50 m2μ(1m²) = μ(150m²)<0.01%Rejected95%
150 m2μ(50m²) = μ(150m²)<0.15%Rejected95%
S4
(Bare and degraded, ERO crusts)
1 m2<0.01%Rejected95%μ(1m²) = μ(50m²)<0.36%Rejected95%
50 m2μ(1m²) = μ(150m²)<0.01%Rejected95%
150 m2μ(50m²) = μ(150m²)<0.20%Rejected95%
S5
(Bare and degraded, G crusts)
1 m2<0.01%Rejected95%μ(1m²) = μ(50m²)<0.20%Rejected95%
50 m2μ(1m²) = μ(150m²)<0.01%Rejected95%
150 m2μ(50m²) = μ(150m²)<0.27%Rejected95%
S6
(Bare and degraded, DES crusts)
1 m2<0.02%Rejected95%μ(1m²) = μ(50m²)<0.01%Rejected95%
50 m2μ(1m²) = μ(50m²)<0.06%Rejected95%
50 m2μ(50m²) = μ(50m²)48.00%Not rejected21%
Legend: μ refers to the mean of the distribution of soil loss values measured at a given scale.
Table 5. Analysis of the effect of the plot location on soil loss values in the Tougou watershed.
Land Use TypePlot NameKruskal–Wallis
(α = 5% Significance Level)
Mann–Whitney U Test
(α = 5% Significance Level)
ScalePlotp-Value1-βNull Hypothesis (H0)p-Value1-β
Cultivated1 m2S1-1m²0.21%93%μ(S1-1m²) = μ(S2-1m²)9.34%57%
S2-1m²μ(S1-1m²) = μ(S3-1m²)<2.73%78%
S3-1m²μ(S2-1m²) = μ(S3-1m²)<0.15%95%
50 m2S1-50m²6.70%49%μ(S1-50m²) = μ(S2-50m²)<3.41%70%
S2-50m²μ(S1-50m²) = μ(S3-50m²)59.62%<10%
S3-50m²μ(S2-50m²) = μ(S3-50m²)9.34%49%
150 m2S1-150m²8.41%49%μ(S1-150m²) = μ(S2-150m²)5.21%70%
S2-150m²μ(S1-150m²) = μ(S3-150m²)53.65%<10%
S3-150m²μ(S2-150m²) = μ(S3-150m²)9.34%46%
Bare and degraded1 m2S4-1m²<0.11%95%μ(S4-1m²) = μ(S5-1m²)48.00%<10%
S5-1m²μ(S4-1m²) = μ(S6-1m²)<0.27%95%
S6-1m²μ(S5-1m²) = μ(S6-1m²)<0.15%95%
50 m2S4-50m²53.85%10%μ(S4-50m²) = μ(S5-50m²)48.00%<10%
S5-50m²μ(S4-50m²) = μ(S6-50m²)86%<10%
S6-50m²μ(S4-50m²) = μ(S6-50m²)28.93%21%
150 m2S4-150m²53.65%<10%μ(S4-150m²) = μ(S5-150m²)53.65%<10%
S5-150m²
Legend: μ refers to the mean of the distribution of soil loss values measured at a given scale.
Publisher’s Note: MDPI stays neutral with regard to jurisdictional claims in published maps and institutional affiliations.

