Article

Forest Resource Assets Departure Audit Considering Ecological Sustainable Development: A Case Study

1
Key Laboratory of Virtual Geographic Environment of Ministry of Education, School of Geographic Sciences, Nanjing Normal University, Nanjing 210023, China
2
State Key Laboratory Cultivation Base of Geographical Environment Evolution of Jiangsu Province, School of Geographic Sciences, Nanjing Normal University, Nanjing 210023, China
3
Jiangsu Center for Collaborative Innovation in Geographical Information Resource Development and Application, School of Geographic Sciences, Nanjing Normal University, Nanjing 210023, China
4
School of Computer Engineering, Nanjing Institute of Technology, Nanjing 211167, China
5
College of Earth and Environmental Sciences, Lanzhou University, Lanzhou 730000, China
6
Ningbo Bureau of Natural Resources and Planning, Ningbo 315042, China
*
Author to whom correspondence should be addressed.
Land 2022, 11(12), 2156; https://doi.org/10.3390/land11122156
Submission received: 25 October 2022 / Revised: 20 November 2022 / Accepted: 28 November 2022 / Published: 29 November 2022
(This article belongs to the Section Land Environmental and Policy Impact Assessment)

Abstract

:
The Forest Resources Assets Departure Audit (FRADA) is an important measure for the Chinese government to protect and develop forest resources, as well as to promote carbon peaking and carbon neutrality. Explicit audit content and scientific audit method are the basic premises for conducting an accurate audit. In this study, landscape ecology methods were employed to learn the spatiotemporal properties of forest resources, with the support of spatial information technology such as Geography Information System (GIS) and Remote Sensing (RS). A FRADA system from the perspective of landscape pattern index and ecological vulnerability was constructed. A case study was conducted for the evaluation of the proposed FRADA System. Lichuan, a county-level city in Hubei Province, China that is rich in forest resources was selected as the audit sample area, and the tenure period from 2015 to 2019 was regarded as the tenure cycle. The results showed that: (1) Before and after the tenure cycle, the number of patches (NP), patch density (PD) and largest patch index (LPI) of forest landscape showed a downward trend. Meanwhile, the decreased quantity and quality of forest landscapes showed inadequate protection of large forest patches with significant ecological value. In general, it was not beneficial for the sustainable development of forest resources in the view of ecology. (2) The landscape shape index (LSI) and connectivity index (CONNECT) showed an upward trend, which indicates that the shape of the forest landscape is changing in a complex way, and the connectivity has been improved. While, fractal dimension (FD) and fragmentation index (FN) showed a downward trend, indicating that the fragmentation trend of the forest landscape has been alleviated and the forest resources have a continuous and concentrated distribution. (3) The vulnerability of the forest landscape was significantly aggravated. Regarding administrative areas under the jurisdictions of Nanping Township, Jiannan Town and Fobaoshan Development Zone were particularly disturbed, and required special attention. The research results enrich and develop the theories and methods of FRADA and provide suggestions for the sustainable development of forest resources in Lichuan.

1. Introduction

As an essential part of natural resources and an important material basis for economic and social development, forest resources play an irreplaceable role in safeguarding the terrestrial ecosystem and maintaining the ecological balance. In addition, due to the higher cost-effectiveness of forest carbon sinks, forest conservation was regarded as an important strategy to regulate the global carbon balance, slow the rise of greenhouse gases, and mitigate climate change [1,2,3,4,5,6]. China also regards the protection and development of forest resources as an essential measure to achieve the goal of carbon peak and carbon neutrality [7]. In 2017, the Chinese government published an innovative system, the Leading Officials’ Natural Resources Assets Departure Audit (LONRADA) [8,9], trying to implement the tenure responsibility system for the construction of ecological civilization (note: See Abbreviations section for all acronyms and corresponding definitions). This policy aims to promote the development and the use of natural resources scientifically and rationally, including forest resources, and maintain ecological balance during the tenure of officials.
The basic premises of conducting the Forest Resources Assets Departure Audit (FRADA) are the explicit content and scientific method. However, as a new audit is proposed based on Chinese national conditions, the Chinese government only roughly defined the audit content, however, the specific audit content and methods are still lacking. The current theoretical research and practical experience denote subjective human behavior and the objective forest resources state as the audit evaluation content [9,10,11,12,13,14,15]. Both sides have in common that officials exert influence on forest resources and promote changes through specific policies during their tenure. In the study of subjective human behaviors, many researchers have conducted systematic studies based on sorting out relevant laws, regulations, and institutional documents. They concluded that subjective human behaviors could be evaluated based on policy implementation and fund use during those officials’ tenure [12,16]. As for the objective forest resources state, the previous studies are dedicated to monitoring the changes in quantity and quality of forest resources instead of focusing on sustainable development [10,11,17]. If forest management during the term of office will affect the sustainable development of forest resources, however, should be taken into consideration.
Spatiotemporal characteristics are the basic attributes of forest resources. The performance of officials during their tenure will not only arouse intuitive changes in the quantity and quality of forest resources, but also drive the implicit evolution of forest resources in the landscape pattern. For example, the occupation of woodland and wildfires will cause the loss of forest resources in a certain space, but afforestation and other ecological projects will increase forest resources elsewhere. Therefore, although the volume of forest resources increases, significant changes will have occurred in the ecology. Changes in landscape patterns of forest resources will affect population dynamics, biodiversity and ecosystem processes within forests. These specific effects on forest resources will not immediately appear, but they will profoundly impact future sustainable development. Hence, the FRADA should focus on evaluating the impact of officials’ performances during their tenures on the sustainable development of forest resources from the perspective of landscape pattern evolution, particularly regarding the influence on ecological benefits. The scientific evaluation of FRADA could enable a more objective and comprehensive evaluation of officials’ performances during their tenures regarding forest resources protection, development and use of authority.
Landscape ecology emphasizes the ecological pattern and the interaction between ecological process and scale [18]. It mainly studies landscape structure, function and dynamics. Meanwhile, it believes these characteristics are interdependent and interactive [19]. Landscape structure expresses the spatial pattern of landscape elements and the connections between the different ecosystems or landscape elements. Related theories can be applied to assess the relationships and changes among forest ecosystems, including measures, number, size and shape [20,21]. Landscape function involves flows of animals, plants, energy, mineral nutrients and the interactions among these elements. Its theories and methods can be applied to detect specific changes in forest landscapes in terms of fragmentation or connectivity and to evaluate the potential impact of such changes on sustainability [20]. At the same time, the factors driving landscape change are multiple, including socioeconomic, political, technological, natural and cultural forces [22,23,24].
In China, politics are the main driver of change in forest resources within an administrative region during the governance cycle. Accordingly, this paper introduces the theories and methods of landscape ecology to conduct the scientific FRADA and enrich the theoretical results in this field. With the support of spatial information technology, this study conducted a FRADA evaluation method from the perspective of ecological sustainability. Specifically, we provided a way to assess the evolution of forest resources in landscape structure and function in the audit area, which can assist other traditional audit methods in identifying the reasonableness of officials’ decisions before and after their tenure. On the one hand, the evaluation results are used as an important basis for officials’ tenure appraisal, rewards and punishments, as well as to promote the officials’ tenure to improve the importance and scientific understanding of forest resource protection [25]. On the other hand, it provides timely identification of possible threats to the sustainable development of forest resources in the audited region, as well as strategies for future management. Meanwhile, an audit sample area with rich forest resources was selected in China, and an empirical study was carried out by applying GF-1 satellite data.

2. Material and Methods

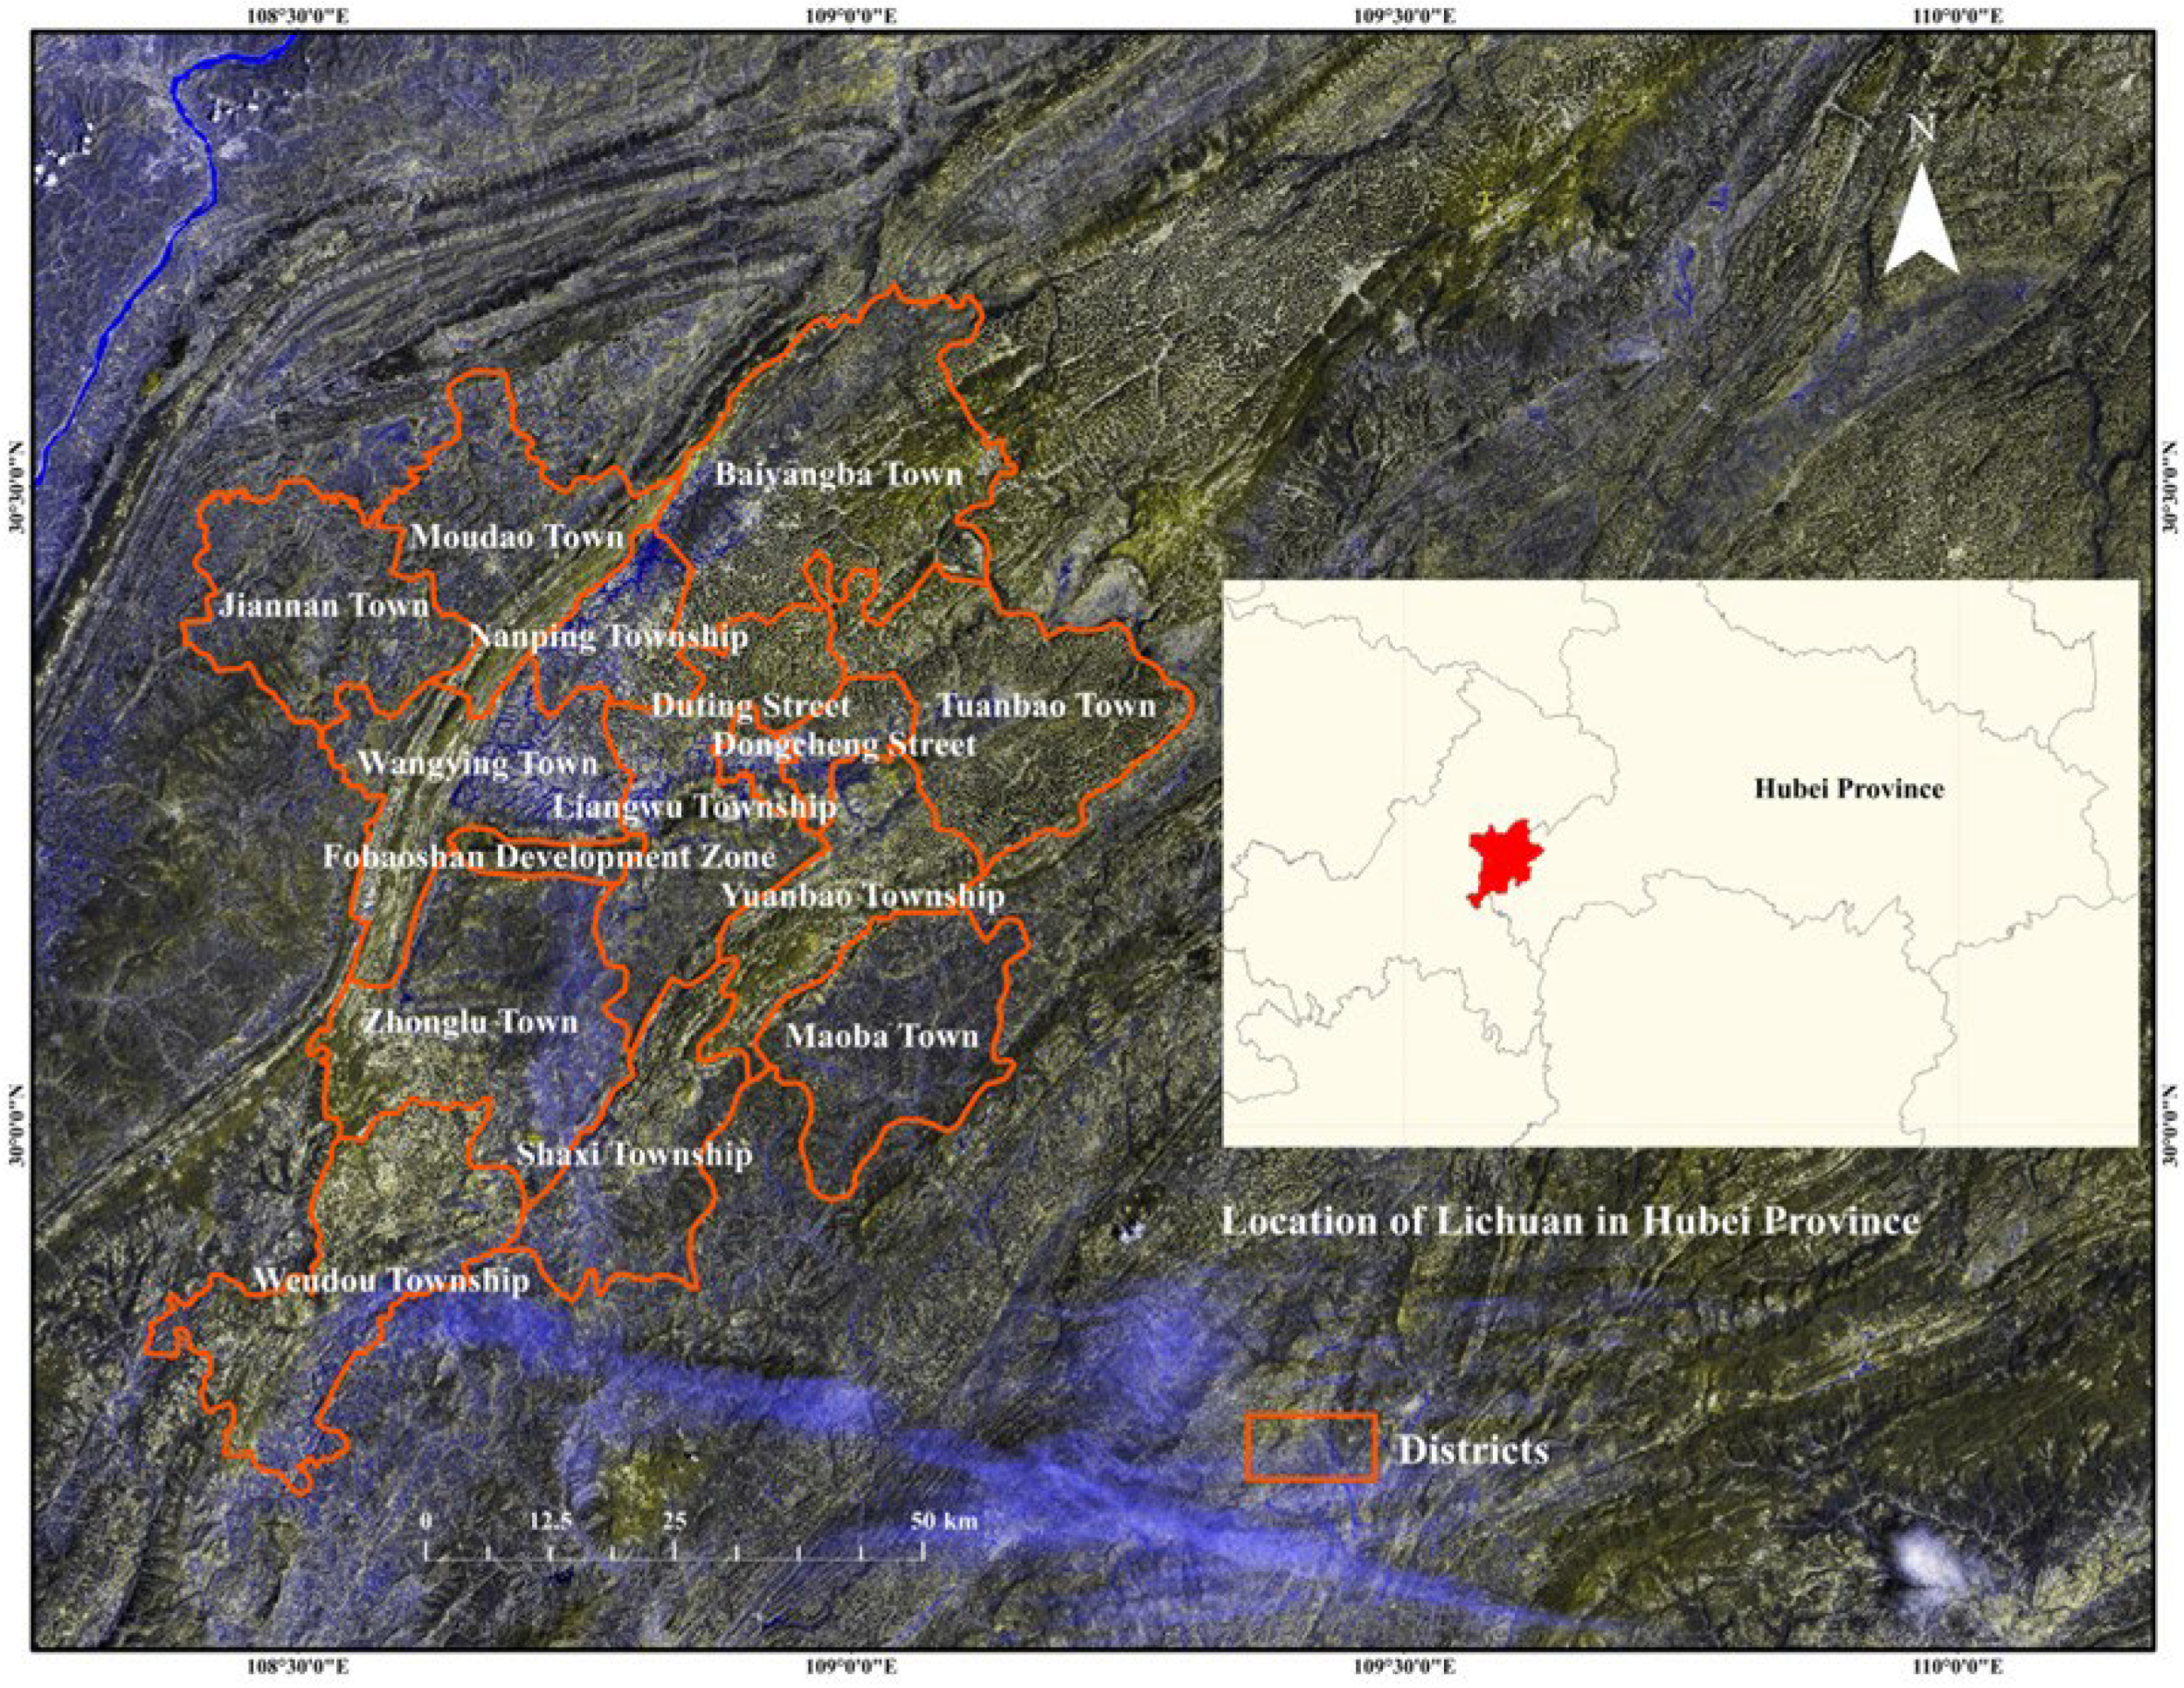
2.1. Overview of Sample
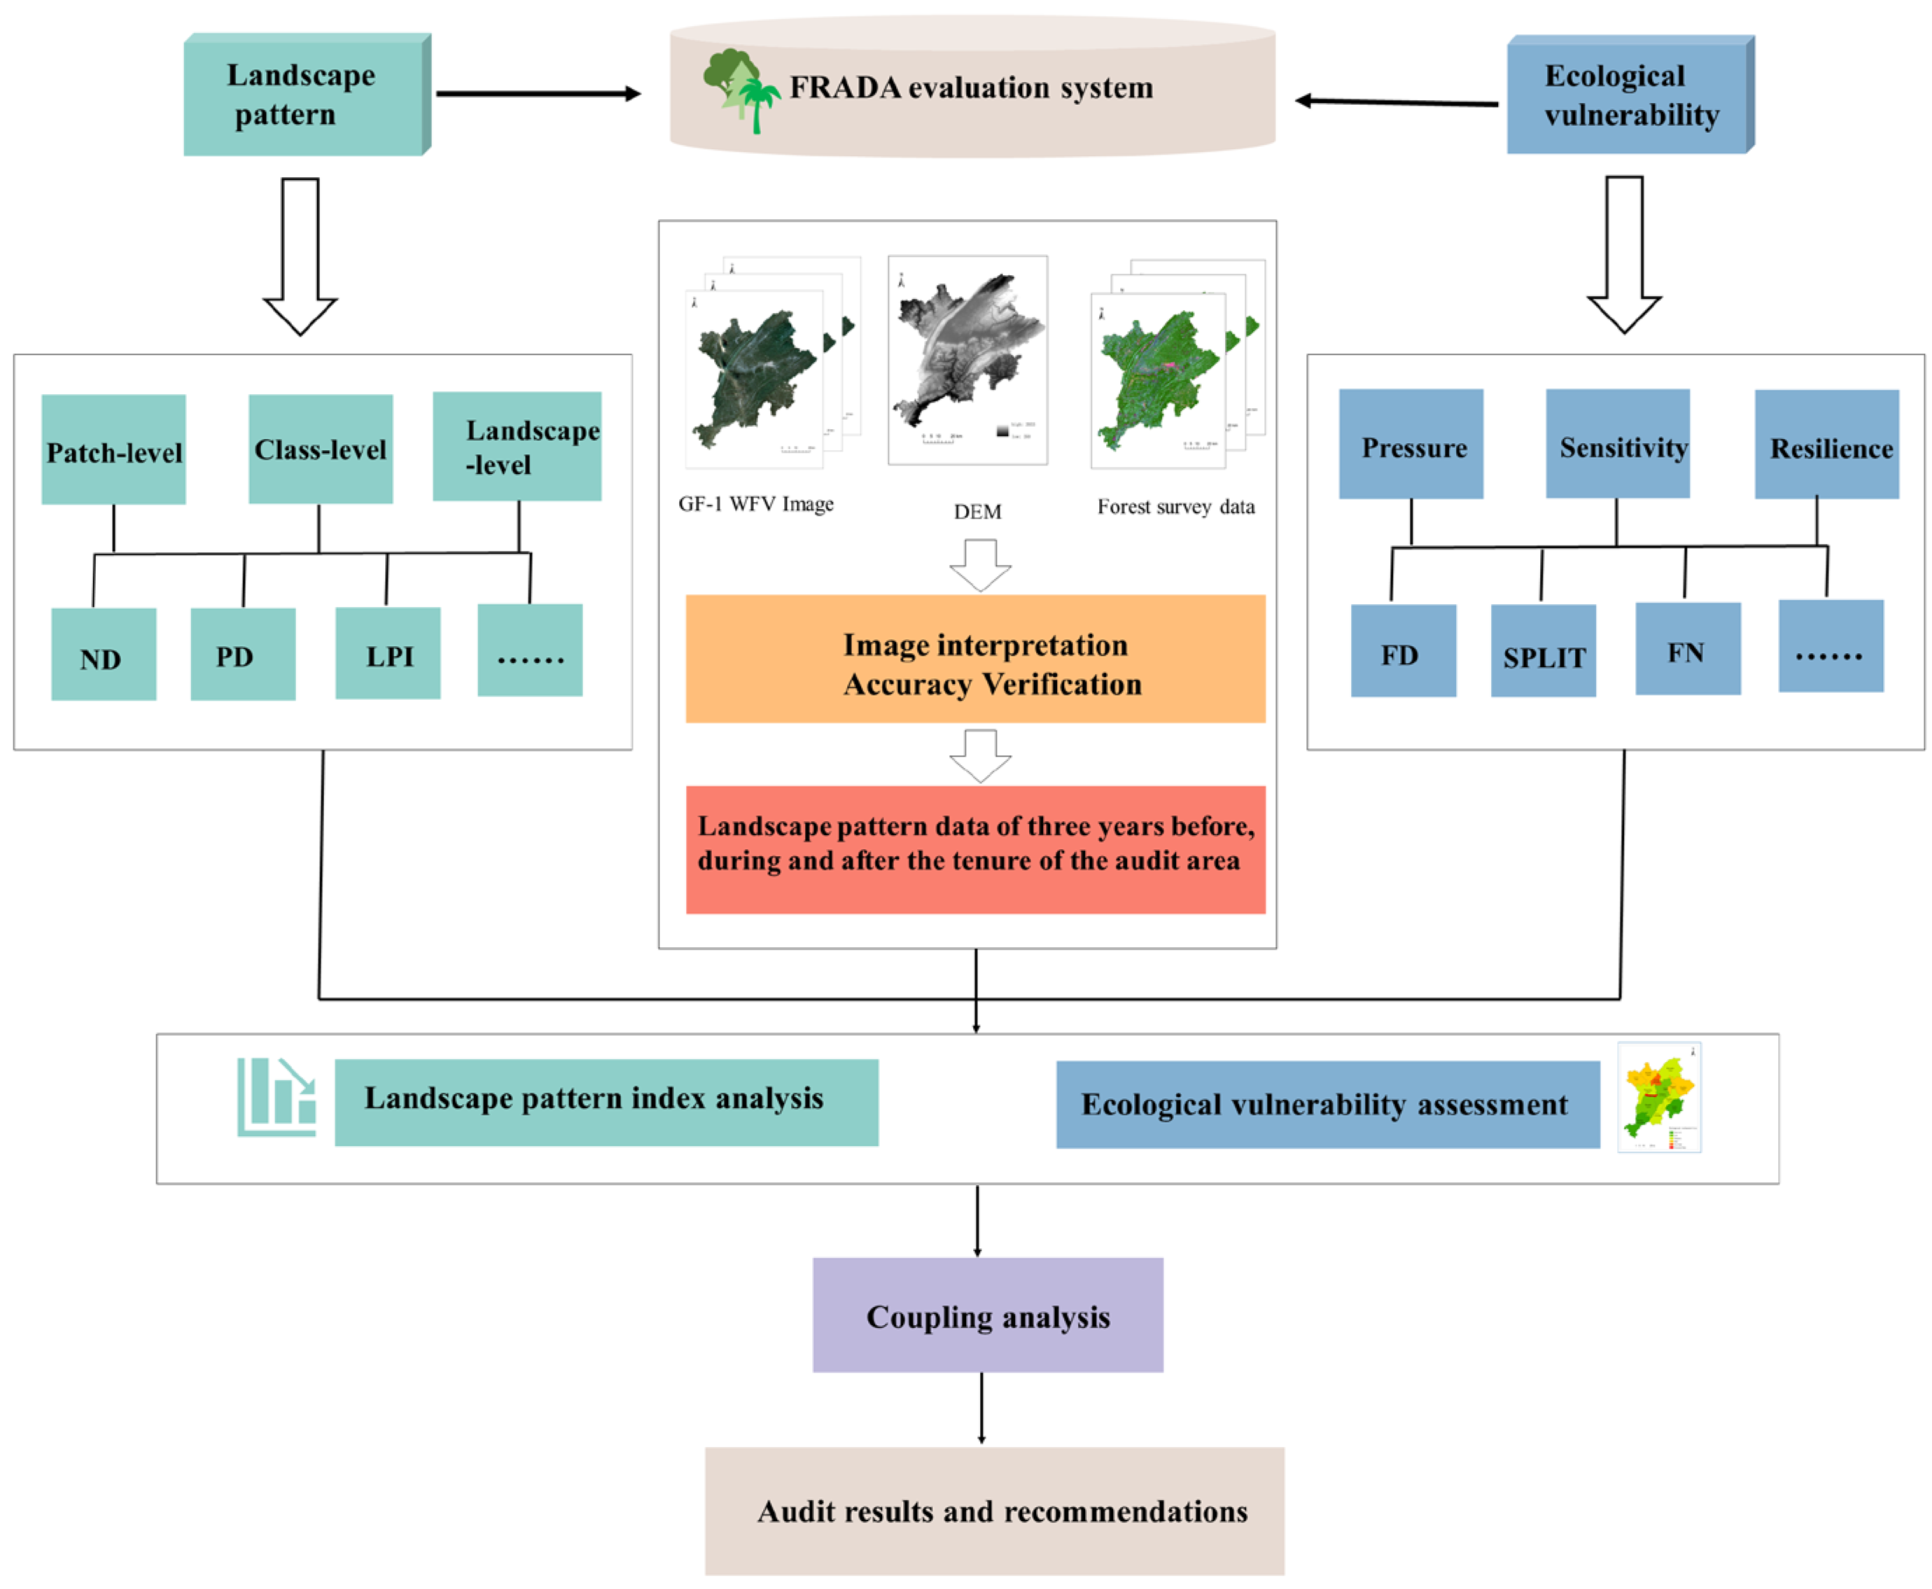
Lichuan is the largest county-level city in Enshi Tujia and Miao Autonomous Prefecture of Hubei Province, spanning 29°42′–30°39′ N latitude and 108°21′–109°18′ E longitude. There are 2 streets, 7 towns, 5 townships and 1 ecological comprehensive development zone, comprising a total area of 4606 km2 (Figure 1). In addition, Lichuan has rich forest resources, with 200 families, 843 genera and 2033 species of vascular plants, among which, there are 4 types of national-level protected tree species and 19 types of second-level protected tree species. Furthermore, it is also the birthplace of a rare and relic species of Metasequoia trees, and the Xingdou Mountain, a national-level nature reserve, is located in this territory. The forest coverage of Lichuan is 68.4%. However, with the rapid economic and social development in recent years, the landscape pattern of forest resources in Lichuan has experienced a significant change, which is exemplary for the implementation of FRADA. Otherwise, Lichuan is located in the extension zone of the Yunnan–Guizhou Plateau, with an elevation range of 315–2041.5 m, accompanied by the geographical characteristics of complex terrain, remarkable mountain climate and high average precipitation (the average annual precipitation is 1304 mm) [26,27]. Due to the difficulty in obtaining high-quality remote sensing images, it could be applied to verify the scientific nature and feasibility of the FRADA.

2.2. Methods

(1) This study needed at least three years of forest landscape data before, during and after the tenure cycle to comprehensively reflect the evolution of forest landscape patterns and strengthen the evaluation process. The term cycle for local officials in China is relatively stable, generally 5 years, with shorter terms of about 3 years, and there are also cases of re-election for terms of up to 8–10 years. In this paper, we took the typical tenure cycle of Chinese officials as an example (5 years, 2015–2019). They chose high-resolution remote sensing images about three years before, during and after the tenure cycle. Combined with DEM data, Forest Resources Type II Survey Data and One Map of the Land, the landscape pattern data of the audit area were obtained through remote sensing image pre-processing, image interpretation and accuracy verification. Meanwhile, spatial information technologies, such as RS and GIS, were applied in this part.
(2) Based on the theories and principles of geography, landscape ecology and other disciplines, an audit evaluation system for forest resource assets focusing on ecological sustainability was constructed from landscape pattern index evaluation and ecological vulnerability evaluation after fully considering audit needs and the availability of data.
(3) Researchers could conduct the forest resources evaluation in the audit area before and after the term of the landscape pattern of evolution by accounting both before and after the term of the landscape pattern and ecological vulnerability index in the audit area, and combining the theory of landscape ecology (Figure 2). The landscape pattern index and ecological vulnerability represent the changes in landscape structure and function. By coupling and analyzing the changes in landscape structure and landscape function with socio-economic development, researchers could evaluate the scientific nature of officials’ performances during their tenures and the potential impacts on the future sustainable development of forest resources. Otherwise, it could also provide suggestions for protecting, developing and utilizing forest resources in the audit area.

2.2.1. Extraction of Forest Landscape Elements

GF-1 WFV remote sensing images of Lichuan in 2014, 2017 and 2020 were selected. Due to the effect of remote sensing identification of forest vegetation such as deciduous trees, these images were concentrated from May–October (http://www.cresda.com/CN/, accessed on 22 February 2021). The states of forest vegetation were basically the same, and the images were clear. The relevant technical indicators are shown in Table 1. (See Table 1). Firstly, ENVI5.3 was applied to complete the radiometric calibration, atmospheric correction, ortho-rectification and a series of pre-processing works. The calibration was conducted according to the parameters of radiometric calibration released by the China Resources Satellite Application Centre (http://www.cresda.com/CN/, accessed on 22 February 2021). Meanwhile, the atmospheric correction was completed by the atmospheric correction module ENVI 5.3. Ortho-rectification was carried out using DEM data with ASTER GDEM 30 m spatial resolution (http://www.gscloud.cn/, accessed on 22 February 2021). Then, according to the distribution of land types in the audit area, combined with the land use map and forest survey data, the audit sample was divided into four types: forest, farmland, waters and construction land, and the training samples were selected from remote sensing images. Finally, according to the established land type interpretation sign, the remote sensing images of the audit area were interpreted and classified by the human–computer interaction interpretation (Figure 3). The results were corrected to remove some wrong image spots. The accuracy of the classification interpretation is above 80%, as shown in Figure 3.

2.2.2. Construction of Audit Evaluation System

The Determination of Landscape Pattern Index

The landscape pattern index can reflect landscape pattern information and the relationship between its structure and composition, which is the fundamental description of landscape dynamics. The landscape pattern index could reflect the structural composition and spatial configuration of landscape patterns through the highly summarized landscape pattern information. Meanwhile, the quantitative analysis could reveal the relationship between landscape structure and function, which is the basic way to describe landscape dynamics [28,29,30,31]. The landscape pattern index is divided into patch level index, patch type level index and landscape level index. The patch level index has little explanatory value for understanding the overall landscape structure, but it is the basis for analyzing the patch type index and landscape level index. In recent years, the research of landscape pattern index has developed rapidly, and it has been widely applied in ecological assessment, development assessment, etc. [32]. This paper aimed to evaluate the sustainable development of forest resources in the audit area before and after the tenure by conducting quantitative research on the evolution characteristics of forest landscape patterns in the audit area. Thus, it selected six indexes from three scales of patch level, patch type level and landscape level, including the number of patches (NP), patch density (PD), largest patch index (LPI), landscape shape index (LSI), connectivity index (CONNECT), fractal dimension (FD) and fragmentation index (FN). The computational method and basic meaning of the above landscape pattern index are shown in Table 2.

Construction of Ecological Vulnerability Assessment Model

When applying the landscape pattern index to describe the evolution of landscape patterns, the ecological meanings of some landscape indices are unclear or contradictory. In addition, many landscape indices are not independent of each other. It is less persuasive to describe the evolution of landscape patterns with a set of landscape indices [32,33]. The ecological vulnerability assessment based on landscape pattern changes could effectively evaluate the development trend of specific ecosystems in a region, which is of great guiding significance for the scientific evaluation of the environmental protection development in the corresponding region. Furthermore, it can be beneficial for the rational formulation of future development and protection policies [34,35,36]. This is highly consistent with the need for ecological sustainability assessment to audit forest resource assets. Based on the existing research results, as well as the specific needs and data availability of forest resource asset audits, researchers introduced the P-S-R vulnerability evaluation model (Table 3) by choosing a set of higher suitability landscape indices to carry out the audit evaluation of forest resources assets.
Based on the existing research results of the landscape ecological vulnerability index evaluation model [36,37,38,39,40], researchers constructed the ecological vulnerability as a function of ecological Pressure, ecological Sensitivity and ecological Resilience. According to the research, ecological vulnerability increases with the increase of ecological pressure and sensitivity and decreases with the increase of ecological resilience [7]. The evaluation model is as follows,
EVI i = P i S i / R i
In the formula, the computational formula of Pi, Si, and Ri is:
f x = j = 1 n X j W j
In the formula, Xj is the normalized value of each parameter, and Wj is the parameter weight determined by the Entropy Weight Method (EWM).
The EWM developed by Shannon [40] was applied to estimate the Ecological Vulnerability Index, including the relevance of each ecological vulnerability-related indicator for each of the three aspects (Pressure, Sensitivity and Resilience), as well as the weight of each indicator in the overall system. As an unbiased weighting method, it is expressed in three steps (standardize the original indicator value, define the entropy and define the weight of entropy) to determine the weight of indicators. According to the information they provided, it could avoid the negative influences of subjective factors and obtain more applicable findings. In this study, we calculated the weights of different indicators and the trends of the ecological vulnerability index (EVI) in Lichuan; the specific processes are as follows:
i.
Parameter normalization. In this paper, the normalization of the calculated parameters is carried out using the deviation normalization method. The formulae for the calculation of positive indicators are shown in (3) and the formulae for the calculation of negative indicators are shown in (4).
X ij = X X min X max X min
X ij = X max X X max X min
where, X ij represents the result of normalization, X refers to the current value, X min refers to the minimum value of the list and X max refers to the maximum value of the list.
ii.
Entropy definition. The specific calculation steps are as follows:
In the first step, the weight of landscape type i in the value of the jth indicator, fij, is calculated.
f ij = X ij i = 1 m X ij
In the second step, calculate the information entropy hj.
h i = k i = 1 m f ij ln f ij
iii.
Defining the weight of entropy. The specific calculation steps are as follows:
W j = 1 h i j = 1 n 1 e j
where, Wj represents the weights, k = 1 ln m .
(1)
Ecological pressure
The ecological pressure refers to the external ecological pressure in the process of forest ecosystem function, which is manifested as the degree of external natural or artificial interference. FD and SPLIT were selected as measures in this paper:
The formula of FD,
FD = 2 log p 4 log 2 A
In the formula, A is the total area of the patch; p is the perimeter of the patch. FD reflects the complexity and spatial stability of landscape shape. Generally speaking, the greater the external inference, the smaller the FD.
The formula of SPLIT,
SPLIT = A 2 j = 1 n a j 2
In the formula, A represents the total area of the land type; aj is the area of landscape patch j; n is the total number of patches of the land type. SPLIT has a close and complex relationship with external interference. Generally speaking, the stronger the interference activity, the larger the SPLIT [41,42].
(2)
Ecological sensitivity
Ecological sensitivity means the sensitivity of the ecosystem to external disturbances, which is also a parameter applied to characterize the difficulty and possibility of ecological problems. FN and Topographic Index (TI) were chosen to measure sensitivity in this paper:
The formula of FN,
FN = N i 1 A i
In the formula, Ni is the number of patches in landscape i; Ai is the total area of landscape i. Land fragmentation is applied to measure landscape patterns changing from continuous structure to patch. Generally speaking, the higher the landscape fragmentation, the worse the anti-interference ability and the higher the ecological sensitivity [37].
The formula of TI,
TI = j = 1 n A ij W j A i
In the formula, n is the number of slope grades; Aij is the area of landscape i at the jth slope; Wj is the weight of the jth slope; Ai is the total area of landscape i. Topography will directly affect the vulnerability of the ecosystem. Generally speaking, the steeper the terrain slope, the weaker the anti-interference ability and the higher the ecological sensitivity. Based on the geomorphological characteristics and vegetation distribution of the audit area, the slope of the audit area was divided into four slope levels: gentle slope, relatively gentle slope, relatively steep slope and steep slope, according to <5°, 5−20°, 20−40°, and >40°, with the values of 0.1, 0.3, 0.5 and 0.9.
(3)
Ecological resilience
Ecological resilience means the ability of an ecosystem to return to or close to its original state. It describes a kind of structural stability in the ecosystem. The CONNECT and LPI were applied to measure the ecological resilience in this paper,
The formula of CONNECT,
CONNECT = i = 1 m j = k n c ijk j = 1 m n i n i 1 2 100
In the formula, cijk is the connection status of patch j and k related to patch type i; m is the sum of landscape types; n is the sum of the landscape type i. Generally speaking, the greater the connectivity index, the higher the connectivity of the ecosystem and the stronger the ecological resilience of the landscape.
The formula of LPI:
LPI = max a i a n A 100
In Formula (8), max a i a n is the area of the largest patch in the landscape; A is the total area of the landscape; The value range is 0 LPI 100 . The maximum patch index shows the proportion of the largest patch occupying the whole landscape area in a certain landscape type. Generally speaking, the larger LPI, the more stable the ecosystem structure and the stronger the ecological resilience of the landscape.

3. Results and Analysis

3.1. Analysis of Landscape Pattern Index

The comprehensive application of ArcGIS10.2 and Fragstat 4.2 software was applied to calculate and extract the landscape pattern index of the audit area in 2014, 2017 and 2020. The results are shown in Table 4.

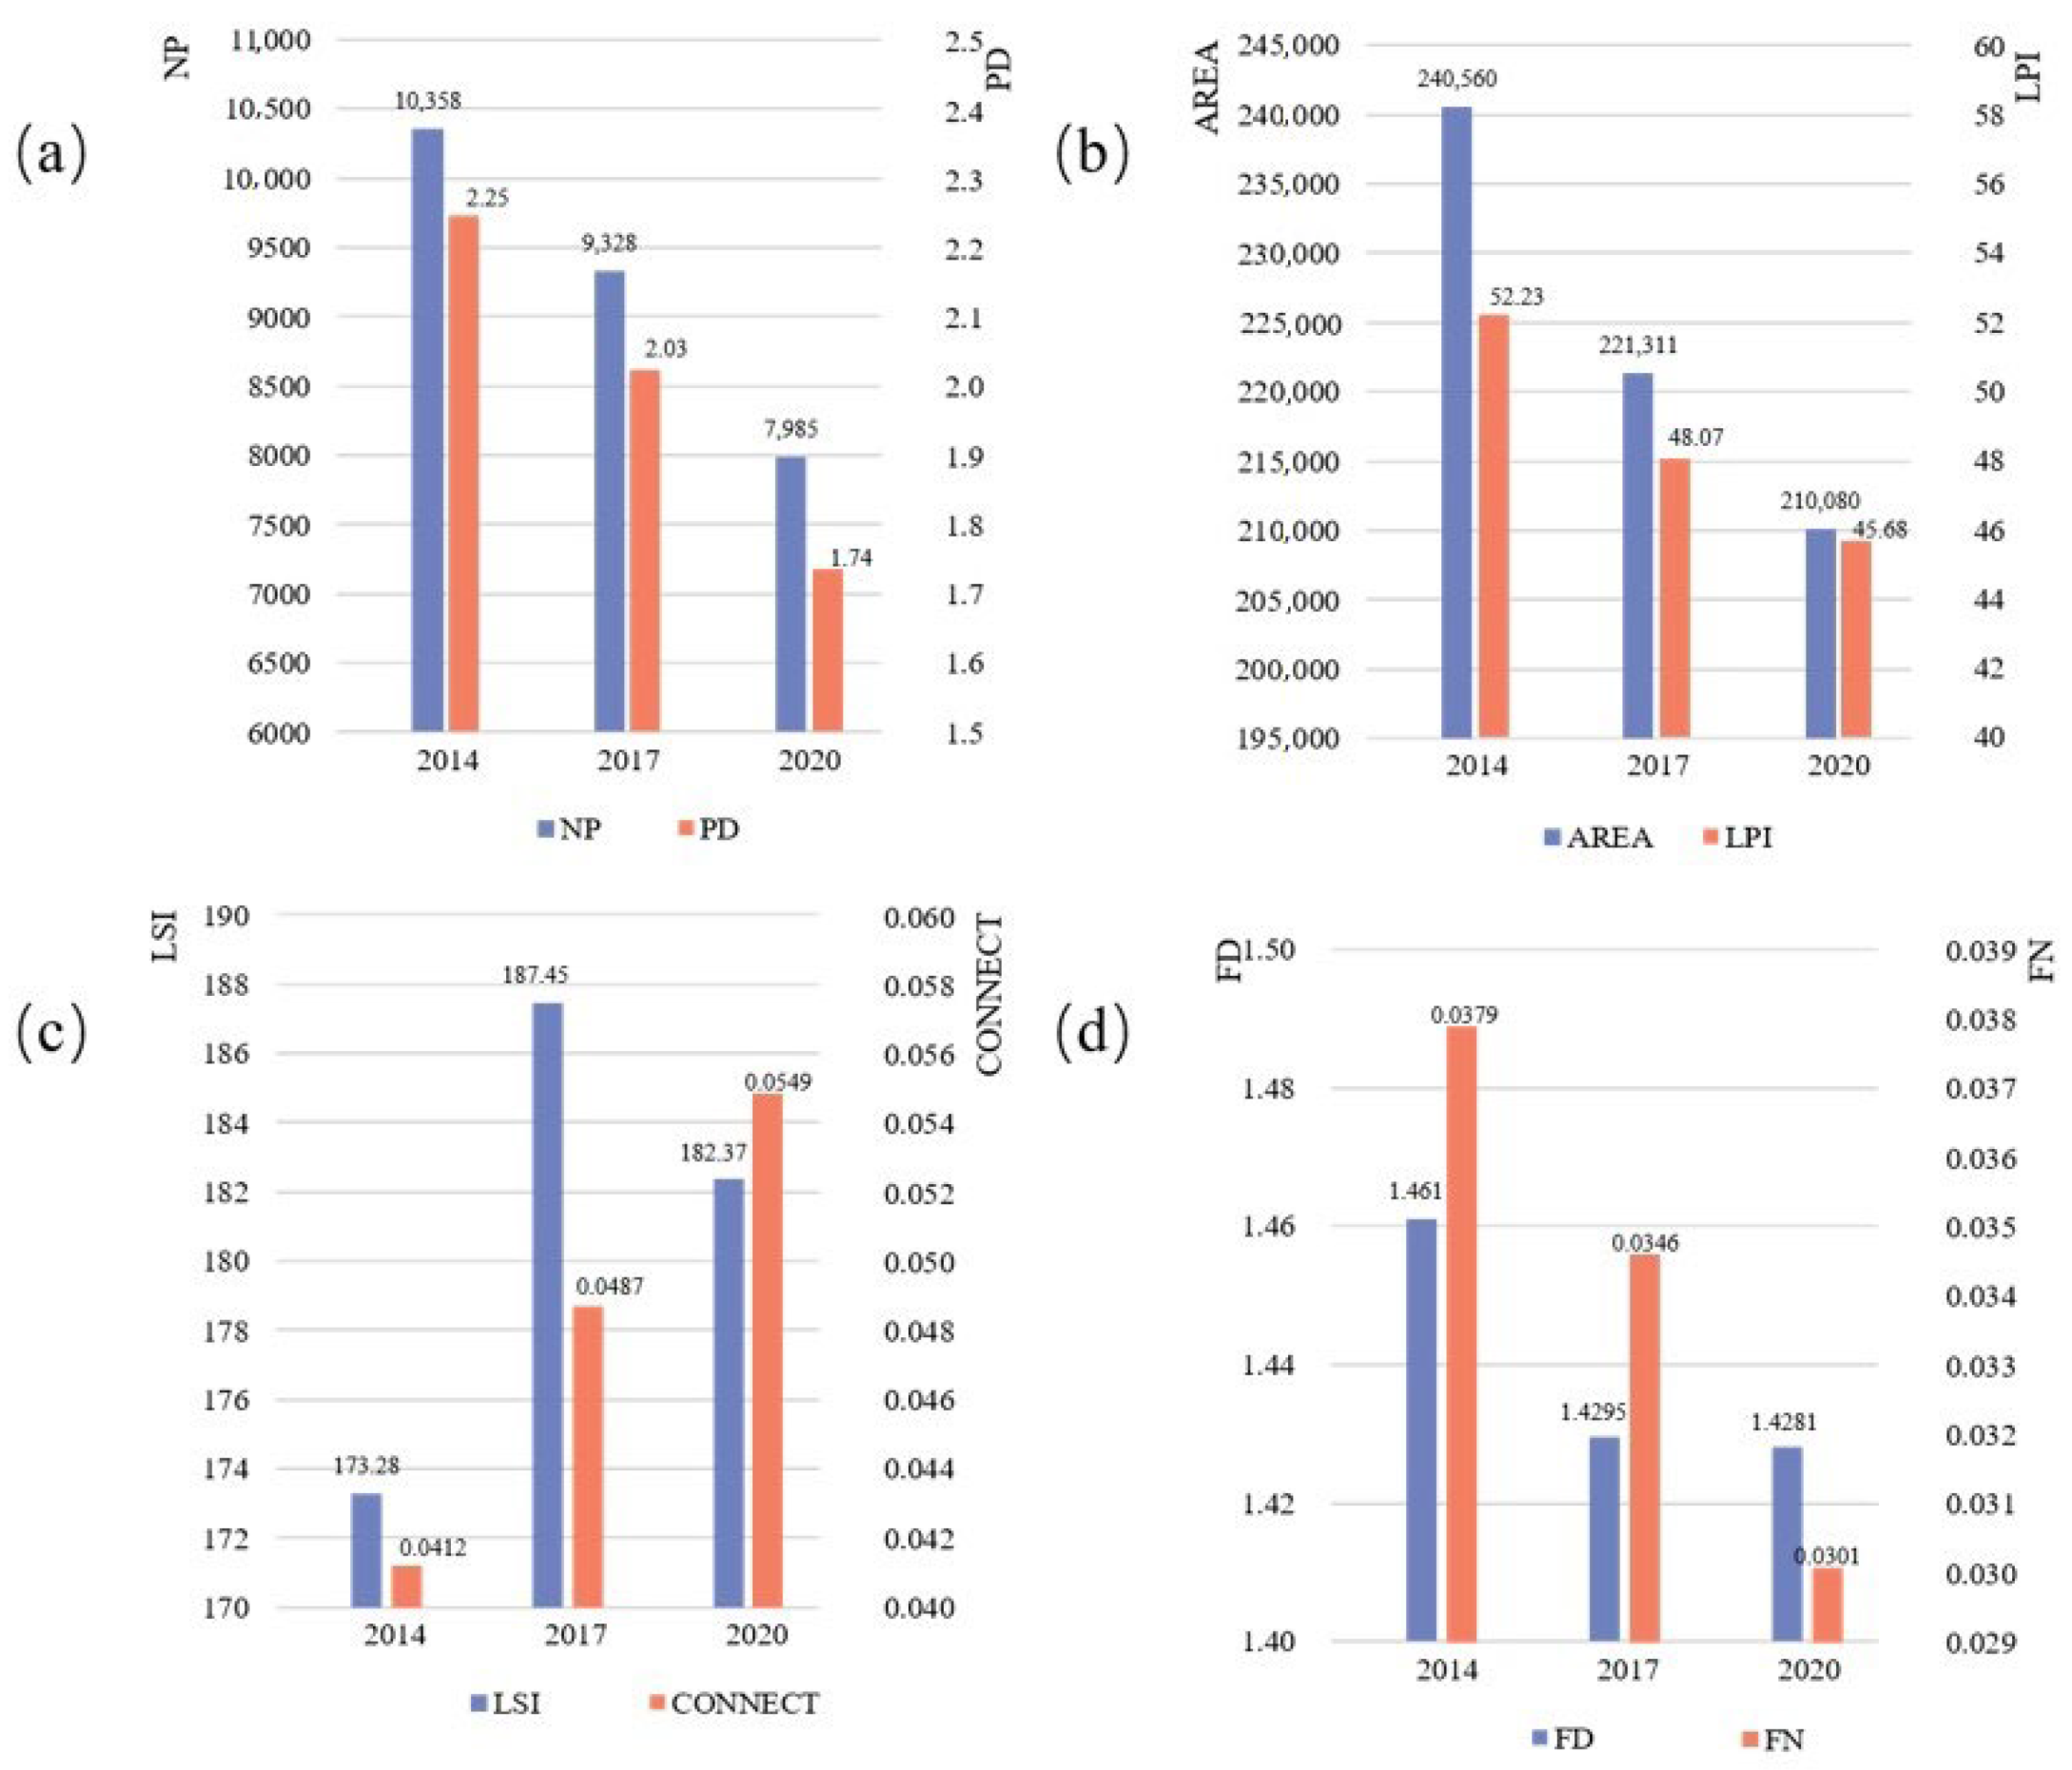
3.1.1. Analysis of NP and PD

According to Figure 4a, the NP of forest landscape in Lichuan were 1035, 9328 and 7985 in 2014, 2017 and 2020; PD were 2.2491, 2.0259 and 1.7361. NP and PD showed a downward trend. In terms of NP, it dropped 9.94% year-over-year in the first half of the term and 15.36% year-over-year in the second half, showing a gradual decline throughout the term. In terms of PD, the decline in the first half of the term was 1.92% year-over-year; in the second half, it was 14.30% year-over-year. The decline in the second half of the term is more intense, and the local government should pay more attention.

3.1.2. Analysis of LPI

According to Figure 4b, the LPI of forest landscape in Lichuan were 52.234, 48.0663 and 45.675 in 2014, 2017 and 2020, and the maximum patch area was 240,560.5, 221,310.6 and 210,079.8 hectares, showing a downward trend on the whole. The maximum patch area decreased by 8% year-over-year in the first half of the term and 5% year-over-year in the second half of the term, which was more seriously disturbed by external interference. Usually, the internal species diversity of the forest ecological system has a positive correlation with the size of the patch area. The large landscape patch could protect the groundwater and lake water quality inside the forest ecosystem, such as the survival of sensitive species and a good habitat for large wild animals, which could have a strong cushion in the extinction process [19,31,43,44]. Therefore, it is of great ecological significance to protect and gradually expand the maximum patch area of the forest landscape, which is of great significance to the sustainable development of forest resources.
In conclusion, the evolution of forest landscape LPI in the audit area is not conducive to sustainable development in the view of ecology. Although the adverse situation shows a moderate trend, the local government must pay special attention.

3.1.3. Analysis of LSI and Connect

According to Figure 4c, the LSI of forest landscape in Lichuan were 173.2846, 187.4525 and 182.3716 in 2014, 2017 and 2020. The LSI increased in the first half of the term and decreased in the second half of the term. The overall trend was increasing during the term, indicating that the more complex the landscape shape, the smaller the range of decline. It showed that the forest landscape was stable. The CONNECT of the three periods were 0.0412, 0.0487 and 0.0549. The connectivity was higher and showed an upward trend, indicating that the forest landscape ecosystem was generally stable and the distribution of forest resources was contiguously concentrated during the tenure. Generally speaking, the larger the LSI and CONNECT, the more ecological exchange could be promoted among forest patches and the surrounding environment, which is beneficial for the sustainable development of forest resources to a certain extent.
In conclusion, the shape and connectivity of the forest landscape in the audit area had a good development trend, which played a certain role in promoting sustainable development in the vision of ecology.

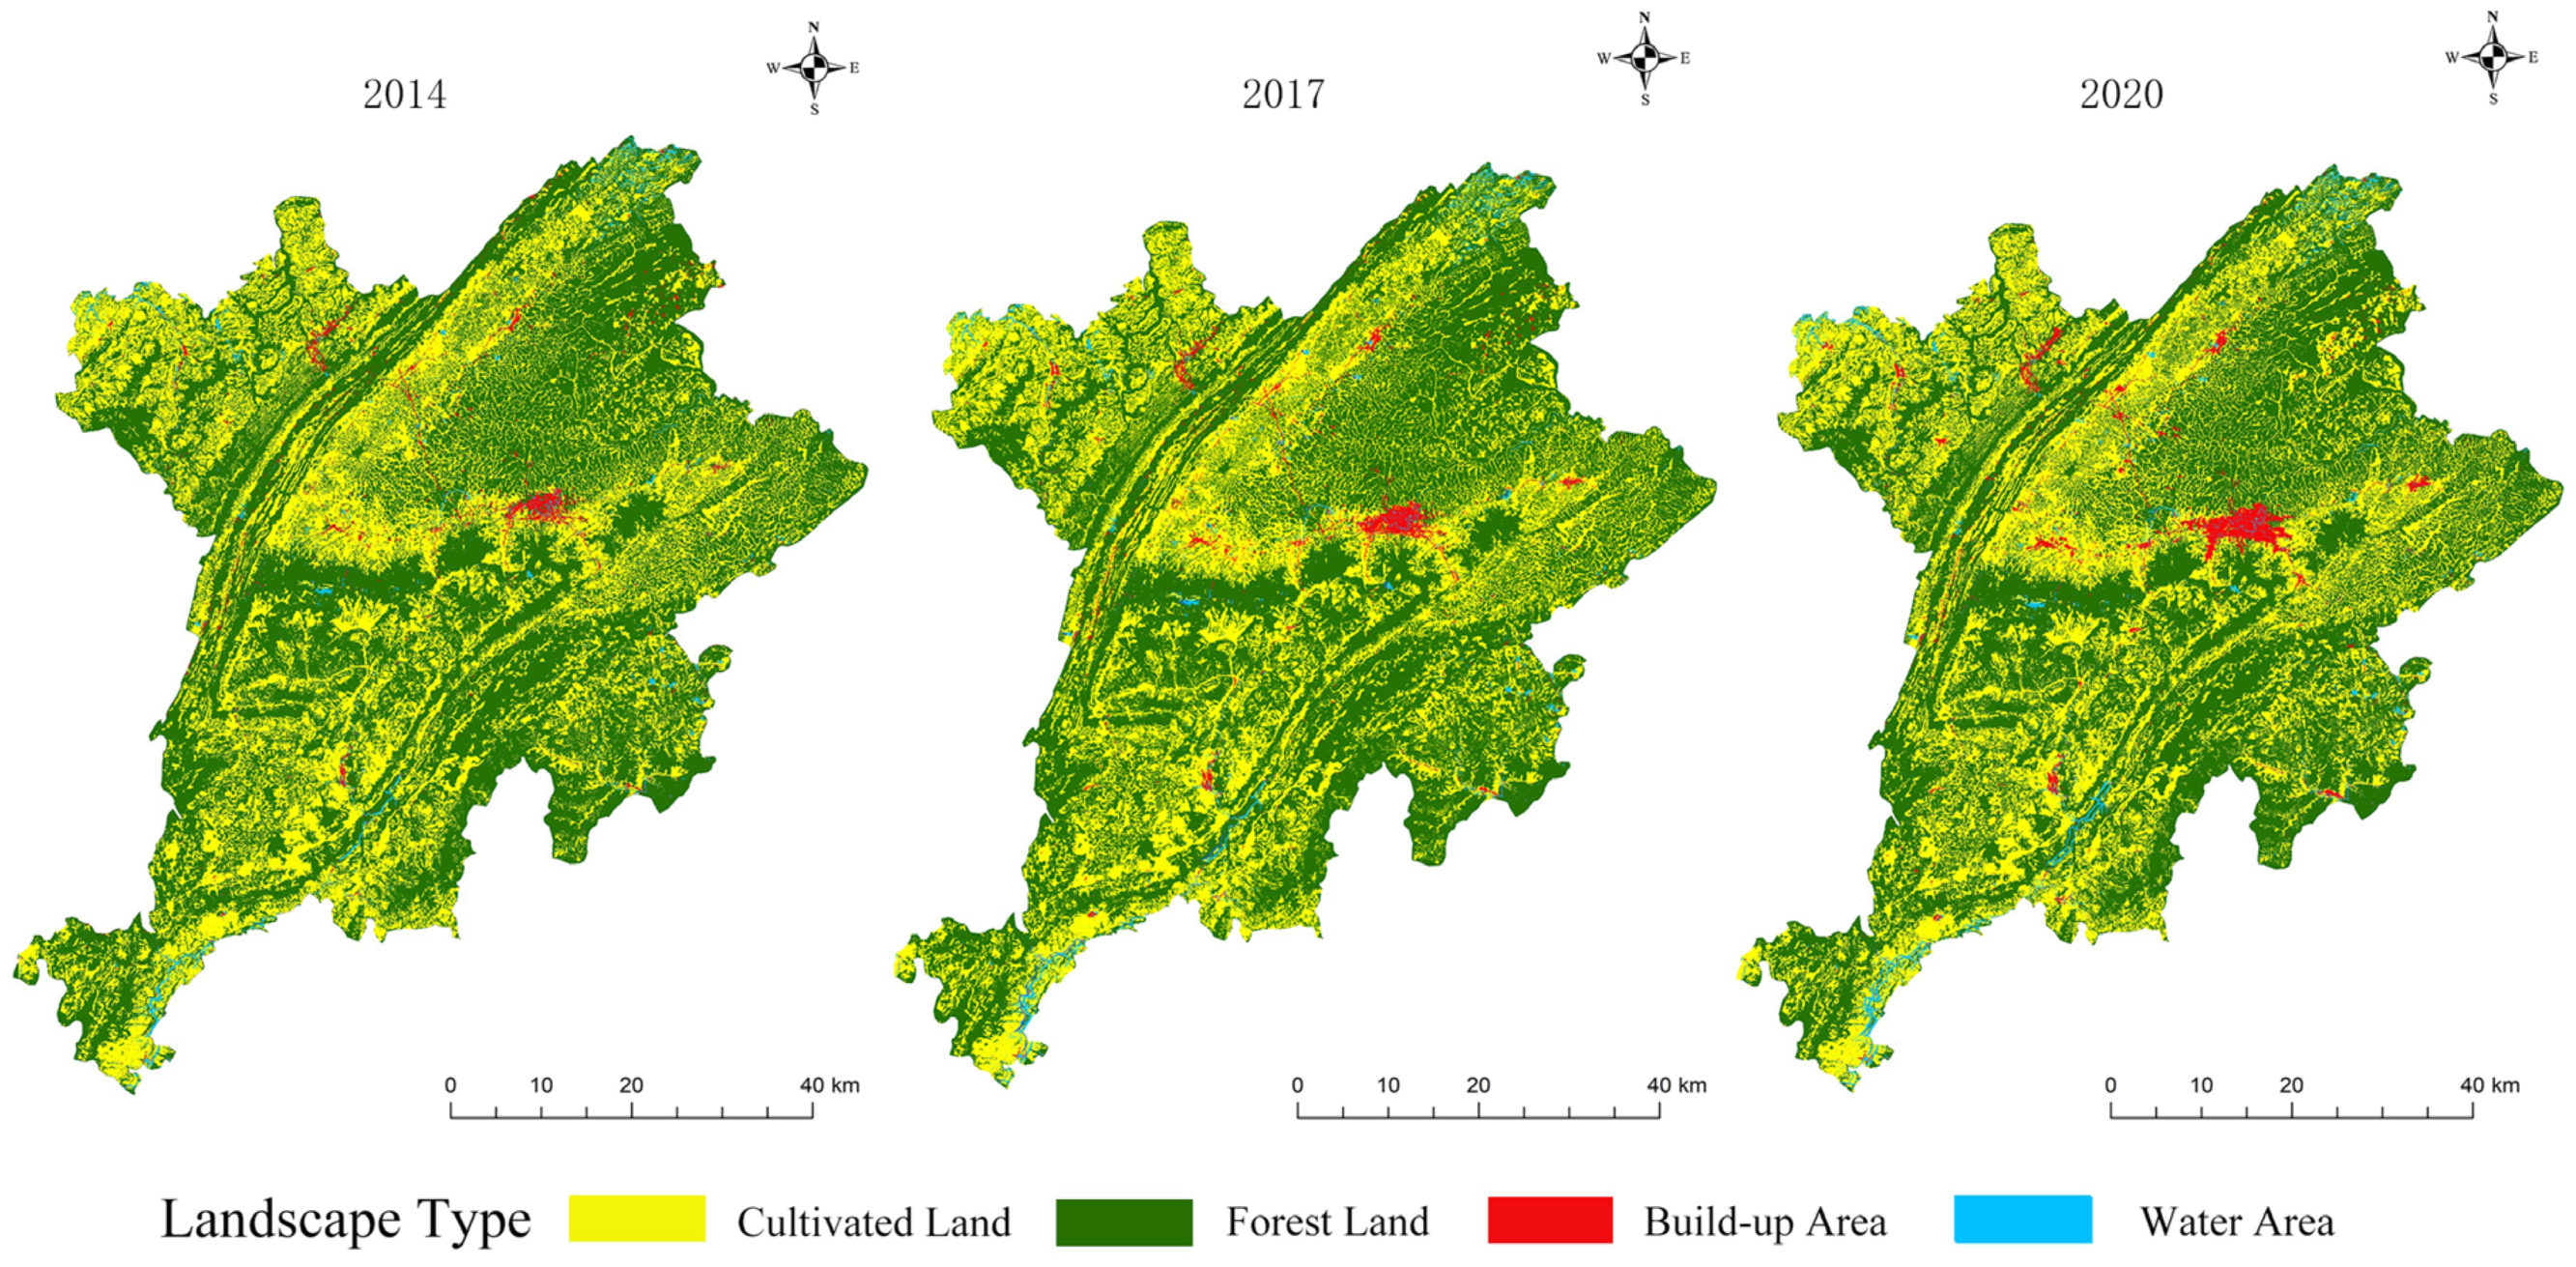
3.1.4. Analysis of Forest Landscape Pattern Evolution Based on the Landscape Level

According to Figure 4d, the FD of forest landscape in Lichuan were 1.4611, 1.4295 and 1.4281 in 2014, 2017 and 2020, showing a downward trend, which indicates that the forest landscape was less and less disturbed by external interference. The FN in the three periods were 0.0379, 0.0346 and 0.0301, showing a downward trend. The obvious trend means that the decrease in forest landscape fragmentation and ecosystem service functions were further played. The smaller the disturbance of forest resources at the landscape level, the more beneficial for ecological stability. The more continuous and balanced the spatial distribution, the more beneficial for developing ecological services and maintaining biodiversity.
Therefore, the FD and FN of forest resources have a good development trend, which could promote the sustainable development of forest resources in ecology.

3.2. Ecological Vulnerability Assessment

3.2.1. The Weight

According to the primary method and idea of entropy weight to determine the weight, we conducted a comprehensive analysis of the basic parameters in 2014, 2017 and 2020 by calculating the weight values of each parameter in the ecological vulnerability assessment model (Table 5). From the results, the weights of each calculated parameter are relatively close, with CONNECT having the highest weight and FD having the lowest weight.

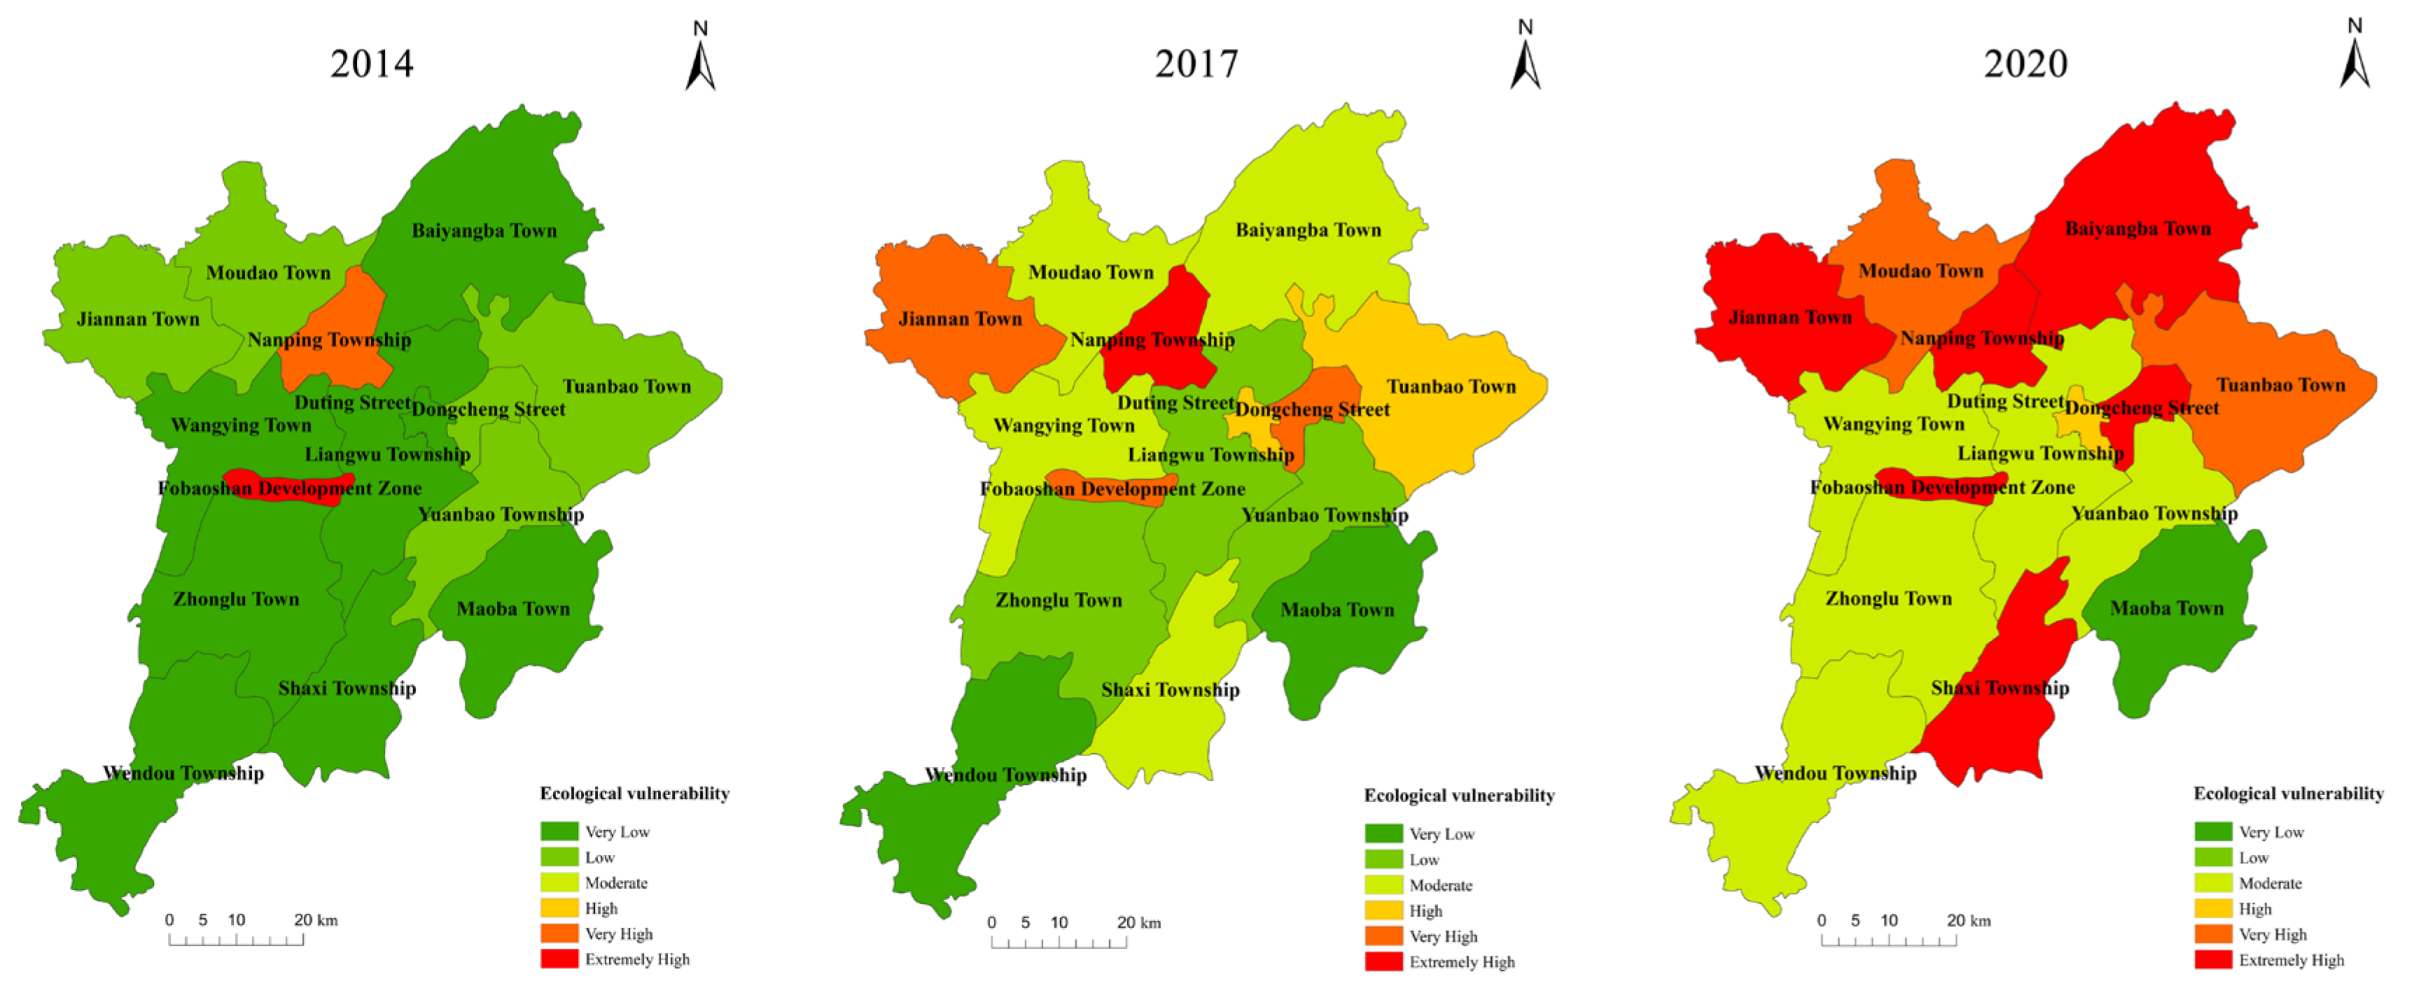
3.2.2. Vulnerability Assessment

According to Formulas (1) and (2), the EVI of forest landscape in 2014, 2017 and 2020 were calculated (Table 6). The vulnerability of the forest landscape in the audit area showed a tendency to become more serious, which was obvious in the first half of the term and was alleviated in the second half.
Followed by the same method and steps, the EVI of forest landscape in 15 administrative regions under the audit area in 2014, 2017 and 2020 were calculated (Table 7). Through comparative analysis of each administrative region (Figure 5), the EVI of forest landscape in the audit region in 2014 could be ranked from low to high, as follows: Maoba Town, Wendou Township, Liangwu Township, Duting Street, Zonglu Town, Wangying Town, Shaxi Township, Baiyangba Town, Yuanbao Township, Moudao Town, Dongcheng Street, Tuanbao Town, Jiannan Town, Nanping Township, Fobaoshan Development Zone. In 2017, Wendou Township, Maoba Town, Zonglu Town, Liangwu Township, Yuanbao Township, Wangying Town, Moudao Town, Shaxi Township, Baiyangba Town, Tuanbao Town, Duting Street, Dongcheng Street, Fobaoshan Development Zone, Jiannan Town, and Nanping Township; In 2020, the sequence was Maoba Town, Yuanbao Township, Liangwu Township, Zonglu Town, Wendou Township, Wangying Town, Duting Street, Tuanbao Town, Moudao Town, Baiyangba Town, Shaxi Township, Dongcheng Street, Jiannan Town, Nanping Township, Fobaoshan Development Zone. Before and after the term of office, the EVI of Maoba Town, Wendou Township, Liangwu Township, Zonglu Town and other four administrative regions were lower, less disturbed, and caused less resistance to the sustainable development of forest resources. Nanping Township, Jiannan Town, Fobaoshan Development Zone and the other three regions are strongly disturbed by the outside world. Local government should pay more attention to the disturbance during the term that is not beneficial for the sustainable development of forest resources.

4. Findings

According to the study, the NP and PD of forest landscape in the audit area showed a downward trend, the area of forest landscape also decreased yearly and the increase of the EVI of forest landscape was significant. This phenomenon showed that external interference resulted in a serious decrease of the quantity and quality of the forest landscape, which is likely related to the rapid economic development of the audit area in recent years. In particular, the Lichuan has been built into a summer resort that relies on the advantaged climate. With the rapid development of the real estate industry and tourism infrastructure, the vulnerability of forest resources has intensified to a certain extent. According to FRADA, this is cause for alarm. It shows that the scientific and rational nature of the relevant officials’ decisions related to natural resource protection during this tenure cycle needs attention, especially for some of the townships that have a large negative impact on the sustainability of forest resource assets. It should also be conducted systematically in conjunction with other traditional audit programs and held accountable when necessary. In the next stage, the audit area needs to pay attention to the balance between economic development and ecological protection by promoting the comprehensive green transformation of economic and social development and gradually improving the quantity and quality of forest landscape in the area. On the other hand, the maximum patch area and LPI of the forest landscape in the audit area showed a downward trend, indicating that local governments did not pay enough attention to large forest patches. The EVI of the Fobaoshan Development Zone continued to rise, which may be closely related to the vigorous development of forest health tourism in recent years. In fact, specialized measures must be formulated to strengthen the construction of protection because extensive forest patches and important ecological protection areas are of great significance to the sustainable development of forest resources. In particular, the forest coverage rate of the Fobaoshan Development Zone is 90%, which is a good basis for resource development. However, the recovery ability of forest resources is weak because of its high average altitude and the steep terrain of the region, which may cause irreversible negative effects once humans destroy it. Therefore, the local government should strictly follow the laws and regulations on natural resource protection, maintain the original natural appearance as much as possible, and reduce the artificial landscape creation to develop the tourism economy in Fobaoshan Development Zone. Otherwise, the LSI and CONNECT of forest landscapes are high and on the rise, and the forest resources in the audit area have a trend of concentrated distribution. The EVI in three administrative regions, Nanping Township, Jiannan Town, and Fobaoshan Development Zone, was significantly stronger than that of other administrative regions, and the external interference was more intense, indicating that the spatial distribution of forest resources in the audit region was not balanced and it was necessary to do overall planning to promote the balanced development of forest resources. In general, some measures should be taken to restrain the aggravating tendency in the landscape pattern and ecological vulnerability of forest resources in the audit region, which is not beneficial for the sustainable development of forest resources from the ecological view.
We thoroughly considered the spatiotemporal characteristics of forest resources in the paper and focused on process and objective evaluation. Based on the references, we introduced two methods of landscape pattern index and EVI to analyze and evaluate the impact of landscape pattern evolution in forest resources on ecological sustainability. As a new theoretical dimension, it provides a supplement for carrying out the FRADA in a scientific way. However, some questions still need further analysis. (1) The tenure period of Chinese officials is generally 3 to 5 years, during which the forest landscape pattern will mostly stay the same. Therefore, it is necessary to consider applying high-precision data to reflect the changes accurately. (2) The LONRADA is a systematic work. In the audit and assessment of ecological sustainability, the researcher should consider conducting a comprehensive analysis and evaluation of the land resources, water resources, grassland resources with landscape pattern characteristics and forest resources together.

5. Conclusions

Theories and methods of modern landscape ecology could be applied to effectively evaluate the development of forest resources in terms of ecological sustainability, and high-resolution remote sensing images could provide continuous and objective data support for the audit. This paper selected Lichuan of Hubei Province, which is rich in forest resources, as the audit sample. The landscape pattern index and EVI were innovative methods introduced to analyze and evaluate the impact of forest resources evolution in the landscape pattern of the audit area on sustainable development, which is a supplement for the FRADA. As a result, the landscape pattern index and EVI could effectively evaluate the ecological sustainability of forest resources in the audit region and give suggestions about development, which could also offer a reference for conducting the FRADA using a more scientific method.
(1)
From 2015 to 2019, the NP, PD and LPI of the Lichuan forest landscape showed a downward trend, and the quantity and quality of the forest landscape decreased. The local government did not pay enough attention to protecting extensive forest patches with important ecological value, which was not beneficial for the sustainable development of forest resources in the view of ecology.
(2)
From 2015 to 2019, the LSI and CONNECT of the Lichuan forest landscape showed an upward trend, while the FD and FN showed a downward trend. The forest resources are distributed in a continuous and centralized manner, which is uneven development.
(3)
From 2015 to 2019, the EVI of the Lichuan forest landscape became more serious. In the administrative regions under the jurisdiction, Maoba Town, Wendou Township, Liangwu Township, and Zhonglu Town were less disturbed. Meanwhile, Nanping Township, Jiannan Town and Fobaoshan Development Zone were especially strongly disturbed, which required special attention.
(4)
From 2015 to 2019, the increasingly severe development trend in landscape patterns and ecological vulnerability of the forest resources is not beneficial for the sustainable development of forest resources in ecology. In the future, local government should focus on aspects such as increased forestry areas, large-scale ecological reserves, balanced development, etc., to further protect forest resources.

Author Contributions

Conceptualization, W.Z., X.L.; methodology, W.Z., X.W., X.Z; software, W.Z., X.W., M.C.; validation, W.Z., L.Z.; formal analysis, W.Z.; investigation, W.Z. and L.Z.; resources, W.Z. and M.C., X.L., X.Z.; data curation, W.Z., X.W., X.Z.; writing-original draft preparation, W.Z.; writing-review and editing, W.Z., X.L. and X.Z.; visualization, W.Z., M.C.; supervision, X.W., X.L. and L.Z.; project administration, X.L., M.C.; funding acquisition, X.L. All authors have read and agreed to the published version of the manuscript.

Funding

This research was funded by the National Natural Science Foundation of China (NSFC) (No. 41971364).

Data Availability Statement

The sources and preprocessing of data can be found in Section 2.2. Other relevant data to support this study are available from the authors upon request.

Acknowledgments

The authors would like to thank the editors and the anonymous reviewers for their constructive comments and suggestions, which greatly helped to improve the quality of the manuscript.

Conflicts of Interest

The authors declare no conflict of interest.

Abbreviations

AcronymDefinition
FRADAThe Forest Resources Assets Departure Audit
GISGeographical Information Systems
RSRemote Sensing
NPThe number of patches
PDPatch density
LPIThe largest patch index
LSIThe landscape shape index
CONNECTThe connectivity index
FDFractal dimension
FNFragmentation index
LONRADAThe Leading Officials’ Natural Resources Assets Departure Audit
EVIEcological Vulnerability Index
EWMThe Entropy Weight Method
TITopographic Index

References

  1. Ameray, A.; Bergeron, Y.; Valeria, O.; Girona, M.M.; Cavard, X. Forest Carbon Management: A Review of Silvicultural Practices and Management Strategies Across Boreal, Temperate and Tropical Forests. Curr. For. Rep. 2021, 7, 245–266. [Google Scholar] [CrossRef]
  2. Yin, S.; Gong, Z.; Gu, L.; Deng, Y.; Niu, Y. Driving forces of the efficiency of forest carbon sequestration production: Spatial panel data from the national forest inventory in China. J. Clean. Prod. 2021, 330, 129776. [Google Scholar] [CrossRef]
  3. Richards, K.R.; Stokes, C. A Review of Forest Carbon Sequestration Cost Studies: A Dozen Years of Research. Clim. Chang. 2004, 63, 1–48. [Google Scholar] [CrossRef]
  4. Jiang, X.; Huang, Z.H. Analysis of China’s forestry carbon sink potential under the economic new normal. Chin. Rural. Econ. 2016, 11, 57–67. [Google Scholar]
  5. Baul, T.K.; Peuly, T.A.; Nandi, R.; Kar, S.; Karmakar, S. Role of Homestead Forests in Adaptation to Climate Change: A Study on Households’ Perceptions and Relevant Factors in Bandarban Hill District, Bangladesh. Environ. Manag. 2022, 69, 906–918. [Google Scholar] [CrossRef]
  6. Wang, Y.; Sarkar, A.; Li, M.; Chen, Z.; Hasan, A.K.; Meng, Q.; Hossain, M.S.; Rahman, M.A. Evaluating the Impact of Forest Tenure Reform on Farmers’Investment in Public Welfare Forest Areas: A Case Study of Gansu Province, China. Land 2022, 11, 708. [Google Scholar] [CrossRef]
  7. Zhang, Y.; Zhang, X.; Cai, H. Temporal and Spatial Evolutions and Its Driving Factors of Ecological Vulnerability in Wan’an County of Jiangxi Province Based on Geogdetector. Bull. Soil Water Conserv. 2018, 38, 207–214. [Google Scholar] [CrossRef]
  8. State Council of the People’s Republic of China. Provisions on the Leading Officials’ Natural Resources Assets Departure Audit (for Trial Implementation) [EB/OL]. 2017. Available online: http://www.gov.cn/xinwen/2017-11/28/content_5242955.htm (accessed on 5 March 2022).
  9. Zhang, H.; Liu, C.; Cao, L. Study on Local Governors’ Accountability Audit of Natural Resource-Framework development and case application. Audit. Res. 2015, 2, 12–20. [Google Scholar]
  10. Qian, S. Study on County-level Officials’ Accountability Audit of Natural Resources. Audit. Res. 2016, 4, 15–19. [Google Scholar]
  11. Tan, C. Research on the Audit Evaluation Index System of Natural Resource Assets; Beijing Forestry University: Beijing, China, 2021. [Google Scholar] [CrossRef]
  12. Huang, R.B. Construction of audit evaluation index system for the departure of leading cadres’ natural resources assets-based on the perspective of main functional areas. Huxiang Forum 2020, 3, 79–90. [Google Scholar] [CrossRef]
  13. Su, H. Research on the Forest Resource Assets Appraisal and off-office Audit. Proceedings of the 2019 3rd International Conference on Education. Manag. Sci. Econ. 2019, 9, 161–167. [Google Scholar] [CrossRef] [Green Version]
  14. Xiong, H.; Li, Y.; He, J. Construction and Application of the Evaluation System of Natural Resources Asset Accountability Audit of Officials: A Case Study of Jiangxi, China. Sustainability 2022, 14, 528. [Google Scholar] [CrossRef]
  15. Xuan, J. The Construction of the Evaluation Index for the Outgoing Auditing of the Natural Resource Assets of Local Leading Cadres Based on the Analytic Hierarchy Process. Appl. Bionics Biomech. 2022, 2022, 1215842. [Google Scholar] [CrossRef]
  16. Huang, Y.P.; Shi, D.J. Research on the auditing evidence checklist of outgoing leading cadres’ forest resource asserts. Issues For. Econ. 2021, 41, 544–551. [Google Scholar]
  17. Ren, L. Research on the Auditing Evaluation System of the Leading Cadres’ Forest Resources Departure-Taking R Province as an Example; Shanxi University of Finance & Economics: Shanxi, China, 2018. [Google Scholar]
  18. Risser, P.G.; Karr, J.R.; Forman, R.T.T. Landscape Ecology: Directions and Approaches: A Workshop Held at Allerton Park, Piatt, County Illinois; Illinois Natural History Survey Special Publication: Champaign, IL, USA, 1984; Volume 16. [Google Scholar]
  19. Wu, J.G. Landscape Ecology, Pattern, Process, Scale and Grade; Higher Education Press: Beijing, China, 2007. [Google Scholar]
  20. Forman, T.T.R.; Godron, M. Landscape Ecology; John Wiley and Sons: Hoboken, NJ, USA, 1986. [Google Scholar] [CrossRef]
  21. Gergel, S.E.; Turner, M.G. Learning Landscape Ecology a Practical Guide to Concepts and Techniques; Springer Verlag: Berlin/Heidelberg, Germany, 2017. [Google Scholar] [CrossRef]
  22. Farina, A. Landscape Ecology in Action; Springer Verlag: Berlin/Heidelberg, Germany, 2000. [Google Scholar] [CrossRef]
  23. Bürgi, M.; Hersperger, A.M.; Schneeberger, N. Driving forces of landscape change—Current and new directions. Landsc. Ecol. 2005, 19, 857–868. [Google Scholar] [CrossRef]
  24. Antrop, M. Handling landscape change. In Landscape Change; Oguz, D., Ed.; University of Ankara: Ankara, Turkey, 2005; pp. 3–14. Available online: https://www.landscape-portal.org/handlng-landscape-change/ (accessed on 1 October 2021).
  25. Sun, W.; Sun, Y. An Empirical Study on the Impact of Resource-Environment Audit on High-Quality Economic Development: A Pilot Study on the Audit of Natural Resources Assets of Leading Cadres as an Example. Ecol. Econ. 2020, 36, 166–171. [Google Scholar]
  26. Lichuan Municipal People’s Government. Geographical Environment and Natural Resources [EB/OL]. 2022. Available online: http://www.lichuan.gov.cn/zjlc/zrzy/201908/t20190801_530866.shtml (accessed on 6 May 2022).
  27. Zeng, J.X.; Yang, Q.Q.; Liu, Y.J.; Zhao, C.F.; Li, B.H. Research on evolution and influential mechanism for rural human settlement in national key ecological function areas:acase of lichuan. Hum. Geogr. 2016, 147, 81–88. [Google Scholar] [CrossRef]
  28. Peng, B.F.; Chen, D.L.; Li, W.G.; Wang, Y.L. Stability of Landscape Pattern of Land Use—A Case Study of Changde. Sci. Geogr. Sin. 2013, 33, 1484–1488. [Google Scholar] [CrossRef]
  29. Guo, Q.; Xiao, S. The Influence of Grain Effect on the Analysis of Landscape Pattern Gradient along Urban-rural Transect. J. Northeast. For. Univ. 2004, 2, 49–51. [Google Scholar]
  30. Zhang, Y. Forest Farm Scale Landscape Pattern Evolution and Simulation in Changbai Mountian Region; Northeast Forestry University: Heilongjiang, China, 2016. [Google Scholar]
  31. Gökyer, E. Understanding Landscape Structure Using Landscape Metrics. In Advances in Landscape Architecture. IntechOpen: London, UK, 2013. [Google Scholar] [CrossRef] [Green Version]
  32. Chen, W.; Xiao, D.; Li, X. Classification, application, and creation of landscape indices. J. Appl. Ecol. 2002, 13, 121–125. [Google Scholar]
  33. O’Neill, R.V.; Riitters, K.; Wickham, J.; Jones, K.B. Landscape Pattern Metrics and Regional Assessment. Ecosyst. Health 1999, 5, 225–233. [Google Scholar] [CrossRef]
  34. Wang, G.X.; Guo, X.Y.; Cheng, G.D. Dynamic Variations of Landscape Pattern and the Landscape Ecological Functions in the Source Area of the Yellow River. Acta Ecol. Sin. 2002, 22, 1587–1598. [Google Scholar] [CrossRef]
  35. Wang, H.W.; Zhang, X.L.; Qiao, M. Assessment and dynamic analysis of the eco-environmental quality in the Ili River Basin based on GIS. Arid. Land Geogr. 2008, 2, 215–221. [Google Scholar] [CrossRef]
  36. Liu, J.; Liu, X.L.; Hou, L.M. Changes and ecological vulnerability of landscape pattern in Eastern Qilian Mountain. Arid. Land Geogr. 2012, 35, 795–805. [Google Scholar] [CrossRef]
  37. JianSheng, W.U.; Zong, M.L.; Peng, J. Assessment of mining area’s ecological vulnerability based on landscape pattern, A case study of Liaoyuan, Jilin Province of Northeast China. Chin. J. Ecol. 2012, 31, 3213–3220. [Google Scholar] [CrossRef]
  38. Feng, J.; Guo, L.; Xiaohua, L.I. Analysis of Ecological Vulnerability in Yuyang District Based on Landscape Pattern. Res. Soil Water Conserv. 2016, 23, 179–184. [Google Scholar] [CrossRef]
  39. Tu, J.; Luo, S.; Yang, Y.; Qin, P.; Qi, P.; Li, Q. Spatiotemporal Evolution and the Influencing Factors of Tourism-Based Social-Ecological System Vulnerability in the Three Gorges Reservoir Area, China. Sustainability 2021, 13, 4008. [Google Scholar] [CrossRef]
  40. Shannon, C.E. A mathematical theory of communication. Bell Syst. Tech. J. 1948, 27, 623–656. [Google Scholar] [CrossRef]
  41. Liding, C.; Bojie, F. Analysis of impact of Human activity on landscape structiure in yellow river delta-a case study of dongying region. Acta Ecol. Sin. 1996, 16, 8. [Google Scholar]
  42. Ji, J.Y.; Zhao, Y.G.; Yang, K.; Zhang, W.T.; Wang, S.S. Correlation between runoff and sediment yield from biological soil crustal slope and its distribution patterns in the Hilly Loess Plateau Region. Acta Ecol. Sin. 2021, 41, 1381–1390. [Google Scholar] [CrossRef]
  43. MacArthur, R.H.; Wilson, E.O. The Theory of Island Biogeography. J. Wildl. Manag. 1969, 33, 1046–1047. [Google Scholar] [CrossRef]
  44. Forman, R. Land Mosaic: The Ecology of Landscapes and Regions; Cambridge University Press: Cambridge, UK, 1995. [Google Scholar] [CrossRef]
Figure 1. The geographical location of the audit sample.
Land 11 02156 g001
Figure 2. Research Framework.
Land 11 02156 g002
Figure 3. Landscape pattern of the audit area in 2014, 2017 and 2020.
Land 11 02156 g003
Figure 4. Landscape pattern evolution: (a) NP and PD; (b) maximum patch area and LPI; (c) LSI and CONNECT; and (d) FD and FN.
Land 11 02156 g004
Figure 5. Distribution of ecological vulnerability in the audit sample in 2014, 2017 and 2020.
Land 11 02156 g005
Table 1. GF-1 WFV load technical index.
SatelliteSatellite PayloadSpectrum BandSpectral Range (μm)Spatial Resolution
(m)
Revisit Cycle (d)Launch
Time
GF-1WFVBand 1 Blue0.450–0.5201622013
Band 2 Green0.520–0.590
Band 3 Red0.630–0.690
Band 4 NIR0.770–0.890
Table 2. Computational method and basic meaning of landscape pattern index.
Landscape Pattern IndexComputing FormulaBasic Meaning
Number of Patches (NP) NP = N The total number of patches in the landscape.
Patch Density (PD) PD = N A The number of patches per 100 hm2.
Largest Patch Index (LPI) LPI = max a i a n A 100 The area of the largest patch in the landscape as a percentage of the total landscape area.
Landscape Shape Index (LSI) LSI = P 2 π × A P is the perimeter of the patch, and A is the total area of the patch.
Connectivity Index (CONNECT) CONNECT = i = 1 m j = k n C ijk j = 1 m n i n i 1 / 2 100 C ijk represents the connection between patch j and k related to patch type I, m is the sum of landscape types, and n is the sum of I types.
Fractional Dimension (FD) FD = 2 log p 4 log 2 A P is the perimeter of the patch, and A is the total area of the patch.
Fragmentation Index (FN) FN = N 1 A N is the total number of patches in the landscape, and A is the total area of the landscape.
Table 3. Construction of ecological vulnerability assessment model.
Evaluation ModelEvaluation DimensionIndex
Ecological Vulnerability Index (EVI)Pressure (P)FD
SPLIT
Sensitivity (S)FN
TI
Resilience (R)CONNECT
LPI
Table 4. Landscape pattern index calculation results.
NPPDLPILSICONNECTFDFN
201410,3582.249152.2340173.28460.04121.46110.0379
201793282.025948.0663187.45250.04871.42950.0346
202079851.736145.6750182.37160.05491.42810.0301
Table 5. The weight of EVI evaluation indicators.
IndicatorsParametersInformation EntropyEntropy Weight
PFD0.3758250.163528
SPLIT0.3676740.165663
SFN0.3665230.165965
TI0.3539470.169260
RCONNECT0.3462250.171283
LPI0.3728720.164301
Table 6. Results of forest landscape EVI calculations.
Index201420172020
EVI00.21990.2720
Table 7. The EVI of forest landscape in each administrative region.
Administrative RegionsEVI
201420172020
Duting Street0.0152050.0691080.064232
Moudao Town0.0301840.0565650.075618
Liangwu Township0.0138190.0429850.046948
Wangying Town0.0223340.0559080.060435
Shaxi Township0.0245010.0613850.094816
Dongcheng Street0.0304960.0747010.095255
Baiyangba Town0.0255080.0621340.082114
Zhonglu Town0.0185870.0401780.051714
Yuanbao Township0.0273740.0438930.045840
Jiannan Town0.0386840.0796170.096478
Wendou Township0.0015260.0234310.056142
Fobaoshan Development Zone0.3484200.0794700.774124
Maoba Town0.0015030.0272900.040786
Tuanbao Town0.0353690.0684020.074240
Nanping Township0.0698190.1355430.168918
Publisher’s Note: MDPI stays neutral with regard to jurisdictional claims in published maps and institutional affiliations.

