Article

Urban Green Space Prioritization to Mitigate Air Pollution and the Urban Heat Island Effect in Kathmandu Metropolitan City, Nepal

by
Sabina Bhandari
1,* and
Chuanrong Zhang
1,2
1
Department of Geography, University of Connecticut, Storrs, CT 06269, USA
2
Center for Environmental Sciences and Engineering, University of Connecticut, Storrs, CT 06269, USA
*
Author to whom correspondence should be addressed.
Land 2022, 11(11), 2074; https://doi.org/10.3390/land11112074
Submission received: 1 October 2022 / Revised: 8 November 2022 / Accepted: 16 November 2022 / Published: 18 November 2022

Abstract

:
The rapid population growth and unplanned urbanization within Kathmandu Metropolitan City (KMC) have induced land use and land cover (LULC) changes that have exacerbated problems of air pollution and the Urban Heat Island (UHI) effect. These issues, as well as potential mitigations and possible counteractions, are currently under investigation by numerous research communities, resulting in various solutions being put forward including the creation of Urban Green Spaces (UGS). Establishing UGS would increase carbon dioxide extraction, minimizing photochemical ozone formation and liberation, while simultaneously cooling the microclimate of an area such as KMC. Optimized implementation of UGS throughout KMC requires an understanding of and prioritization of locations based on degraded air quality and the UHI effect. Unfortunately, such studies in these areas appear to be severely lacking, which has acted as a catalyst for this study. This research includes prioritization on two different spatial units—(i) at the administrative ward level and (ii) 0.0025° fishnet level. The result identifies the high-need locations where UGS establishment is recommended to mitigate air pollution and the UHI effect. Information obtained also heightened the existing UGS’s current sparsity and deplorable conditions. Findings from this study indicate that the utilization of rooftops are potential locations for new UGS, and enhancement of the existing UGS would prove to be an efficient use of currently underutilized spaces.

1. Introduction

Various LULC studies in Kathmandu Metropolitan City (KMC) (Figure 1) have highlighted the negative impacts of rapid urbanization and population growth [1,2] on environmental problems such as air pollution [3] and Urban Heat Island (UHI) [4].

1.1. Air Pollution in KMC

Saud and Paudel [3] introduced that Kathmandu is a city with a pollution problem, and they discussed the sources and health impacts of air pollution in Kathmandu. The trend of increased use of private vehicles combined with industrial facilities, household combustion devices, and forest fires are the most frequent sources of air pollution in Kathmandu [5,6]. In addition, the wide use of poorly maintained automobiles and poorly planned construction projects, e.g., demolished building materials on busy roadsides and the expansion of the Melamchi water project, have contributed to air pollution in KMC [3,6]. Air pollution causes two-fold interconnected impacts on human and environmental health. Only a few studies have been conducted about the effects of air pollution on human health in Nepal [3,7,8,9,10]. These studies indicated that Nepal, especially Kathmandu, has been highly exposed to air pollution, and suggested severe health impacts [7]. Recently, environmental activists highlighted the degraded air quality in KMC as a public health emergency through protests [11]. This public attention emerged when the Swiss air quality technology company IQ Air temporarily ranked Kathmandu as the most polluted city in the world in January 2021 [11,12]. According to IQ Air, Kathmandu’s AQI reached a hazardous category with a value of 450, which is 15 times more than the WHO standard [13]. In addition, Nepal experienced wildfires in March and April 2021, further spiking air pollution [14]. Schools had to be closed for several days due to the severity of air pollution [15]. Protests addressing degraded air quality continued with social media posts on different platforms at individual and organizational levels [12]. Therefore, it has become essential to address the air pollution problem in KMC.

1.2. Urban Heat Island (UHI) in KMC

Aryal et al. [16] and Magar et al. [17] revealed that the center of Kathmandu has higher Land Surface Temperatures (LST) as compared to its surrounding areas, a phenomenon known as Urban Heat Island (UHI) [18]. It is one of the common properties exhibited by most of the large cities in the world [18]. In an assessment impact of changes in land use/land cover on the surface UHI phenomenon in Kathmandu between 1988–2018, Sarif et al. [4] reported that LST in Kathmandu has a positive relationship with Normal Difference Built-up Index, whereas a negative association with Normal Difference Vegetation Index. Magar et al. [17] also found that built-up areas in Kathmandu highly contributed to the increase in LST compared to other land use/land cover types. The UHI effect in KMC is primarily due to the large-scale expansion of impervious surfaces, dense built-up areas, and high concentrations of anthropogenic activities [4,17]. These impervious surfaces have reduced evapotranspiration [19], increased solar radiation absorption, and higher retention of infrared radiation [20]. Additional greenhouse gases in the atmosphere due to growing industrialization and urban transportation also contribute to the increase in temperatures [21,22]. The UHI affects human health [23], ecosystem functions [24], and local weather and climate [25], therefore, degrading the quality of urban life. Globally, data show that increased daily temperatures are associated with heat-related illnesses that range from mild fatigue and heatstroke to death [26,27,28]. The UHI effect also increases energy costs (e.g., air conditioning) [29], degrades water quality, and causes social, economic, and environmental stresses [30]. Heat may degrade the air quality and increases ground-level ozone, affecting life quality [30,31], further strengthening the need to mitigate the UHI effect.

1.3. Role of UGS in Mitigating Air Pollution and the UHI Effect

Zupancic, Westmacott, and Bulthuis [32] analyzed 102 peer-reviewed articles that studied the role of Urban Green Spaces (UGS) in reducing heat and air pollution in an urban environment. Based on this review, 92 percent of the identified studies on UGS and air pollution reported that UGS can mitigate pollution effects, and 98 percent of the identified studies on UGS and heat mitigation indicated the cooling impact of UGS. The review paper summarized by demonstrating the importance of greening policies integration with health and land-use planning policies. Therefore, establishing UGS may also be a potential solution to the interrelated UHI-air pollution problem in KMC. Vegetation has a two-way effect on air quality—air pollution mitigation, and emission of Volatile Organic Compounds (VOCs) that react with nitrogen oxides to form ozone [33,34]. It acts as both a source and a sink for air pollutants [33]. Trees help mitigate air pollution by intercepting airborne particles or pollutants uptake through leaf stomata [33,34].
Moreover, UGS also may improve air quality by minimizing air temperatures. Taha’s study [35] showed that the temperature-dependent emission rates of VOCs from vegetation and the chemical reaction rates of producing tropospheric ozone decrease with air temperature. Another way of dealing with the effect of VOC is by planting trees that emit low amounts of VOC. Taha [35] also found that planting trees radiating low VOC minimized the ozone concentration in the troposphere, whereas planting trees releasing high VOC resulted in air quality degradation in Los Angeles, California.
In a comprehensive systematic review, Bowler et al. [36] stated the potential effectiveness of UGS in mitigating the UHI effect through direct shading from incident solar radiation, radiated heat from nearby surfaces, and evaporative cooling. Previous studies revealed that the temperature in a suburban neighborhood under mature trees was 2.2–3.3 K cooler than in new areas with no trees [37]. Planting trees near buildings can help reduce building surface temperatures during hot summertime, naturally limiting energy use for cooling building interiors [38], which in turn can reduce emissions from power plants [39]. Akbari et al. [40] found that shading by trees decreased summertime energy demands by as much as 30%.
Some existing studies discussed the need to address air pollution and the UHI effect in Kathmandu, whereas others linked green vegetation with air pollution and UHI. Gautam [41] and Saud and Paudel [3] highlighted the urgency of mitigating air pollution in Kathmandu. Magar et al.’s [17] study result indicated that continuous urbanization at the present rate might result in severe UHI effects in Kathmandu. Ghimire [42] reported that urban temperature is increasing remarkably in areas with fewer green spaces and more built-up areas. Aryal et al. [16] suggested that more green space should be established in Kathmandu to minimize LST. Shrestha et al. [43] and Kanwar et al. [44] assessed plant species’ tolerance to air pollution in Kathmandu to reduce human exposure to air pollutants. However, based on our best knowledge, no study has been conducted on urban green space prioritization with the motive of mitigating air pollution and the UHI effect in KMC. Sarif et al. [4] pointed out the importance of improving urban planning with green city technology to avoid the severe impacts of the increasing UHI effect in Kathmandu. This paper attempts to fill this research. We prioritized areas in KMC for urban green space establishment to mitigate air pollution and UHI. We encourage the plantation of air pollution tolerant plant species, as suggested by Shrestha et al. [43] and Kanwar et al. [44], and green roofs techniques, as suggested by Baniya et al. [42] in KMC in the prioritized areas based on our results.
Considering the negative impacts of the UHI effect and air pollution in KMC and the role of UGS in mitigating these problems, we propose that UGS should be established in KMC. The objectives of this study are (i) to assess Land Surface Temperature (LST) and air pollution in KMC, (ii) to develop a composite priority index for UGS prioritization evaluation, (iii) to identify potential ways to increase greenery for reducing the UHI effect and air pollution mitigation in KMC.

2. Materials and Methods

2.1. Assessing LST and Air Pollution in KMC

We conducted an assessment of LST and air pollution in KMC during the recent (2017–2021) period. We downloaded Landsat 8 Collection 2 Level 2 product (path 141 and row 41) from the USGS EarthExplorer [45]. Then, we assessed LST by processing the Landsat images—in ENVI 5.5.3. We included data that were acquired on 5 May 2017, 8 May 2018, and 16 May 2021 having cloud coverage of 4.76%, 5.69%, and 9.07%, respectively, in our analysis. Data for all other summer months of the five years from 2017 to 2021 were highly cloudy and unsuitable for analysis. The multispectral Landsat images were stacked into a single image file, and a spatial subset was performed to extract data for our study area. It turned out that our study area had less cloud in each downloaded Landsat image. We detected clouds in our study area using the Function of mask (Fmask) 4.0 algorithm and corrected the images by compositing and mosaicking. We calculated LST using the correction factors of Landsat 8 Collection 2 Level 2 product as below:
LST = B 10   × 0.00341802 + 149
where B10 = thermal infrared (TIRS) band 10 (10.6–11.19 µm) of Landsat 8 OLI.
We also assessed the monthly trend of the Air Quality Index (AQI) based on PM2.5 over the five years of 2017–2021 using data obtained from the World Air Quality Project [46] in three stations the U.S. Embassy, Phora Durbar, and Ratnapark in R. PM2.5 are the fine particles that are generally 2.5 μm and smaller, and inhalable [47].

2.2. Developing Composite Priority Index

Developing a composite priority index requires important decisions on selecting indicators, analyzing scale, data transformation, scaling, weighting, and aggregation. It is crucial to choose context-specific indicators when developing a composite priority index. Here, the context is to mitigate the UHI effect and air pollution. We selected a set of indicators under two dimensions—(i) problem indicators and (ii) solution indicators based on their role in escalating or mitigating the impacts of the UHI effect and air pollution, respectively. Table 1 shows the details of the indicators with data sources.
Using the problem and solution indicators, we developed a composite index to prioritize areas for UGS establishment in open-source software QGIS 3.24 using the OpenQuake package (https://docs.openquake.org/oq-irmt-qgis/v3.2.3/ accessed on 3 February 2021). For the problem indicators, higher value means that the necessity to prioritize those areas will be higher. For example, an area with a high population density requires more resources to control the population. Therefore, areas with high population density will have a higher necessity to prioritize urban green space establishment in those areas. The areas with higher LST, more built-up, residential and industrial areas, and areas closer to the transportation zones must be prioritized.
On the contrary, the solution indicators with a low value need to be prioritized. We calculated the current green space in KMC to prioritize the areas with insufficient existing green space. In addition, green areas with low NDVI values should be prioritized.
Developing a composite priority index requires a decision on the scale of analysis. We conducted the prioritization by analyzing data on two different levels of spatial units—(i) administrative boundaries at the ward level and (ii) 0.0025° fishnet level (Figure 2). The administrative wards are spatially larger than the fishnet zones. A common practice is to use administrative boundaries as a spatial unit because data are usually available at the administrative level [52], and planning is also done at the administrative level. Therefore, we analyzed our results at the administrative ward level so that our results could be helpful during the planning process. We repeated the same process at the fishnet level because the smaller units tend to be more homogenous; hence, the results from a smaller division may be more accurate than those from a larger division [53]. Planners may also get more ideas about the specific areas that should be prioritized within the administrative ward boundaries by using the fishnet level analysis.
We used Equations (2)–(4) to transform the raw data. Transforming data means changing the format of data representation (e.g., transforming data expressed as count to ratio, percentage, or density).
ρ i = P i A i
where 𝜌i is population density per aggregated unit, i is aggregated unit (ward or fishnet), Pi is population in the aggregated unit i, Ai is total area of each aggregated unit.
G A i = A g i A i
where GAi is available green area per aggregated unit, i is aggregated unit (ward or fishnet), Agi is green area within the aggregated unit i, Ai is total area of each aggregated unit.
α j i = β j i γ i
where αji is area of land use type j per unit aggregated unit area, i is aggregated unit (ward or fishnet), j is land-use type which is the primary source of emissions in KMC (residential, industrial, built-up, and barren), βji is total area covered by land-use type j within the aggregated unit i, and γi is total area of each aggregated unit.
We normalized each variable into an identical range between 0 and 1 (0 being the lowest and 1 being the highest) using the max-min scaling approach. Normalizing means assigning the same measurement system to all of the variables to make them comparable. Due to the absence of relevancy information of each indicator in each unit of analysis, we assigned the same weight to all of the variables. We then calculated the priority index using an additive scheme such that the final priority index is a linear sum of the normalized value of each variable.

2.3. Identifying Potential Solutions

Since KMC is a compact city, there is almost no possibility of establishing new UGS on the ground. One of the alternatives for this situation may be working on the quality of the UGS instead of quantity. All UGS may not contribute equally to mitigate the UHI effect and air pollution, and UGS in a better condition may have more potential for effective mitigation. We assessed the condition of the existing UGS in KMC by calculating NDVI in ENVI Classic 5.5.3. UGS with high NDVI values may be better than those with low NDVI. Another alternative that can be promoted is rooftop greenery [42]. The top surface area of buildings approximately gives the roof coverage. Therefore, we calculated the percentage of roof coverage in the wards that should be highly prioritized based on our priority index. We did the calculation in Python 3.7 using the building feature class downloaded from OpenStreetMap [51].
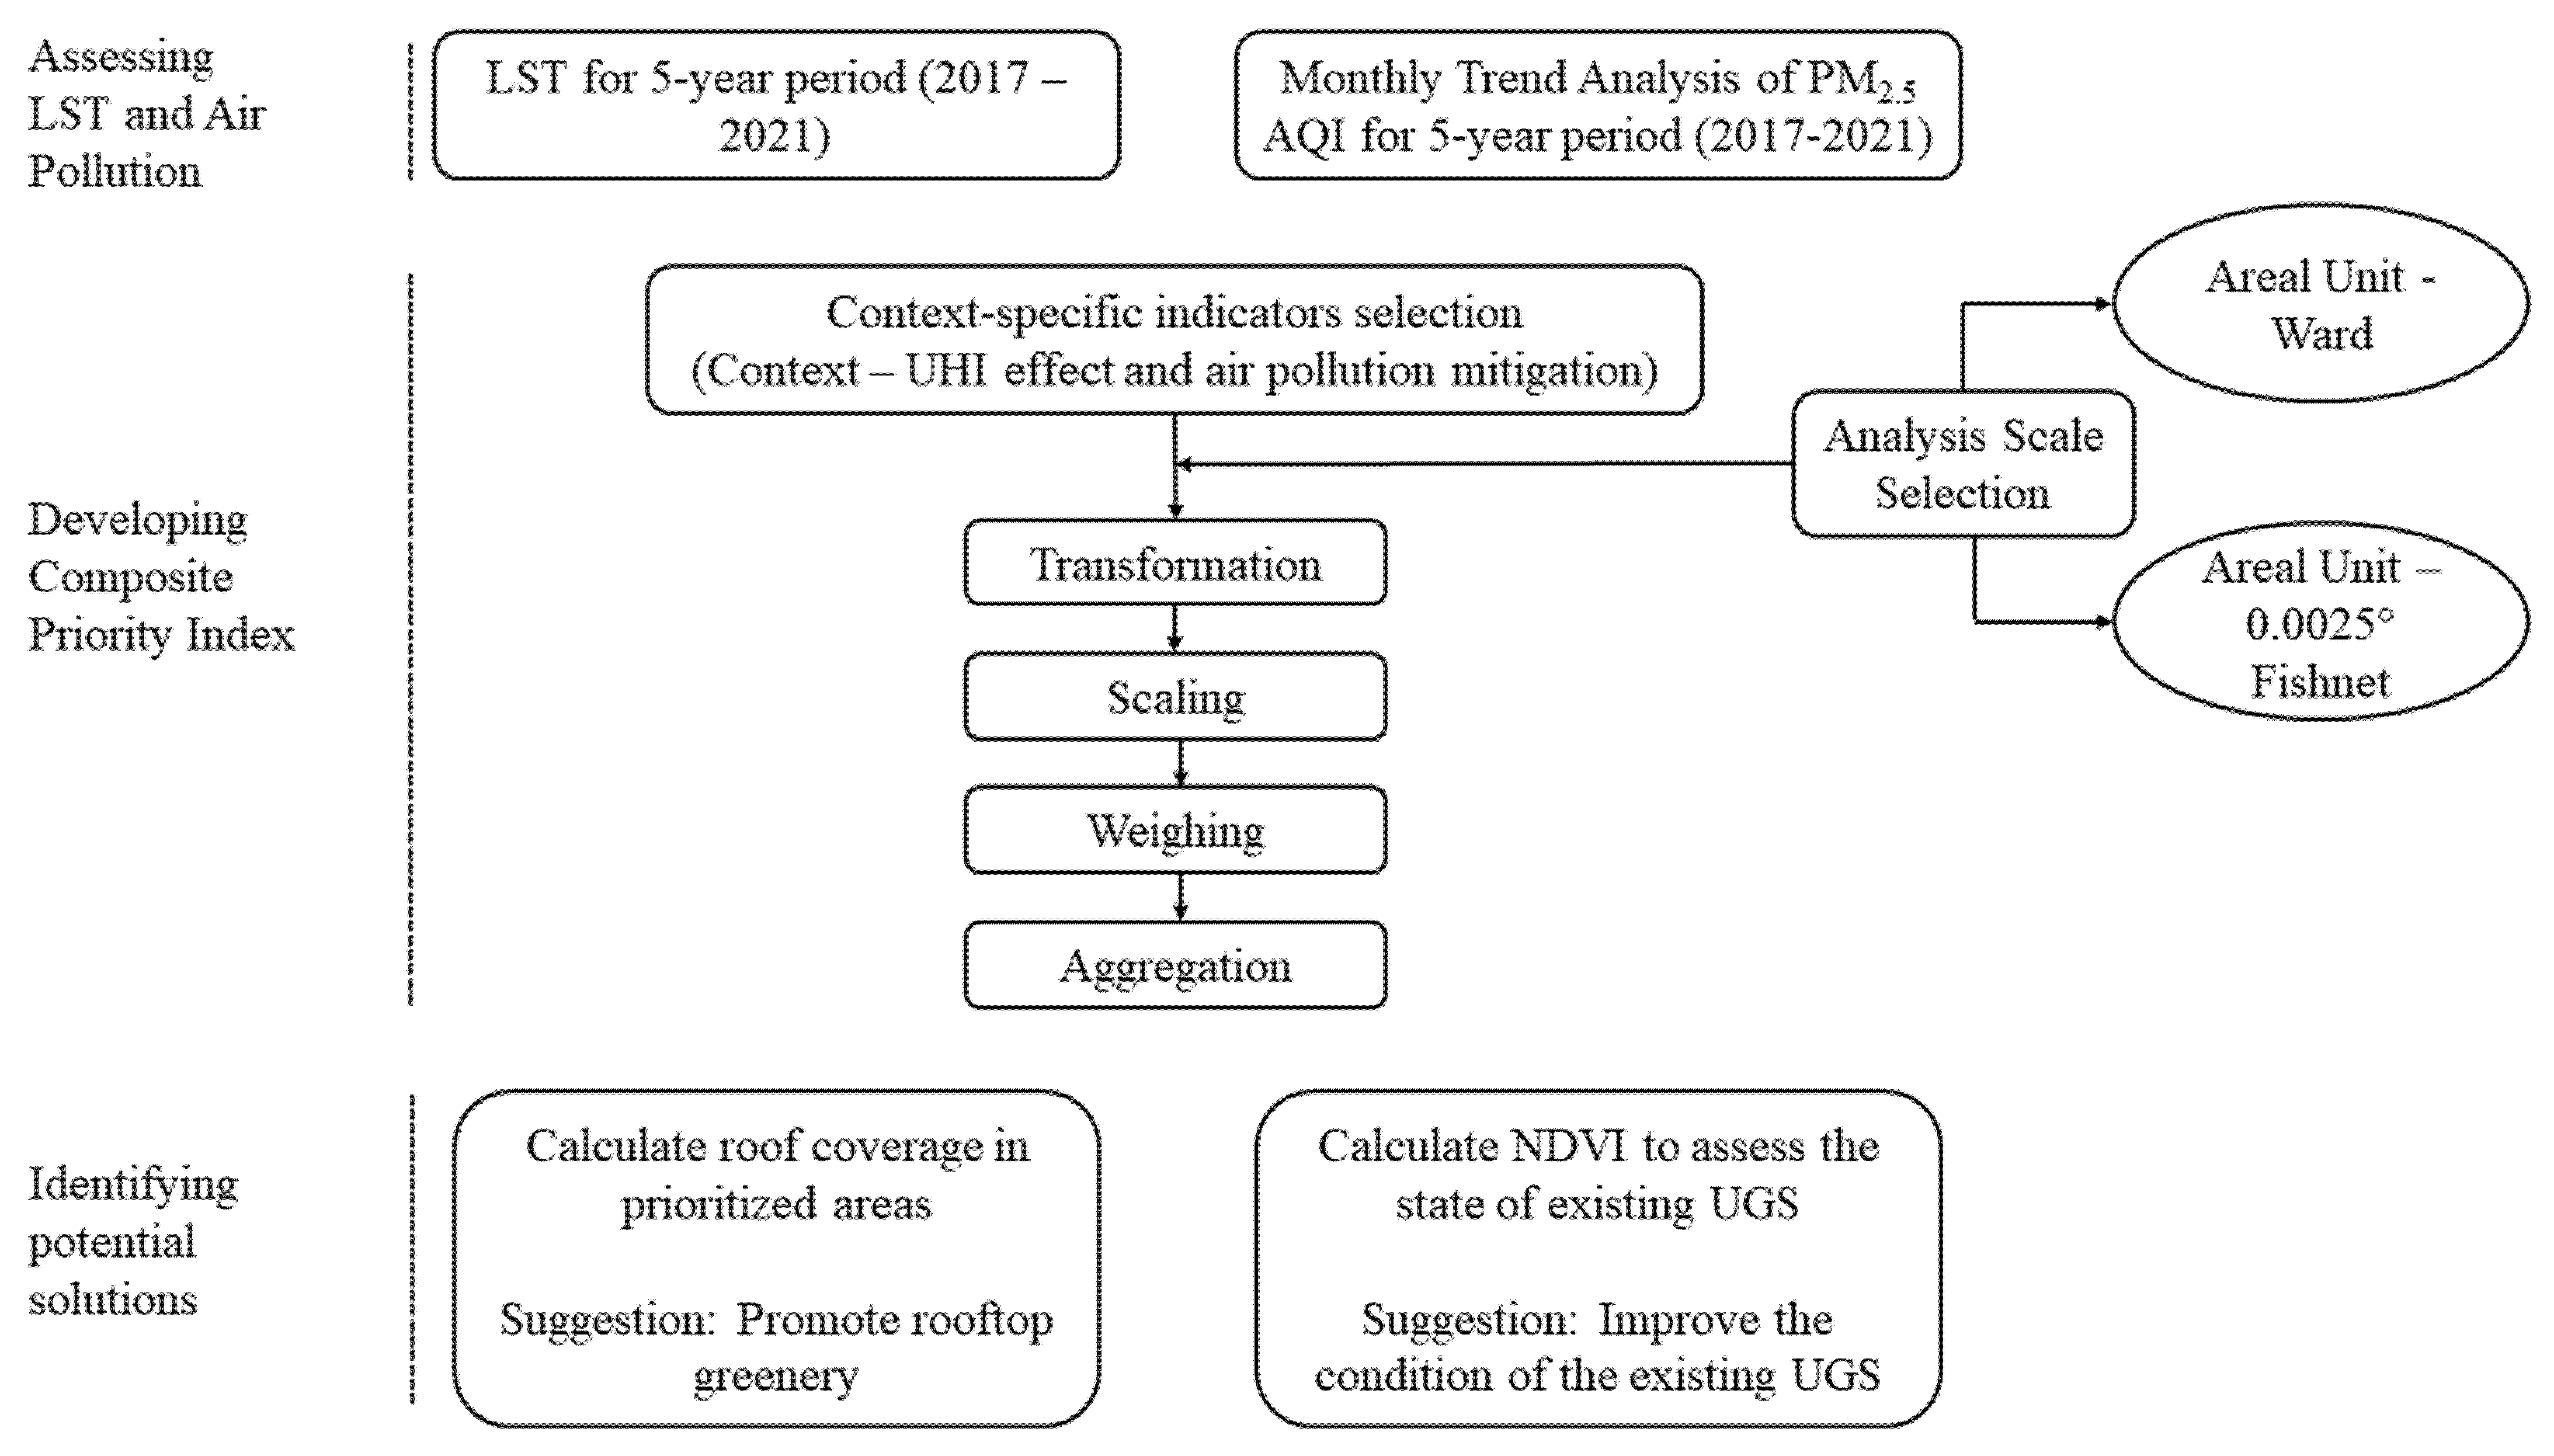
In summary, the methodology consists of three parts: (1) Assessing LST and air pollution; (2) developing composite priority index; and (3) identifying potential solution. Figure 3 shows the flowchart of the methodology.

3. Results

Figure 4 shows LST in KMC for the years 2017, 2018, and 2021. LST is highest in the Tribhuvan International airport area and towards the city core. The lower limit of the LST in KMC has increased from 298.06 K in the year of 2017 to 302.87 K and 303.86 K in the years of 2018 and 2021, respectively. Similarly, the upper limit of the LST in KMC has also increased from 312.13 K in 2017 to 318.47 K and 319.21 K in the years of 2018 and 2021, respectively.
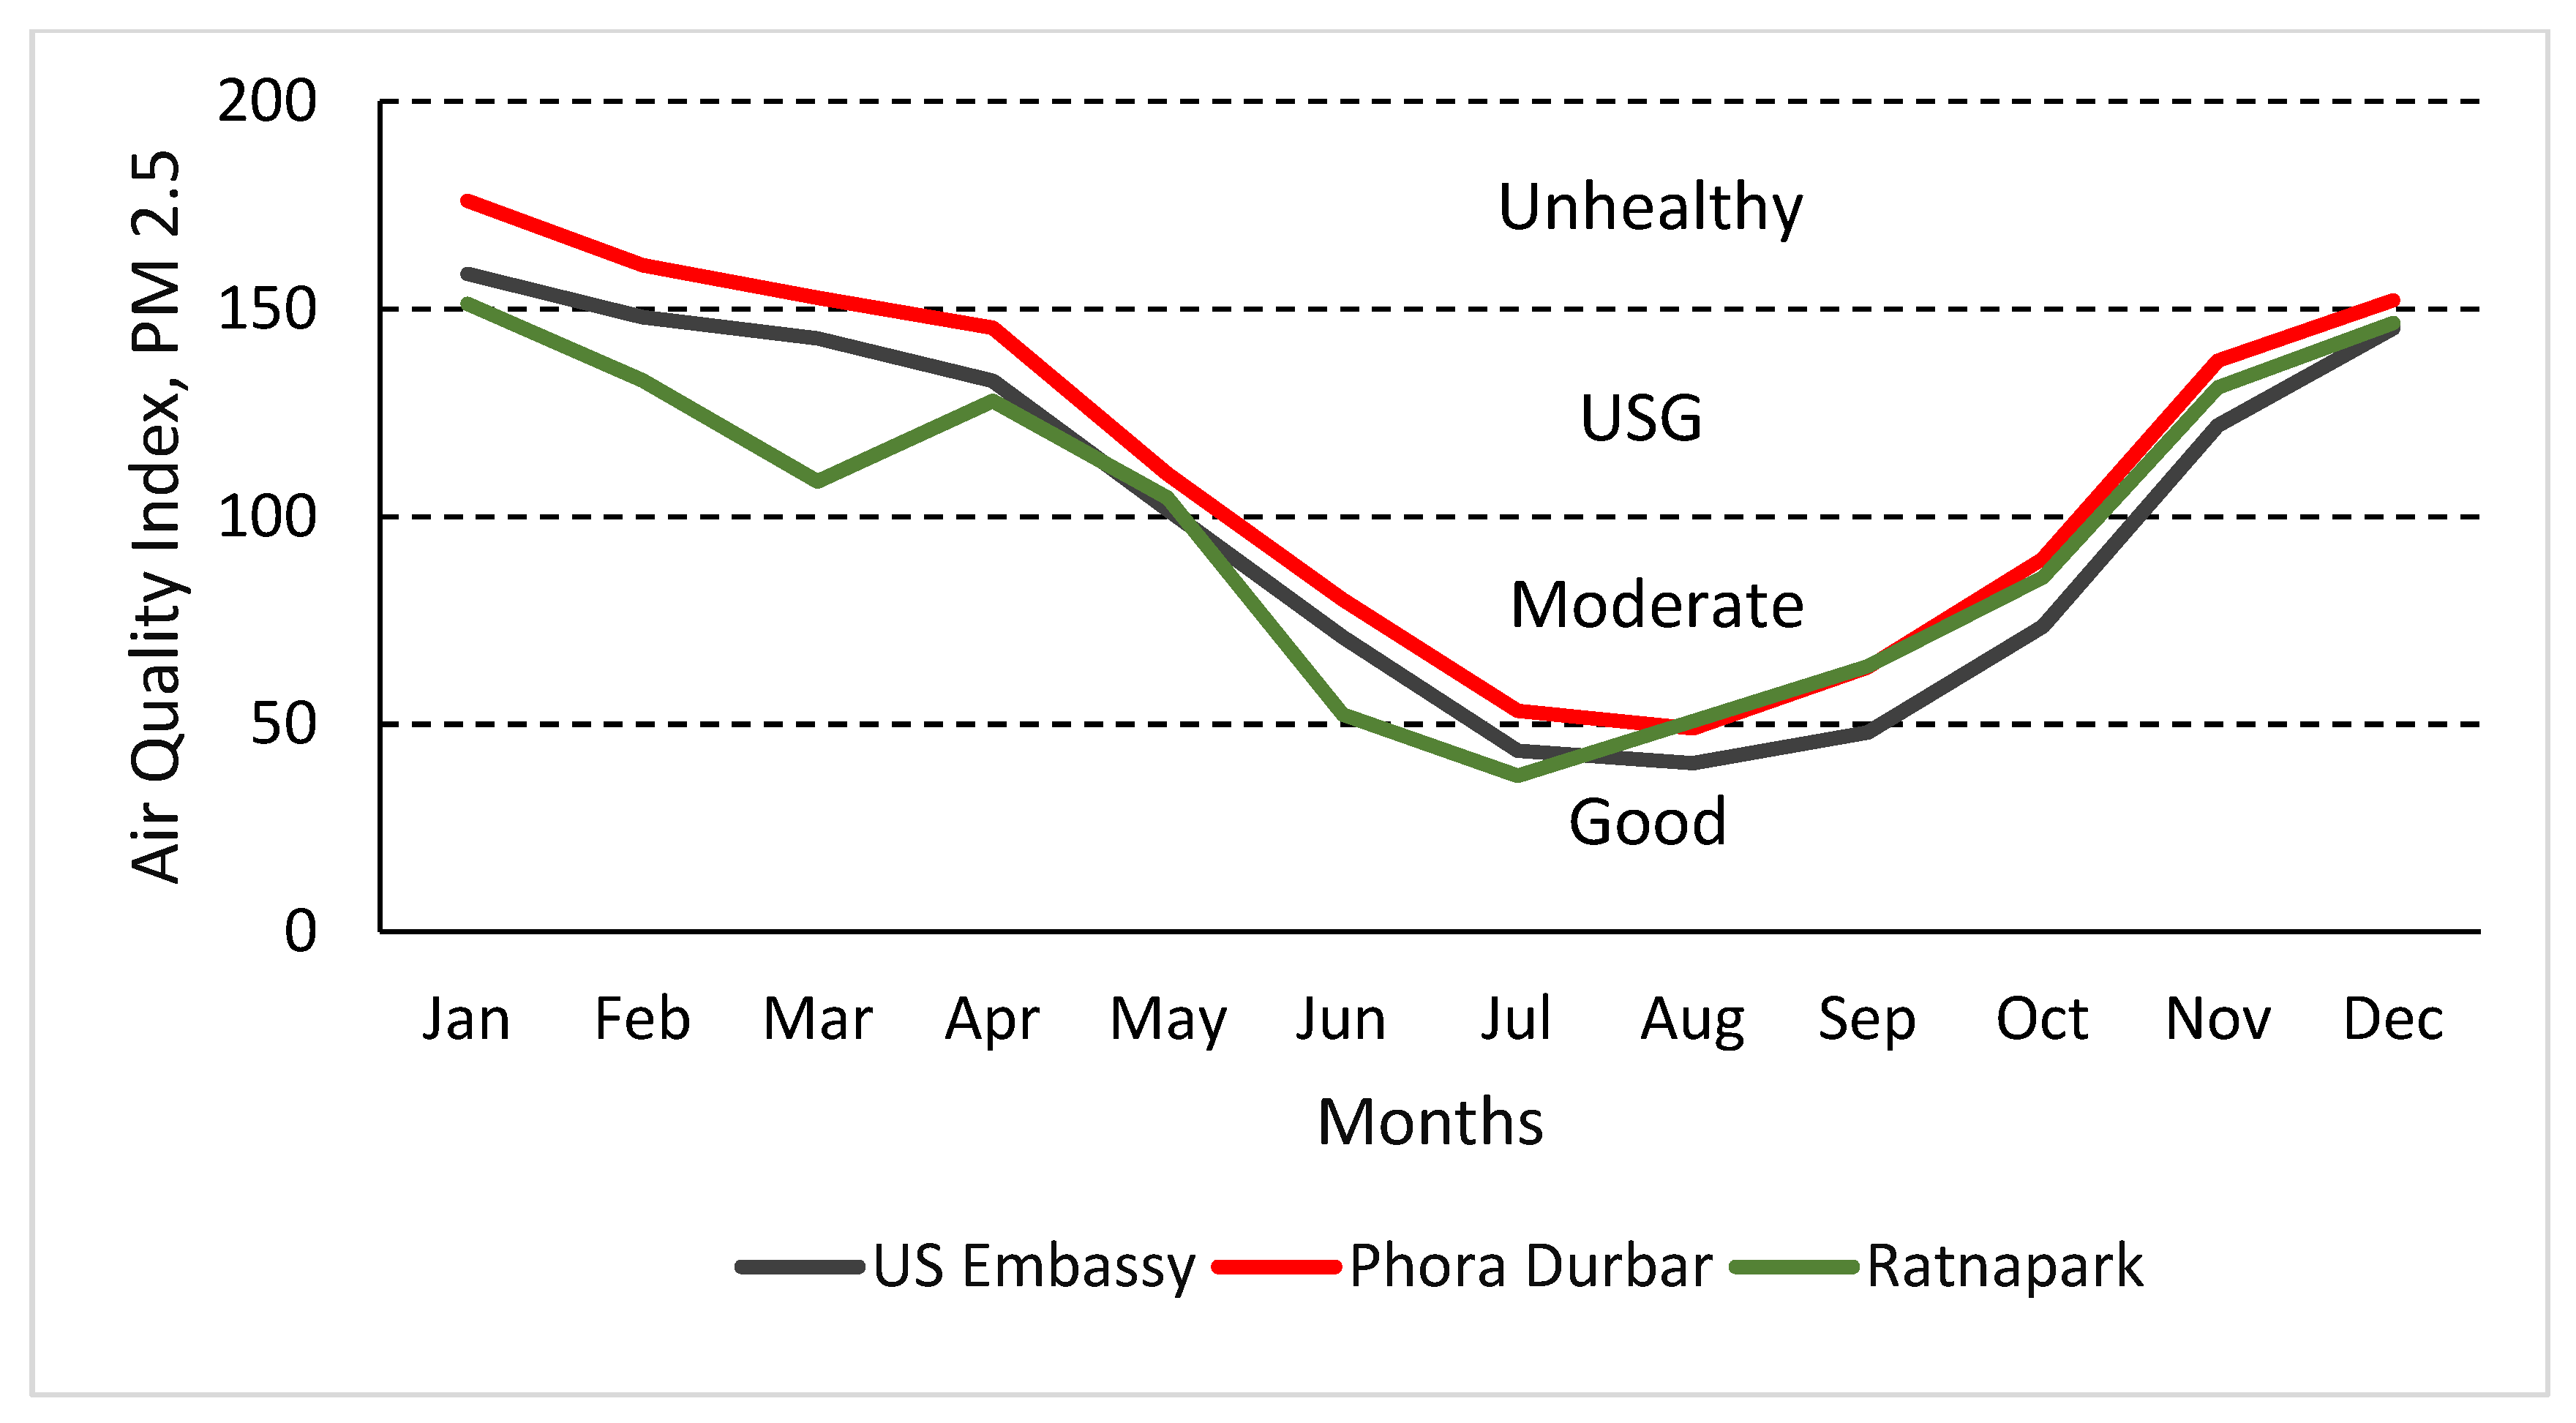
Figure 5 shows the Air Quality Index (AQI) monthly trends from three air quality monitoring stations: the U.S. Embassy, Phora Durbar, and Ratnapark in KMC. The air quality data from all three stations in KMC shows that air quality is the unhealthiest during the winter months (December, January, and February). Air pollution decreases from April to May, and air quality reaches a reasonable level during the summer months (June–September). Air pollution has an increasing trend from October to the winter.
Figure 6 shows the priority index for UGS establishment, aggregated at the ward level (left) and the fishnet level (right). These priority index maps show where UGS establishment should be prioritized. The results show that wards 4, 5, 7, 10, 12, 31, and 30 need great attention for UGS establishment. These wards have the highest score in terms of the composite priority index we developed for mitigating air pollution and the UHI effect in KMC. These wards that were categorized as very high based on our priority index are mostly dense residential zones identified by Humanitarian OpenStreetMap Team and Kathmandu Living Labs [50]. After investigating air quality at sites across Kathmandu, ICIMOD [49] reported that 87% of PM2.5 emissions come from residential areas. Furthermore, the proximity of these wards (except ward 12) to the airport and the low availability of the existing green spaces may be other contributing factors.
The two spatial units used for the priority index aggregated data at the administrative ward level and the 0.0025° fishnet level, which returned inconsistent results, known as the Modifiable Areal Unit Problem (MAUP). MAUP is a problem when the spatial data is adjusted by aggregating, zoning, segmentation, etc., across different boundary definitions [54]. The statistical results may be different due to the different data sets generated for each boundary definition used, contributing to a bias in the study. Data varies over space, and aggregating those data on different spatial units—(i) administrative ward level and (ii) fishnet level, caused variations in our results. For example, ward 3 falls in the medium priority index based on the ward-level results. Still, areas within ward three falls in the very high priority index based on the fishnet level results (Figure 6).
Similarly, wards 16 and 13 are categorized as high priorities, while wards 15 and 14 are ranked as medium priorities. Still, the fishnet level results show that these wards consist of patches of areas belonging to all four categories: very high, high, medium, and low priority. Those patches categorized as a very high priority in the fishnet level results may be due to industrial zones in those areas identified by Humanitarian OpenStreetMap and Kathmandu Living Labs [50]. The map aggregated by wards has not fully taken into account the areas that should be highly prioritized. However, both the ward level and the fishnet level results show a similar pattern.
Figure 7 illustrates that the highest value of NDVI in the wards that should be very highly prioritized based on our result is 0.36, which corresponds to the fact that these wards have sparse vegetation. The sparse vegetation condition of UGS in KMC may be due to a lack of proper management and planning, and we spotted discontinuous patches of open spaces within green spaces in the high-resolution Google Earth data. If efforts were made to transition these areas with sparse vegetation to dense vegetation, the UGS in the same parcel of land would have a better potential for UHI and air pollution mitigation. Therefore, instead of expanding the coverage of UGS, which is a severe challenge for a compact city like KMC due to the unavailability of land, resources should be directed towards proper planning and management for improving the vegetation condition of the existing UGS.
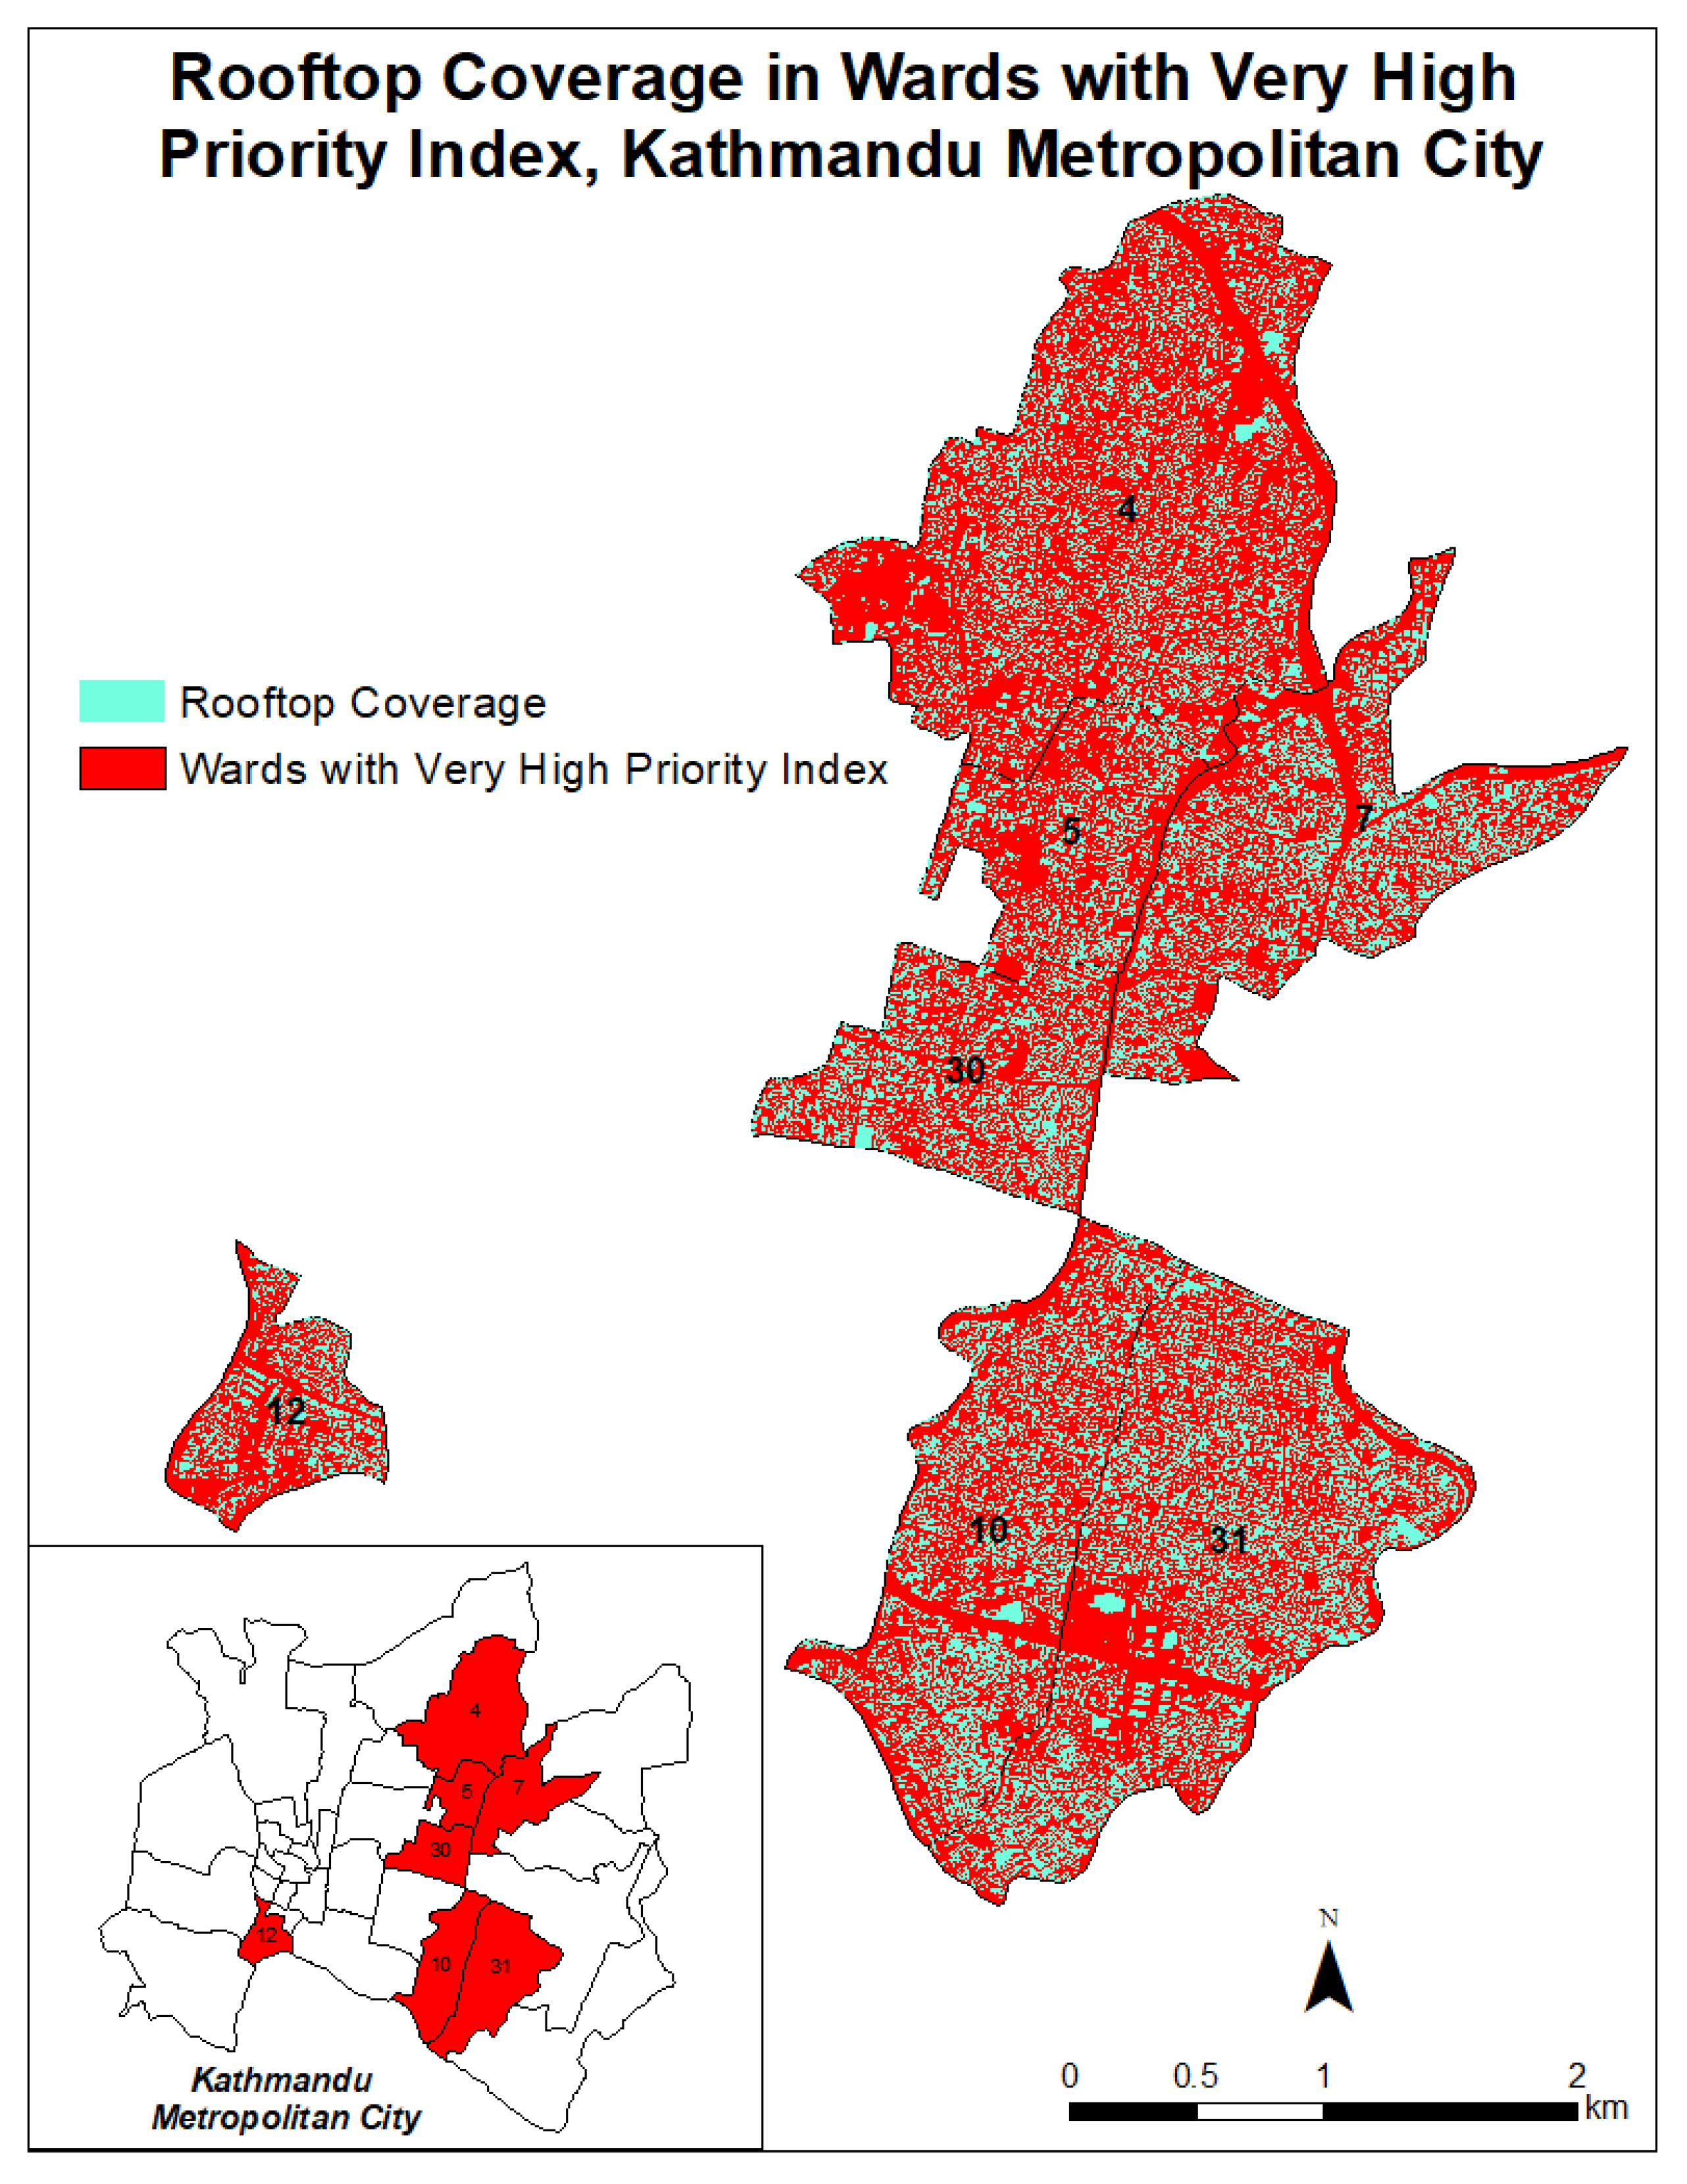
Figure 8 and Table 2 show the rooftop coverage in the wards that should be very highly prioritized for UGS establishment. The rooftop coverage percent ranges from 28.36% to 39.28%, which are very good coverage percents. While all the rooftops may not be available for UGS, the probability of establishing rooftop greenery looks high with this good coverage.

4. Discussion

Air pollution is still a serious problem in many urban areas around the world, especially in the urban areas of developing countries [55,56]. UGS may be used to reduce air pollution and mitigate the UHI effect. The National Urban Development Strategy (NUDS) 2017 focuses on the use of land and technology in a way that carbon emission and ambient temperature can be lowered and the UHI effect can be reduced. The NUDS 2017 mentions that one of the guiding principles for strategizing urban development is ensuring that the city is green and cool [57]. For this purpose, specific areas within KMC need UGS more than others, and our result indicates where such regions of high need are located. While the need for prioritization is essentially the interactive product of physical, social, economic, and contextual factors, this research only captures the physical aspect. Nepal is one of the developing countries where data collection, recording, documentation, and distribution have not yet been achieved, while the other regions of the world are effectively making data-driven decisions. Not much social and economic data are available in KMC for more accurately evaluating UGS prioritization. This research used the proxy indicators extracted from land use and land cover data using remote sensing techniques to develop a composite priority index, which only addresses some physical aspects for UGS prioritization evaluation. This method can be replicated and used in other parts of the world with similar data issues.
Considering how the result changes with the change in spatial scales of analysis and aggregation is important. This research includes two different levels of spatial units—the administrative wards and 0.0025° fishnet zones. Inconsistencies were generated between the results using these two different spatial units. Regardless of the variations, both results may play essential roles during the planning process. The ward-level results may be used when planning for wards of the entire KMC, whereas the fishnet-level results may be used when planning is done within wards. Seven out of 32 wards in KMC are in high need of UGS. These wards are located in dense residential zones, areas with small existing green spaces, or areas close to the airport.
There are two possibilities for the wards that should be highly prioritized to establish UGS in KMC. First, the vegetation conditions of the existing green spaces in KMC should be improved. Our results show that the existing green spaces in KMC are very small. If these existing small green spaces with sparse vegetation coverage were converted to ones with dense vegetation coverage, the use of the same land would have more contributions to mitigating the UHI effect and air pollution. The overall resiliency to air pollution and heat problems may be improved by compacting multi-layers of diverse plant species based on their mitigation potential [32]. Trees, among other plants, have more capacity to filter air pollutants and relieve heat stress [32]. Second, the roofs of buildings may be utilized to establish green spaces. This way, land can be used more efficiently as the same piece of land has dual uses—the buildings’ current purpose (residential or commercial) and rooftop greenery. Baniya et al. [42] suggested that green roof techniques should be practiced to mitigate the UHI effect in Kathmandu. We encourage the establishment of rooftop greenery starting from the wards with very high priority indices. Incentives could help stimulate the residents of KMC to establish rooftop greenery in their houses. Considering these potential ways in the planning process may help to minimize the current environmental problems in KMC, such as the UHI effect and the air pollution.
One of the limitations of our study is that the results are only effective if the target is to establish UGS in KMC to mitigate air pollution and the UHI effect. We prioritized the areas in KMC by assuming that establishing UGS in those areas will only contribute to mitigating the overall air pollution and the UHI effect in KMC. Planning based on our results for the other benefits of UGS, for example, mental health, natural hazards, and aesthetic values will not be effective. This is because we included the context-specific indicators during the development of the priority index. Our purpose here is to minimize air pollution and the UHI effect. In addition, considering the excellent coverage of the rooftop in KMC, as shown in our result, the possibility of rooftop greenery flourishing in KMC looks high. However, establishing rooftop greenery is more than just having space on the roof. The decision on this is primarily influenced by other factors, e.g., the building owner’s priority of the use of space, social and cultural acceptance, type of building material, plant species, etc. Further research needs to be undertaken to assess the potential of rooftop greenery in KMC in the near future.

5. Conclusions

Considering the importance of reducing the UHI effect and air pollution in KMC, and the role of UGS in heat and air pollution mitigation, we prioritized areas in KMC for UGS establishment so that the UHI effect and air pollution can be mitigated by developing a composite priority index. We also proposed potential ways to increase greenery in the high need wards according to our priority index. Since the NDVI of the existing UGS is very low, the first step should be improving the quality of existing UGS rather than increasing the quantity. This may be done by converting the existing sparse vegetation to dense vegetation, planting trees as they have exceptional heat and pollution mitigating potential over other types of plants, or multi-layering plant species. Findings also show that the high need wards have good rooftop coverage, and that rooftop greenery should be promoted.

Author Contributions

Conceptualization, S.B. and C.Z.; methodology, software, formal analysis, investigation, resources, data curation, and writing—original draft preparation, S.B.; writing—review and editing, C.Z.; visualization, S.B.; validation and supervision, C.Z. All authors have read and agreed to the published version of the manuscript.

Funding

This research is partially supported by USA NSF grants No. 2022036 and No. 2118102. Authors have the sole responsibility for all of the viewpoints presented in the paper.

Institutional Review Board Statement

Not applicable.

Informed Consent Statement

Not applicable.

Data Availability Statement

Not applicable.

Acknowledgments

The authors thank Sandor Ricketts for the critical suggestions and language editing, Marcello Graziano, Daniel Kraemer, and Bo Zhang for their helpful suggestions.

Conflicts of Interest

The authors declare no conflict of interest.

References

  1. Khanal, N.; Uddin, K.; Matin, M.A.; Tenneson, K. Automatic detection of spatiotemporal urban expansion patterns by fusing OSM and Landsat data in Kathmandu. Remote Sens. 2019, 11, 2296. [Google Scholar] [CrossRef] [Green Version]
  2. Ishtiaque, A.; Shrestha, M.; Chhetri, N. Rapid urban growth in the Kathmandu Valley, Nepal: Monitoring land use land cover dynamics of a himalayan city with Landsat imageries. Environments 2017, 4, 72. [Google Scholar] [CrossRef]
  3. Saud, B.; Paudel, G. The Threat of Ambient Air Pollution in Kathmandu, Nepal. J. Environ. Public Health 2018, 2018, 1–7. [Google Scholar] [CrossRef] [PubMed] [Green Version]
  4. Sarif, O.; Rimal, B.; Stork, N.E. Assessment of changes in land use/land cover and land surface temperatures and their impact on surface Urban heat Island phenomena in the Kathmandu Valley (1988–2018). ISPRS Int. J. Geo-Inf. 2020, 9, 726. [Google Scholar] [CrossRef]
  5. WHO. Air Pollution. 2022. Available online: https://www.who.int/health-topics/air-pollution#tab=tab_1 (accessed on 8 July 2022).
  6. Gautam, S.P.; Silwal, A.; Poudel, P.; Thapa, A.; Sharma, P.; Lamsal, M.; Neupane, R. Comparative Study of Ambient Air Quality Using Air Quality Index in Kathmandu City, Nepal. IOSR J. Environ. Sci. Toxicol. Food Technol. 2020, 14, 29–35. [Google Scholar] [CrossRef]
  7. Gurung, A.; Son, J.-Y.; Bell, M.L. Particulate matter and risk of hospital admission in the Kathmandu Valley, Nepal: A case-crossover study. Am. J. Epidemiol. 2017, 186, 573–580. [Google Scholar] [CrossRef] [Green Version]
  8. Cohen, A.J.; Brauer, M.; Burnett, R.; Anderson, H.R.; Frostad, J.; Estep, K.; Balakrishnan, K.; Brunekreef, B.; Dandona, L.; Dandona, R.; et al. Estimates and 25-year trends of the global burden of disease attributable to ambient air pollution: An analysis of data from the Global Burden of Diseases Study 2015. Lancet 2017, 389, 1907–1918. [Google Scholar] [CrossRef] [Green Version]
  9. Karki, K.B.; Dhakal, P.; Shrestha, S.L.; Joshi, H.D.; Aryal, K.K.; Poudyal, A.; Puri, S.; Verma, S.C.; Pokhrel, A.; Lohani, G.R.; et al. Situation Analysis of Ambient Air Pollution and Respiratory Effects in Kathmandu Valley, 2015; Nepal Health Research Council: Kathmandu, Nepal, 2016; pp. 1–234. [Google Scholar]
  10. Gurung, A.; Bell, M.L. The state of scientific evidence on air pollution and human health in Nepal. Environ. Res. 2013, 124, 54–64. [Google Scholar] [CrossRef]
  11. Manandhar, S. Environmental Activist Demand Prompt Action to Improve Kathmandu’s Air Quality; The Kathmandu Post: Kathmandu, Nepal, 2021. [Google Scholar]
  12. Rives, R.M. Assessing Changes in Actual Air Quality and Public Perceptions of Air Quality in Kathmandu Valley Nepal pre and post COVID-19 Lockdown. Master’s Thesis, University of South Florida, Tampa, FL, USA, 2022. [Google Scholar]
  13. Magar, S.G. Kathmandu’s Air Quality the Worst in the World. Onlinekhabar. 2021. Available online: https://english.onlinekhabar.com/kathmandus-air-quality-the-worst-in-the-world.html (accessed on 28 May 2022).
  14. Sharma, G. Nepal Battles Worst Forest Fires in Years as Air Quality Drops. Reuters. 2021. Available online: https://www.reuters.com/world/china/nepal-battles-worst-forest-fires-years-air-quality-drops-2021-04-09/ (accessed on 28 May 2022).
  15. Aljazeera. Nepal Closes Schools as Air Pollution Hits Alarming Levels. 2021. Available online: https://www.aljazeera.com/news/2021/3/30/nepal-closes-schools-as-air-pollution-hits-alarming-levels (accessed on 30 July 2022).
  16. Aryal, A.; Shakya, B.M.; Maharjan, M.; Talchabhadel, R.; Thapa, B.R. Evaluation of the Land Surface Temperature using Satellite Images in Kathmandu Valley. Nepal J. Civ. Eng. 2021, 1, 1–10. [Google Scholar] [CrossRef]
  17. Magar, D.S.; Magar, R.K.S.; Chidi, C.L. Assessment of urban heat island in Kathmandu valley (1999–2017). Geogr. J. Nepal 2021, 14, 1–20. [Google Scholar] [CrossRef]
  18. Stewart, I.D. A systematic review and scientific critique of methodology in modern urban heat island literature. Int. J. Climatol. 2011, 31, 200–217. [Google Scholar] [CrossRef]
  19. Rim, C.-S. The effects of urbanization, geographical and topographical conditions on reference evapotranspiration. Clim. Chang. 2009, 97, 483–514. [Google Scholar] [CrossRef]
  20. Hu, Y.; Jia, G.; Pohl, C.; Zhang, X.; van Genderen, J. Assessing surface albedo change and its induced radiation budget under rapid urbanization with Landsat and GLASS data. Theor. Appl. Climatol. 2016, 123, 711–722. [Google Scholar] [CrossRef]
  21. Kennedy, C.; Steinberger, J.; Gasson, B.; Hansen, Y.; Hillman, T.; Havránek, M.; Pataki, D.; Phdungsilp, A.; Ramaswami, A.; Mendez, G.V. Greenhouse gas emissions from global cities. Environ. Sci. Technol. 2009, 43, 7297–7302. [Google Scholar] [CrossRef]
  22. Opoku, E.E.O.; Boachie, M.K. The environmental impact of industrialization and foreign direct investment. Energy Policy 2020, 137, 111178. [Google Scholar] [CrossRef]
  23. Heaviside, C.; Macintyre, H.; Vardoulakis, S. The Urban Heat Island: Implications for Health in a Changing Environment. Curr. Environ. Health Rep. 2017, 4, 296–305. [Google Scholar] [CrossRef]
  24. Alfraihat, R.; Mulugeta, G.; Gala, T.S. Ecological Evaluation of Urban Heat Island in Chicago City, USA. J. Atmos. Pollut. 2016, 4, 23–29. [Google Scholar] [CrossRef]
  25. Ningrum, W. Urban Heat Island towards Urban Climate. IOP Conf. Ser. Earth Environ. Sci. 2018, 118, 012048. [Google Scholar] [CrossRef]
  26. Wong, K.V.; Paddon, A.; Jimenez, A. Review of World Urban Heat Islands: Many Linked to Increased Mortality. J. Energy Resour. Technol. 2013, 135, 022101. [Google Scholar] [CrossRef]
  27. Bernardo, L.M.; Crane, P.A.; Veenema, T.G. Treatment and prevention of pediatric heat-related illnesses at mass gatherings and special events. Dimens. Crit. Care Nurs. 2006, 25, 165–171. [Google Scholar] [CrossRef]
  28. Bouchama, A.; Knochel, J.P. Heat stroke. N. Engl. J. Med. 2002, 346, 1978–1988. [Google Scholar] [CrossRef] [PubMed]
  29. Priyadarsini, R. Urban heat island and its impact on building energy consumption. Adv. Build. Energy Res. 2009, 3, 261–270. [Google Scholar] [CrossRef]
  30. Bhargava, A.; Lakmini, S.; Bhargava, S. Urban Heat Island Effect: It’s Relevance in Urban Planning. J. Biodivers. Endanger. Species 2017, 5, 1–4. [Google Scholar] [CrossRef]
  31. Lorenzini, G.; Pellegrini, E.; Campanella, A.; Nali, C. It’s not just the heat and the drought: The role of ozone air pollution in the 2012 heat wave. Agrochimica 2014, 58, 40–52. [Google Scholar] [CrossRef]
  32. Zupancic, T.; Westmacott, C.; Bulthuis, M. The Impact of Green Space on Heat and Air Pollution in Urban Communities: A Meta-Narrative Systematic Review; David Suzuki Foundation: Vancouver, BC, Canada, 2015; Available online: https://policycommons.net/artifacts/1202600/the-impact-of-green-space-on-heat-and-air-pollution-in-urban-communities/1755709/ (accessed on 12 August 2022).
  33. Smith, W.H. Air Pollution and Forests: Interactions Between Air Contaminants and Forest Ecosystems; Springer: New York, NY, USA, 2012. [Google Scholar]
  34. Nowak, D.J.; Crane, D.E.; Stevens, J.C. Air pollution removal by urban trees and shrubs in the United States. Urban For. Urban Green. 2006, 4, 115–123. [Google Scholar] [CrossRef]
  35. Taha, H. Modeling impacts of increased urban vegetation on ozone air quality in the South Coast Air Basin. Atmos. Environ. 1996, 30, 3423–3430. [Google Scholar] [CrossRef]
  36. Bowler, D.; Buyung-Ali, L.; Knight, T.; Pullin, A. How Effective is ‘Greening’ of Urban Areas in Reducing Human Exposure to Ground Level Ozone Concentrations, UV Exposure and the ‘Urban Heat Island Effect’? Available online: www.environmentalevidence.org/SR41.html (accessed on 12 August 2022).
  37. McGinn, C.E. The Microclimate and Energy Use in Suburban Tree Canopies (California). Ph.D. Thesis, University of California, Davis, CA, USA, 1982. [Google Scholar]
  38. Heisler, G.M. Energy savings with trees. J. Arboric. 1986, 12, 113–125. [Google Scholar] [CrossRef]
  39. Loughner, C.P.; Allen, D.J.; Zhang, D.-L.; Pickering, K.E.; Dickerson, R.R.; Landry, L. Roles of urban tree canopy and buildings in urban heat island effects: Parameterization and preliminary results. J. Appl. Meteorol. Climatol. 2012, 51, 1775–1793. [Google Scholar] [CrossRef]
  40. Akbari, H.; Kurn, D.M.; Bretz, S.E.; Hanford, J.W. Peak power and cooling energy savings of shade trees. Energy Build. 1997, 25, 139–148. [Google Scholar] [CrossRef] [Green Version]
  41. Gautam, D.R. Air pollution: Its causes & consequences with reference to Kathmandu Metropolitan City. Third Pole 2010, 8, 27–33. [Google Scholar]
  42. Baniya, B.; Techato, K.; Ghimire, S.K.; Chhipi-shrestha, G. A Review of Green Roofs to Mitigate Urban Heat Island and Kathmandu Valley in Nepal. Appl. Ecol. Environ. Sci. 2018, 6, 137–152. [Google Scholar] [CrossRef]
  43. Shrestha, S.; Baral, B.; Dhital, N.B.; Yang, H.H. Assessing air pollution tolerance of plant species in vegetation traffic barriers in Kathmandu Valley, Nepal. Sustain. Environ. Res. 2021, 31, 1–9. [Google Scholar] [CrossRef]
  44. Kanwar, K.; Dhamala, M.K.; Maskey-Byanju, R. Air pollution tolerance index: An approach towards the effective green belt around Kathmandu metropolitan city, Nepal. Nepal J. Environ. Sci. 2016, 4, 23–29. [Google Scholar] [CrossRef] [Green Version]
  45. U.S. Geological Survey. Landsat 8-9 OLI/TIRS Collection 2 Level 2. 2017. Available online: https://earthexplorer.usgs.gov/ (accessed on 25 April 2022).
  46. World Air Quality Project. Air Quality Historical Data. 2022. Available online: https://aqicn.org/data-platform/register/ (accessed on 10 June 2022).
  47. US EPA. Particulate Matter (PM2.5) Trends. United States Environmental Protection Agency. 2022. Available online: https://www.epa.gov/air-trends/particulate-matter-pm25-trends (accessed on 22 August 2022).
  48. Bondarenko, M.; Kerr, D.; Sorichetta, A.; Tatem, A.J.; WorldPop. Census/Projection-Disaggregated Gridded Population Datasets for 189 Countries in 2020 Using Built-Settlement Growth Model (BSGM) Outputs. 2020. Available online: https://hub.worldpop.org/geodata/summary?id=49839 (accessed on 31 March 2022).
  49. ICIMOD. Investigating air quality in the Kathmandu Valley: The need for data. ICIMOD, Atmosphere Initiative. 2021. Available online: https://www.icimod.org/investigating-air-quality-in-the-kathmandu-valley-the-need-for-data/ (accessed on 23 March 2022).
  50. Humanitarian OpenStreetMap Team. METEOR: Site Visits with Kathmandu Living Labs in Nepal. OpenStreetMap. 2018. Available online: https://www.hotosm.org/updates/meteor-site-visits-with-kathmandu-living-labs-in-nepal/ (accessed on 18 March 2022).
  51. OpenStreetMap contributors. Planet dump. OpenStreetMap. 2020. Available online: https://planet.openstreetmap.org/ (accessed on 3 May 2021).
  52. Kwan, M.P. The Uncertain Geographic Context Problem. Ann. Assoc. Am. Geogr. 2012, 102, 958–968. [Google Scholar] [CrossRef]
  53. Apparicio, P.; Gelb, J.; Dubé, A.S.; Kingham, S.; Gauvin, L.; Robitaille, É. The approaches to measuring the potential spatial access to urban health services revisited: Distance types and aggregation-error issues. Int. J. Health Geogr. 2017, 16, 1–24. [Google Scholar] [CrossRef] [PubMed]
  54. Wong, D.W.S. The Modifiable Areal Unit Problem (MAUP). In WorldMinds: Geographical Perspectives on 100 Problems; Springer: Dordrecht, The Netherlands, 2004; pp. 571–575. [Google Scholar] [CrossRef]
  55. Van Khuc, Q.; Nguyen, M.-H.; Le, T.-T.; Nguyen, T.-L.; Nguyen, T.; Lich, H.K.; Vuong, Q.-H. Brain Drain out of the Blue: Pollution-Induced Migration in Vietnam. Int. J. Environ. Res. Public Health 2022, 19, 3645. [Google Scholar] [CrossRef] [PubMed]
  56. Van Khuc, Q.; Phu, T.V.; Luu, P. Dataset on the Hanoian suburbanites’ perception and mitigation strategies towards air pollution. Data Br. 2020, 33, 106414. [Google Scholar] [CrossRef]
  57. Ministry of Urban Development. National Urban Development Strategy 2017; Government of Nepal: Kathmandu, Nepal, 2017.
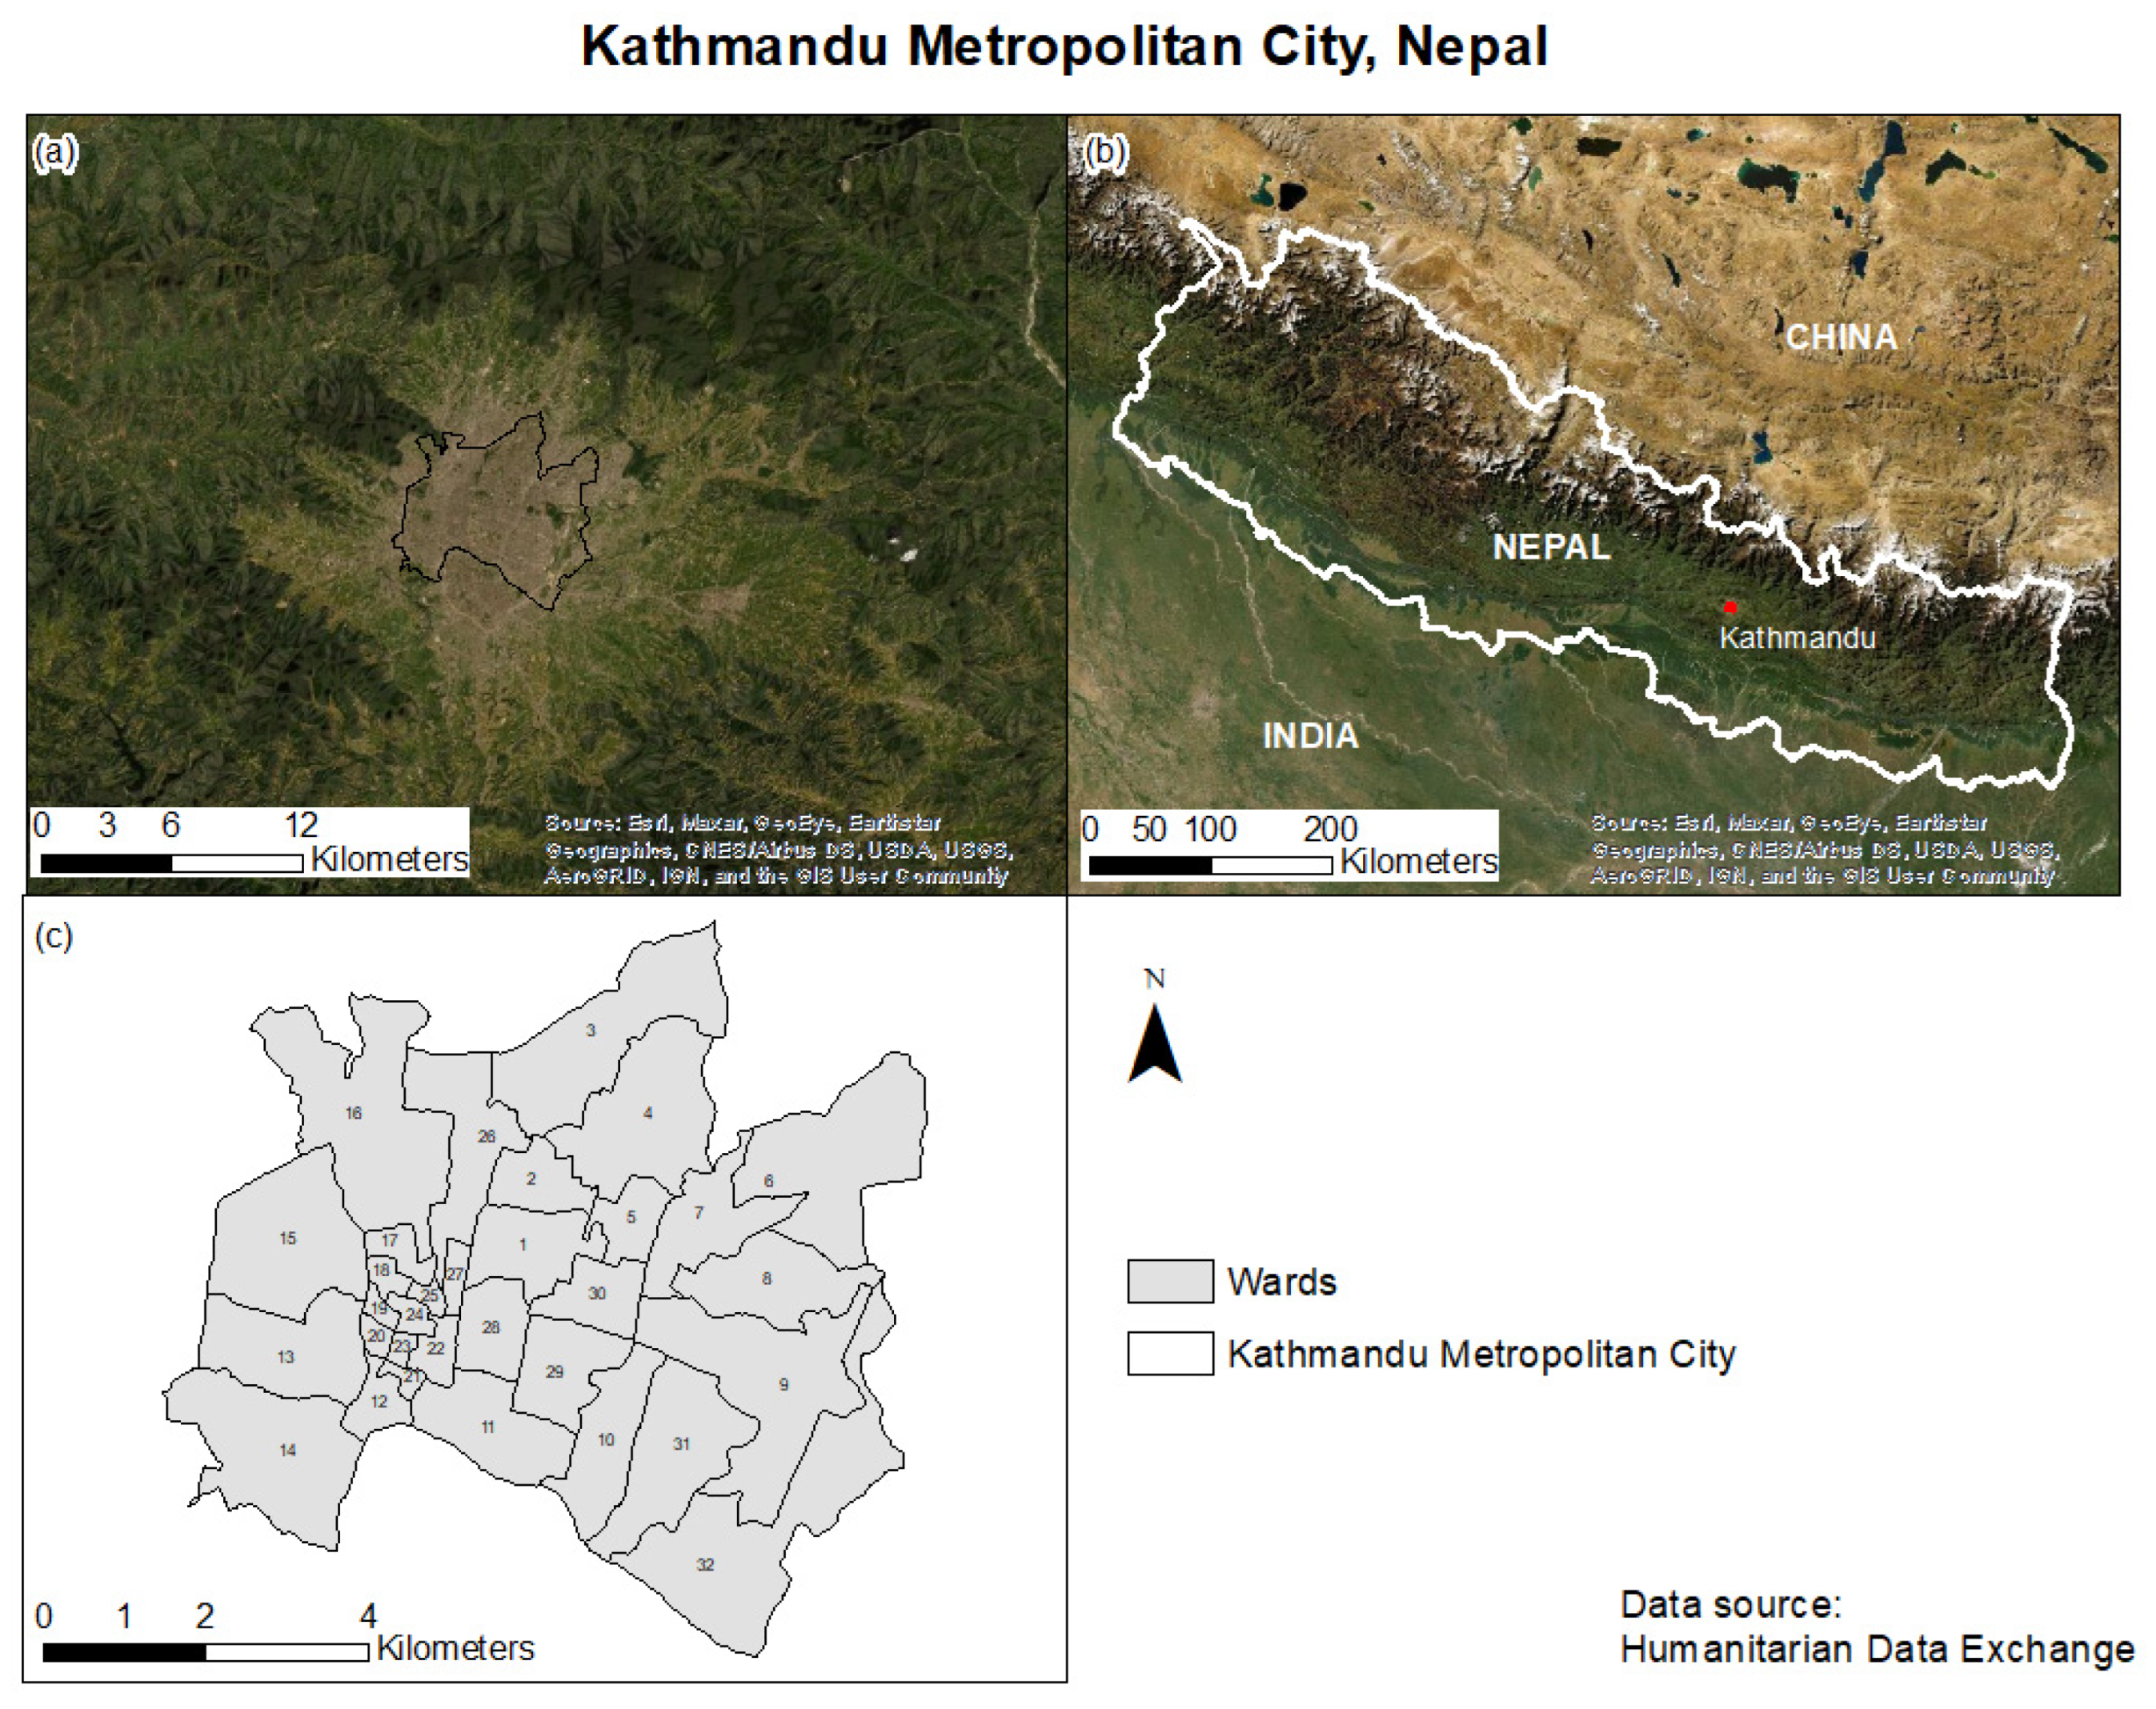
Figure 1. Kathmandu Metropolitan City, Nepal; (a) Geographic location of KMC; (b) Land cover comparison between KMC and its surrounding; (c) Administrative wards in KMC.
Land 11 02074 g001
Figure 2. Administrative Ward-level (left) VS 0.0025° Fishnet-level (right) division of Kathmandu Metropolitan City.
Land 11 02074 g002
Figure 3. Flowchart of the methodology.
Land 11 02074 g003
Figure 4. Land Surface Temperature Maps of KMC for the years of 2017, 2018, and 2021.
Land 11 02074 g004
Figure 5. Monthly Air Quality Index (AQI) trends from three air quality monitoring stations in KMC.
Land 11 02074 g005
Figure 6. The Priority Index for UGS establishment—aggregated at the ward level (left) and the fishnet level (right).
Land 11 02074 g006
Figure 7. Normalized Difference Vegetation Index in Kathmandu Metropolitan City’s wards with very high priority index.
Land 11 02074 g007
Figure 8. Rooftop Coverage in Kathmandu Metropolitan City’s wards that should be highly prioritized for Urban Green Space establishment.
Land 11 02074 g008
Table 1. Indicators of Composite Index for UGS establishment to mitigate the UHI effect and air pollution.
DimensionIndicatorsExplanationData Sources
ProblemsPopulationRapid population growth is responsible for rapid urbanization, which causes environmental problems that include UHI and air pollution [1,2,3,4].WorldPop Open Population Repository [48]
Built-up areaThe characteristics of the built-up area result in low evapotranspiration, increased solar radiation absorption, and higher retention of infrared radiation [19,20].Landsat 8 Collection 2 Level 2 product [45]
LSTAn increase in LST affects the local climate, causes an increase in ground-level ozone production, and degrades air quality. It is also associated with heat-related illness and mortality [26,27,28,30,31].Landsat 8 Collection 2 Level 2 product [45]
Residential areaOne of the primary sources of emissions in Kathmandu is the residential area, which can generate large household combustion [49].OpenStreetMap [50]
Industrial areaIndustrialization is a common source of air pollution globally. Greenhouse gases added to the atmosphere from industries contribute to increasing temperature [5,6,21,22].OpenStreetMap [51]
TransportationThe transportation sector is one of Kathmandu’s significant sources of air pollution. Vehicle emissions also contribute to the increase in temperature [21,49]. OpenStreetMap [51]
SolutionsExisting green areaUGS helps mitigate the UHI effect and improve air quality [32,36].Landsat 8 Collection 2 Level 2 product [45]
Normalized Difference Vegetation Index (NDVI)NDVI is the measurement of vegetation amount and condition. UGS with higher NDVI have more capacity to mitigate the UHI effect and improve air quality [32].Landsat 8 Collection 2 Level 2 product [45]
Table 2. Rooftop Coverage in Kathmandu Metropolitan City’s wards that should be very highly prioritized for Urban Green Space establishment.
WardsRooftop
Coverage (%)
428.36
531.47
735.80
1036.90
1231.71
3039.28
3139.21
Publisher’s Note: MDPI stays neutral with regard to jurisdictional claims in published maps and institutional affiliations.