Article

Urban Agglomeration Ecological Welfare Performance and Spatial Convergence Research in the Yellow River Basin

1
School of Statistics, Lanzhou University of Finance and Economics, Lanzhou 730020, China
2
Center for Quantitative Analysis of Gansu Economic Development, Lanzhou 730020, China
*
Author to whom correspondence should be addressed.
Land 2022, 11(11), 2073; https://doi.org/10.3390/land11112073
Submission received: 7 September 2022 / Revised: 13 October 2022 / Accepted: 14 November 2022 / Published: 17 November 2022

Abstract

:
As human society is entering an era of scarce natural resources, realizing the welfare level of human society is a fundamental requirement to improve sustainable development, while being restrained by the ecological environment. In this paper, we divided ecological welfare performance (EWP) into an ecological economic system and an economic welfare system from the perspective of ecological welfare, and predicted the EWP in the Yellow River Basin Urban Agglomerations (YRBUAs) using the US-NSBM model in two stages. We further explored the dynamic change trend and spatial convergence characteristics in the YRBUAs using the Dagum Gini coefficient, the kernel density estimation method, and the spatial convergence models. The results indicate that there are great spatial variations in EWP in the YRBUAs, where the spatial variation in the downstream is higher than that in the upstream, and the spatial distribution pattern in large- and medium-sized cities is higher than that in small cities. The DEA efficiency could not be realized overall throughout the study period, but it shows an improving trend. At the same time, absolute β convergence and conditional β convergence were observed in the YRBUAs, both overall and between the UAs. This paper provides a basis for analyzing the spatial pattern of EWP and for promoting the coordinated development of urban agglomerations in the YRBUAs, thus serving as a reference for the sustainable development of ecologically sensitive regions in countries across the world.

1. Introduction

Human society is changing from a relatively rich “empty world” of natural capital to a “full world” restrained by the ecological environment [1,2,3,4,5]. In this full world, natural capital has become an essential production factor that cannot be replaced by man-made capital. In this way, natural resources certainly become key factors affecting human societal welfare development. Therefore, constantly improving the social welfare level is a necessary path to realizing sustainable development under ecological and environmental constraints [5,6]. Based on the sustainability research, it has been stated, by some scholars, that the ultimate goal that human beings seek is the improvement of welfare, rather than economic growth, according to the principle of ecological economy [7,8]. In the new century, industrialization and urbanization have developed rapidly at the expense of the ecological environment, leading to effects, such as ecosystem degradation, environmental pollution, high consumption, and so on, which have restrained the sustainable development of economic societies. The Chinese government has paid attention to environmental protection and has implemented a large number of policies to promote green and sustainable development since the 1990s. However, local governments have failed to preserve the ecological environment to a desired level under the pressure of traditional GDP evaluation. There are obvious ecological environment-related problems caused by economic growth. This is an important issue to be considered by the Chinese government at all levels, in order to effectively improve ecological efficiency under this background, as well as to provide an important connotation and path for promoting high-quality development of the economy.
As information technology develops and economic structure networking trends strengthen, isolated cities are gradually becoming characterized by closely associated planar urban agglomerations acting as important material carriers for economic development [9]. However, regional un-coordination is becoming more and more prominent as China’s economy enters the new normal [10]. The YRB is an important ecological barrier and economic zone in China, and President Xi Jinping has emphasized that ecological protection and high-quality development along the YRB must adhere to ecological priority and green development. Over the past 70 years (i.e., since the founding of New China), the government has attached great importance to the management and development of the YRB, and has achieved remarkable results in water and sand management, as well as flood prevention and mitigation, which have had positive impacts on ecological protection, sustainable economic development, and improvement of people’s living standards. However, there are still outstanding problems, such as the serious situation of water resource security, the fragile ecological environment of the basin, and the quality of regional development still needing to be improved [11]. A series of problems along the YRB have arisen due to its unique geographical conditions, such as poor economic contact, weak consciousness of regional labor division and coordination, incomplete high-efficiency coordination and development mechanism, poor level of river basin governance system, governance capability for modernization, and so on [12]. On the one hand, urban agglomeration is the main direction of regional coordinated development along the YRB, which is a key developmental region for optimization and a main functional area in China. On the other hand, obvious differences in ecological efficiencies have presented, due to the developmental foundation and path of the YRBUAs. Meanwhile, the development of urban agglomeration leads to more frequent material and energy exchanges, but poses serious challenges with respect to the urban ecological environment. Therefore, clarifying the differences in ecological efficiency regarding urban agglomeration is of great significance to explore the implementation path of high-quality development in the YRBUAs, in order to promote coordinated development and to achieve the strategic objective of high-quality development of economic society along the YRB.
An important issue for urban agglomeration and regional development in the YRB is how to effectively improve the efficiency of urban ecological welfare under existing background. It is not only a necessary response to innovative development and green development, but is also an important connotation and a means to promote high-quality development of the regional economy. Therefore, it is of great significance to clarify the differences in the ecological efficiency of urban agglomerations, to understand the differences in the development of urban agglomerations, and to promote the coordinated development of urban agglomerations (and, even, the whole region).
This paper aims to determine the differences and sources of urban agglomeration ecological welfare efficiency along the YRB, in order to select the relevant influential factors. We explore the impact process and extent of the spatio–temporal evolution of ecological welfare performance through statistical methods and propose the internal formation mechanism and comprehensive effect of the urban EWP according to the reality of regional development, in order to effectively improve the welfare level of residents in terms of the ecological threshold and promote urban–ecological civilization construction.
The remainder of this paper is structured as follows. The second section provides a review of the related literature. The third section introduces the methods and materials used in this study. The fourth section—the empirical analysis—interprets the empirical results. The fifth section provides our conclusions.

2. Literature Review

Daly, H.E. et al. [13] first proposed EWP, which originated from the sustainable development concept. They evaluated the sustainable development status throughout the country by calculating the welfare level, in terms of natural consumption, within each unit. It was emphasized that the energy and materials obtained by human beings are derived from the ecological system, and that the wastes discharged into the ecological system must be controlled within the bearing capacity of the ecological environment; otherwise, unsustainable development will occur. However, they did not propose an indicator to quantify EWP. Rees [14] used the ecological footprint as a quantitative measure of human consumption of natural resources, which has been widely accepted by academics. Wackernage [15] further refined the ecological footprint theory by adding the premise that it can be used to determine whether a country or region is developing within its ecological carrying capacity in the context of current management regimes. The concept of the ecological footprint developed by Wackernage has gradually become the most comprehensive indicator of human consumption of natural resources or ecological impact. However, some scholars have questioned the ecological footprint theory, arguing that the ecological footprint indicators are still imperfect [16]. Dietz [17] created a composite indicator that includes human consumption of natural resources and pollution emissions to replace the ecological footprint, while Abdallah [18] proposed the Happy Planet Index to evaluate EWP based on data from 143 countries around the world, offering a new direction for humanity to achieve a good life with limited resources. Jorgenson [19], on the other hand, used the ratio between human well-being and environmental stress to measure social sustainability, and found that income inequality also has an impact on EWP. Based on Daly’s idea, Zhu, D.J. et al. [6] and Zhang et al. [20] further developed the concept of EWP using a human development index (HDI) considering social and economic welfare. Their EWP integrates ecological environment, economic growth, and social development in order to achieve the maximum welfare output under the minimum ecological environment, thus maintaining an all-win harmony between the environment, the economy, and the society. More attention to the inner quality of human societal development is considered in their EWP. Therefore, it has been stated by some scholars that it is an upgrade to ecological efficiency [21,22], which provides a new research perspective and an analytical tool for sustainable development.
Under a certain ecological input or welfare level, ecological welfare can reflect the sustainable developmental degree of a nation, region, or city. For example, Common [23] calculated the national EWP using a ratio of human satisfaction to environmental input. However, Knight and Rosa [24] considered life satisfaction and ecological footprint for the welfare level and natural input index, respectively. Dietz [25] defined EWP as a ratio between life expectancy and ecological footprint, and further calculated the EWP for 58 countries around the world. It was found that per capita GDP and EWP have a U-shaped relationship. Zhou [26] found that urban ecological efficiency in China presents a W-shaped timing characteristic and step-like decrease with respect to regional difference. Yao, L. [27] conducted spatial correlation analysis and explored the influence of geographic spatial pattern on EWP in China. Moreover, it has been observed by some scholars that, from the perspective of ecological input, there are many problems in most cities in China, such as input redundancy, insufficient benefit output, and excessive environmental efficiency output, among others [28]. Meanwhile, there is heterogeneity in the EWP of cities in China, with significant differences in EWP between industry-oriented cities, resource-based cities, and comprehensive cities [29].
It can be seen from the analyses above that most scholars have calculated EWP using a single ratio method (e.g., the ratio between welfare level and natural consumption); however, some scholars believe that there is a certain defect of such ratio methods, as excessive ratio change may occur due to fluctuations in the numerator and denominator. The core concept of EWP is to minimize environmental resource consumption and maximize the welfare level, as consistent with the core concept of the DEA model. Therefore, some scholars have used the DEA method or extended SBM method for analysis [30]. The existing research results can help us better understand sustainable development and ecological welfare. However, there is little room for expansion. For example, in the aspect of research scale, the existing literature has mostly focused on research targets at the country, province, or city level. However, there have been no in-depth studies on urban agglomeration, where the EWP evaluation of urban agglomeration focuses on the change principle of similar cities or cities of similar size, which is quite different from the single-city evaluation approach. First, the research method differs from single ratio- and Super-SBM-based DEA analytical methods. We have previously expounded the defects of the former, while the latter regards the whole ecological welfare transformation process as a black box, which fails to recognize the validity of phase or to solve the optimization problem of key performance index. Therefore, in this paper, we adopt a network DEA model with high-efficiency and undesirable outputs: the US-NSBM. It divides EWP into production and service phases, and opens the black box of the traditional DEA model in order to reveal the general principle of EWP evolution. Second, we conduct quantitative research on the spatial variation of urban EWP, according to the Dagum Gini coefficient, the kernel density estimation method, and the spatial convergence models, which can help to reveal the general ecological variation and dynamic change in urban agglomerations. Third, there has been little research on the convergence analysis of urban agglomeration EWP. It is crucially important to understand urban agglomeration EWP in China. Therefore, five major urban agglomerations along the YRB, comprising an important force for the high-quality development of YRB, are considered in order to assess whether the rapid growth of the economy improves the welfare level of residents. Namely, we take the five major urban agglomerations along the YRB as the study area and study the spatial variation, distribution dynamics, and convergence of the YRBUAs.

3. Materials and Methods
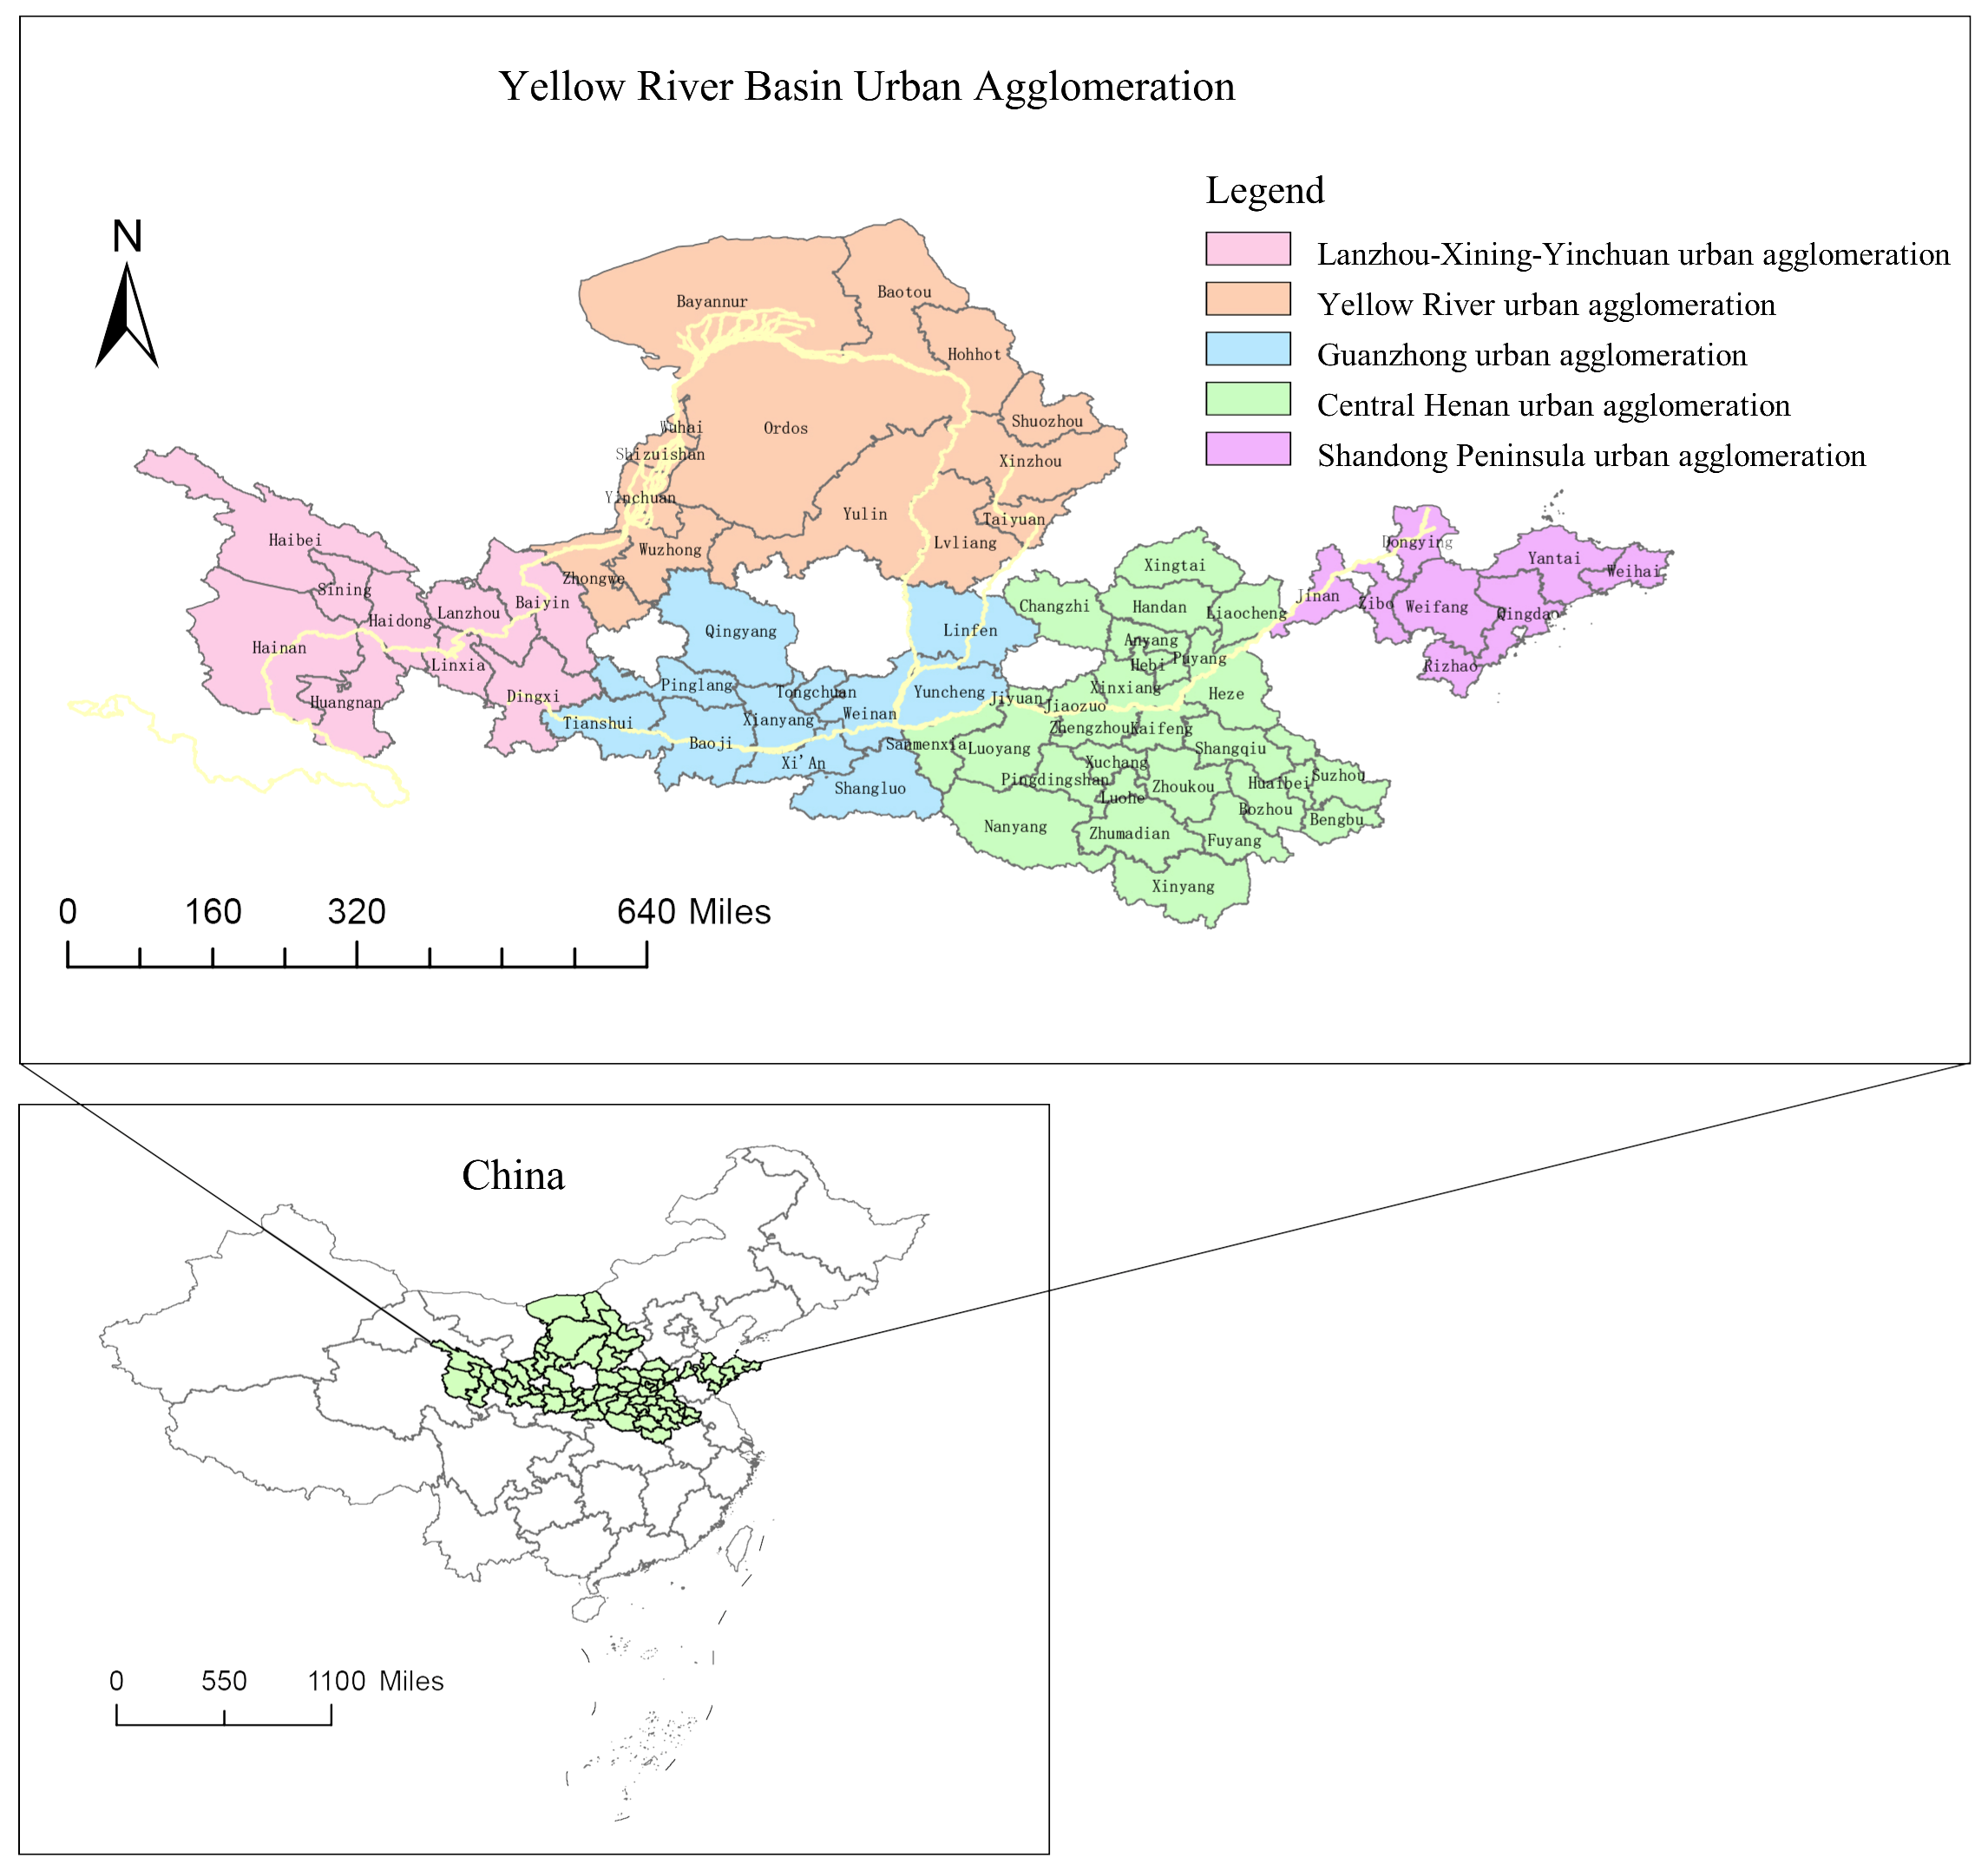
3.1. Study Area

The Yellow River Basin (YRB) is one of the typical geographical units of regional development in China, running through the east, central, and western regions of China. The main tributaries of the Yellow River flow through the nine provinces and districts of Qinghai, Sichuan, Gansu, Ningxia, Inner Mongolia, Shanxi, Shaanxi, Henan, and Shandong-related county-level administrative regions, with a land area of about 1.3 million square kilometers. It is an important ecological barrier and energy basin in China.
According to the seventh census data, the urbanization rate of eight provinces along the Yellow River exceeded 60% in 2020, and the populations of Xi’an, Zhengzhou, Jinan, and other central cities exceeded 10 million, with a collective GDP of over a trillion RMB. The YRB is gradually forming a five-pole developmental pattern, including the Shandong UA, Central Henan UA (Figure 1), Guanzhong UA, Yellow River UA, and Lanzhou–Xining–Yinchuan (LXY) UA, and is also comprising a regional economic development growth pole and the main carrier of the YRB population and productivity layout. However, the Yellow River has become “weak and sickly”, with poor ecological background. Data from the National Bureau of Statistics of China (https://data.stats.gov.cn/easyquery.htm?cn=C01, accessed on 11 June 2022) indicate that, in 2019, the water resources of the YRB were only 7.6% that of the Yangtze River basin, and the per capita possession was only 27% of the national average, while the efficient water use area of the YRB only accounted for 20.59%. At the same time, the proportion of energy- and petrochemical-related industries in the main industrial business income of the regions along the Yellow River remained high in 2019, with the high-tech manufacturing industry accounting for 8.3% (much lower than the national average of 15%). In six provinces, including Inner Mongolia (2.3%), Gansu (3.0%), Ningxia (3.8%), Qinghai (5.6%), Shanxi (6.0%) and Shandong (7.0%), high-tech manufacturing accounted for less than 7%; this was less than half of the national average. Due to the unique geographical conditions of the Yellow River Basin, the development of various regions along the Yellow River still suffers from strong economic ties, weak awareness of regional division of labor and collaboration, imperfect mechanisms of efficient and coordinated development, and low levels of modernization of the basin governance system and governance capacity.

3.2. Research Method

3.2.1. Two-Phase US-NSBM Model

The DEA method, a kind of optimal concept based on Pareto, was first proposed by Charnes [31]. It can be used to evaluate non-parametric methods of production, in terms of advanced evaluation of DMU efficiency and calculation of the relative efficiency of multiple-input and -output DMUs. The core concept of EWP is to minimize environmental resource consumption while maximizing welfare level, which is consistent with the core concept of the DEA model. Moreover, the DEA method has been widely applied to the evaluation of ecological efficiency in recent years, as it does not need pre-determined decision unit functional relationships or output data.
However, the traditional DEA method is calculated based on the radial angle, and it is required that all inputs are expanded or reduced in the same proportion while ignoring slack variables, which can easily lead to errors in the result. Furthermore, not all outputs are expected by decision makers in practical application. There are some outputs that cannot be avoided (e.g., pollutants), and the traditional DEA method cannot resolve bad outputs [32,33]. Therefore, Tone [34,35] proposed the SBM model and the improved super-efficiency model based on slack variables, which not only addresses the non-radial angle and slack variables of the model while taking into account undesirable outputs, but also effectively resolves the DMU sorting failure. The DEA model regards the production process as a black box because it cannot effectively evaluate the efficiency of each sub-phase in the production process, although the DEA model has been greatly improved and developed. Therefore, Tone [36] further improved the DEA model and constructed a network DEA model based on slack variables, which can evaluate the overall efficiency of the DMU and the efficiency of each sub-phase. On this basis, Huang [37] integrated super-efficiency and undesirable outputs into a network DEA model, and constructed a Network DEA Model with Super-Efficiency and Undesirable Outputs (US-NSBM). Compared to the traditional DEA model, this model is more accurate in measuring EWP and recognizing the validity of each sub-phase, which can help decision makers to further optimize key performance indices. Therefore, in this paper, we calculated the EWP of the YRBUAs using the US-NSBM. The EWP is calculated based on the following formula:
ρ e w p * = m i n k = 1 K ω k 1 + 1 m k Σ i = 1 m k s i k x i 0 k k = 1 K ω k [ 1 1 v 1 k + v 2 k r = 1 v 1 k s r g k y r 0 g k + r = 1 v 2 k s r b k y r o b k ] x o k j = 1 , 0 n λ j k x j k + s k 0 j = 1 , 0 n λ j k y j g k y o g k + s g k 0 y o b k j = 1 , 0 n λ j b y j b k + s b k 0 1 1 v 1 k + v 2 k r = 1 v 1 k s r g k y r o g k + r = 1 v 2 k s r b k y r o b k ε z k , h λ h = z k , h λ k j = 1 , 0 N λ j k = 1 k = 1 K w k = 1 λ k , s k , s g k , s b k , w k 0
In the above formula, x, y, and z represent the input, output, and intermediate output, respectively; mk and vk represent the number of inputs and outputs in phase k, respectively; λk represents the model weight combination in phase k; and ωk represents the weight in phase k. This paper divides the ecological welfare into two phases. Therefore, k is taken as 1 or 2. We set the weight in the two phases the same (i.e., ω1 = ω2 = 0.5), considering the important role of ecological efficiency and social welfare on sustainable development. Furthermore, srgk and srbk represent the slack variables of the desirable and undesirable outputs, respectively. It is deemed that the DMU is relatively valid when the overall efficiency and the sub-phase efficiency are greater than or equal to 1.
The core concept of EWP is to obtain a higher welfare level under limited ecological environment consumption. Based on the green intensive development connotation and relevant research, we selected land resource, water resource, and energy resource consumption as the input indices, and chose industrial wastewater, waste gas, waste generation, municipal wastewater, and other wastes as the undesirable outputs. Economic growth was regarded as an intermediate variable, and the output index was urban comprehensive welfare level. It can be seen, from previous research, that welfare measurement indices can be roughly divided into two categories. The first category includes GDP-based economic welfare indices, such as MEW [38] and ISEW [39]. However, with economic growth, the welfare threshold hypothesis has gained acceptance and scholars are gradually aware that monetary income cannot always improve sense of happiness. Therefore, these indices have gradually disappeared. The second category involves the measurement of human welfare. The most widely applied UNDP evaluates the level of social and economic development of a country, human welfare and its functional realization from the perspective of life expectancy, adult literacy rate, and per capita GDP, according to the HDI, and it also measures human life fundamental pursuits. It is favored by scholars due to the easy operation of the HDI and its intuitiveness [6,7,20]; however, there are some problems with the HDI. For example, it is difficult to comprehensively measure welfare level due to the narrow index measurement range [40,41]. Based on the ideas of Daly [13] and Zhu, D.J [6], we divided EWP into two phases—ecological economic system and economic welfare system phases—and then divided welfare level into social welfare, economic welfare, and environmental welfare using the social–economic–environmental method:
E W P = W B E F = G D P E F × W B e n + W B s o + W B e c G D P
In the above formula, EF is the average ecological footprint (including the consumption of natural resources); GDP is the economic developmental level; and WB is the welfare level, including social welfare (WBso), economic welfare (WBec), and environmental welfare (WBen). We eventually obtained the economic, social, and environment welfare indices by using the main analytical method from the three aspects of economic welfare, social welfare, and environmental welfare, according to the urban social development function and demand (Table 1).
We selected 65 cities along the YRBUAs as the DMUs and the annual data from 2006–2020 as the data samples. The index data were obtained from the China Statistical Yearbook, the China City Statistical Yearbook, and provincial statistical yearbooks and statistical bulletins. Some data had to be obtained through multiple imputations.

3.2.2. Dagum Gini Coefficient and Decomposition

There are various methods to analyze spatially unbalanced development in a region, such as the coefficient of variation, the Gini coefficient, the Theil index, and so on. The Dagum Gini coefficient takes into account the distribution status of subgroups [42]; thus, it not only can determine the source of regional difference, but also overcomes the overlapping of grouped samples. It has obvious advantages in analyzing spatially unbalanced development [43]. Therefore, we used this coefficient to explore the differences and sources of EWP in the YRBUAs. Its calculation formula is as follows:
G = j = 1 k h = 1 k i = 1 n j r = 1 n h y j i y h r 2 μ n 2
where k is the number of urban agglomerations in the investigated city; j and h are urban agglomeration indices; n is the number of investigated cities; i and r are city indices; nj(nh) is the number of internal cities in an urban agglomeration; j(h), yji and yhr are the measured city welfare efficiency values in the urban agglomerations j and h, respectively; and is the average EWP value of all investigated cities. We can further decompose the Dagum Gini coefficient into the difference within a region (Gw), the difference between regions (Grb), and trans-variation intensity between regions (Gt), calculated as follows:
G w = j = 1 k G j j p j s j
G j j = 1 2 y - j i = 1 c j r = 1 c j y j i y j r / c j 2
G r b = j = 2 k h = 1 j 1 G j h p j s h + p h s j D j h
G t = j = 2 k h = 1 j 1 G j h p j s h + p h s j 1 D j h
G j h = i = 1 c j r = 1 c h y j i y j r / c j c h y - j + y h ¯ .
In the above formulas, pj = cj/c, sj = cjȳj/ccȳ, and Djh denotes the relative influence of EWP between the urban agglomerations j and h (see Formula (9) for the calculation formula). Furthermore, djh is the EWP value of an urban agglomeration, showing the total mathematical expectation of all samples yjiyhr > 0 between the urban agglomerations j and h (see Formula (10) for the calculation formula); pjh is the trans-variation moment (see Formula (11) for the calculation formula); and Fj and Fh are the ecological welfare efficiency accumulative distribution functions for the urban agglomerations j and h, respectively.
D j h = d j h p j h / d j h + p j h
d j h = 0 d F j y 0 y y x   d F h x
p j h = 0 d F h y 0 y y x   d F j x .

3.2.3. β Convergence Model

β convergence refers to the fact that regions with low ecological welfare efficiency gradually catch up to regions with high efficiency, and eventually reach the same stable level as time passes. It can be used to further test the EWP evolution situation in the YRBUAs. β convergence can be divided into absolute β convergence and conditional β convergence. There is an implicit basic assumption in absolute β convergence model; namely, there are the same or similar natural endowments and socio-economic conditions in different regions. We set the absolute β convergence model as follows:
ln E W P i t + 1 E W P i t = α + β ln E W P i t + μ i + η t + ε i t ,
where EWPit+1 and EWPit denote the EWP efficiency value at times t + 1 and t in city i, respectively, and β is the convergence coefficient. It shows that there exists a convergence trend for the ecological welfare efficiency in a region. The convergence speed is v = (−ln(1 − β))/T. On the contrary, there may be a scattering trend. µi, ηt, and εit denote the individual effect, time effect, and stochastic disturbance term, respectively. The traditional β convergence model does not take into account spatial factors. With the enhancement of urban association, the ecological welfare efficiency of a city presents an obvious spatial correlation characteristic. Therefore, it is necessary to bring the spatial effect into the convergence model [44,45,46]. Based on the concept of the spatial convergence model, we constructed the spatial absolute β convergence model as follows:
  SAR :   ln E W P i , t + 1 E W P i t = α + β ln E W P i t + ρ j = 1 n w i j ln E W P i , t + 1 E W P i t + μ i + η t + ε i t ,
  SEM :   ln E W P i , t + 1 E W P i t = α + β ln E W P i t + μ i + η t + u i t ,   u i t = λ j = 1 n w i j u i t + ε i t ,  
  SDM :   ln E W P i , t + 1 E W P i t = α + β ln E W P i t + ρ j = 1 n w i j ln E W P i , t + 1 E W P i t + γ j = 1 n w i j ln E W P i t + μ i + η t + ε i t
where ρ is spatial lag coefficient, which reflects the ecological welfare efficiency growth of neighboring cities in the local region; λ is the spatial error coefficient, which reflects the spatial effect in the stochastic disturbance term; γ is the independent variable spatial lag coefficient, which reflects the impact of ecological welfare efficiency on neighboring areas; µi is the individual-fixed effect; ηt is the time-fixed effect; εit is the stochastic disturbance term; and wij is the spatial weight matrix. Considering the intrinsic interference of the model caused by social and economic distances, as well as the connections of cities based on traffic network, we adopted a city reciprocal set space weight matrix based on road network distance square, as follows:
w i j = { 1 / d i j 2 i j 0 i = j ,  
where dij is the shortest distance between city i and city j through a railway, expressway, national road, or provincial road. With an increase in road network distance, the city ecological welfare efficiency has lower relevance [47].
In contrast to the absolute β convergence model, it is not agreed that the economy–resource–environment system differs in terms of basic characteristics in different regions in the conditional β convergence model. Therefore, to the conditional β convergence model, we added a series of control variables on the basis of the absolute β convergence model, in order to measure the economy–resource–environment characteristics in different regions and to discuss whether the regional ecological welfare efficiency presents a convergent tendency under the important influence of a series of ecological welfare efficiency factors. The conditional β convergence model was set as below, with respect to the absolute β convergence model.
Panel model:
l n E W P i , t + 1 E W P i t = α + β ln ( EWP it ) + δ X i , t + 1 + μ i + η t + ε i t
Conditional β convergence model with spatial effect:
  SAR :   ln E W P i , t + 1 E W P i t = α + β ln E W P i t + ρ j = 1 n w i j ln E W P i , t + 1 E W P i t + δ X i , t + 1 + μ i + η t + ε i t ,
SEM : ln E W P i , t + 1 E W P i t = α + β ln E W P i t + δ X i , t + 1 + μ i + η t + u i t , u i t = λ j = 1 n w i j u i t + ε i t ,
SDM : ln E W P i , t + 1 E W P i t = α + β ln E W P i t + ρ j = 1 n w i j ln E W P i , t + 1 E W P i t + δ ln X i , t + 1 + θ j = 1 n w i j ln E W P i t + γ j = 1 n w i j ln X j , t + μ i + η t + ε i t .
Based on the reality of development along the Yellow River Basin, we studied the impact of city ecological efficiency and selected control variables, such as population density (POP), advanced stage of industrial structure (ADV), marketization degree (MAR), opening degree (OPE), and government financial resource level (GOV). The growth in population density provides sufficient labor capital for regional industrialization, urbanization, and modernization, and promotes the gathering of innovative elements, intensive utilization of resources, and economic operational efficiency. On the other hand, it will also cause traffic congestion, energy consumption, and environmental pollution. Advanced industrial structure can reduce the emissions of pollutants and improve the urban ecological welfare efficiency. Please refer to the calculation method presented in [46]. China has achieved great achievements through its market reform. The improvement of marketization means an improvement in the business environment, which can reduce transaction costs and improve resource spatial allocation efficiency. OPE can bring advanced technology and management concepts, promoting the transformation of local economic development. On the other hand, local areas may accept high-pollutant industries from developed countries, increasing environmental pollution and energy consumption. Governmental financial support can optimize urban innovative infrastructure construction and improve the availability of urban resources.

4. Results

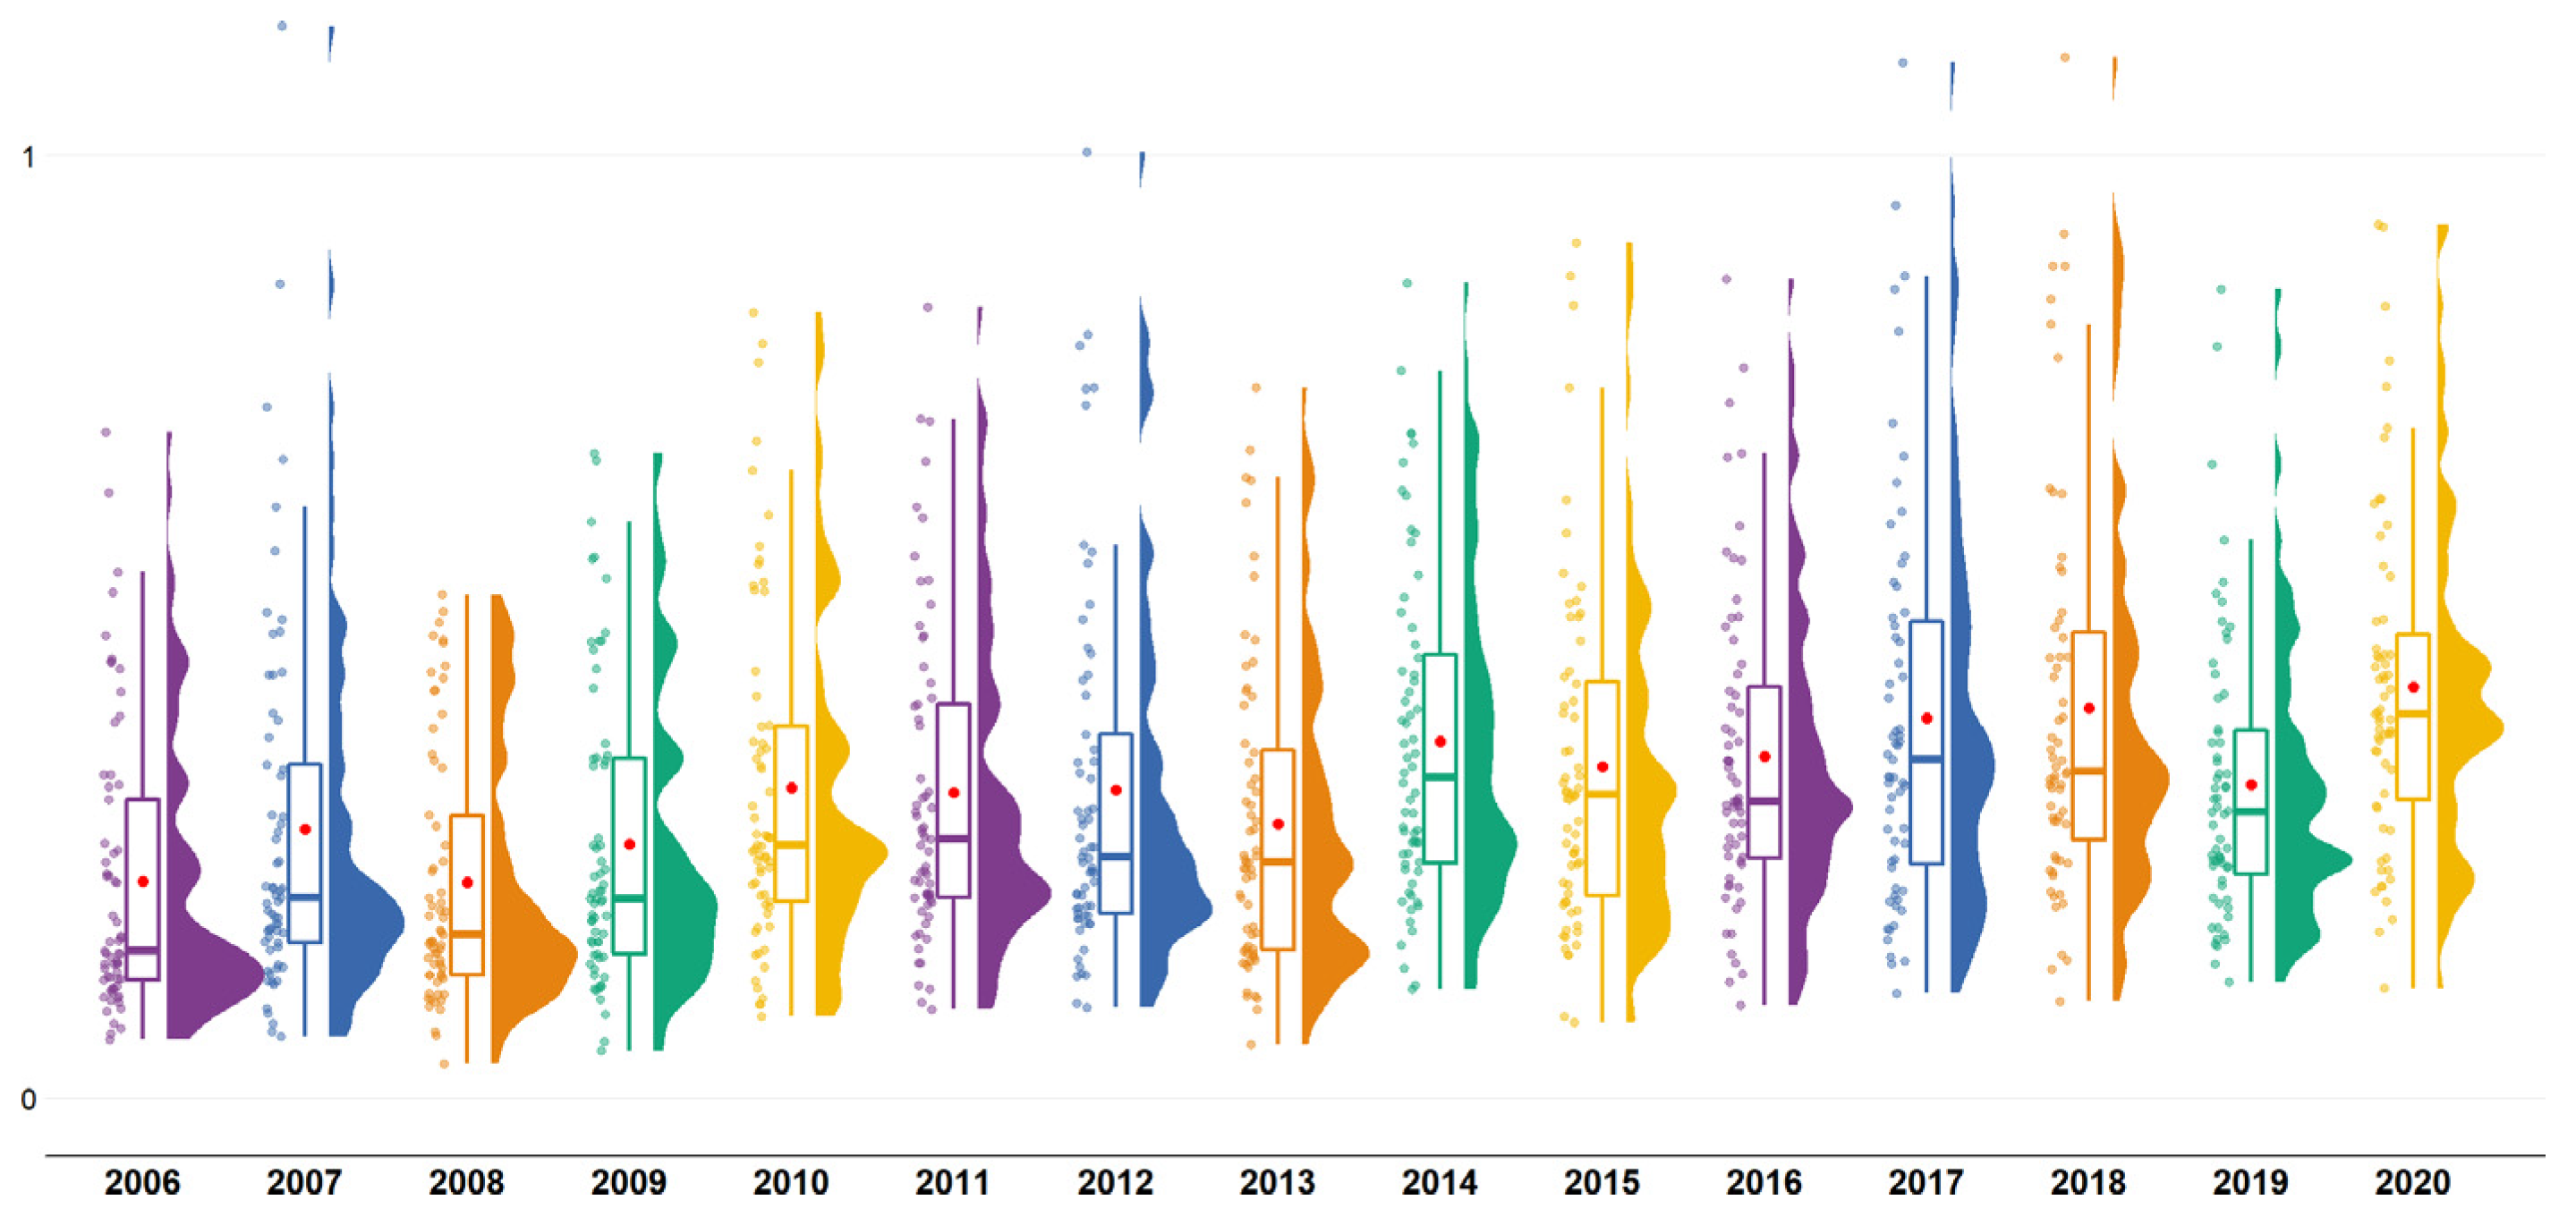
4.1. EWP Measurement Result

Based on the US-NSBM model, we estimated the ecological welfare efficiency distribution and change trend (Figure 2) from 2006 to 2020 along the Yellow River Basin. Generally speaking, the EWP along the Yellow River Basin fluctuated and was on the rise. The annual average efficiency value increased from 0.2289 in 2006 to 0.4741 in 2020. The average efficiency values over nine years tended to increase, with 2019–2020 (27.41%), 2006–2007 (24.45%), and 2008–2009 (22.21%) being ranked in the top three places; meanwhile, the average efficiency value decreased over five years, with 2007–2008 (−19.71%), 2018–2019 (−17.63%), and 2014–2015 (−6.8%) being ranked as the top three. The average value of the overall efficiency was smaller than one, thus failing to realize DEA validity; however, it did present a positive trend. By city, the annual average efficiency was ranked the highest in Xi’an City, Zhengzhou City, Taiyuan City, Jinan City, and Qingdao City; these cities are provincial capital and first-tier cities. In contrast, the average annual efficiency was the lowest in Wuzhong City, Ordos City, Shizuishan City, Zhongwei City, and Yulin City.
In terms of urban agglomeration (UA), the average value of EWP in the Shandong UA was the highest (Table 2), which showed a U-shaped fluctuation and overall increasing trend over the investigation period. The efficiency value in 2016 reached the highest value, after which a downward trend was observed. The Lanzhou–Xining–Yinchuan (LXY) UA ranked in the lowest place, with average efficiency value increasing from 0.1820 to 0.5045. Restricted by its historical burden, it has failed to catch up with the ecological welfare efficiency values in other UAs. Generally speaking, ecological welfare efficiency along the Yellow River Basin in the downstream is higher than that in the upstream, and the spatial pattern in big cities is higher than that in small- and medium-sized cities.

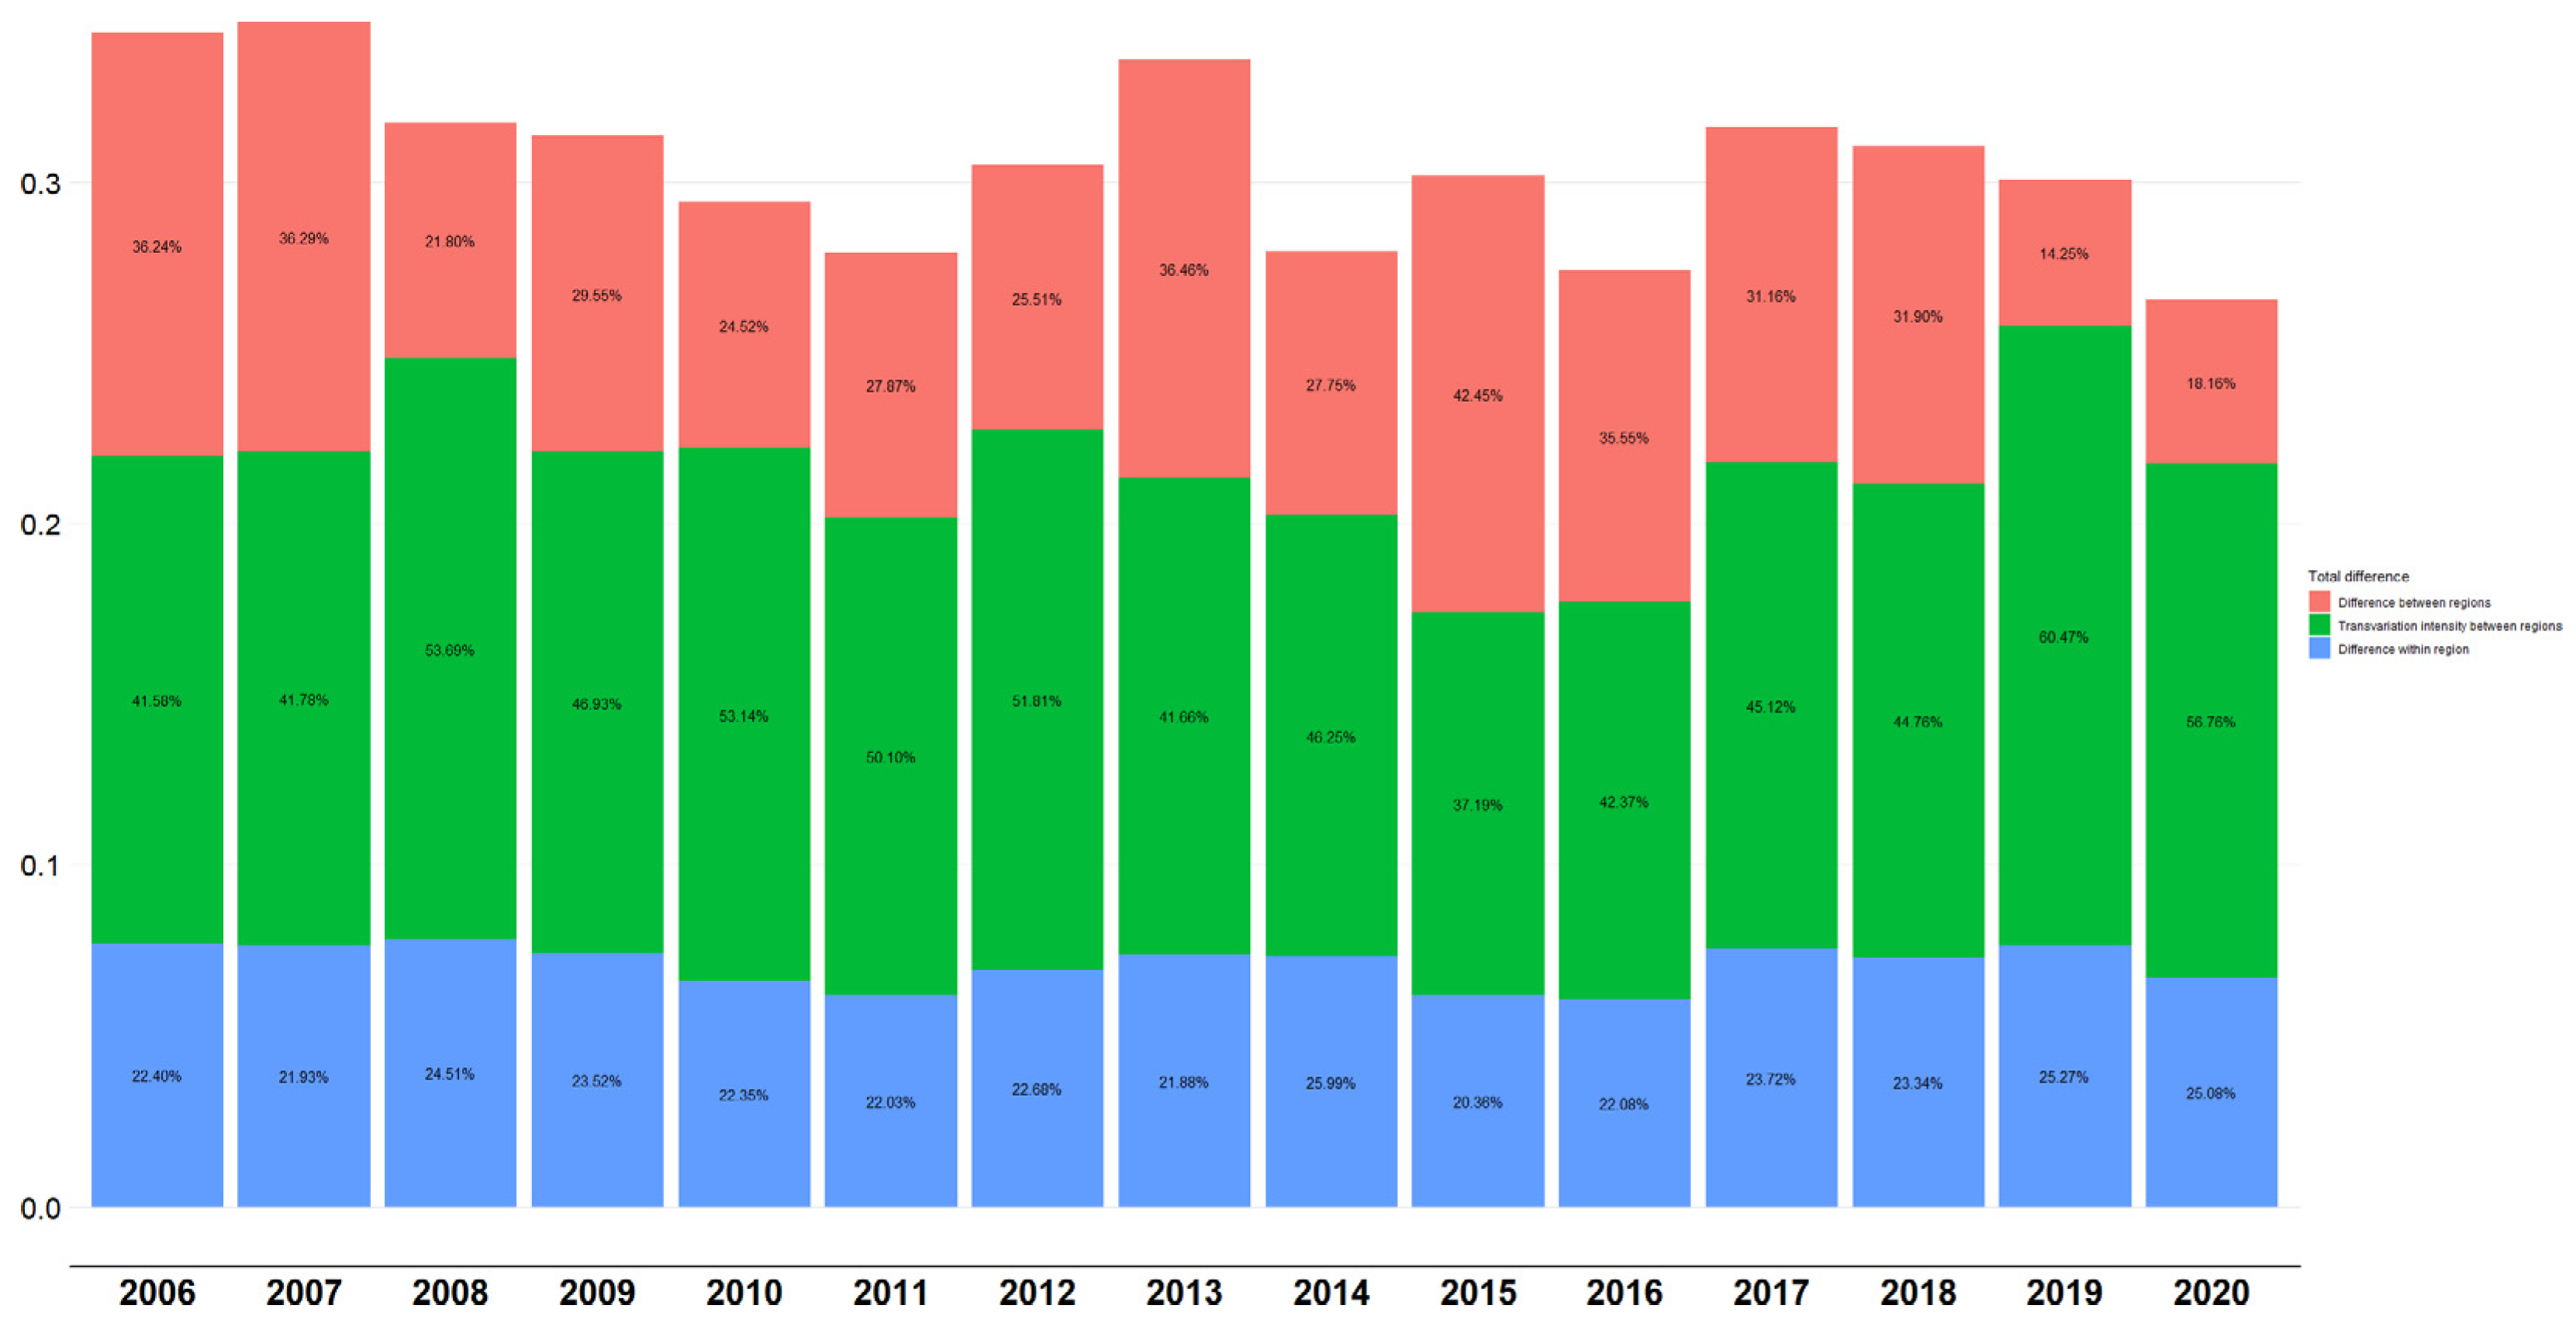
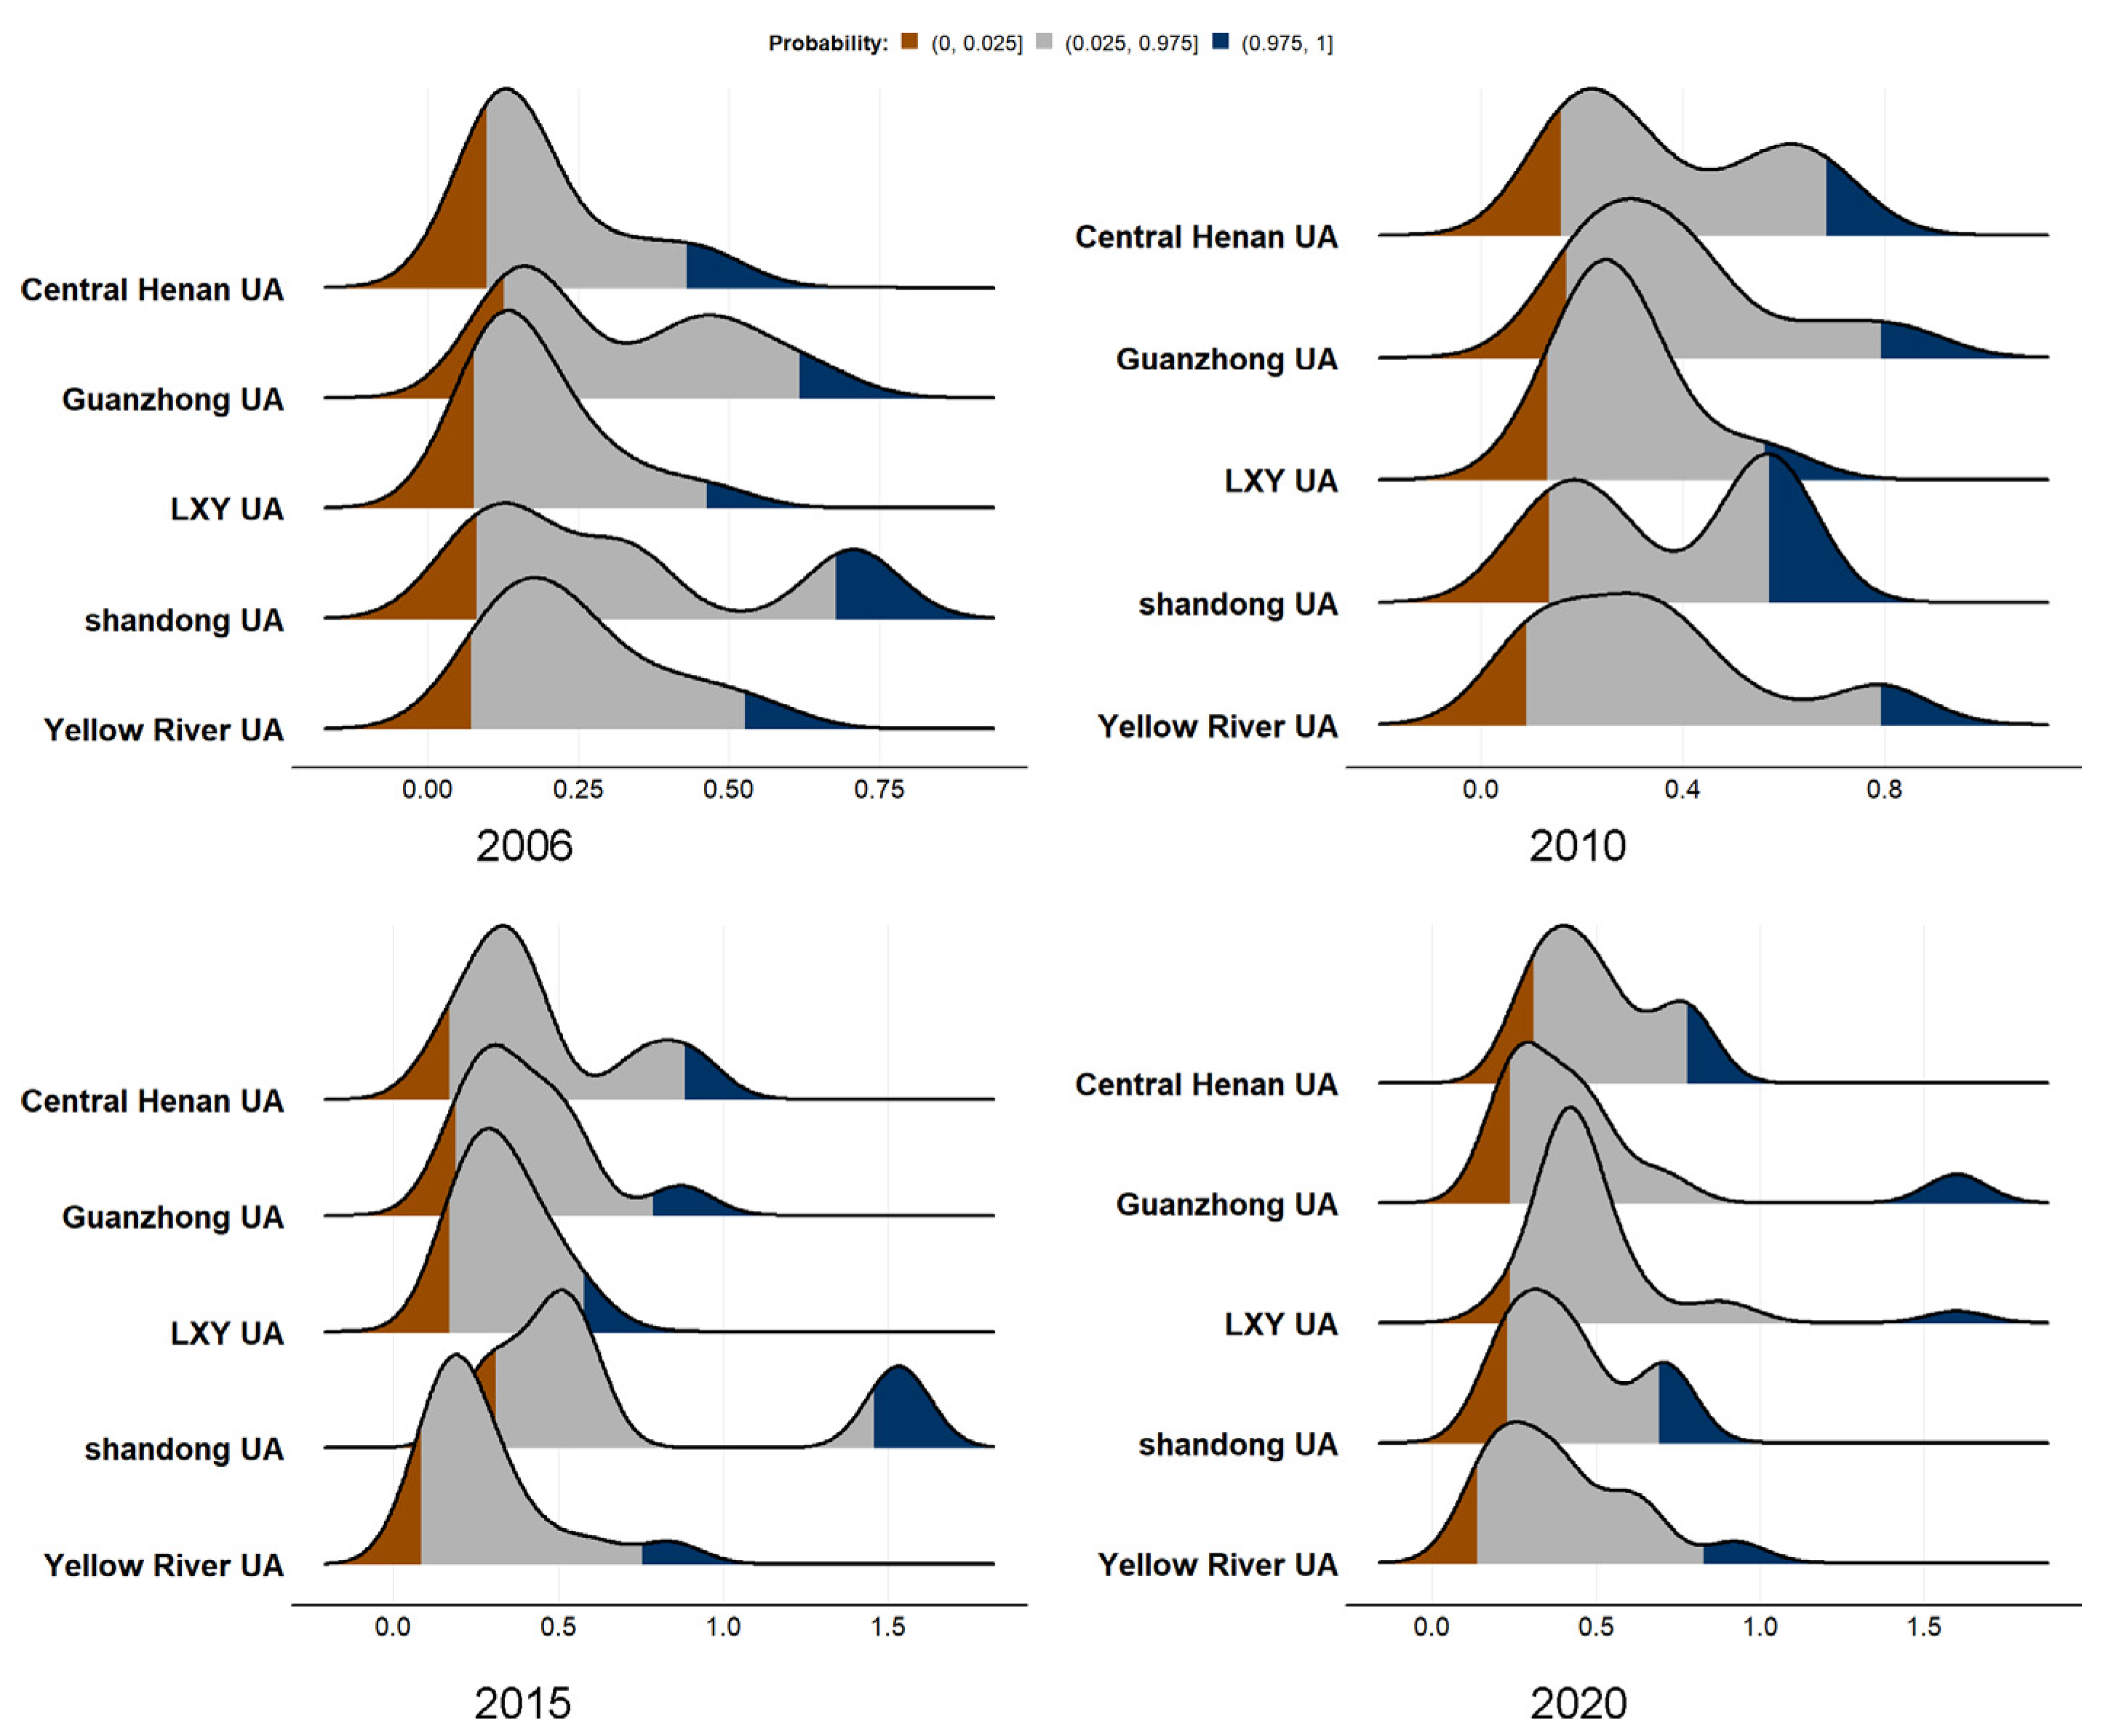
4.2. Urban Agglomeration Ecological Welfare Efficiency Difference and Decomposition along the Yellow River Basin

Next, we calculated the urban agglomeration EWP Dagum Gini coefficient along the Yellow River Basin, where the results are shown in Figure 3 and Table 3. The Dagum Gini coefficient over the investigation period showed a fluctuating and overall downward trend, from 0.3430 at the beginning to 0.2654 at the end, indicating that there were great differences in EWP along the Yellow River Basin. However, these differences showed a decreasing trend. This originates from the promotion of ecological and regional coordinated development strategies along the Yellow River Basin in recent years, which has effectively promoted the integrated construction of the regional market as well as regional cooperation. As seen from the source of differences, the annual change of urban agglomeration internal difference Gini coefficient was relatively smooth, with an average value of 0.076 and an average contribution rate of 23.14% to the overall difference. The urban agglomeration difference Gini coefficient average value was 0.09, with an average contribution rate of 29.29%. The highest point appeared in 2015, with a difference coefficient of 0.128 and an average contribution rate to overall difference of 42.45%. It then began to decline, until the end of the investigation period. The trans-variation density reflected the impact of urban agglomeration overlapping on overall difference, with a contribution rate of 37.19–60.47% and an average value of 47.57%, making it the main source of urban agglomeration EWP difference along the Yellow River Basin during the investigation period. The urban agglomeration Gini coefficient average values were close. The highest average value of urban agglomeration along the Yellow River Basin was 0.3325, while the lowest value was 0.2511. The LXY UA and Shandong UA showed downward trends during the investigation period, with average declines of 3.76% and 3.21%, respectively. The Guanzhong UA and Central Hennan UA showed alternating up and down trends during the investigation period, and the Yellow River UA showed a relatively smooth trend.
Based on the analysis of the Dagum Gini coefficient, we found that, while it can reflect the urban agglomeration EWP differences and sources along the Yellow River Basin, it cannot explain the dynamic evolution process of urban agglomeration EWP along the Yellow River Basin. Therefore, we selected the years 2006 (the beginning of the investigation period and the beginning of the 11th Five-Year Plan), 2010 (the end of the 11th Five-Year Plan), 2015 (the end of the 12th Five-Year Plan), and 2020 (the end of the observation period and the end of the 13th five-year plan) as the main time observation points and analyzed the urban agglomeration EWP distribution dynamic characteristics in the five cities using the kernel density estimation method. It can be seen, from Figure 4, that the urban agglomeration kernel curve moves to the right from 2006 to 2020, indicating that the urban agglomeration EWP level in the five cities along the Yellow River Basin during the observation period was constantly increasing. The Central Hennan UA gradually changes from a single peak to a double peak. The right peak is lower than the main peak, demonstrating an obvious gradient effect in the region. The Guanzhong UA gradually changes from a double peak to a single peak, with trailing on the right, showing a convergent trend of EWP in the region. There were obvious differences between some cities and other regions during the investigation period; for example, there is an obvious single peak distribution in the LXY UA and a double peak distribution in the Guanzhong UA. The Yellow River UA shows a single peak–double peak–single peak trend.

4.3. β Convergence and Result Analysis

First, we present the absolute β convergence analysis. We report the urban agglomeration EWP absolute β convergence results in Table 4. We adopted the LM test to determine whether there existed spatial autocorrelation between overall urban agglomeration and different regions, due to the difference in spatial effect in different regions. We selected the ordinary panel regression model if there was no spatial autocorrelation, while the Wald test and LR test optimal spatial model were used if spatial autocorrelation was detected. In this way, we selected the model for regression analysis. The results showed that there was absolute β convergence between overall urban agglomeration and different urban agglomerations, indicating that urban agglomeration EWP along the Yellow River Basin gradually weakened to a stable level, without considering other influential factors. Second, different regions presented different convergence speeds. The overall convergence speed of urban agglomeration along the Yellow River Basin was 0.075, which was lower than the overall convergence speed (0.089) of urban agglomeration in the Central Hennan UA and the Yellow River UA (0.125), and higher than the overall convergence speed (0.070) in the Guanzhong UA, the LXY UA (0.033), and the Shandong UA (0.047). Third, there was no spatial autocorrelation of the test results found between the Guanzhong UA and the LXY UA. Therefore, we selected the traditional convergence model. There were spatial lags of the explanatory variables and explained variable in other regions; λ and ρ were significantly negative at the 1% level, showing that there was competition of EWP in these regions, but which remained a chase trend in the relative lag region. Next, we conducted conditional β convergence analysis. We assumed similar natural endowment in absolute β convergence, which did not conform to the actual situation. Therefore, we further analyzed the conditional β convergence. The urban agglomeration EWP conditional β convergence analysis results are provided in Table 5. First, the results showed that the β coefficients below the 1% level were significantly negative, except the β coefficient for the LXY UA, which was below the 5% level and significantly negative. These results indicated that there existed a conditional β convergence trend between overall urban agglomeration and different urban agglomerations along the Yellow River Basin, taking into account the population density, industrial structure level, government finance, marketization level, openness, and other social economic factors. It can be seen, from the long-term results, that there exists urban agglomeration EWP convergence and a stable level trend along the Yellow River Basin. Second, the Yellow River UA (0.134) presented the fastest convergence speed, while the LXY UA (0.026) had the lowest convergence speed. This was consistent with the absolute β convergence results. Third, the test results showed that other regions, except for the LXY UA, should take into account a spatial econometric model. For overall urban agglomeration along the Yellow River Basin, the spatial lag coefficients were significantly positive for the Central Henan UA and the Shandong UA, while those for the Guanzhong UA and the Yellow River UA were significantly negative, with values below the 1% level. Therefore, there exists a negative spatial spillover relationship between the EWP change rates in the two regions. Fourth, as seen for the overall urban agglomeration, there was a positive effect (at the 1% level) of population density on local EWP change, with non-significant spatial impact. A higher population density can promote more intensive utilization of resources; however, the associated congestion cost is bad for the improvement of EWP. Therefore, it is necessary to scientifically plan urban agglomeration; promote the orderly development of large-, medium-, and small-sized cities; and form a reasonable population spatial distribution in order to improve the EWP. There was a significantly positive impact of industrial structure level (at the 5% level). Industrial structure upgrading can reduce its dependence on natural resources, improve the output efficiency of technical elements, and create more wealth for social welfare improvement. Government finance was not significant. While increased government financing can give full play to the role of macroeconomic regulation on resource allocation, there exists a financial deficit in the local government along the Yellow River Basin, making it difficult for the government to give full play to its role of “visible hand”. There was also no significant impact of marketization level and openness level, which therefore cannot promote the EWP in the study area. They can promote the development of the market and form a perfect market foundation, thus improving market efficiency. Meanwhile, for urban agglomeration, population density, industrial structure level, government finance, marketization level, openness level, and other social economic factors had heterogeneous effects on the convergence of EWP level.

5. Discussion and Conclusions

In this paper, we calculated the EWP of five major urban agglomerations along the Yellow River basin in the 2006–2020 period using the US-NSBM model, and further analyzed and tested the regional differences, dynamic evolution, and convergence of the urban agglomeration EWP along the YRB using the Dagum Gini coefficient, the kernel density estimation method, and the spatial convergence models, respectively. Our conclusions are outlined below.
First, the urban agglomeration EWP along the YRB during the investigation period was low, and the validity of the DEA could not yet be realized. The EWP presented an overall annually increasing trend, which could be attributed to the Chinese government’s attention to both the ecological environment and the welfare of residents. There were great differences in the urban EWP along the YRB, according to Dagum Gini coefficient decomposition results; however, the differences showed a decreasing trend. Regional difference was the main source of EWP difference, and the imbalance of urban EWP was prominent.
Second, in terms of convergence characteristics, overall urban agglomeration and urban agglomeration EWP were shown to be on a stable growth track at different convergence speeds. Meanwhile, urban agglomeration, population density, industrial structure level, government finance, marketization level, openness level, and other social economic factors presented heterogeneous effects on the convergence of EWP level. The local government along the YRB should not only take into account these heterogeneous characteristics, but should also explore and construct cross-regional resource collaboration management and restraint mechanisms, including giving full play to the leading role of large- and medium-sized cities, making the urban agglomeration cooperation channel smooth, and creating efficient urban agglomeration network development. All of these can promote coordinated regional development through the driving function of urban agglomeration and construct green development communities with a shared future. In addition, the Yellow River Basin is a typical area with weak resource and environmental carrying capacities. Protecting the ecological environment of the Yellow River Basin and promoting high-quality economic development along the Yellow River can provide a reference value for the sustainable development of ecologically sensitive regions worldwide.
The academic circle has long debated how to best measure the level of human welfare. Previous studies have mostly used the HQI index for such a measurement; however, this index has poor accessibility and low operability at the urban level in China. Based on the perspective of comprehensive welfare, we evaluated human welfare comprehensively from the three dimensions of economy, society, and ecological environment, while adhering to the concept of sustainable development; this forms a supplementary approach to previous studies on the use of income, education, health, and other single indicators. We used the US-NSBM model to overcome the situation that the ratio method may be dominated by ecological resource consumption, while allowing for the decomposition of EWP and resolving the black box problem inherent to the DEA method. The US-NSBM model can take into account undesirable outputs and super efficiency, further improving the reliability and clarity of the calculation results. In addition, we studied urban agglomeration along the YRB. Compared to previous EWP research, which has mainly focused on single national and provincial areas, this paper provides a more microcosmic approach, supplementing the EWP-related literature.
However, there are certain limitations in this paper, which require improvement in future research. First, there exists no comprehensive EWP index; for example, life expectancy as an indicator of health has become the consensus of the academic community. Due to a lack of access to data, life expectancy was not included in the evaluation index system used here. In contrast, we used a subjective evaluation method for the measurement of individual subjective welfare perception and sense of happiness, which is superior to some extent. However, it is difficult to apply this to the analysis of long-term spatio–temporal dynamic changes. Therefore, this study mainly used an objective evaluation method to measure the comprehensive welfare level. Second, we could not select the EWP influential factors in a comprehensive manner, as we selected only five influential factors for the analysis. However, in reality, urban EWP may be affected by other influential factors. Moreover, there may be interactions between the influential factors. This selection might have led to incomprehensive results. In future research, we intend to further mine the data and fully consider regional heterogeneity, in order to improve and validate the present research results and application value.

Author Contributions

Conceptualization, N.L. and Y.W.; methodology, N.L.; validation, Y.W.; investigation, N.L.; resources, N.L.; data curation, N.L.; writing—original draft preparation, N.L.; writing—review and editing, N.L.; supervision, Y.W. All authors have read and agreed to the published version of the manuscript.

Funding

This research was funded by the National Social Science Foundation of China (22BTJ002), and the Education Department of Gansu Province of double first-class scientific research key projects (grant number GSSYLXM-06), and the Lanzhou University of Finance and Economics doctoral research innovation key project (grant number 2021D05).

Data Availability Statement

The data presented in this study are available from the first author upon request.

Conflicts of Interest

The authors declare no conflict of interest.

References

  1. Pirgmaier, E. The neoclassical trojan horse of steady-state economics. Ecol. Econ. 2017, 133, 52–61. [Google Scholar] [CrossRef]
  2. Toth, G.; Szigeti, C. The historical ecological footprint: From over-population to-consumption. Ecol. Indic. 2016, 60, 283–291. [Google Scholar] [CrossRef]
  3. Daly, H.E. Economics in a full world. Sci. Am. 2005, 293, 100–107. [Google Scholar] [CrossRef] [PubMed]
  4. Daly, H.E. From a failed-growth economy to a steady-state economy. Solutions 2010, 1, 37–43. [Google Scholar]
  5. Daly, H.E. A further critique of growth economics. Ecol. Econ. 2013, 88, 20–24. [Google Scholar] [CrossRef]
  6. Zhu, D.J.; Zhang, S. Research on ecological wellbeing performance and its relationship with economic growth. China Popul. Resour. Environ. 2014, 24, 59–67. [Google Scholar]
  7. Costanza, R.; Daly, L.; Fioramonti, L. Modelling and measuring sustainable wellbeing in connection with the UN sustainable development goals. Am. Econ. Rev. 2016, 64, 15–23. [Google Scholar] [CrossRef]
  8. O’Neill, D.W. The proximity of nations to a socially sustainable steady-state economy. J. Clean. Prod. 2015, 108, 1213–1231. [Google Scholar] [CrossRef] [Green Version]
  9. Fang, C.; Yu, D. Urban agglomeration: An evolving concept of an emerging phenomenon. Landsc. Urban Plan. 2017, 162, 126–136. [Google Scholar] [CrossRef]
  10. Feng, Y.; Dong, X.; Zhao, X. Evaluation of urban green development transformation process for Chinese cities during 2005–2016. J. Clean. Prod. 2020, 266, 121707. [Google Scholar] [CrossRef]
  11. Ren, B.P.; Zhang, Q. The strategic design and supporting system construction of high-quality development in the Yellow River Basin. Reform 2019, 308, 26–34. [Google Scholar]
  12. Jiang, L.; Zuo, Q.; Ma, J.; Zhang, Z. The world dynamics of economic growth: The economics of the steady state. Ecol. Indic. 2021, 129, 107994. [Google Scholar] [CrossRef]
  13. Daly, H.E. The world dynamics of economic growth: The economics of the steady state. Am. Econ. Rev. 1974, 64, 15–23. [Google Scholar]
  14. Rees, W.E. Ecological footprints and appropriated carrying capacity: What urban economics leaves out. Environ. Urban. 1992, 4, 121–130. [Google Scholar] [CrossRef]
  15. Wackernage, M.; Rees, W. Our Ecological Footprint: Reducing Human Impact on the Earth; New Society Publishers: Gabriola, BC, Canada, 1998; Volume 9. [Google Scholar]
  16. Van den Bergh, J.C.; Verbruggen, H. Spatial sustainability, trade and indicators: An evaluation of the ‘ecological footprint’. Ecol. Econ. 1999, 29, 61–72. [Google Scholar] [CrossRef]
  17. Dietz, T.; Rosa, E.A.; York, R. Environmentally efficient well-being: Is there a Kuznets curve? Appl. Geogr. 2012, 32, 21–28. [Google Scholar] [CrossRef]
  18. Abdallah, S.; Thompson, S.; Michaelson, J.; Marks, N.; Steuer, N. The Happy Planet Index 2.0: Why Good Lives Don’t Have to Cost the Earth; New Economics Foundation: London, UK, 2009. [Google Scholar]
  19. Jorgenson, A.K.; Dietz, T. Economic growth does not reduce the ecological intensity of human well-being. Sustain. Sci. 2015, 10, 149–156. [Google Scholar] [CrossRef]
  20. Zhang, S.; Zhu, D.J.; Shi, Q.H.; Cheng, M. Which countries are more ecologically efficient in improving human well-being? an application of the index of ecological well-being performance. Resour. Conserv. Recycl. 2018, 129, 112–119. [Google Scholar] [CrossRef]
  21. Long, L.J. Evaluation of urban ecological well-being performance of Chinese major cities based on two-stage super-efficiency network SBM Model. China Popul. Resour. Environ. 2019, 64, 15–23. [Google Scholar]
  22. Feng, Y.J.; Zhong, S.Y.; Li, Q.Y.; Zhao, X.M.; Dong, X. Ecological well-being performance growth in China (1994–2014): From perspectives of industrial structure green adjustment and green total factor productivity. J. Clean. Prod. 2019, 236, 117556. [Google Scholar] [CrossRef]
  23. Common, M. Measuring national economic performance without using prices. Ecol. Econ. 2007, 64, 92–102. [Google Scholar] [CrossRef]
  24. Knight, K.W.; Rosa, E.A. The environmental efficiency of well-being: A cross-national analysis. Soc. Sci. Res. 2011, 40, 931–949. [Google Scholar] [CrossRef]
  25. Dietz, T.; Rosa, E.A.; York, R. Environmentally efficient well-being: Rethinking sustainability as the relationship between human well-being and environmental impacts. Hum. Ecol. Rev. 2009, 16, 114–123. [Google Scholar]
  26. Zhou, L.; Zhou, C.; Che, L.; Wang, B. Spatio-temporal evolution and influencing factors of urban green development efficiency in China. J. Geogr. Sci. 2020, 30, 724–742. [Google Scholar] [CrossRef]
  27. Yao, L.; Yu, Z.; Wu, M.; Ning, J.; Lv, T. The spatiotemporal evolution and trend prediction of ecological wellbeing performance in China. Land 2020, 10, 12. [Google Scholar] [CrossRef]
  28. Xie, H.; Wang, W. Exploring the spatial-temporal disparities of urban land use economic efficiency in China and its influencing factors under environmental constraints based on a sequential slacks-based model. Sustainability 2015, 7, 10171–10190. [Google Scholar] [CrossRef]
  29. Nie, L.; Guo, Z.; Peng, C. Construction land utilization efficiency based on SBM-Undesirable and Meta-frontier model. Am. Econ. Rev. 2017, 39, 836–845. [Google Scholar]
  30. Bian, J.; Zhang, Y.; Shuai, C.; Shen, L.; Ren, H.; Wang, Y. Have cities effectively improved ecological well-being performance? Empirical analysis of 278 Chinese cities. J. Clean. Prod. 2020, 245, 118913. [Google Scholar] [CrossRef]
  31. Charnes, A.; Cooper, W.W.; Rhodes, E. Measuring the efficiency of decision making units. Eur. J. Oper. Res. 1978, 2, 429–444. [Google Scholar] [CrossRef]
  32. Chen, L.; Jia, G. Environmental efficiency analysis of China’s regional industry: A data envelopment analysis (DEA) based approach. J. Clean. Prod. 2017, 142, 846–853. [Google Scholar] [CrossRef]
  33. He, Q.; Han, J.; Guan, D.; Mi, Z.; Zhao, H.; Zhang, Q. The comprehensive environmental efficiency of socioeconomic sectors in China: An analysis based on a non-separable bad output SBM. J. Clean. Prod. 2018, 176, 1091–1110. [Google Scholar] [CrossRef] [Green Version]
  34. Tone, K. A slacks-based measure of efficiency in data envelopment analysis. Eur. J. Oper. Res. 2001, 130, 498–509. [Google Scholar] [CrossRef] [Green Version]
  35. Tone, K. A slacks-based measure of super-efficiency in data envelopment analysis. Eur. J. Oper. Res. 2002, 143, 32–41. [Google Scholar] [CrossRef] [Green Version]
  36. Tone, K. Variations on the theme of slacks-based measure of efficiency in DEA. Eur. J. Oper. Res. 2010, 200, 901–907. [Google Scholar] [CrossRef] [Green Version]
  37. Huang, J.; Chen, J.; Yin, Z. A network DEA model with super efficiency and undesirable outputs: An application to bank efficiency in China. Math. Probl. Eng. 2014. [CrossRef] [Green Version]
  38. Nordhaus, W.D.; Tobin, J. Is growth obsolete? The measurement of economic and social performance. Stud. Income Wealth 1973, 38, 509–532. [Google Scholar]
  39. Cobb, J.; Daly, H. For the Common Good, Redirecting the Economy toward Community, the Environment and a Sustainable Future; Beacon Press: Boston, MA, USA, 1994. [Google Scholar] [CrossRef]
  40. Sagar, A.D.; Najam, A. The human development index: A critical review. Ecol. Econ. 1998, 25, 249–264. [Google Scholar] [CrossRef]
  41. Ranis, G.; Stewart, F.; Samman, E. Human development: Beyond the human development index. J. Hum. Dev. 2006, 7, 323–358. [Google Scholar] [CrossRef]
  42. Dagum, C. A New Approach to the Decomposition of the Gini Income Inequality Ratio. Empir. Econ. 1997, 22, 515–531. [Google Scholar] [CrossRef]
  43. Skidmore, M.; Toya, H.; Merriman, D. Convergence in government spending: Theory and cross-country evidence. Kyklos 2004, 57, 587–620. [Google Scholar] [CrossRef]
  44. Elhorst, J.P. Specification and estimation of spatial panel data models. Int. Reg. Sci. Rev. 2003, 26, 244–268. [Google Scholar] [CrossRef]
  45. Wu, W.; Zhu, Y.; Zeng, W. Green efficiency of water resources in Northwest China: Spatial-temporal heterogeneity and convergence trends. J. Clean. Prod. 2021, 320, 128651. [Google Scholar] [CrossRef]
  46. Fu, L.H. An empirical research on industry structure and economic growth. Stat. Res. 2010, 27, 79–81. [Google Scholar]
  47. Qu, X.; Lee, L. Estimating a spatial autoregressive model with an endogenous spatial weight matrix. J. Econom. 2015, 184, 209–232. [Google Scholar] [CrossRef]
Figure 1. Overview of the study area.
Land 11 02073 g001
Figure 2. Distribution of the overall EWP of the YRBUAs from 2006 to 2020.
Land 11 02073 g002
Figure 3. Urban agglomeration Dagum Gini coefficient decomposition.
Land 11 02073 g003
Figure 4. Urban agglomeration EWP distribution dynamics.
Land 11 02073 g004
Table 1. Evaluation index system for the EWP.
StageCategorySecondary IndicatorsTertiary Indicators
StageInputsResource consumptionLand consumption
Energy consumption
Water consumption
OutputsDesirable outputsGDP per capita
Undesirable outputsPer capita wastewater
Per capita SO2
Per capita soot/dust
StageInputsEconomic growthGDP per capita
OutputsEconomic welfareper capita disposal income
Per capita consumption
Engel coefficient
Social welfareDoctors per 10,000 people
Number of college students per 10,000 people
Basic medical coverage rate
Teacher–student ratio
Basic pension coverage rate
Unemployment insurance coverage rate
Environmental welfareGreening coverage of built-up areas
Number of parks per 10,000 people
Forest coverage rate
PM2.5
Table 2. Measured EWP of each UA over the study period.
LXY UAGuanzhong UAShandong UACentral Henan UAYellow River UA
20060.1820.31650.32020.19250.2444
20070.22620.42590.34280.28090.274
20080.20550.29080.25580.24320.2102
20090.24620.30810.40250.31460.2199
20100.28150.38520.37580.37680.3322
20110.27160.38980.37720.34170.3426
20120.28080.35390.39260.41330.3265
20130.26750.42890.43120.34870.2402
20140.39060.42270.52950.46290.3145
20150.33220.40430.71680.43970.2787
20160.3440.3940.77680.38820.3229
20170.37770.54990.66920.46380.3724
20180.38710.62670.60050.44170.3944
20190.34380.35680.38030.43480.3895
20200.50450.49190.42480.50290.3925
average0.30940.40970.46640.37640.3103
Table 3. Dagum Gini coefficient of urban agglomeration.
YearOverallLXY UAGuanzhong UAShandong UACentral Henan UAYellow River UA
20060.3430.29180.31480.40250.29980.3104
20070.34690.27180.36150.32580.35040.3254
20080.31750.29670.28610.30640.31350.3078
20090.31340.28040.21530.29810.29280.3539
20100.29410.20940.27220.27650.29330.3579
20110.27940.18980.24320.27610.26790.3561
20120.30480.22650.27440.28760.30030.3762
20130.33570.24650.39020.15290.32480.3542
20140.27980.28790.21650.20420.22160.2869
20150.30210.20640.24350.330.29170.3503
20160.27410.22310.20130.28640.19160.3194
20170.31630.2940.33220.17280.22350.3111
20180.31040.26380.36540.25580.22210.2998
20190.30070.26450.26760.22230.23310.3779
20200.26540.21340.33450.23520.190.3001
average0.30560.25110.28790.26880.26780.3325
Table 4. Estimation results of absolute β spatial convergence analysis.
OverallCentral Henan UAGuanzhong UALXY UAShandong UAYellow River UA
SDMSEMOLSOLSSARSEM
−0.6486 ***−0.712 ***−0.625 ***−0.373 **−0.479 ***−0.826 ***
(−20.64)−0.0507−0.0502−0.138−0.0758−0.0622
−1.2863 **
(−2.52)
rho−1.3133 *** −1.000 ***
(−5.05) −0.222
lambda −1.7574 *** −0.950 ***
(−7.21) −0.229
Time-fixedYesYesYesYesYesYes
Space-fixedYesYesYesYesYesYes
Hausman152.17 ***202.06 ***38.58 ***38.58 ***20.62 ***79 ***
R-LM (SAR)145.4474 (0.000)0.8574 (0.354)0.0272 (0.869)0.7062 (0.401)3.102 *0.4989
R-LM (SEM)7.4974 (0.00)227.0485 (0.000)0.0596 (0.807)0.1995 (0.655)2.1367115.8193 ***
R²0.1270.23880.4460.5080.24120.3596
Note: ***, ** and * indicate significance at confidence levels of <0.01, <0.05 and <0.1.
Table 5. Estimation results of conditional β spatial convergence analysis.
OverallCentral Henan UAGuanzhong UALXY UAShandong UAYellow River UA
SDMSDMSEMOLSSARSEM
−0.657 ***−0.749 ***−0.329 ***−0.301 ***−0.572 ***−0.846 ***
−0.0307−0.0516−0.0574−0.101−0.081−0.0621
−0.370 *
−0.191
−0.604 ***
−0.207
POP1.074 ***   0.01451.861 ***   −0.159−0.296 **0.01830.460 ***0.0622
−0.303   −0.0484−0.447   −0.123−0.13−0.249−0.125−0.0543
ADV0.238 **   2.547 ***0.275 *   1.078 *−0.07341.235 *0.3820.850 ***
−0.101   −0.715−0.162   −0.623−0.108−0.708−0.585−0.27
inc−0.00556   −0.01650.0347   0.128−2.211 *−1.442−0.9080.182
−0.0116   −0.0607−0.0302   −0.208−1.337−2.113−1.195−0.94
mar−0.0354   −0.00730.685 **   −0.0490.01030.0407−0.0153−0.00268
−0.0345   −0.395−0.33   −0.0506−0.0165−0.0269−0.0135−0.00978
ope0.0194   0.3570.0237   −0.2771.169−0.882*1.681.006
rho lambda−0.0524   −0.455
0.431 ***
−0.0901
−0.0687   −0.433
0.292 ***
−0.101
−2.005

−1.276 ***
−0.477−1.371
0.222 **
−0.112
−0.913

−0.954 ***
Time-fixedYes      YesYes      Yes−0.218
Yes
YesYes−0.227
Yes
Space-fixedYes      YesYes      YesYesYesYesYes
Hausman112.47 ***112.47 ***417.11 ***21.91 **17.01 **383.13 ***
R-LM
(SAR)
11.3282 ***15.4693 ***0.05550.54974.3260 **0.0018
R-LM
(SEM)
46.2743 ***371.3759 ***10.6024 ***0.09530.095573.2107 ***
R²0.40590.2280.31610.30390.39140.3928
Note: ***, ** and * indicate significance at confidence levels of <0.01, <0.05 and <0.1.
Publisher’s Note: MDPI stays neutral with regard to jurisdictional claims in published maps and institutional affiliations.

