Article

Assessment of Land Deformation and the Associated Causes along a Rapidly Developing Himalayan Foothill Region Using Multi-Temporal Sentinel-1 SAR Datasets

1
Centre of Excellence in Disaster Mitigation and Management, Indian Institute of Technology Roorkee, Roorkee 247667, India
2
Department of Civil Engineering, Indian Institute of Technology Jammu, Jammu 181121, India
3
Department of Civil Engineering, Indian Institute of Technology Guwahati, Guwahati 781039, India
4
Department of Business Administration, College of Business Administration, Princess Nourah Bint Abdulrahman University, P.O. Box 84428, Riyadh 11671, Saudi Arabia
5
Department of Civil Engineering, Indian Institute of Technology Roorkee, Roorkee 247667, India
*
Author to whom correspondence should be addressed.
These authors contributed equally to this work.
Land 2022, 11(11), 2009; https://doi.org/10.3390/land11112009
Submission received: 23 October 2022 / Revised: 2 November 2022 / Accepted: 3 November 2022 / Published: 10 November 2022
(This article belongs to the Special Issue Landslide and Natural Hazard Monitoring)

Abstract

:
Land deformation has become a crucial threat in recent decades, caused by various natural and anthropogenic activities in the environment. The seismic land dynamics, landslides activities, heavy rainfall resulting in flood events, and subsurface aquifer shrinkage due to the excessive extraction of groundwater are among the major reasons for land deformation, which may cause serious damage to the overall land surface, civil infrastructure, underground tunnels, and pipelines, etc. This study focuses on preparing a framework for estimating land deformation and analyzing the causes associated with land deformation. A time-series SAR Interferometry-based technique called PsInSAR was used to measure land deformation, using Sentinel-1 datasets from 2015 to 2021 by estimating land deformation velocities for this region. The obtained PSInSAR deformation velocity results ranged between −4 mm to +2 mm per year. Further, land use land cover (LULC) changes in the area were analyzed as an essential indicator and probable cause of land deformation. LULC products were first generated using Landsat-8 images for two time periods (2015, 2021), which were then evaluated in accordance with the deformation analysis. The results indicated an increase in the built-up areas and agricultural cover in the region at the cost of shrinkage in the vegetated lands, which are highly correlated with the land subsidence in the region, probably due to the over-extraction of groundwater. Further, the outer region of the study area consisting of undulating terrain and steep slopes also coincides with the estimated high subsidence zones, which could be related to higher instances of landslides identified in those areas from various primary and secondary information collected. One of the causes of landslides and soil erosion in the region is identified to be high-level precipitation events that loosen the surface soil that flows through the steep slopes. Furthermore, the study region lying in a high seismic zone with characteristic unstable slopes are more susceptible to land deformation due to high seismic activities. The approach developed in the study could be an useful tool for constant monitoring and estimation of land deformation and analysis of the associated causes which can be easily applied to any other region.

1. Introduction

Land deformation has been a pervasive hazard in recent times. Various phenomena and natural processes, such as earthquakes, geological events, glacial movements, changes in groundwater flow due to aquifer overexploitation, mineral extraction, etc., result in the deformation of the Earth’s surface, changing its physical properties [1]. The causes of land deformation might be topographic, relating to the arrangement of forms and features on the Earth’s surface; geological, dealing with the stratigraphic construct; and hydrological, involving the impact of water distribution in an area [2,3]. Large earthquakes produce immediate ground deformation and may significantly affect the physical environment, altering hydrological and hydrogeological circulation, initiating mass movements, and causing immense damage to the infrastructure [3,4]. Subsidence, or the differential movement of the ground, can be induced by geological instabilities at varying depths, manifesting a slow, steady settling of soil that has a wide range of adverse effects, including but not limited to: flooding, drainage system disruption, slope changes, and foundational harm to urban infrastructure [5,6].
Presently, more than half of the world’s population, i.e., 55%, live in urban areas, which is expected to increase to about 68% by 2050 [7,8]. Excessive urban growth also results in the overutilization and unsustainable use of natural resources to fulfill the needs of the growing population [9,10]. Also, this extreme urban growth near natural and protected areas increases the proximity and accessibility of urban activities in the natural habitat and ecosystems of various species [11]. Larger water demands from the expanding population results in excessive withdrawal of groundwater from the underground aquifers [12]. The land deformation is known to be connected to declining groundwater [6] Today, India has the world’s largest yearly rate of groundwater depletion, rendering broad areas susceptible to subsidence. The over-extraction of the groundwater results in the lowering of the groundwater levels, resulting in the drying up of water wells also. Indian cities such as Delhi, Lucknow, and Chandigarh are already experiencing land subsidence due to groundwater extraction [1,2,3]. The soil in these regions is mainly thick alluvium with high clay content [4], which makes them highly susceptible to land subsidence [4]. Further, the regions built on soft sediments experience high land deformation [5], due to which the coastal cities such as Khulna and Kolkata situated in the Ganges–Brahmaputra delta [6,7], the California bay [8] regions experience high land deformation.
The surface water sources are interconnected with variations in the groundwater aquifers, and a significant amount of the water flowing in rivers comes from seepage of groundwater into the stream bed [13,14], depletion which may reduce water flow in such streams. Further, the continuous and fast extraction of the groundwater from underground aquifer systems results in the compaction of these acquires. The groundwater extraction doesn’t allow these aquifers to replenish themselves, resulting in permanent compaction leading to land deformation. Also, other factors such as underground tunneling in the urban construction projects results in damages in the sub-surface structure leading to land subsidence [15,16,17,18,19], further increasing the threat of damages, cracks, and faults to the urban infrastructures such as buildings, bridges, road networks, and water channels [10]. Thus, the interplay between groundwater depletion and associated land subsidence insists upon the need for continuous groundwater monitoring and land deformation measurements.
Natural hazards such as landslides and earthquakes are very powerful and potent physical processes that lead to land deformation. Another factor influencing land deformation is the impact of climate change, as floods [5], several extreme rainfall events which have increased since the past decade [20,21], which have critically increased soil erosion, often leading to subsidence, triggering landslides, and sometimes liquefaction [22]. The continuous deforestation and conversion of forest lands into agricultural fields results in groundwater level depletion as forests retain soil moisture, hence maintaining the groundwater levels by retaining the soil moisture [23,24]. Furthermore, in many parts of the developing world agriculture is heavily dependent on groundwater due to a lack of proper irrigation infrastructure, which adds to the pressure on the limited groundwater supply in a region. Unplanned and unchecked groundwater extraction through tube wells and local irrigation units have been rampant in India’s newly converted agricultural areas [25].
Monitoring land deformation through field sensors is challenging, particularly considering the constraints associated with retrieving spatially distributed information [10]. Synthetic Aperture Radar (SAR) remote sensing using time-series SAR interferometry (InSAR) has shown significant potential for long-term land subsidence monitoring [26,27,28,29]. SAR Interferometry techniques use the interferometric phase difference information between the two satellite passes to estimate corresponding land subsidence [30,31,32,33]. Any variation in the target position between the two satellite passes results in a corresponding phase variation. These phase differences between the satellite multi-passes are characterized using interferograms [30,34], utilizing which the land displacement is calculated in the radar LOS direction for each SAR pixel.
However, electromagnetic waves exhibit significant phase errors while propagating through the various atmospheric layers [35,36,37]. Other errors observed in the SAR interferometric techniques are typically the temporal decorrelation and the phase unwrapping errors, which often result in uncertainty in the interferometric phases and the corresponding LOS observations of elevation and displacement [26,38,39]. Time-series SAR interferometric techniques have the advantage of estimating and removing various spatial and temporal decorrelation phase noises [18]. Persistent Scatterer Interferometry (PSInSAR), a time-series SAR interferometry approach, is particularly robust to such errors, providing the accuracy in mm scale [18]. PSInSAR is primarily based on the principle of persistent scatterer selection from the natural and anthropogenic persistent scatterer targets for the estimation of land subsidence velocity in time series interferometric datasets [40,41].
Time-Series SAR Interferometry-based techniques such as PSInSAR has been applied in interpreting various earth surface dynamics and mechanism such as land subsidence, groundwater level variation earthquakes, and landslides [10,42,43]. Ferretti et al. in [44] first introduced the PSInSAR technique utilizing information pertaining to the permanent scattering candidates based on the amplitude dispersion technique for PS selection. Thereafter, Hooper et al. in [45] proposed Stanford Method for Persistent Scatterers (StaMPS), which included spectral phase diversity information, along with amplitude dispersion. These enhancements in the technique motivated Tamburini et al. to [46] use PSInSAR for observing and supporting the dynamic behavior of the sub-surface reservoir in terms of volumetric changes. Liu et al. [47] further applied the PSInSAR approach for analyzing very long-term spatio-temporal variations of land subsidence in Taiyuan, China, which revealed that ground deformation was concentrical around locations of intense groundwater withdrawal. In another study, Zhou et al. [48] worked on detecting and illustrating the spatiotemporal changes and subsidence in the Beijing Plain by applying PsInSAR based approach utilizing multi-source SAR datasets. Razi et al. [49] observed land deformation resulting from the high-intensity earthquakes in Chiba prefecture using time-series ALOS-2 PALSAR-2 SAR datasets applying the PsInSAR approach. Further, a study was conducted by Liu et al. [50] to retrieve temporal and spatial variation of ground settlement related to land reclamation in the Xiamen New Airport in China using C-band Sentinel-1 satellite datasets. Babaee et al. [51] worked on estimating the land subsidence induced due to groundwater extraction and analyzed the patterns between groundwater extraction and corresponding land subsidence in the Qazvin plain of Iran using ENVISAT and Sentinel-1 time-series datasets. Dumka et al. [43] attempted to quantify crustal deformation for the eastern continent of Kachchh using PsInSAR and GPS datasets for the duration of 2014 to 2019. Kumar et al. [4] further utilized PsInSAR with Sentinel-1 SAR datasets for accessing urban damage and land deformation due to the massive earthquake in Kathmandu city of Nepal in 2015. Further, Awasthi et al. [6] applied the PsInSAR approach for analyzing land deformation induced due to groundwater stress as a consequence of rapid urbanization using time-series SAR interferometric datasets.
Jammu city, the second capital in the union territory of Jammu and Kashmir suffers from a wide range of natural hazards, particularly landslides and land subsidence. However, studies investigating land subsidence in the region are virtually inexistent. This study particularly analyses the strength of the PSInSAR technique to determine the land subsidence velocities using Sentinel -1 SAR datasets for a rapidly transforming foothill region of the Indian Himalayas over a period of 6 years from November 2015 to July 2021 (due to data unavailability beyond 2015). The key causes of land deformation in the said region were also analyzed individually and correlated with the deformation estimates and finally, the most affected areas were determined.

2. Study Area and Dataset Description
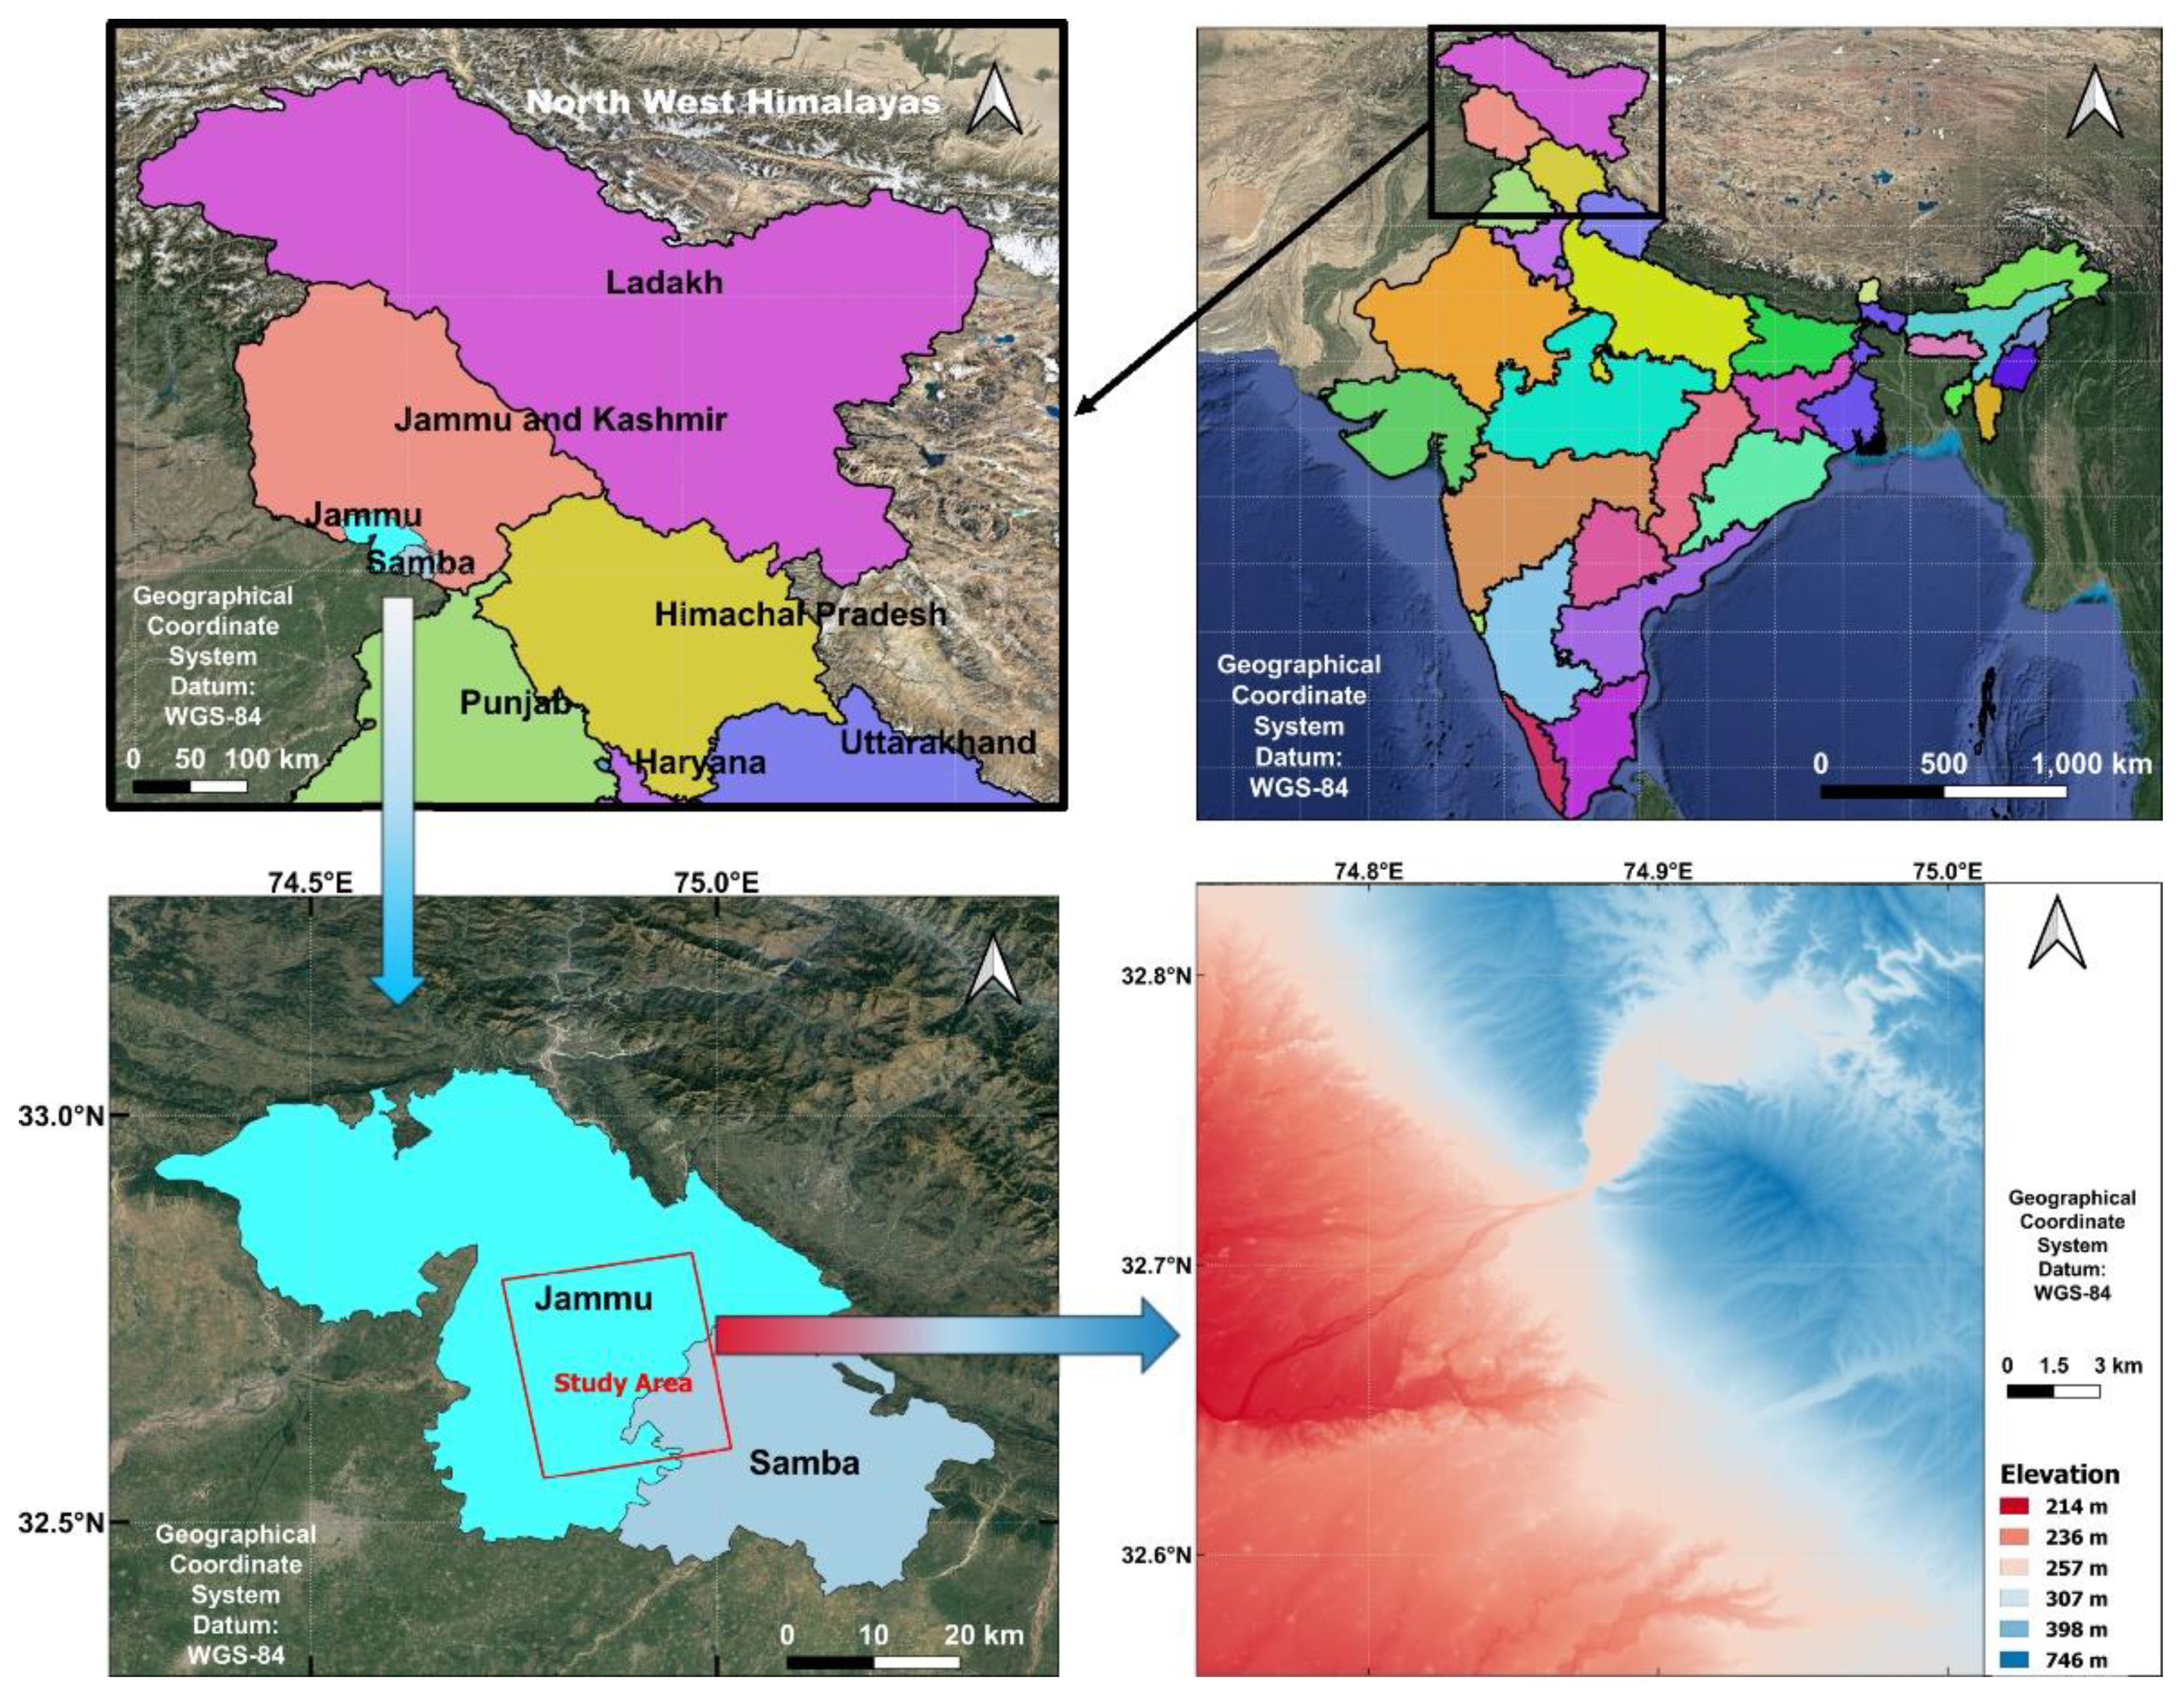
2.1. Study Area

The UT of J&K lies in the North Indian Himalayas exhibiting a large variation in the topography comprising high mountain ranges and several valleys in the northern and eastern parts and low-elevation plains towards the south and west. The Pir Panjal range acts as a natural bifurcation between the Jammu region and Kashmir valley. The Jammu region consists of forested mountains, foothills, and plains extending from the great North Indian plains to the Shivalik ranges, as observed from the regional topography shown in Figure 1. The study region covers an area of 603.82 sq. km extending between a latitude and longitude of 32.795° N and 74.736° E, and 32.591° N and 75.018° E, respectively. Jammu city is the most populated city in the entire UT of J&K, which is in the process of rapid transition from a Class-2 to Class-1 city (Census of India), accommodating significant magnitude of urbanization and population expulsion, as well as urban development following the rapid development of infrastructure. Thus, we selected a study area covering some of the prominent and well-populated regions of Jammu city and surrounding, as shown in Figure 1. The elevation in the study area varies from about 250 m to 700 m (see Figure 1), with mountain ranges extending from the South-East to the North-West, as shown in Figure 2 River Tawi is a tributary of Chenab, which flows through the region from the northeast to the southwest direction. The majority portion of the settlement and built-up extent in the region lies in the foothill zone surrounded by the mountainous front covered by dense vegetation towards the northeast and low-elevation plains covered by fallow or croplands towards the south and west.
The lower elevation regions towards the western part of the study area cover agricultural areas with some clusters of scattered built-ups corresponding to sparsely populated villages. Some of the extensive infrastructure development over the past few years has been observed in the mountainous region of the study area corresponding to premier educational institutes such as the Indian Institute of Technology (IIT) Jammu, and the Indian Institute of Management (IIM) Jammu. The Jagti village densely populates the relocated migrants from the Kashmir valley. The lower South-East region of the study area belongs to the Samba district, which is well connected with the Jammu district. Several small built-ups corresponding to unplanned villages can be seen along the western foothills of the mountain ranges. The entire Jammu region comprises two distinct major climatic zones, viz., the low-altitude sub-tropical zone (300–1350 m) and the mid-high altitude intermediate zone [52]. Firstly, the low-altitude subtropical zone (300–1350 m), which is covered by alluvial soils, and is characterized by relatively dry but severe winters, hot summers, and higher concentrations of rainfall during the monsoon season. The maximum rainfall in this region is received from July-September, and the hottest months are May–July as shown in Figure 3.

2.2. Dataset Details

2.2.1. Sentinel-1 Datasets

Time series Sentinel-1 SAR datasets were used for this study. The Sentinel-1 SAR sensor has a high pointing accuracy of fewer than 0.01 degrees [53,54]. The orbit tube dimension radius of Sentinel-1 datasets is 50 m, providing a high SAR interferometric accuracy [55]. Overall, 80 Sentinel-1 Ascending pass Interferometric wide swath mode (IW) Single Look Complex (SLC) datasets were acquired in the standard operating mode of Terrain Observation with Progressive Scans SAR (TOPSAR) [56].
The observation period for this study was between 12 November 2015 and 31 July 2021 and the datasets were acquired in C-band with a sensor operating frequency of 5.405 GHz using both the Sentinel-1A and 1B satellites. These satellites have their revisit time of 12 days, hence providing an overall repeativity of 6 days. The datasets were acquired in the VV polarization of spatial resolution 5 m × 20 m in azimuth and range and a swath width of 250 Km [54]. The perpendicular baseline of the interferometric acquisitions was in the range between −121 m to +90 m with respect to the master dataset. Detailed information regarding the datasets along with spatial and temporal baseline has been given in Figure 4. The Ascending pass interferometric dataset stacks were used for satellite path 100 and frame 102. The interferometric data stack in this stack was quite stable, with high overlapping and interferometric coherence. Providing the interferometric datasets for a large time interval suitable for PsInSAR processing. Whereas such continuous datasets fulfilling the criteria of the interferometric stack for PsInSAR processing in the descending pass datasets were significantly less in number. Hence, we used ascending pass datasets.

2.2.2. Auxiliary Datasets

Land deformation can be assumed as a multifaceted progression resulting from various types of exogenic or endogenic processes, depending upon their intensity and magnitude. Therefore, close observation of the different causative elements and their behavior with time is essential in understanding the degradation pattern, which could be highly complex and data-driven. In this study, the relationship between land deformation and the above surface processes was primarily analyzed, through the study period to understand their direct as well as indirect influence on the subsidence and upliftment retrieved from the PSInSAR processing with Sentinel-1 datasets. Landsat-8 optical datasets were used to assess the pattern and intensity of changes in the Land use Land cover (LULC) pattern over the study region for two time periods (2015 and 2021), only covering the beginning and end of the study period as it is a gradual process. Besides, 30 m resolution Copernicus Digital Elevation Model (DEM) data was used to derive the terrain profile and slope, etc., to determine the impact of topographic characteristics on the estimated deformation. Also, secondary information on different physical processes such as landslides, groundwater depletion, etc. for the region was collected to substantiate the findings.

3. Methodology and Implementation

The overall methodology workflow for the retrieval of land displacement velocity based on the PSInSAR processing Sentinel-1 datasets has been shown in Figure 5. The process involves two phases: firstly, beginning with the pre-processing of Sentinel-1 datasets for time-series interferometric stack generation, and secondly, implementation of the Stanford Method for Persistent Scatterers (StaMPS) processing for the retrieval of LOS displacement velocity.

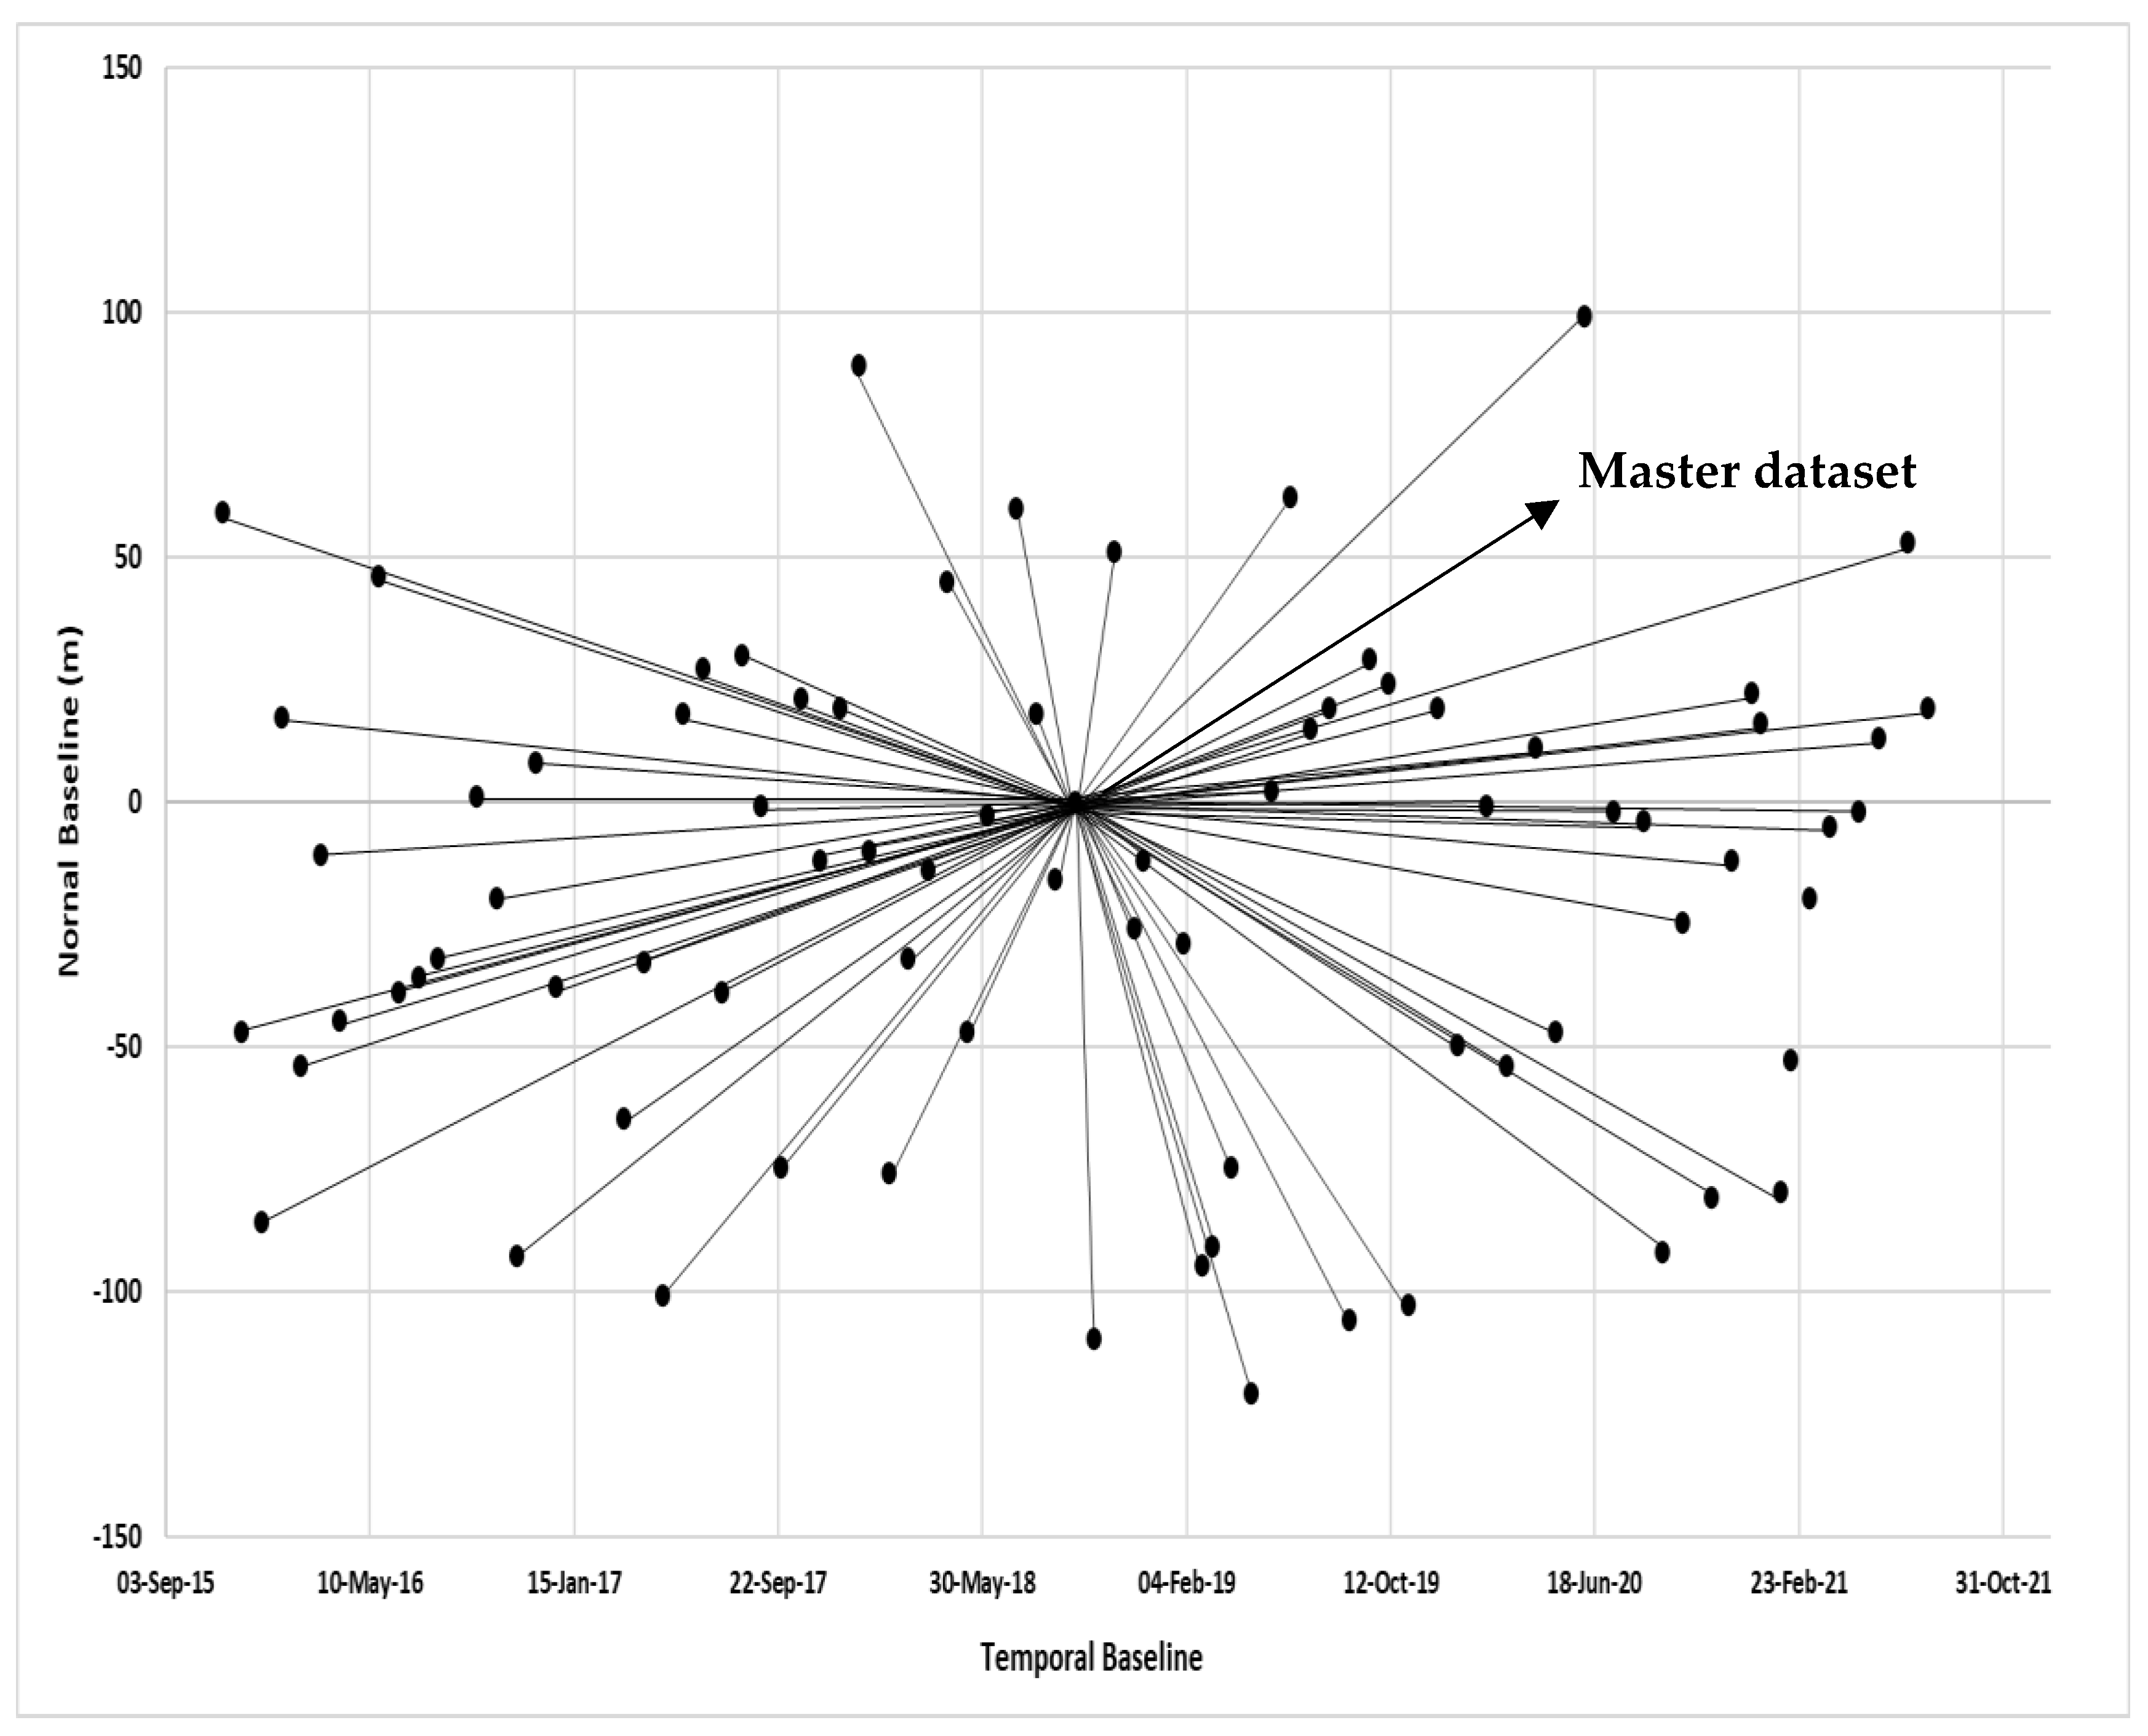
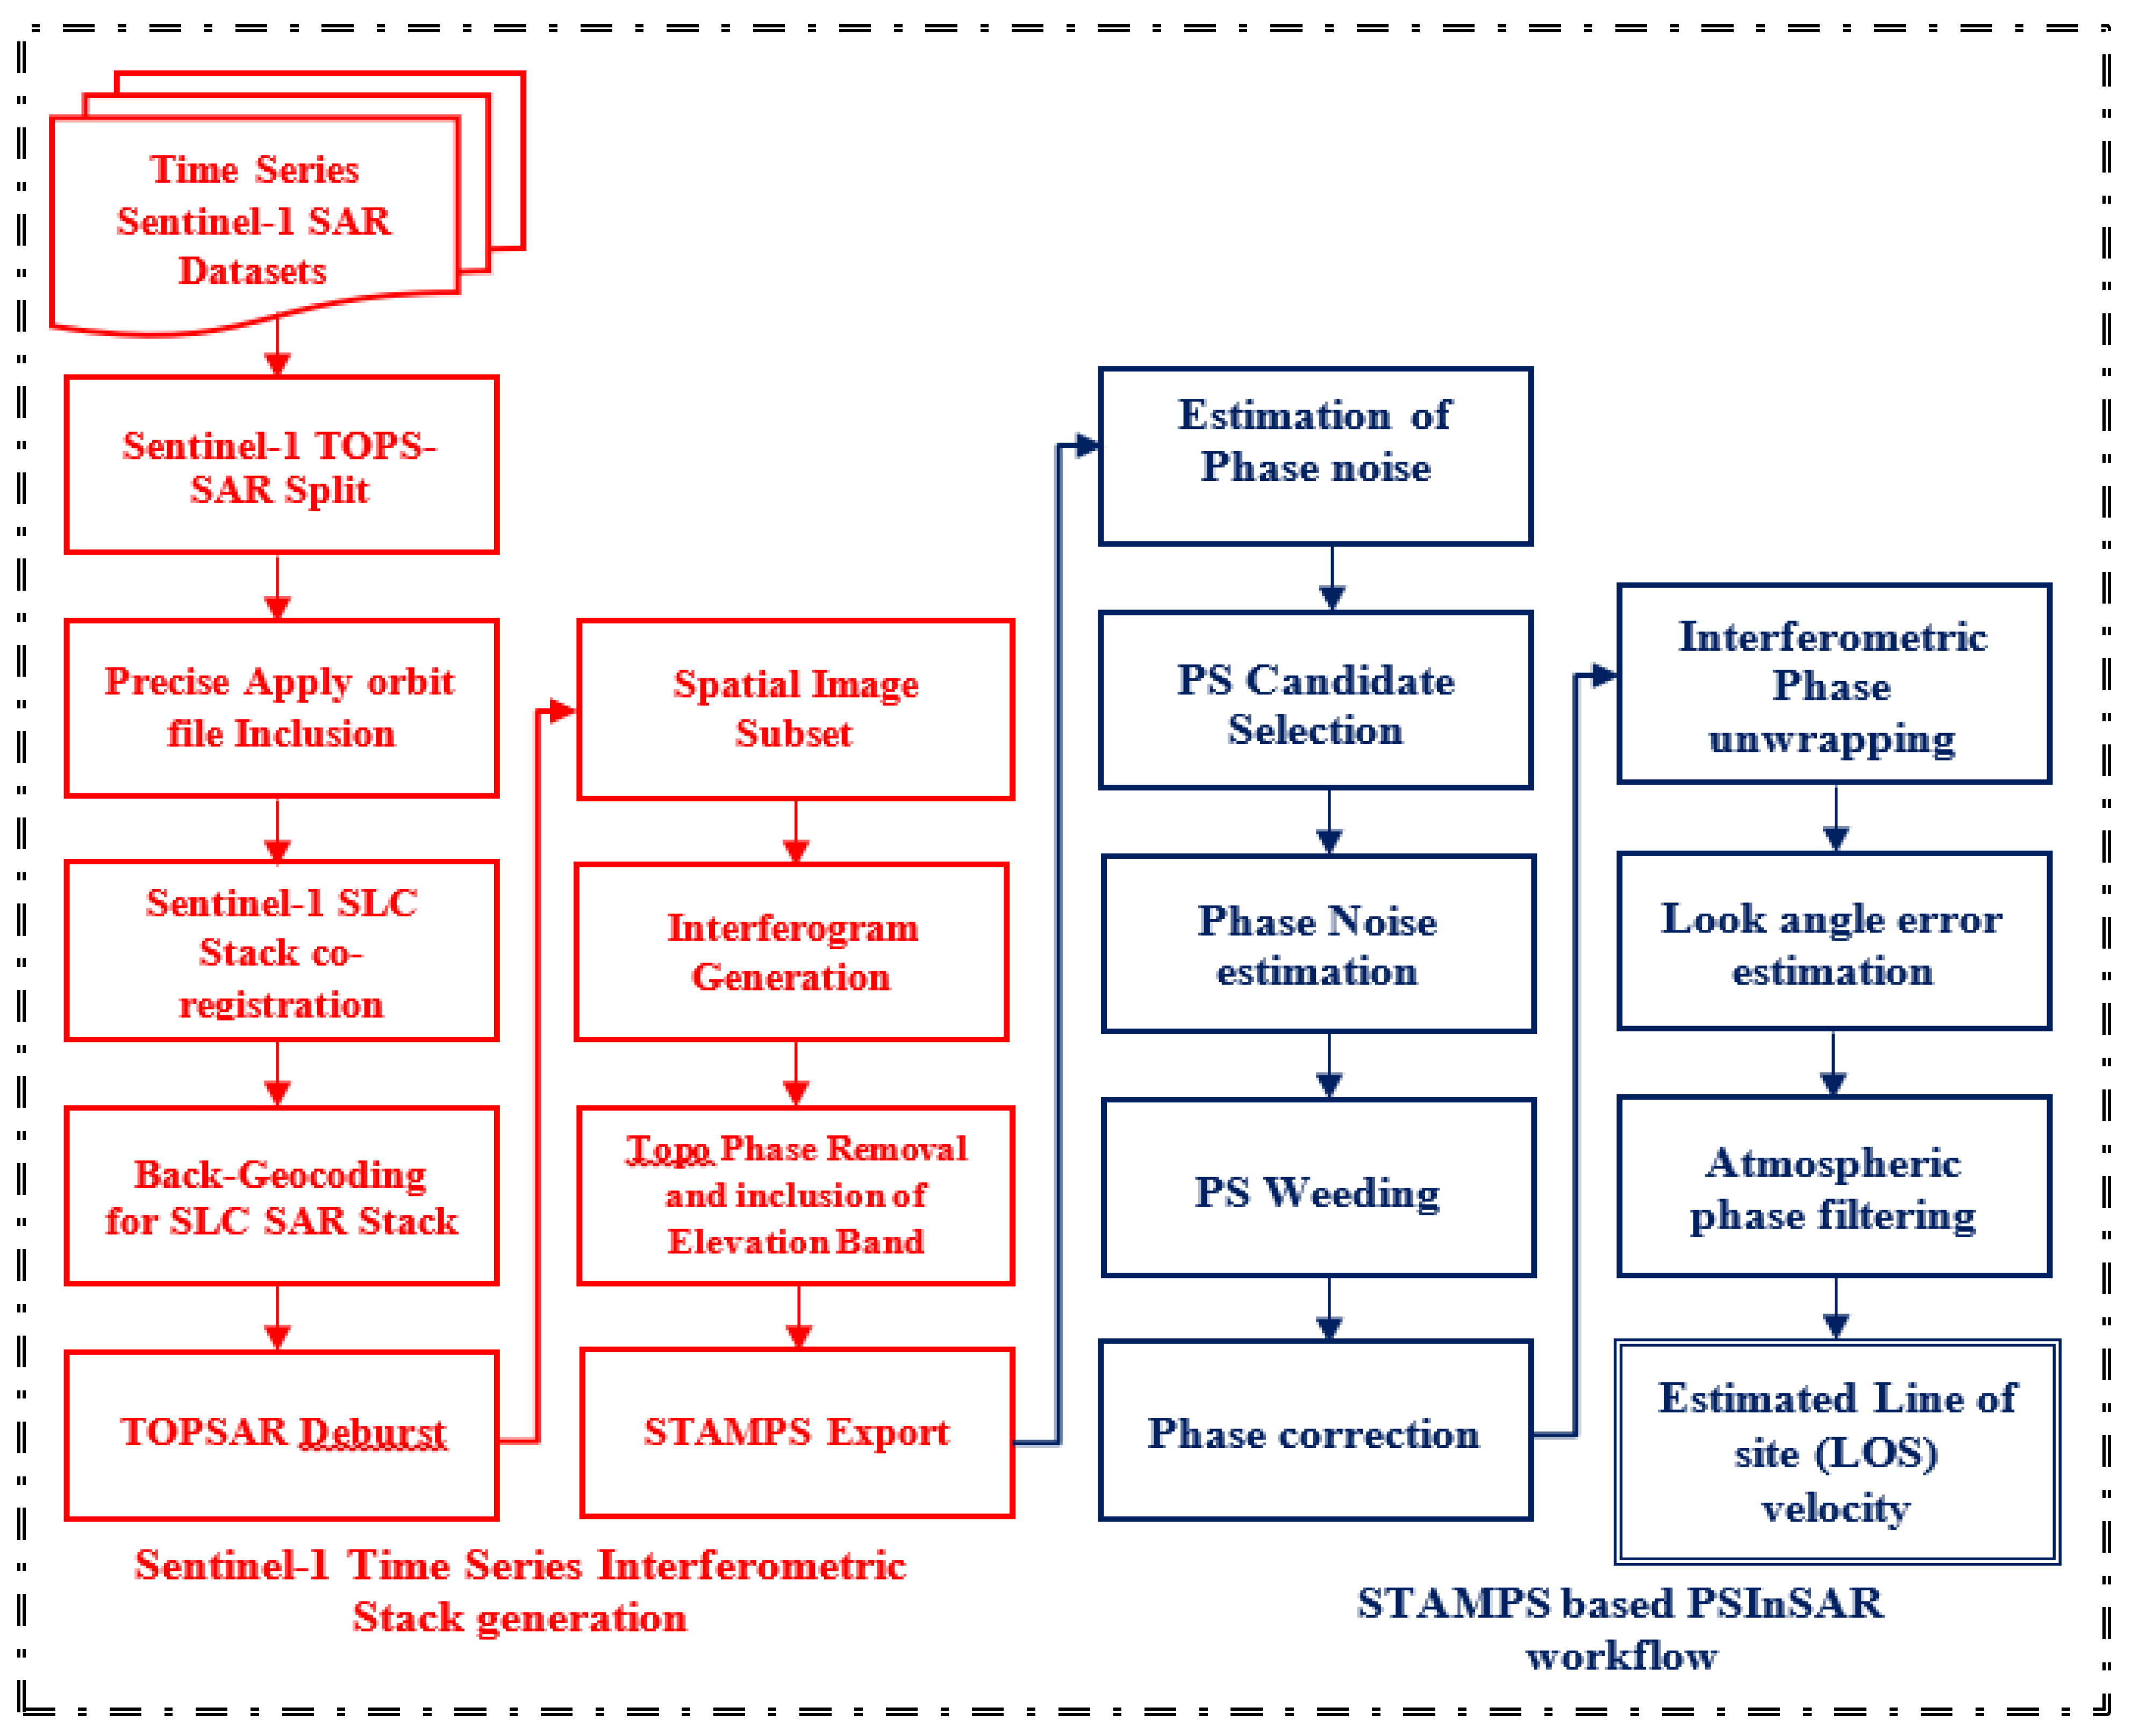
3.1. Time Series Sentinel-1 Dataset Pre-Processing and StaMPS-Based PsInSAR Implementation

Interferometric Sentinel-1 SLC SAR datasets are categorized based depending upon their acquisition date, and the master image was selected based on spatial baseline (B⊥) and temporal baseline (BTemp) [54,57]. The selected master image has a high interferometric complex correlation over the full time-series data stack. Further, the process of TOPS SAR split was performed to choose one of the three satellite sub-swaths i.e., IW1, IW2, and IW3 [57]. The precise information about the position of the satellite is incorporated using orbit information of the acquisition, followed by co-registration of all the Sentinel-1 images with respect to the master image. All these co-registered images were geocoded by applying a digital Elevation Model (DEM) assisted geometric correction in providing geo-coordinate information for each pixel in the datasets. The process of interferogram formation was performed thereafter using the phase difference between two complex SAR observations. Subsequently, Sentinel-1 TOPS deburst is done for combining individual bursts present in the datasets. Additionally, the topographic phase removal is performed using the SRTM (3 arc-seconds) DEM. Finally, these processed time-series SLC datasets were converted and exported into binary raster StaMPS (Stanford method for Persistent Scattering) format files.
StaMPS approach estimates the land deformation velocity using the Persistent Scattering (PS) pixels, which are self-consistent stable pixels having high interferometric complex correlation in the overall time-series interferometric stack. The StaMPS workflow execution was performed in four major steps, i.e., interferogram generation, phase stability estimation, iterative identification of the self-consistent network of stable pixels in the interferometric stack, and land deformation velocity estimation along the line of sight. The overall composite interferometric coherence is characterized as follows:
ρ total = ρ temporal ρ spatial ρ Doppler ρ thermal
where ρ temporal is defined as temporal correlation, ρ spatial is spatial correlation, ρ doppler is doppler frequency correlation, and ρ thermal is the thermal correlation. The persistent scatterers (PS) are selected utilizing amplitude dispersion index and phase-based approach. The amplitude dispersion index D A is a ratio between standard deviation ( σ A ) and mean of the amplitude values μ A for each pixel of the set of SLC images. Phase based approach considers the interferogram as the combination of deformation phase, Atmospheric phase screen, Phase due to Precise orbit errors, Topo correction errors, and Uncorrelated noise phases. The Deformation phases have low spatial as well as temporal correlation, whereas, the atmospheric phase screen and Precise orbit phase errors have the properties of low spatial correlation but high temporal correlation. Further, topo-phase correction error and the uncorrelated noise phases show high spatial correlation and low temporal correlation. Lastly, uncorrelated noise-phases has high spatial correlation and low temporal correlation [45]. Therefore, spatio-temporal filtering is required for separating each phase component. The following equations are applied for estimating the PS candidates in the InSAR stack.
D A = σ A μ A
φ x , i = w φ D , x , i + φ A , x , i + Δ φ S , x , i + Δ φ θ , x , i + φ N , x , i 2 π
Here, the φ x , i denotes wrapped phase related to xth pixel in the ith interferogram; φ D , x , i shows the phase variation due to pixel displacement in the direction of flight; φ A , x , i indicates the phase caused by atmospheric delay; Δ φ S , x , i displays residual phase induced by inaccuracies in satellite orbit and the external DEM; Δ φ θ , x , i is the consequent Phase caused by the inaccurate look angle; φ N , x , i is the phase noise term generated in a SAR resolution cell due to uncorrelated non-dominant scatterers; w is the wrapping factor, which determines the phase value wrapped with the 2π [40,58]. The residual uncorrelated look angle error was diminished by removing the topographic phase error. Furthermore, the residual Phase’s stability ( Υ X ) was assessed as follows:
Υ X = 1 N i = 1 N e x p 1 φ x , i φ ˜ x , i Δ φ θ x , i u
Here, N denotes the total number of interferograms, φ ˜ x , i is a wrapped estimation of the spatially correlated components of the interferometric phase φ x , i , i.e., atmospheric error phase, the satellite inaccuracy phase error, and the phase resulting due to the look angle error. The term Δ φ θ x , i u is defined as the unwrapped approximate of the topographic phase error [40,58]. Further, the spatially uncorrelated look angle error or Digital Elevation Model error is eliminated by subtracting the estimated residual topographic phase error from the phase of selected PS pixels [40,58].
Finally, spatially correlated look angle (SCLA) error in the persistent scattering candidates is calculated after implementing the phase unwrapping. This SCLA error is determined by applying a high pass filter in time and low pass filter in space to the unwrapped phase values. Finally, the SCLA error is subtracted from the remaining phase to retrieve the residual phase, resulted due to the deformation. Hence, one-dimension-line of sight (1D-LOS) velocity component is generated for the study area using StaMPS [40,58].

3.2. Analysis of Land Deformation Causes

LULC changes over a certain period are very important as well as appropriate indicators of not only the changes in land surface dynamics but also of the sub-surface as well as climatic construct over a region. It can be considered as a proxy for many other complex processes and data which are difficult to obtain or often go unmeasured, especially due to a lack of resources in developing regions or in remote locations [59,60]. Therefore, in line with the objective of this study, LULC products were prepared for the study region with an interval of 6 years (2015, 2019) to understand the influence of changes in the land surface on the estimated deformation. Moderate-resolution Landsat-8 optical images adequate to achieve Level-1 classification, to broadly distinguish between the different LULC classes were obtained from USGS for both periods. Appropriate pre-processing and atmospheric correction techniques were then utilized to convert the data into ground reflectance products so that the spectral signatures of different surface features could be used to categorize them into different LULC classes.
The portion covering the study area was then extracted from the images, followed by the adoption of a supervised learning approach to classify them. An appropriate number of training and testing samples for different surface features were first collected from throughout the parent images with the aid of visual interpretation as well as other secondary information and field knowledge. Then 70 percent of the samples were applied to train the Maximum likelihood Classifier algorithm, to classify the images into 5 different categories, viz., Built-up/Settlement, Vegetation, Agriculture, Waterbodies, Barren lands (consisting of sands bars and scrublands), using an adequate number of iterations. The obtained results were then validated using the remaining 30 percent of test samples previously collected by generating a confusion matrix to compute the overall accuracy and the associated kappa coefficient value of the classified products. The final LULC products thus obtained were again critically analyzed for misclassification, and further contextual refinement was applied to improve the results. Further, secondary information from different sources along with slope profiles from elevation data was used to identify locations where landslides (induced by earthquakes, slope instability, anthropogenic activities, etc.) have occurred during the study period, which is another major cause of land deformation.

4. Results and Discussion

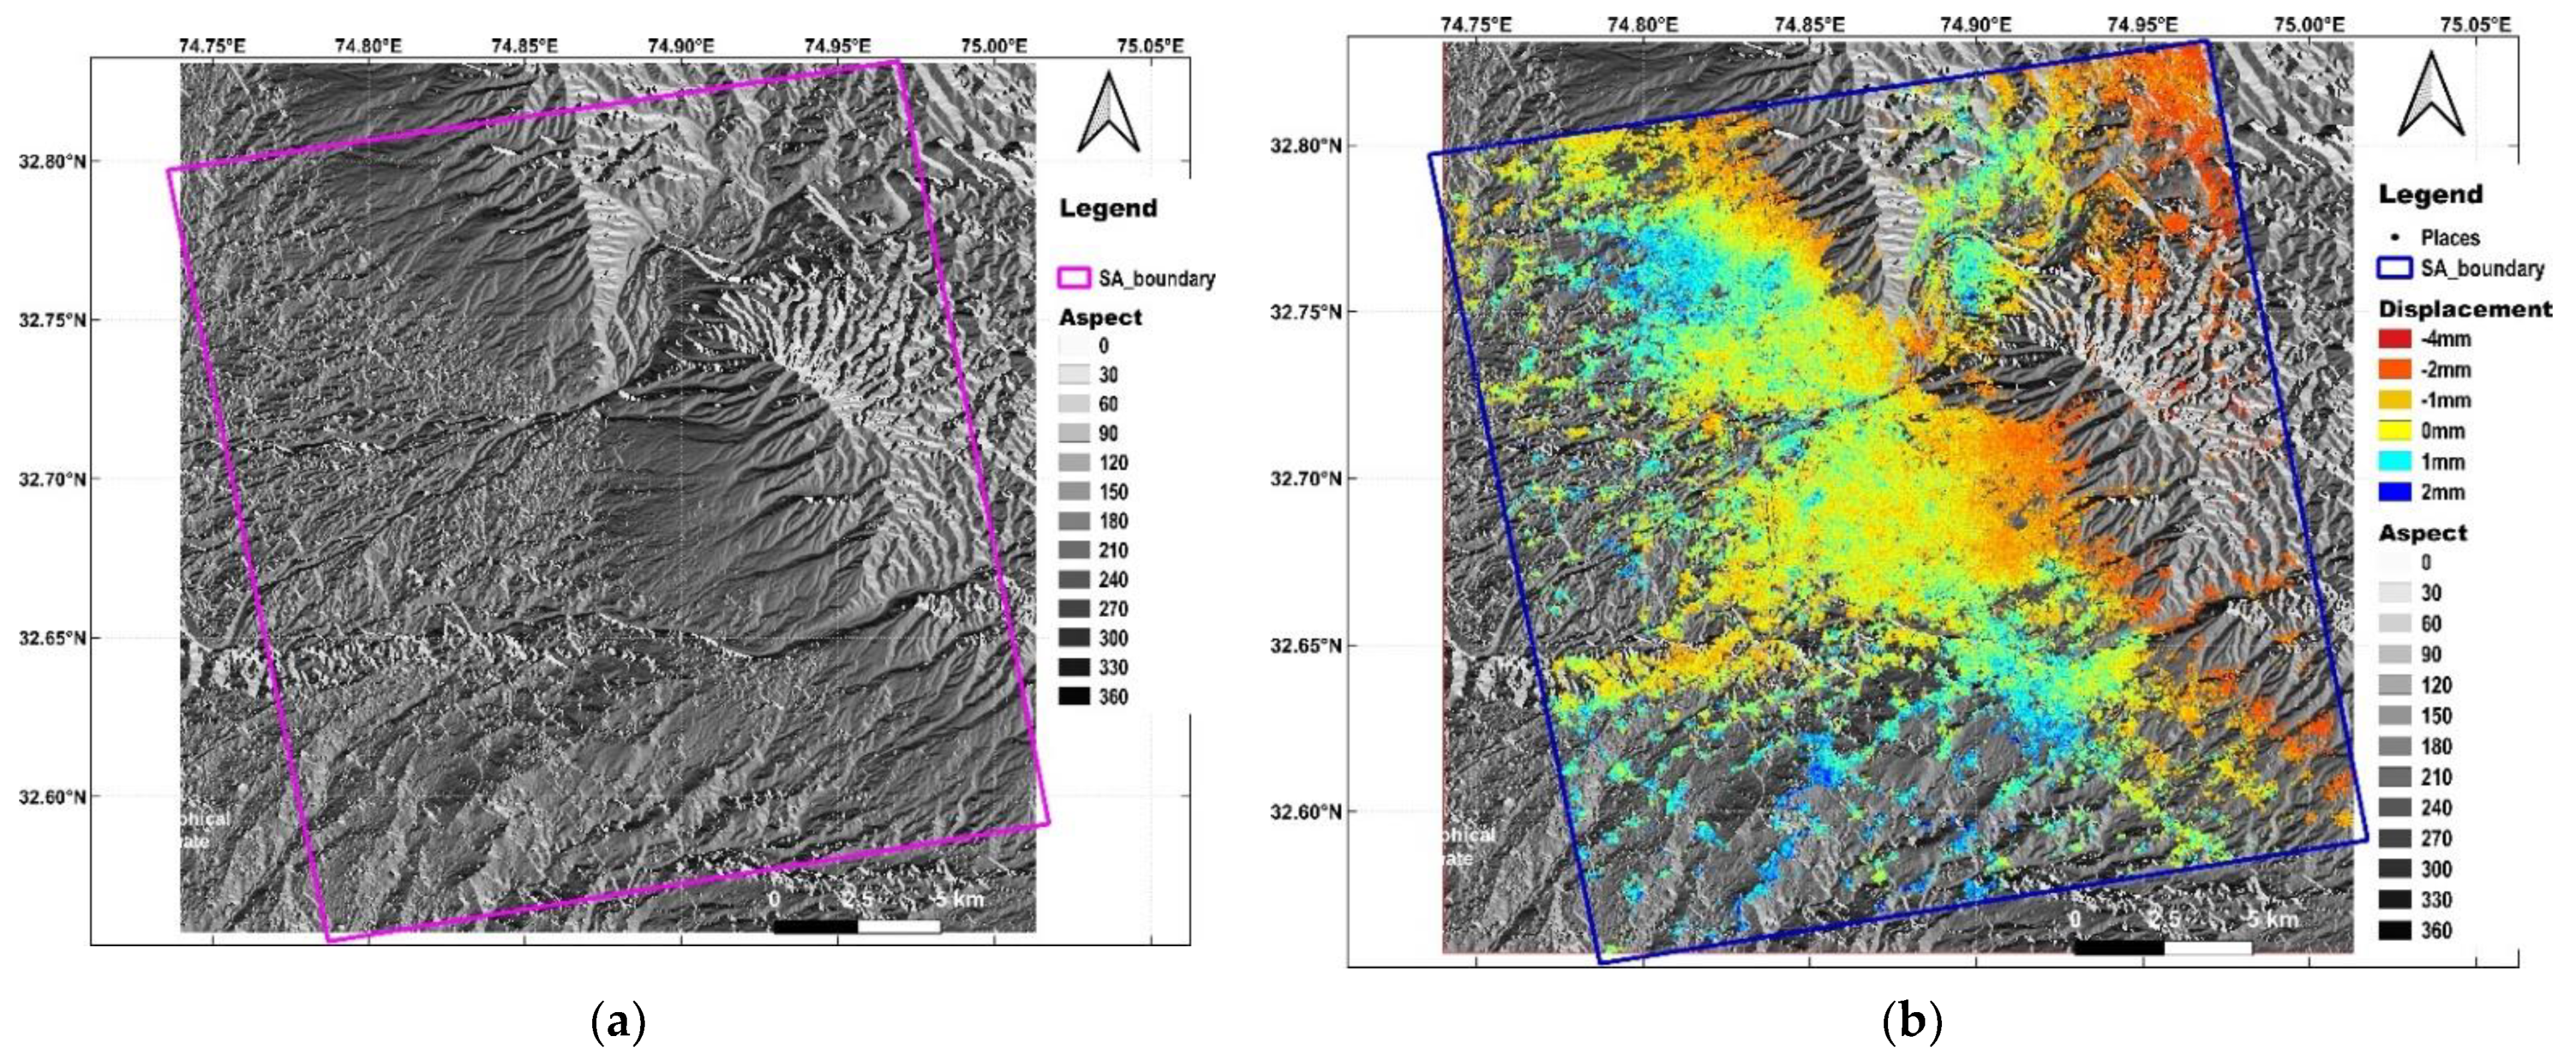
4.1. Land Deformation Analysis in the Region

The vertical surface movement from PSInSAR processing of Sentinel-1 datasets reveals two critical pieces of information corresponding to the LOS of the sensor: first, the subsidence is indicated by negative values; and second, the upliftment is represented as positive values. Although these values are not comparable with any field measurements or field sensor data, they are indicative of subsidence and upliftment, which have been known to match the patterns of subsidence and upliftment in the literature [61,62,63].
The line-of-sight displacements retrieved from the Sentinel-1 based PSInSAR processing that is indicative of subsidence and upliftment are evident along the northeastern mid-altitude regions of the study area, around the villages of Katal Batal, Bajalta, Ban, and Bhedgran, where the rate of subsidence is slightly higher (quantitative value). Similar conditions persisted along the foothills of the mid-latitude Himalayan ranges spanning diagonally across the study area, with prominence in the South-East regions of Jammu and some parts of the Samba district that is included within the study area. Most of the subsidence pixels are observed along the steep slopes where potential landslide zones exist, which are further analyzed in Section 4.2. Much of the densely populated city areas show similar to 0 mm displacement or some upliftment similar to 1 mm, indicating no changes in the surface dynamics in the older and already developed parts of the city. This could also be attributed to the shorter period of study due to the unavailability of data, with an assumption that if the study period could have been extended for a longer time period, a significant magnitude of subsidence would have been definitely observed in other parts of the study area (e.g., in and around the core city, the agricultural lands, etc.). However, in the present context, major upliftment was observed in the outskirts and peri-urban areas of Jammu city surrounded by agricultural land towards the South-West regions, and towards the North-West regions where maximum development and transformations have occurred in the past decade.

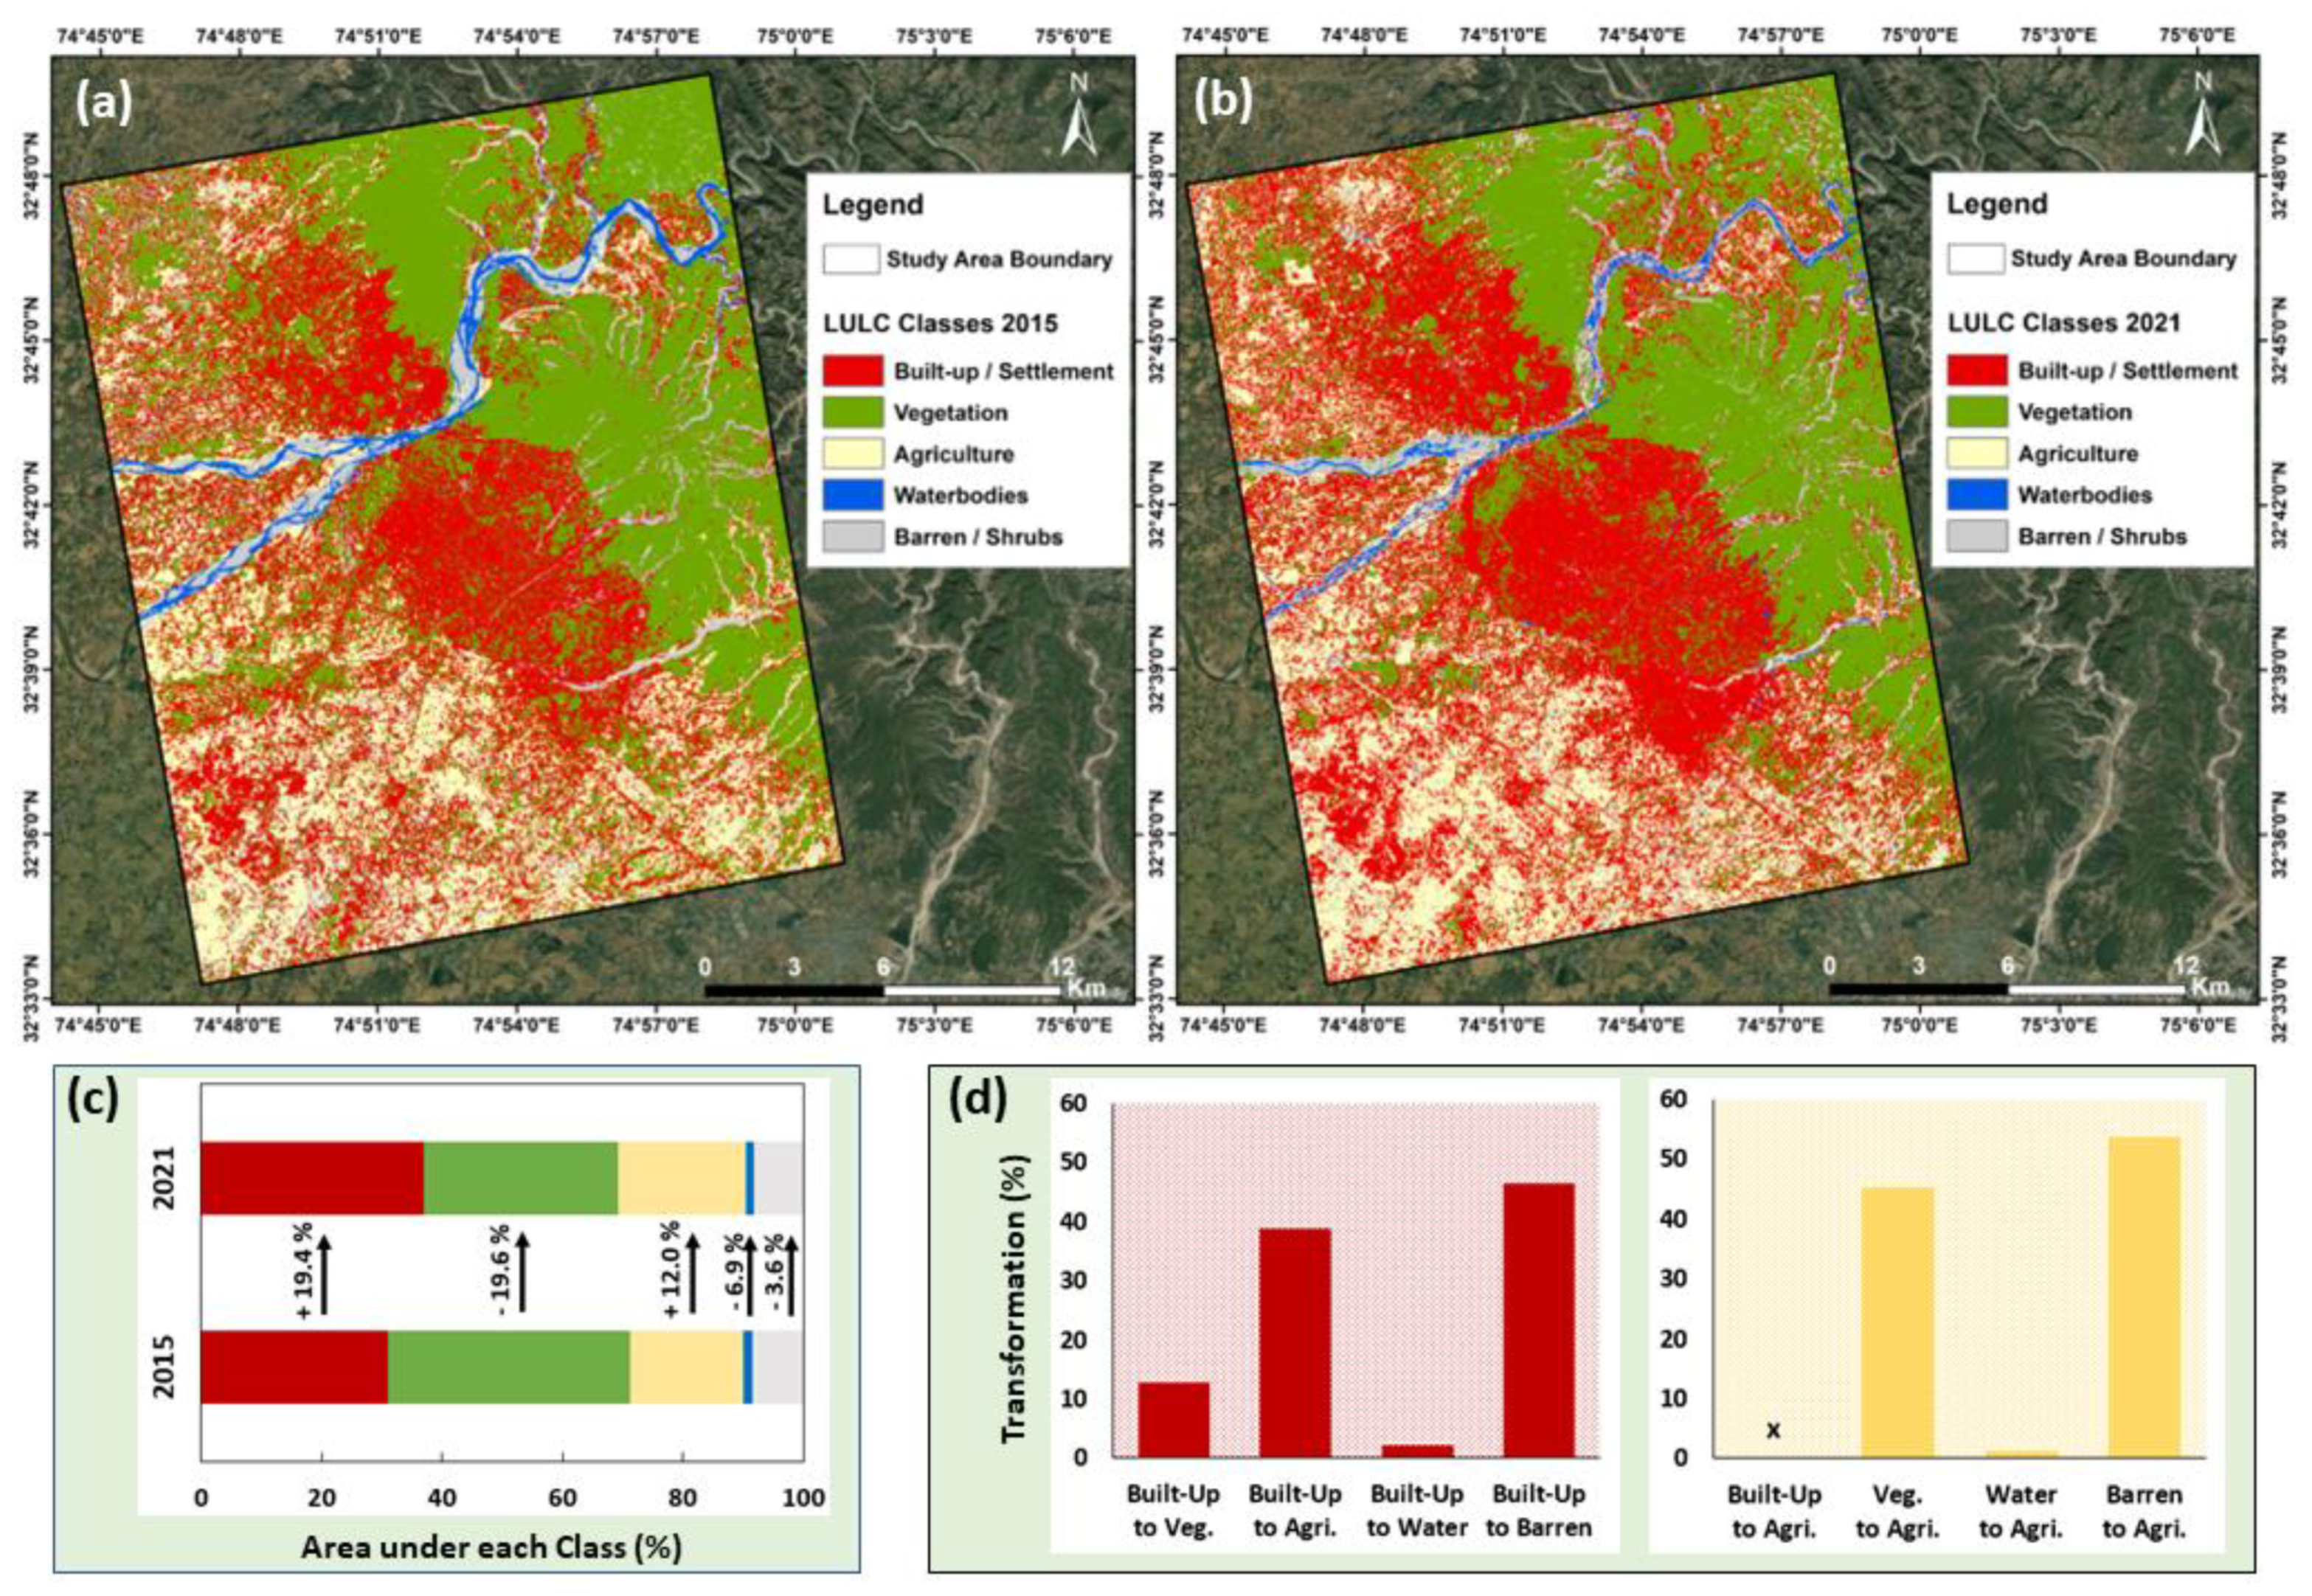
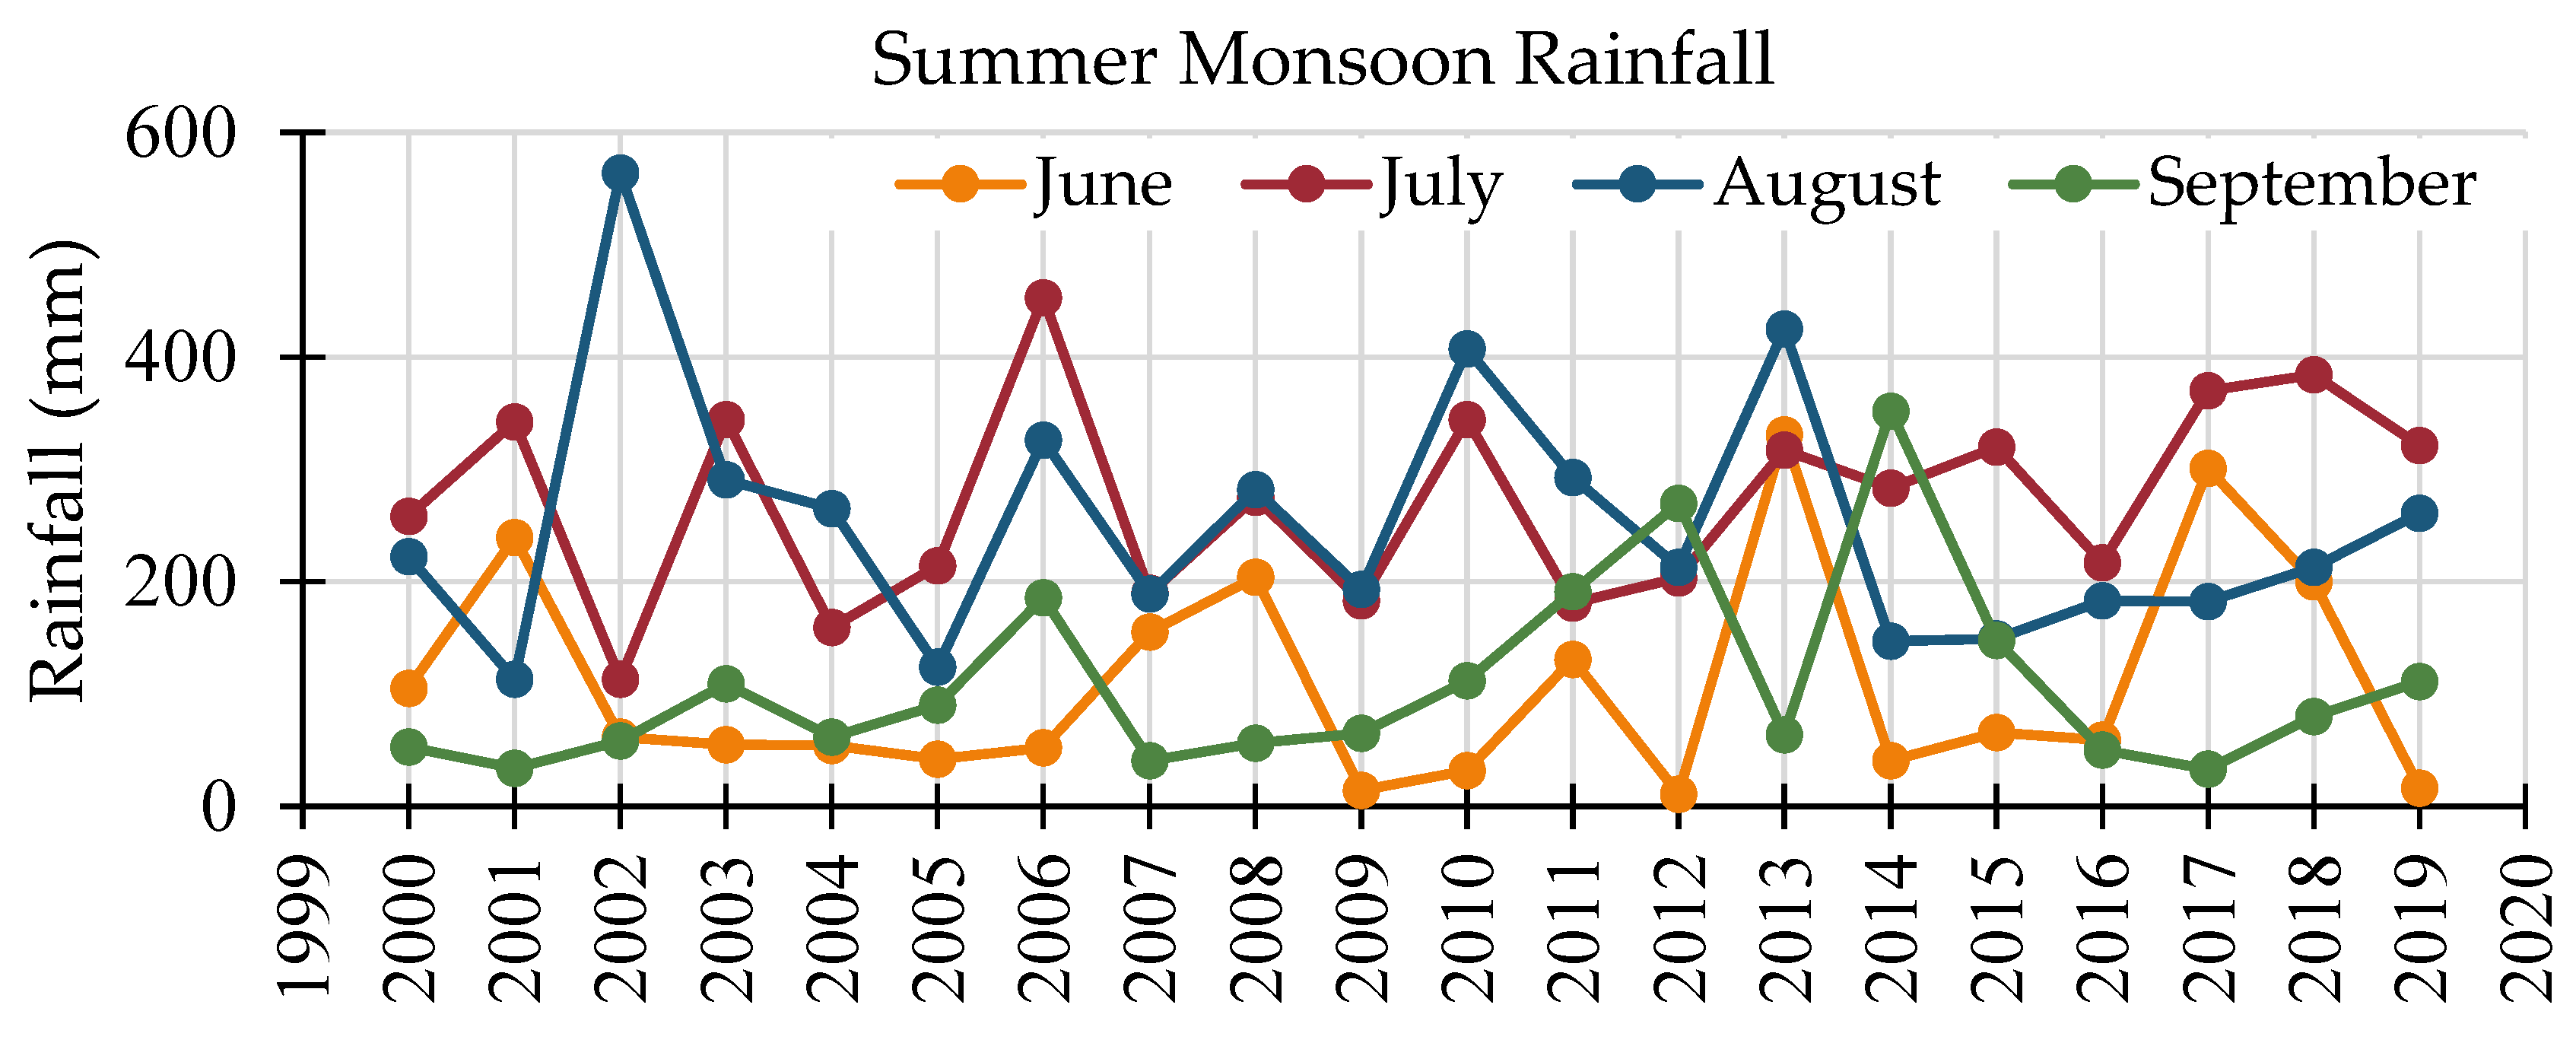
4.2. Assessment of Various Factors Leading to Land Deformation

The LULC classification results indicate towards a significant change in the Jammu region in a short span of 6 years (2015–2021), showing an increase in anthropogenic influence over the land surface and a decline in the natural land cover (Figure 6). It was observed that the MLC algorithm performed considerably well in moderate-resolution data for Tier-1 classification, achieving an overall accuracy of 83.4% and 81.7% with Kappa coefficient values of 0.63 and 0.61 for 2015 and 2021 respectively. The most prominent changes were observed over the urban/settlement, agricultural and vegetated areas, with relatively lesser alterations over the waterbodies and barren lands. A significant expansion was observed in the built-up extent (19.4%), specifically towards the low-altitude regions of the study area, transitioning primarily from barren/scrublands (46.4%), agriculture (38.7%) and the forest/vegetated areas (12.8%). Another key observation from the LULC maps is the increased built-up along the foothills of the mid-altitude Himalayan ranges spanning diagonally across the study area. On comparing the LULC products for the two time periods it could be deduced that the forest cover has decreased (19.6%) due to the aggressive conversion of natural lands to facilitate the urban development process. Further, the expansion of agricultural lands (12.0%) at the cost of the vegetated areas (45.3%) and the barren/scrublands (53.5%) was also evident from the analysis. Although the barren areas have transformed notably to built-up or agriculture, the overall change in the total area under this class is relatively low (6.9% decline), since some parts of the vegetated areas have converted into barren. Besides, the water pixels, primarily constituting the Tawi river channel depicted the least modification (3.6% decline).
As has been mentioned earlier, rapid depletion of the groundwater table underneath a region can act as a major cause of surface upliftment and subsidence [12]. LULC pattern over an area can represent the nature of unchecked groundwater extraction practices in the case of developing regions where sufficient regulations are not in place. Rapid and unplanned development of urban areas or settlements significantly heightens the water demand of a region, which leads to overutilization of the groundwater reserves. Besides, the acceleration in agricultural activities with the conversion of more and more natural surfaces (forests, vegetated lands, scrubland, etc.) having higher groundwater retention capabilities, as well as inter and multiple cropping practices without planned irrigation facilities, also exert tremendous pressure on the overall groundwater aquifers. Therefore, changes in the LULC pattern were used as an alternative in the absence of groundwater level information to understand its impact on land deformation, which is also evident in the present study as the areas with a higher change in built-up and agricultural lands coincide with areas depicting the higher rate of subsidence (Figure 6 and Figure 7).
Rapid and unplanned development of urban areas or settlements significantly heightens the water demand of a region, which leads to overutilization of the groundwater reserves. Besides, the acceleration in agricultural activities with the conversion of more and more natural surfaces (forests, vegetated lands, scrubland, etc.) having higher groundwater retention capabilities, as well as inter and multiple cropping practices without planned irrigation facilities, also exert tremendous pressure on the overall groundwater aquifers. Therefore, changes in the LULC pattern were used as an alternative in absence of groundwater level information to understand its impact on land deformation, which is also evident in the present study as the areas with a higher change in built-up and agricultural lands coincide with areas depicting the higher rate of subsidence (Figure 6 and Figure 7).
India due to its vivid climate, topography, and geological settings has been highly vulnerable to natural disasters [18]. According to a joint report by the World Bank and the Center for Hazards and Risk Research. Columbia University, the Indian Union Territory of J&K being situated in seismic zone 4 and 5 is severely exposed to geological and hydrological natural disasters. The Earthquake hazard is observed to be in the 5th to 10th decile, and the landslide hazards are observed to be between the 6th to 10th decile [19], where both these hazards significantly impact the land surface dynamics of the area, often resulting in land deformation common around the roadsides.
This particular study region lies in the seismic Zone 4 [64], and has been hit by quite a few episodes of small and moderate earthquakes over the course of the past one hundred years, resulting in damages to the buildings and civil infrastructure [64,65] (Figure 8a,b). The Jammu region has been impacted by a large number of earthquakes with epicenters all throughout the Himalayan belt during the last decade, which coincides with the study period (Table 1). The continuous occurrences of earthquakes in this region could be assumed as major instigators of change in land dynamics, triggering landslides which ultimately leads to land deformation [66].
Further, the mountainous zones of Jammu having steep slopes are known to be vulnerable to frequent landslides also induced by slope instability, a high rate of erosion during the monsoon season, apart from earthquakes. The increased frequency of landslides in the J&K region of India, not only damages the infrastructure but is also a major threat to the geo-environment and socio-economic character of the region. Landslides are generally trigged due to rainfall and earthquakes, and called as rainfall and earthquake-induced landslides [67]. The factors such as land cover, lithology, precipitation, aspect, slope, elevation, distance to drainage, distance to roads, and distance to faults are the important parameters that trigger landslides in the region [67]. This region is highly susceptible to landslide and is one of the most intensive landslide-prone zone in India. Various landslide activities have been observed in the recent past which resulted in road blockages, damages to the infrastructure, utility services, etc. [68] (Figure 9a,b).
As per secondary information and field experience, downslope landslides are found to be remarkably common around the roadsides in this region, particularly along the ‘Thandi Sadak’ road, which connects the National highway NH-44 from Sidhra to the Jammu city in Panjtirthi. Often such rockfalls and mudslides are observed following a period of extreme rainfall over the area, frequent during the pre-monsoon and the monsoon season (see Figure 3b,d) [22]. Extreme rainfall events in the Jammu district are often observed after prolonged extremely warm periods, which causes significant surface soil erosion [71]. Figure 10 and Figure 11 depict the slope and aspect derived from the 30 m Copernicus Digital Elevation Model (DEM) [72]. Figure 11 and Figure 12 evidently depict the increased subsidence at slopes of about 15–20 degrees. Moreover, it is evident that the subsidence is significant along the East facing slopes of the mountain ranges, where erosion is significant towards the Jammu city area, particularly along the Channi Rama and the Bhatindi regions (see Figure 2). The mean monthly precipitation for the summer and winter monsoon season for the Jammu district also observes significant peaks indicating high levels of precipitation (Figure 13). These discrete events of high precipitation are typically localized, often severely affecting the region under impact. As per the report by the Department of Jal Shakti, UT of J&K, and Central Groundwater Board North Western Himalayan Region Jammu, the depth to ground water level has varied significantly during the pre-monsoon, monsoon, and the post-monsoon seasons, where an implication of the variation in the regional precipitation can be observed [73].
Therefore, from the overall analysis, it could be inferred that, towards the North-East end of the study area, where the slope is observed to be the highest, maximum subsidence is observed in the rapidly developing urban areas such as Bajalta and Katal Batal. Subsidence is also observed along some of the Tawi river channels, such as in the Uttarbehani and Purmandal regions, which could be attributed to the transformation of forested areas into agricultural land in recent years. Other subsidence pixels observed in the mid-altitude regions along the mountains are possibly due to a series of landslide events that are frequently observed in some parts of the study area. In contrast, the upliftment is observed mostly in the flatter low-altitude regions towards the South-West regions where rapid urbanization and urban expansion have occurred over the past decade. A key observation to note here is the upliftment observed in some of the mountainous areas in Sidhra and Nagrota, which underwent a significant rate of infrastructure and residential housing development in recent years. Figure 12 shows the variation of displacement corresponding to the elevation, slope, and aspect retrieved from the Copernicus 30 m DEM. We can observe subsidence as the elevation and the slope increase, in contrast, the influence of aspect on the subsidence or displacement is negligible, as also observed in Figure 6.

5. Conclusions

The objectives of this study were to assess the Land Deformation and the associated causes for the rapidly developing Himalayan foothill region using multi-temporal Sentinel-1 SAR datasets. The PsInSAR-based approach was used to retrieve the land deformation velocity and patterns in the region from 2015 to 2021 and the associated causes were systematically analyzed. The observed PSInSAR deformation velocity results ranged between −4 mm to 2 mm per year. The obtained results indicated maximum subsidence of about −4 mm in the Northeast regions of Jammu, and significant upliftment in the urban, southern, and northwest peri-urban regions. A strong linkage was observed between the subsidence and the LULC changes characterized by urban growth and continuous deforestation leading to the conversion of forest lands into agricultural fields. Moreover, high subsidence was observed along the unstable terrain conditions accompanied by continuous seismic activities. Further, several landslide-prone and vulnerable regions in the area were found to overlap with the estimated subsidence. Therefore, the adopted methodology for this study efficiently estimates land deformation measured using PsInSAR and links with the probable anthropogenic causes such as built-up, agricultural region increase, and forest decline, as well as natural causes of land deformation such as earthquakes and landslides and soil erosion induced by heavy precipitation, etc. The geographical, social, and economic aspects of the Jammu district have a significant influence on regional sustainability in the state of J&K in India. The surface dynamics of the Jammu district are largely unreported, and considering the regional significance of the region, this study provides significant information for land and infrastructure planning and management authorities. Besides, this methodology could be easily applied to any other region and a similar analysis could reveal the linkages between land deformation and different physical and anthropogenic factors typical to that region.

Author Contributions

Conceptualization S.A., D.V., S.B. and H.S.; methodology, S.A., D.V. and H.S; software, S.A., H.S. and S.S.; validation, S.A., D.V. and H.S.; formal analysis, S.A., D.V., S.B. and H.S.; investigation, S.A., S.B. and D.V.; resources, K.J. and D.V.; data curation, S.A. and H.S.; writing—original draft preparation, S.A. and D.V.; writing—review and editing, S.A., S.B. and D.V.; visualization, S.A., D.V. and H.S.; supervision, K.J.; project administration, K.J.; funding acquisition, S.S. All authors have read and agreed to the published version of the manuscript.

Funding

This research was funded by the Princess Nourah bint Abdulrahman University Researchers, Supporting Project number (PNURSP2022R259), Princess Nourah bint Abdulrahman University, Riyadh, Saudi Arabia.

Data Availability Statement

The datasets used in this study are open-sourced and available online.

Acknowledgments

The authors would like to thank ESA (European Space Agency) and Alaska satellite facility (https://asf.alaska.edu/, accessed on 31 October 2022) for providing the Sentinel-1 datasets of the Copernicus mission and Copernicus 30 m Digital elevation model datasets (https://spacedata.copernicus.eu/, accessed on 31 October 2022). Further, the authors would like to acknowledge the earth explorer USGS (https://earthexplorer.usgs.gov/, accessed on 31 October 2022) for providing access to the Landsat-8 datasets.

Conflicts of Interest

The authors declare no conflict of interest.

References

  1. Feng, Q.-Y.; Liu, G.-J.; Meng, L.; Fu, E.-J.; Zhang, H.-R.; Zhang, K.-F. Land Subsidence Induced by Groundwater Extraction and Building Damage Level Assessment—A Case Study of Datun, China. J. China Univ. Min. Technol. 2008, 18, 556–560. [Google Scholar] [CrossRef]
  2. Data Application of the Month: Land Deformation Mapping Using Dinsar|Un-Spider Knowledge Portal. Available online: Https://www.un-spider.org/links-and-resources/data-sources/daotm-land-deformation (accessed on 22 October 2022).
  3. Tangdamrongsub, N.; Šprlák, M. the Assessment of Hydrologic- and Flood-Induced Land Deformation in Data-Sparse Regions Using Grace/Grace-Fo Data Assimilation. Remote Sens. 2021, 13, 235. [Google Scholar] [CrossRef]
  4. Kumar, A.; Manisha; Lal, P.; Prasad, A.; Tripathy, P.; Saikia, P. Analyzing Urban Damage and Surface Deformation Based Hazard-Risk in Kathmandu City Occurred During Nepal Earthquake (2015) Using Sar Interferometry. Adv. Space Res. 2022. [Google Scholar] [CrossRef]
  5. Bhattacharjee, S.; Kumar, P.; Thakur, P.K.; Gupta, K. Hydrodynamic Modelling and Vulnerability Analysis to Assess Flood Risk in A Dense Indian City Using Geospatial Techniques. Nat. Hazards 2021, 105, 2117–2145. [Google Scholar] [CrossRef]
  6. Awasthi, S.; Jain, K.; Bhattacharjee, S.; Gupta, V.; Varade, D.; Singh, H.; Narayan, A.B.; Buddilon, A. Analyzing Urbanization Induced Groundwater Stress and Land Deformation Using Time-Series Sentinel-1 Datasets Applying Psinsar Approach. Sci. Total Environ. 2022, 844, 157103. [Google Scholar] [CrossRef]
  7. Simkin, R.D.; Seto, K.C.; Mcdonald, R.I.; Jetz, W. Biodiversity Impacts and Conservation Implications of Urban Land Expansion Projected to 2050. Proc. Natl. Acad. Sci. USA 2022, 119, e2117297119. [Google Scholar] [CrossRef] [PubMed]
  8. Huang, K.; Li, X.; Liu, X.; Seto, K.C. Projecting Global Urban Land Expansion and Heat Island Intensification Through 2050. Environ. Res. Lett. 2019, 14, 114037. [Google Scholar] [CrossRef] [Green Version]
  9. Barredo, J.I.; Demicheli, L. Urban Sustainability in Developing Countries’ Megacities: Modelling and Predicting Future Urban Growth in Lagos. Cities 2003, 20, 297–310. [Google Scholar] [CrossRef]
  10. Awasthi, S.; Jain, K.; Mishra, V.; Kumar, A. An Approach for Multi-Dimensional Land Subsidence Velocity Estimation Using Time-Series Sentinel-1 Sar Datasets by Applying Persistent Scatterer Interferometry Technique. Geocarto Int. 2020, 37, 2647–2678. [Google Scholar] [CrossRef]
  11. Goldbeck, N.; Angeloudis, P. Unlocking the Potential of Future Cities Through Sustainable and Resilient Infrastructure. In Defining the Urban: Interdisciplinary and Professional Perspectives; Routledge: London, UK, 2018; pp. 128–140. [Google Scholar]
  12. Orhan, O. Monitoring of Land Subsidence Due to Excessive Groundwater Extraction Using Small Baseline Subset Technique in Konya, Turkey. Environ. Monit. Assess. 2021, 193, 174. [Google Scholar] [CrossRef]
  13. Carlson, G.; Shirzaei, M.; Werth, S.; Zhai, G.; Ojha, C. Seasonal and Long-Term Groundwater Unloading in the Central Valley Modifies Crustal Stress. J. Geophys. Res. Solid Earth 2020, 125, e2019jb018490. [Google Scholar] [CrossRef] [Green Version]
  14. Awasthi, S.; Varade, D.; Thakur, P.K.; Kumar, A.; Singh, H.; Jain, K. Development of A Novel Approach for Snow Wetness Estimation Using Hybrid Polarimetric Risat-1 Sar Datasets in North-Western Himalayan Region. J. Hydrol. 2022, 612, 128252. [Google Scholar] [CrossRef]
  15. Novellino, A.; Cigna, F.; Brahmi, M.; Sowter, A.; Bateson, L.; Marsh, S. Assessing the Feasibility of a National Insar Ground Deformation Map of Great Britain with Sentinel-1. Geosciences 2017, 7, 19. [Google Scholar] [CrossRef] [Green Version]
  16. Arangio, S.; Calò, F.; Di Mauro, M.; Bonano, M.; Marsella, M.; Manunta, M. An Application of the Sbas-Dinsar Technique for the Assessment of Structural Damage in the City of Rome. Struct. Infrastruct. Eng. 2014, 10, 1469–1483. [Google Scholar] [CrossRef]
  17. Zhao, C.Y.; Zhang, Q.; Yang, C.; Zou, W. Integration of Modis Data and Short Baseline Subset (Sbas) Technique for Land Subsidence Monitoring in Datong, China. J. Geodyn. 2011, 52, 16–23. [Google Scholar] [CrossRef]
  18. Crosetto, M.; Monserrat, O.; Cuevas-González, M.; Devanthéry, N.; Crippa, B. Persistent Scatterer Interferometry: A Review. Isprs J. Photogramm. Remote Sens. 2016, 115, 78–89. [Google Scholar] [CrossRef] [Green Version]
  19. Awasthi, S.; Jain, K.; Pandey, A. Psinsar Based Land Deformation Based Disaster Monitoring Using Sentinel-1 Datasets. In Proceedings of the Igarss 2019–2019 IEEE International Geoscience and Remote Sensing Symposium, Yokohama, Japan, 28 July–2 August 2019; pp. 1713–1716. [Google Scholar]
  20. Nazir Zaz, S.; Ahmad Romshoo, S.; Thokuluwa Krishnamoorthy, R.; Viswanadhapalli, Y. Analyses of Temperature and Precipitation in the Indian Jammu and Kashmir Region for the 1980-2016 Period: Implications for Remote Influence and Extreme Events. Atmos. Chem. Phys. 2019, 19, 15–37. [Google Scholar] [CrossRef] [Green Version]
  21. Singh, H.; Varade, D.; Mishra, P.K. Cloudburst Events in the Indian Himalayas: A Historical Geospatial PerspectiveInternational Handbook of Disaster ResearchSpringer: Singapore, 2022.
  22. Kumar, A.; Asthana, A.K.L.; Priyanka, R.S.; Jayangondaperumal, R.; Gupta, A.K.; Bhakuni, S.S. Assessment of Landslide Hazards Induced by Extreme Rainfall Event in Jammu and Kashmir Himalaya, Northwest India. Geomorphology 2017, 284, 72–87. [Google Scholar] [CrossRef] [Green Version]
  23. Phartiyal, G.S.; Kumar, K.; Singh, D. An Improved Land Cover Classification Using Polarization Signatures for Palsar 2 Data. Adv. Space Res. 2020, 65, 2622–2635. [Google Scholar] [CrossRef]
  24. Chaudhary, S.K.; Srivastava, P.K.; Gupta, D.K.; Kumar, P.; Prasad, R.; Pandey, D.K.; Das, A.K.; Gupta, M. Machine Learning Algorithms for Soil Moisture Estimation Using Sentinel-1: Model Development and Implementation. Adv. Space Res. 2022, 69, 1799–1812. [Google Scholar] [CrossRef]
  25. Awasthi, S.; Mishra, V.; Jain, K. Ground Water Monitoring Utilizing Time Series Sar Interferometric Psinsar Technique Combining Ascending and Descending Pass Datasets. In Proceedings of the Agu Fall Meeting Abstracts, Washington, DC, USA, 10–14 December 2018; Volume 2018, p. Nh21c-0841. [Google Scholar]
  26. Hooper, A. A Multi-Temporal Insar Method Incorporating Both Persistent Scatterer and Small Baseline Approaches. Geophys. Res. Lett. 2008, 35, L16302. [Google Scholar] [CrossRef] [Green Version]
  27. Solari, L.; Del Soldato, M.; Bianchini, S.; Ciampalini, A.; Ezquerro, P.; Montalti, R.; Raspini, F.; Moretti, S. From Ers 1/2 to Sentinel-1: Subsidence Monitoring in Italy in the Last Two Decades. Front. Earth Sci. 2018, 6, 149. [Google Scholar] [CrossRef]
  28. Tomás, R.; Romero, R.; Mulas, J.; Marturià, J.J.; Mallorquí, J.J.; Lopez-Sanchez, J.M.; Herrera, G.; Gutiérrez, F.; González, P.J.; Fernández, J.; et al. Radar Interferometry Techniques for the Study of Ground Subsidence Phenomena: A Review of Practical Issues Through Cases in Spain. Environ. Earth Sci. 2014, 71, 163–181. [Google Scholar] [CrossRef] [Green Version]
  29. Awasthi, S.; Varade, D. Recent Advances in the Remote Sensing of Alpine Snow: A Review. Gisci. Remote Sens. 2021, 58, 852–888. [Google Scholar] [CrossRef]
  30. Bamler, R.; Hartl, P. Synthetic Aperture Radar Interferometry. Inverse Probl. 1998, 14, R1–R54. [Google Scholar] [CrossRef]
  31. Awasthi, S.; Kumar, S.; Thakur, P.K.; Jain, K.; Kumar, A. Snehmani Snow Depth Retrieval in North-Western Himalayan Region Using Pursuit-Monostatic Tandem-X Datasets Applying Polarimetric Synthetic Aperture Radar Interferometry Based Inversion Modelling. Int. J. Remote Sens. 2021, 42, 2872–2897. [Google Scholar] [CrossRef]
  32. Rocca, F.; Tebaldini, S.; Ho Tong Minh, D. Airborne and Satellite Sar Tomography: A Tool to Investigate Forests and Glaciers Structures. Ann. Gis 2016, 22, 103–112. [Google Scholar] [CrossRef]
  33. Lee, J.-S.; Pottier, E. Polarimetric Radar Imaging: From Basics to Applications; CRC Press: Boca Raton, FL, USA, 2009; ISBN 9781420054972. [Google Scholar]
  34. Awasthi, S.; Kumar, S.; Thakur, P.K.; Mani, S. Pol-Insar Based Snow Depth Retrieval Using Spaceborne Terrasar-X Data. In Proceedings of the 2017 8th International Conference on Computing, Communication and Networking Technologies (ICCCNT), Delhi, India, 3–5 July 2017; pp. 1–7. [Google Scholar]
  35. Krishnakumar, V.; Monserrat, O.; Crosetto, M.; Crippa, B. Atmosphere Phase Delay in Sentinel Sar Interferometry. In Proceedings of the ISPRS Tc Iii Mid-Term Symposium, Beijing, China, 7–10 May 2018; pp. 741–744. [Google Scholar]
  36. Zebker, H.A.; Rosen, P.A.; Hensley, S. Atmospheric Effects in Interferometric Synthetic Aperture Radar Surface Deformation and Topographic Maps. J. Geophys. Res. Solid Earth 1997, 102, 7547–7563. [Google Scholar] [CrossRef]
  37. Hanssen, R.F. Radar Interferometry: Data Interpretation and Error Analysis; Springer Science & Business Media: Dordrecht, The Netherlands, 2001; ISBN 0792369459. [Google Scholar]
  38. Shanker, P.; Casu, F.; Zebker, H.A.; Lanari, R. Comparison of Persistent Scatterers and Small Baseline Time-Series Insar Results: A Case Study of the San Francisco Bay Area. IEEE Geosci. Remote Sens. Lett. 2011, 8, 592–596. [Google Scholar] [CrossRef]
  39. Awasthi, S.; Thakur, P.K.; Kumar, S.; Kumar, A.; Jain, K.; Mani, S. Snow Density Retrieval Using Hybrid Polarimetric Risat-1 Datasets. IEEE J. Sel. Top. Appl. Earth Obs. Remote Sens. 2020, 13, 3058–3065. [Google Scholar] [CrossRef]
  40. Hooper, A.; Segall, P.; Zebker, H. Persistent Scatterer Interferometric Synthetic Aperture Radar for Crustal Deformation Analysis, with Application to Volcán Alcedo, Galápagos. J. Geophys. Res. Solid Earth 2007, 112, 1–21. [Google Scholar] [CrossRef] [Green Version]
  41. Tiwari, A.; Narayan, A.B.; Dwivedi, R.; Dikshit, O.; Nagarajan, B. Monitoring of Landslide Activity at the Sirobagarh Landslide, Uttarakhand, India, Using Lidar, Sar Interferometry and Geodetic Surveys. Geocarto Int. 2020, 35, 535–558. [Google Scholar] [CrossRef]
  42. Ciampalini, A.; Raspini, F.; Lagomarsino, D.; Catani, F.; Casagli, N. Landslide Susceptibility Map Refinement Using Psinsar Data. Remote Sens. Environ. 2016, 184, 302–315. [Google Scholar] [CrossRef]
  43. Dumka, R.K.; Suribabu, D.; Malik, K.; Prajapati, S.; Narain, P. Ps-Insar Derived Deformation Study in the Kachchh, Western India. Appl. Comput. Geosci. 2020, 8, 100041. [Google Scholar] [CrossRef]
  44. Ferretti, A.; Prati, C.; Rocca, F. Permanent Scatterers in Sar Interferometry. IEEE Trans. Geosci. Remote Sens. 2001, 39, 8–20. [Google Scholar] [CrossRef]
  45. Hooper, A.; Segall, P.; Zebker, H. Persistent Scatter Radar Interferometry for Crustal Deformation Studies and Modeling of Volcanic Deformation. Ph.D. Thesis, Stanford University, Stanford, CA, USA, 2006. [Google Scholar]
  46. Tamburini, A.; Bianchi, M.; Giannico, C.; Novali, F. Retrieving Surface Deformation by PsinsarTM Technology: A Powerful Tool in Reservoir Monitoring. Int. J. Greenh. Gas Control 2010, 4, 928–937. [Google Scholar] [CrossRef]
  47. Liu, Y.; Zhao, C.; Zhang, Q.; Yang, C.; Zhang, J. Land Subsidence in Taiyuan, China, Monitored by Insar Technique with Multisensor Sar Datasets from 1992 to 2015. IEEE J. Sel. Top. Appl. Earth Obs. Remote Sens. 2018, 11, 1509–1519. [Google Scholar] [CrossRef]
  48. Zhou, C.; Gong, H.; Zhang, Y.; Warner, T.A.; Wang, C. Spatiotemporal Evolution of Land Subsidence in the Beijing Plain 2003–2015 Using Persistent Scatterer Interferometry (Psi) with Multi-Source Sar Data. Remote Sens. 2018, 10, 552. [Google Scholar] [CrossRef] [Green Version]
  49. Razi, P.; Sumantyo, J.T.S.; Nishi, K.; Widodo, J.; Munir, A.; Febriany, F. Effect of Earthquake Intensity to Land Deformation Observed from Space. In Proceedings of the 2019 PhotonIcs & Electromagnetics Research Symposium-Spring (PIERS-Spring), Rome, Italy, 17–20 June 2019; pp. 2123–2128. [Google Scholar] [CrossRef]
  50. Liu, X.; Zhao, C.; Zhang, Q.; Yang, C.; Zhang, J. Characterizing and Monitoring Ground Settlement of Marine Reclamation Land of Xiamen New Airport, China with Sentinel-1 Sar Datasets. Remote Sens. 2019, 11, 585. [Google Scholar] [CrossRef]
  51. Babaee, S.; Mousavi, Z.; Masoumi, Z.; Malekshah, A.H.; Roostaei, M.; Aflaki, M. Land Subsidence from Interferometric Sar and Groundwater Patterns in the Qazvin Plain, Iran. Int. J. Remote Sens. 2020, 41, 4778–4796. [Google Scholar] [CrossRef]
  52. Agriculture Production and Farmers Welfare Department, J&K, U. Overview of Jammu and Kashmir State. Available online: http://www.jkapd.nic.in/pdf/agendaa.pdf (accessed on 21 October 2022).
  53. Soudani, K.; Delpierre, N.; Berveiller, D.; Hmimina, G.; Vincent, G.; Morfin, A.; Dufrêne, É. Potential of C-Band Synthetic Aperture Radar Sentinel-1 Time-Series for the Monitoring of Phenological Cycles in A Deciduous Forest. Int. J. Appl. Earth Obs. Geoinf. 2021, 104, 102505. [Google Scholar] [CrossRef]
  54. De Zan, F.; Monti Guarnieri, A. Topsar: Terrain Observation by Progressive Scans. IEEE Trans. Geosci. Remote Sens. 2006, 44, 2352–2360. [Google Scholar] [CrossRef]
  55. Frantz, D.; Schug, F.; Okujeni, A.; Navacchi, C.; Wagner, W.; Van Der Linden, S.; Hostert, P. National-Scale Mapping of Building Height Using Sentinel-1 and Sentinel-2 Time Series. Remote Sens. Environ. 2021, 252, 112128. [Google Scholar] [CrossRef] [PubMed]
  56. Anghel, A.; Cacoveanu, R.; Moldovan, A.S.; Savlovschi, C.; Rommen, B.; Datcu, M. Bistatic Sar Imaging with Sentinel-1 Operating in Topsar Mode. In Proceedings of the 2017 IEEE Radar Conference (RadarConf), Seattle, WA, USA, 8–12 May 2017; pp. 601–605. [Google Scholar] [CrossRef]
  57. Yague-Martinez, N.; Prats-Iraola, P.; Gonzalez, F.R.; Brcic, R.; Shau, R.; Geudtner, D.; Eineder, M.; Bamler, R. Interferometric Processing of Sentinel-1 Tops Data. IEEE Trans. Geosci. Remote Sens. 2016, 54, 2220–2234. [Google Scholar] [CrossRef] [Green Version]
  58. Tiwari, A.; Dwivedi, R.; Dikshit, O.; Singh, A.K. A Study on Measuring Surface Deformation of the L’aquila Region Using the Stamps Technique. Int. J. Remote Sens. 2016, 37, 819–830. [Google Scholar] [CrossRef]
  59. Yildiz, S.; Doker, M.F. Monitoring Urban Growth by Using Segmentation-Classification of Multispectral Landsat Images in Izmit, Turkey. Environ. Monit. Assess. 2016, 188, 393. [Google Scholar] [CrossRef]
  60. Lo, C.P.; Choi, J. A Hybrid Approach to Urban Land Use/Cover Mapping Using Landsat 7 Enhanced Thematic Mapper Plus (Etm+) Images. Int. J. Remote Sens. 2004, 25, 2687–2700. [Google Scholar] [CrossRef]
  61. Ojha, C.; Shirzaei, M.; Werth, S.; Argus, D.F.; Farr, T.G. Sustained Groundwater Loss in California’s Central Valley Exacerbated by Intense Drought Periods. Water Resour. Res. 2018, 54, 4449–4460. [Google Scholar] [CrossRef] [PubMed]
  62. Othman, A.; Abotalib, A.Z. Land Subsidence Triggered by Groundwater Withdrawal Under Hyper-Arid Conditions: Case Study from Central Saudi Arabia. Environ. Earth Sci. 2019, 78, 243. [Google Scholar] [CrossRef]
  63. Wang, Y.; Guo, Y.; Hu, S.; Li, Y.; Wang, J.; Liu, X.; Wang, L. Ground Deformation Analysis Using Insar and Backpropagation Prediction with Influencing Factors in Erhai Region, China. Sustainability 2019, 11, 2853. [Google Scholar] [CrossRef] [Green Version]
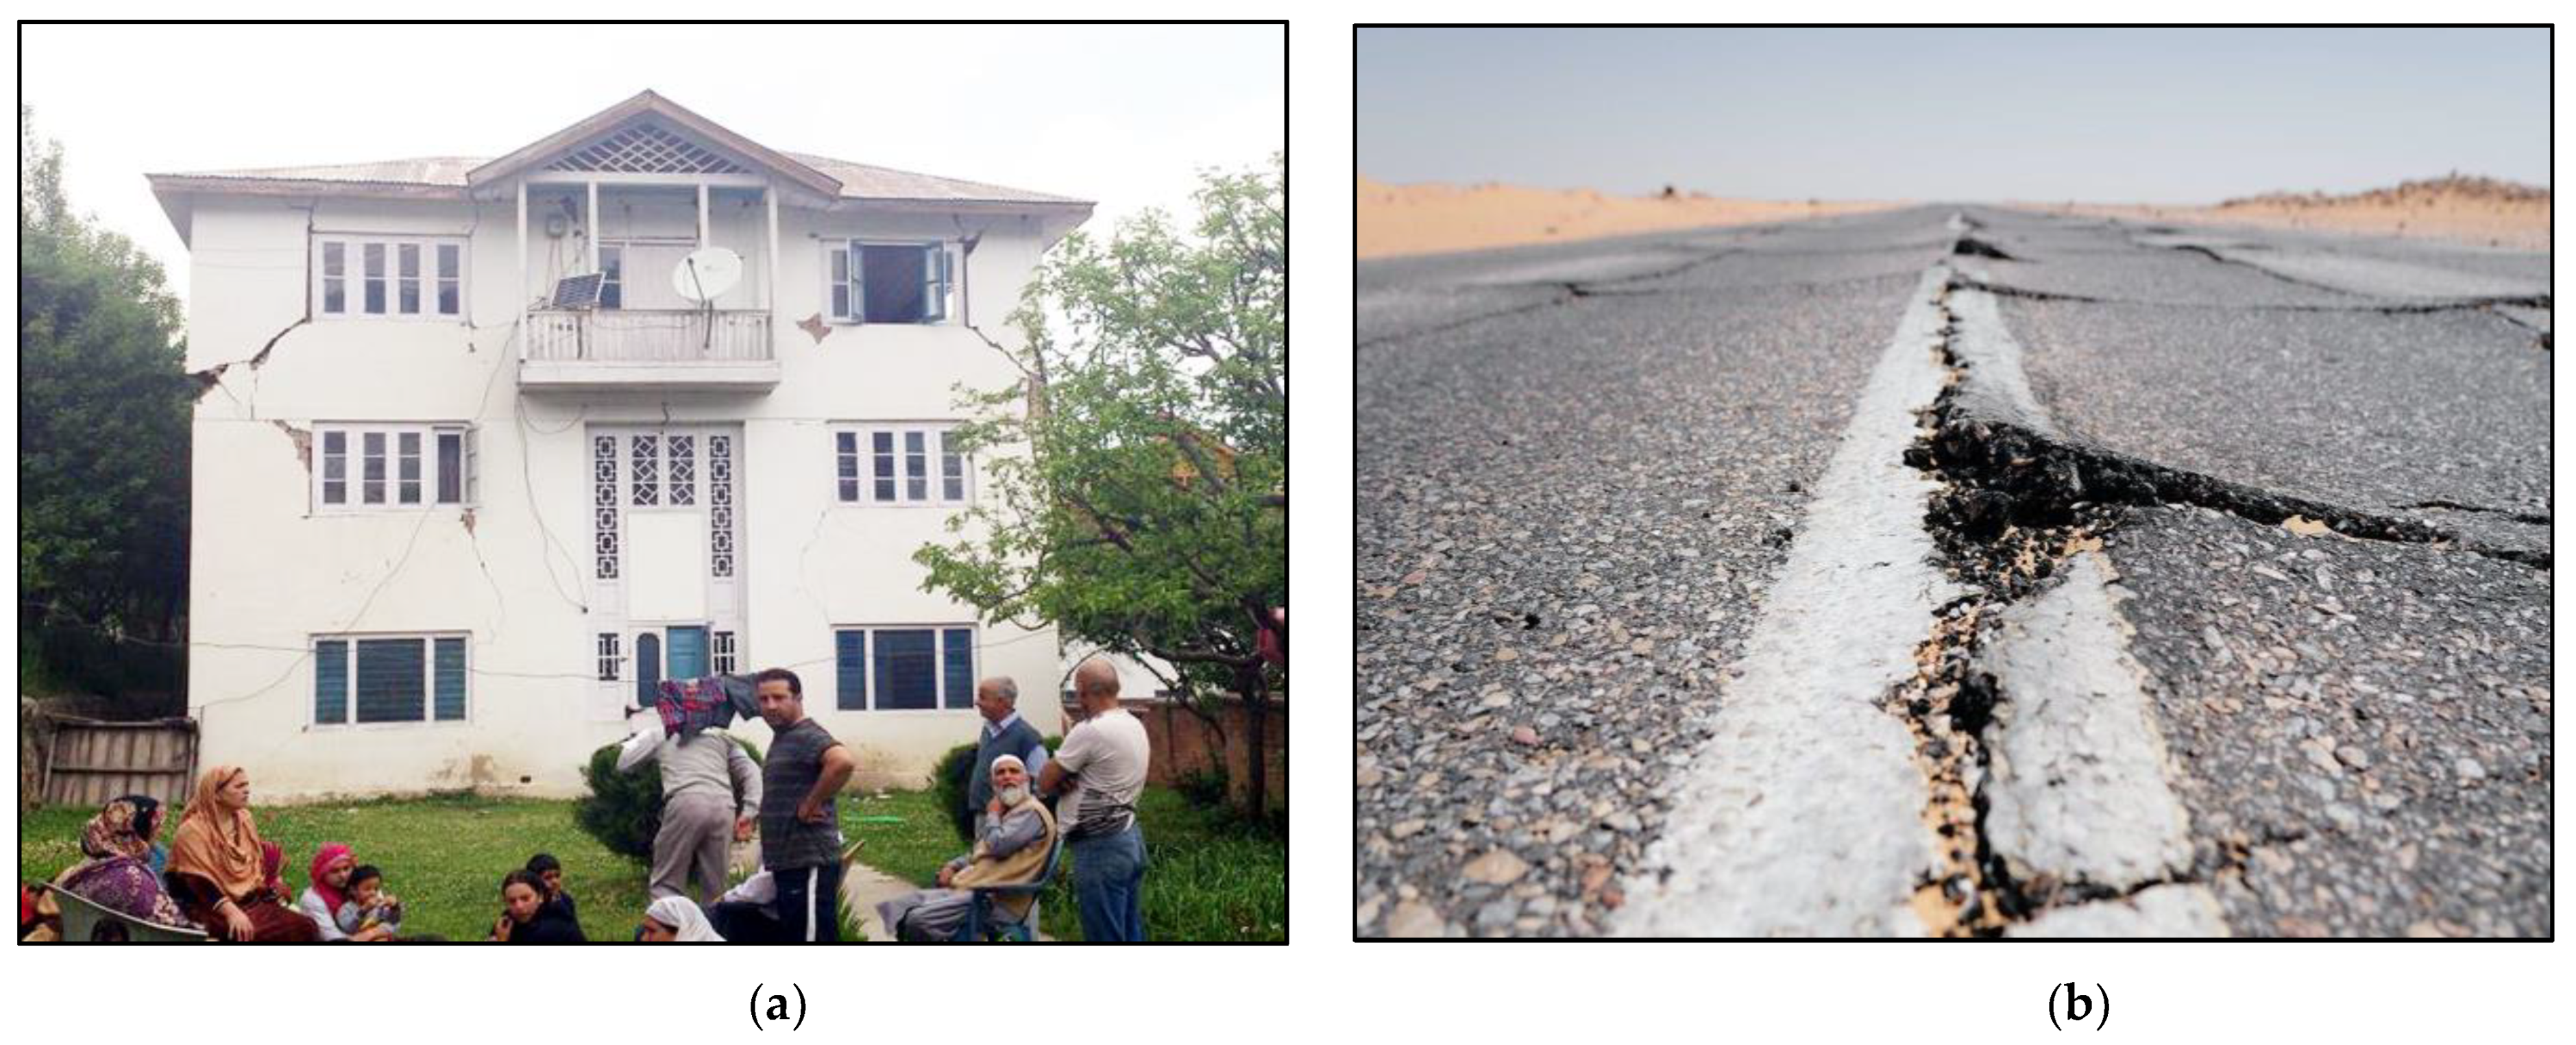
  64. Cracks Developed in Buildings Due to Earthquake at Bhaderwah-Jammu Kashmir Latest News|Tourism|Breaking News J&K. Available online: https://www.dailyexcelsior.com/cracks-developed-in-buildings-due-to-earthquake-at-bhaderwah/ (accessed on 22 October 2022).
  65. Earth Is Constantly Shaking in Jammu Kashmir & Ladakh Since Last Month. Available online: https://groundreport.in/earth-is-constantly-shaking-in-jammu-kashmir-ladakh-since-last-month/ (accessed on 22 October 2022).
  66. Earthquake in Jammu: Find Jammu Earthquake News, Videos of Jammu Earthquake-the Economic Times. Available online: https://economictimes.indiatimes.com/news/earthquake-in-jammu (accessed on 22 October 2022).
  67. Necula, N.; Niculiță, M.; Fiaschi, S.; Genevois, R.; Riccardi, P.; Floris, M. Assessing Urban Landslide Dynamics Through Multi-Temporal Insar Techniques and Slope Numerical Modeling. Remote Sens. 2021, 13, 3862. [Google Scholar] [CrossRef]
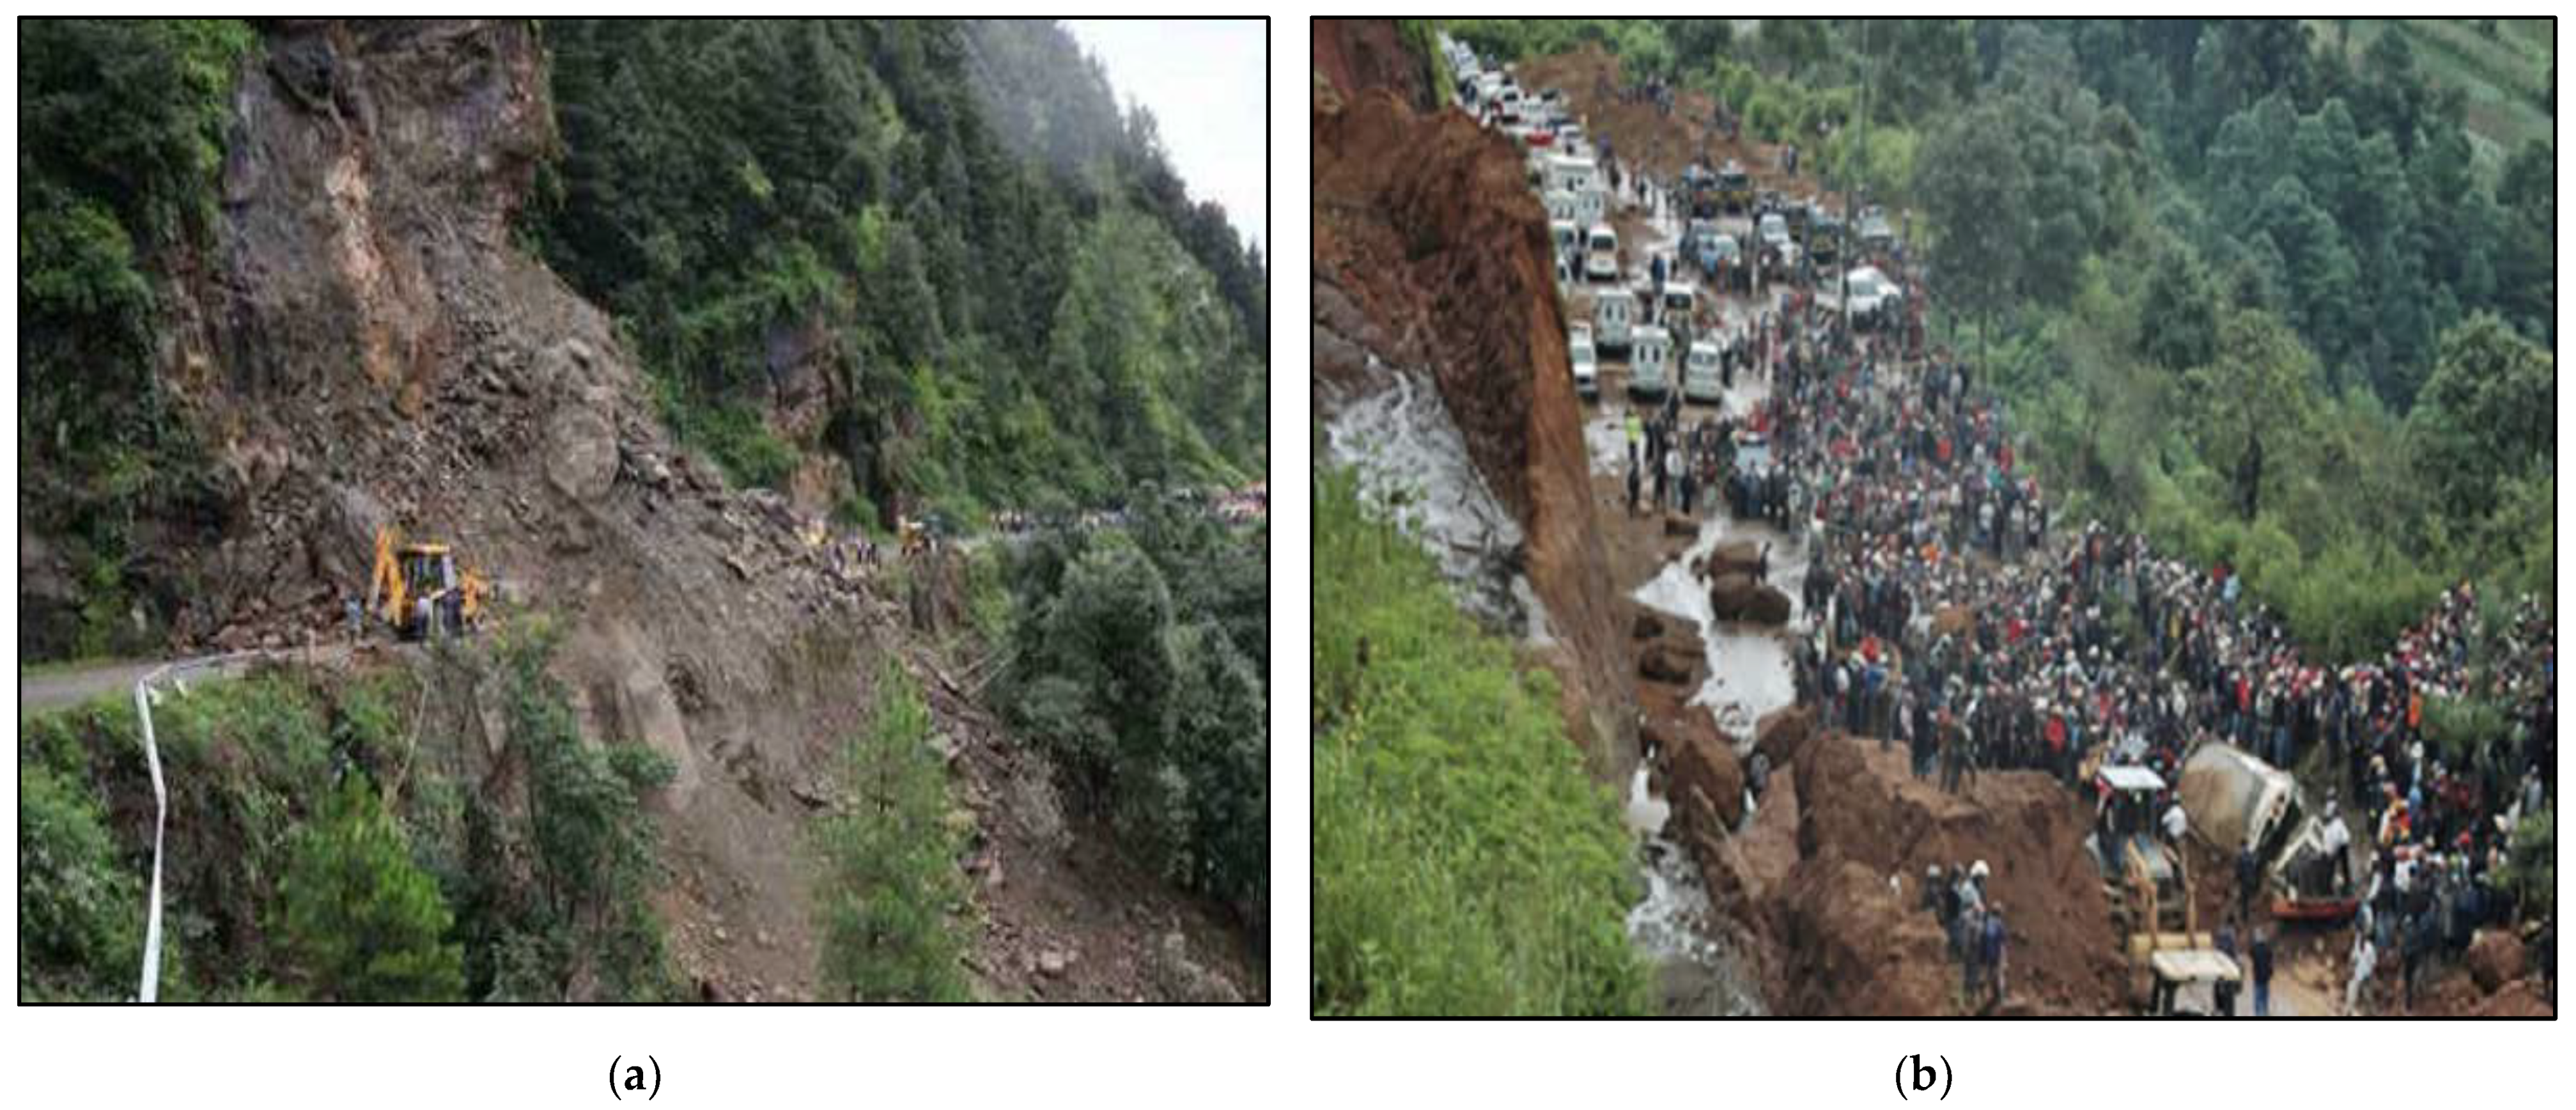
  68. Jammu-Srinagar National Highway Shut After Massive Mudslide: The Tribune India. Available online: https://www.tribuneindia.com/news/j-k/jammu-srinagar-national-highway-shut-after-massive-mudslide-341233 (accessed on 22 October 2022).
  69. Landslide Blocks Circular Road in Jammu, Clearance Operation Begins. Available online: https://www.mynation.com/news/landslide-blocks-road-jammu-clearance-operation-pfm49c (accessed on 22 October 2022).
  70. Landslide Blocks Circular Road in Jammu, Clearance Operation Begins. Available online: https://www.ndtv.com/jammu-news/landslide-blocks-circular-road-along-tawi-in-jammu-clearance-operation-begins-1921971 (accessed on 22 October 2022).
  71. Rains Bring Relief from Scorching Heat in Jammu and Kashmir. Available online: https://www.greaterkashmir.com/kashmir/rains-bring-relief-from-scorching-heat-in-jammu-and-kashmir (accessed on 2 November 2022).
  72. Opentopography-Copernicus Global Digital Elevation Models. Available online: https://portal.opentopography.org/datasetmetadata?otcollectionid=ot.032021.4326.1 (accessed on 7 May 2022).
  73. Cgwb 2020 Dynamic Ground Water Resources of India. 401. 2020. Available online: http://cgwb.gov.in/documents/2021-08-02-GWRA_India_2020.pdf (accessed on 22 October 2022).
Figure 1. Study area in Jammu district. A map of India and the north-west Himalayas is shown with the different states and UTs connected with Jammu and Kashmir, and a zoomed view of the study area covering Jammu city and some regions of Samba district. The Copernicus 30 m DEM is shown to illustrate the topography of the study area.
Land 11 02009 g001
Figure 2. Geography Bounds of the study area are illustrated with a Google base map layer.
Land 11 02009 g002
Figure 3. Statistical specifics of historical annual and monthly temperatures and precipitation. (a) Mean annual temperatures, (b) Mean annual rainfall, (c) Monthly temperatures from 2000–2019, (d) Monthly rainfall from 2000–2019. The abbreviation ‘CV’ refers to the coefficient of variation, and other abbreviations used are as per standards.
Land 11 02009 g003aLand 11 02009 g003b
Figure 4. Dataset and spatial baseline details.
Land 11 02009 g004
Figure 5. The overall workflow of the Sentinel-1 PSInSAR processing for the retrieval of LOS displacement velocity.
Land 11 02009 g005
Figure 6. LULC Classification of the study area depicting fundamental classes relevant to this study for the years 2015 and 2021 based on Landsat-8 multispectral data. (a) LULC for 2015, (b) LULC for 2021, (c) Area under each LULC class during the study period and percentage change in each class from 2015 to 2021, (d) Percentage of different LULC classes to the total Built-Up and Agricultural lands (the classes which underwent an expansion and are considered contributors to land deformation) transformation.
Land 11 02009 g006
Figure 7. The line-of-sight displacement observed from PSInSAR processing of Sentinel-1 datasets depicting dominant subsidence in the mountain areas with some upliftment in the sub-urban plain area of the Jammu region.
Land 11 02009 g007
Figure 8. (a) Building cracks appeared as a result of the earthquake in the areas around the Jammu region source: Ref. [64]. (b) Crack on road due to an earthquake in the region in February 2022 adapted from source: Ref. [65].
Land 11 02009 g008
Figure 9. (a) Massive landslide blocks Jammu’s circular road adapted from source: Refs. [69,70], (b) Landslide on Jammu Srinagar national Highway adapted from source: Ref. [68].
Land 11 02009 g009
Figure 10. (a) The slope of the study area in degrees determined from the Copernicus 30 m DEM, (b) Overlay of the retrieved LOS displacement on (a).
Land 11 02009 g010
Figure 11. (a) Slope Aspect of the study area in degrees determined from the Copernicus 30 m DEM, (b) Overlay of the retrieved LOS displacement on (a).
Land 11 02009 g011
Figure 12. The variation of displacement with respect to the mean values of the elevation, slope, and aspect in the study area.
Land 11 02009 g012
Figure 13. Mean monthly rainfall in mm for the months of summer and winter monsoon seasons.
Land 11 02009 g013aLand 11 02009 g013b
Table 1. List of past Earthquakes experienced in the study region.
S. No.Date of EarthquakeMagnitude on Richter ScaleEpicenter Location
11 May 20135.8Bhaderwah
225 November 20133.2Bhaderwah
38 July 20175.2J&K
424 August 20175.0J&K
512 September 20184.6Kargil
69 June 20203.9Srinagar
716 June 20205.8Tajikistan
826 September 20204.5J&K
95 February 20225.7Afghanistan-Tajikistan border
1010 February 20223.8Gilgit-Baltistan
1118 April 20223.4Kishtwar
1214 June 20224.7Afghanistan
1323 August 20223.9Katra
1423 August 20222.6Doda
1523 August 20222.8Udhampur
1623 August 20222.9Udhampur
1724 August 20223.9Katra
1824 August 20222.6Doda
1925 August 20224.1 & 3.2Katra
2027 August 20222.9Bhaderwah
2127 August 20223.4Doda
Publisher’s Note: MDPI stays neutral with regard to jurisdictional claims in published maps and institutional affiliations.

