Interlinkages among County-Level Construction Indicators and Related Sustainable Development Goals in China
Abstract
1. Introduction
2. Methodology
3. Data Analyses
3.1. Data Source and Descriptions of Indicators
3.2. Connectivity
4. Modularity
5. Discussion and Conclusions
5.1. Discussions about the Trends of AWD and Modularity along the Total Index
- The indicators in the CCSCSY and CSY (county level) highly concentrate on only a few SDG targets. All the indicators belong to the targets from SDG3 (Good Health and Well-Being), SDG6 (Clean Water and Sanitation), SDG7 (Affordable and Clean Energy), SDG8 (Decent Work and Economic Growth), SDG9 (Industry, Innovation and Infrastructure) and SDG11 (Sustainable Cities and Communities). In particular, SDG6, SDG7, SDG8 and SDG11 are more favored by the county-level governments in China. Financial and fiscal, water supply, gas supply, transportation, sewerage, sanitation and greening are the development programs, which the government is most concerned about. Medical service is only recorded as the Number of Beds in Health Care Institutions. Housing is only recorded as Social Welfare Housing, which provides the housing support to the elderly, the orphans and the physically challenged and meets their minimum living standards. For industries, CCSCSY and CSY also only report the Number of Industrial Enterprises above Designated Size. Compared to the comprehensive indicators in urban regions in the provincial statistical yearbook, the indicators in the CCSCSY and CSY (county level) tend to emphasize the basic living standards for residents.
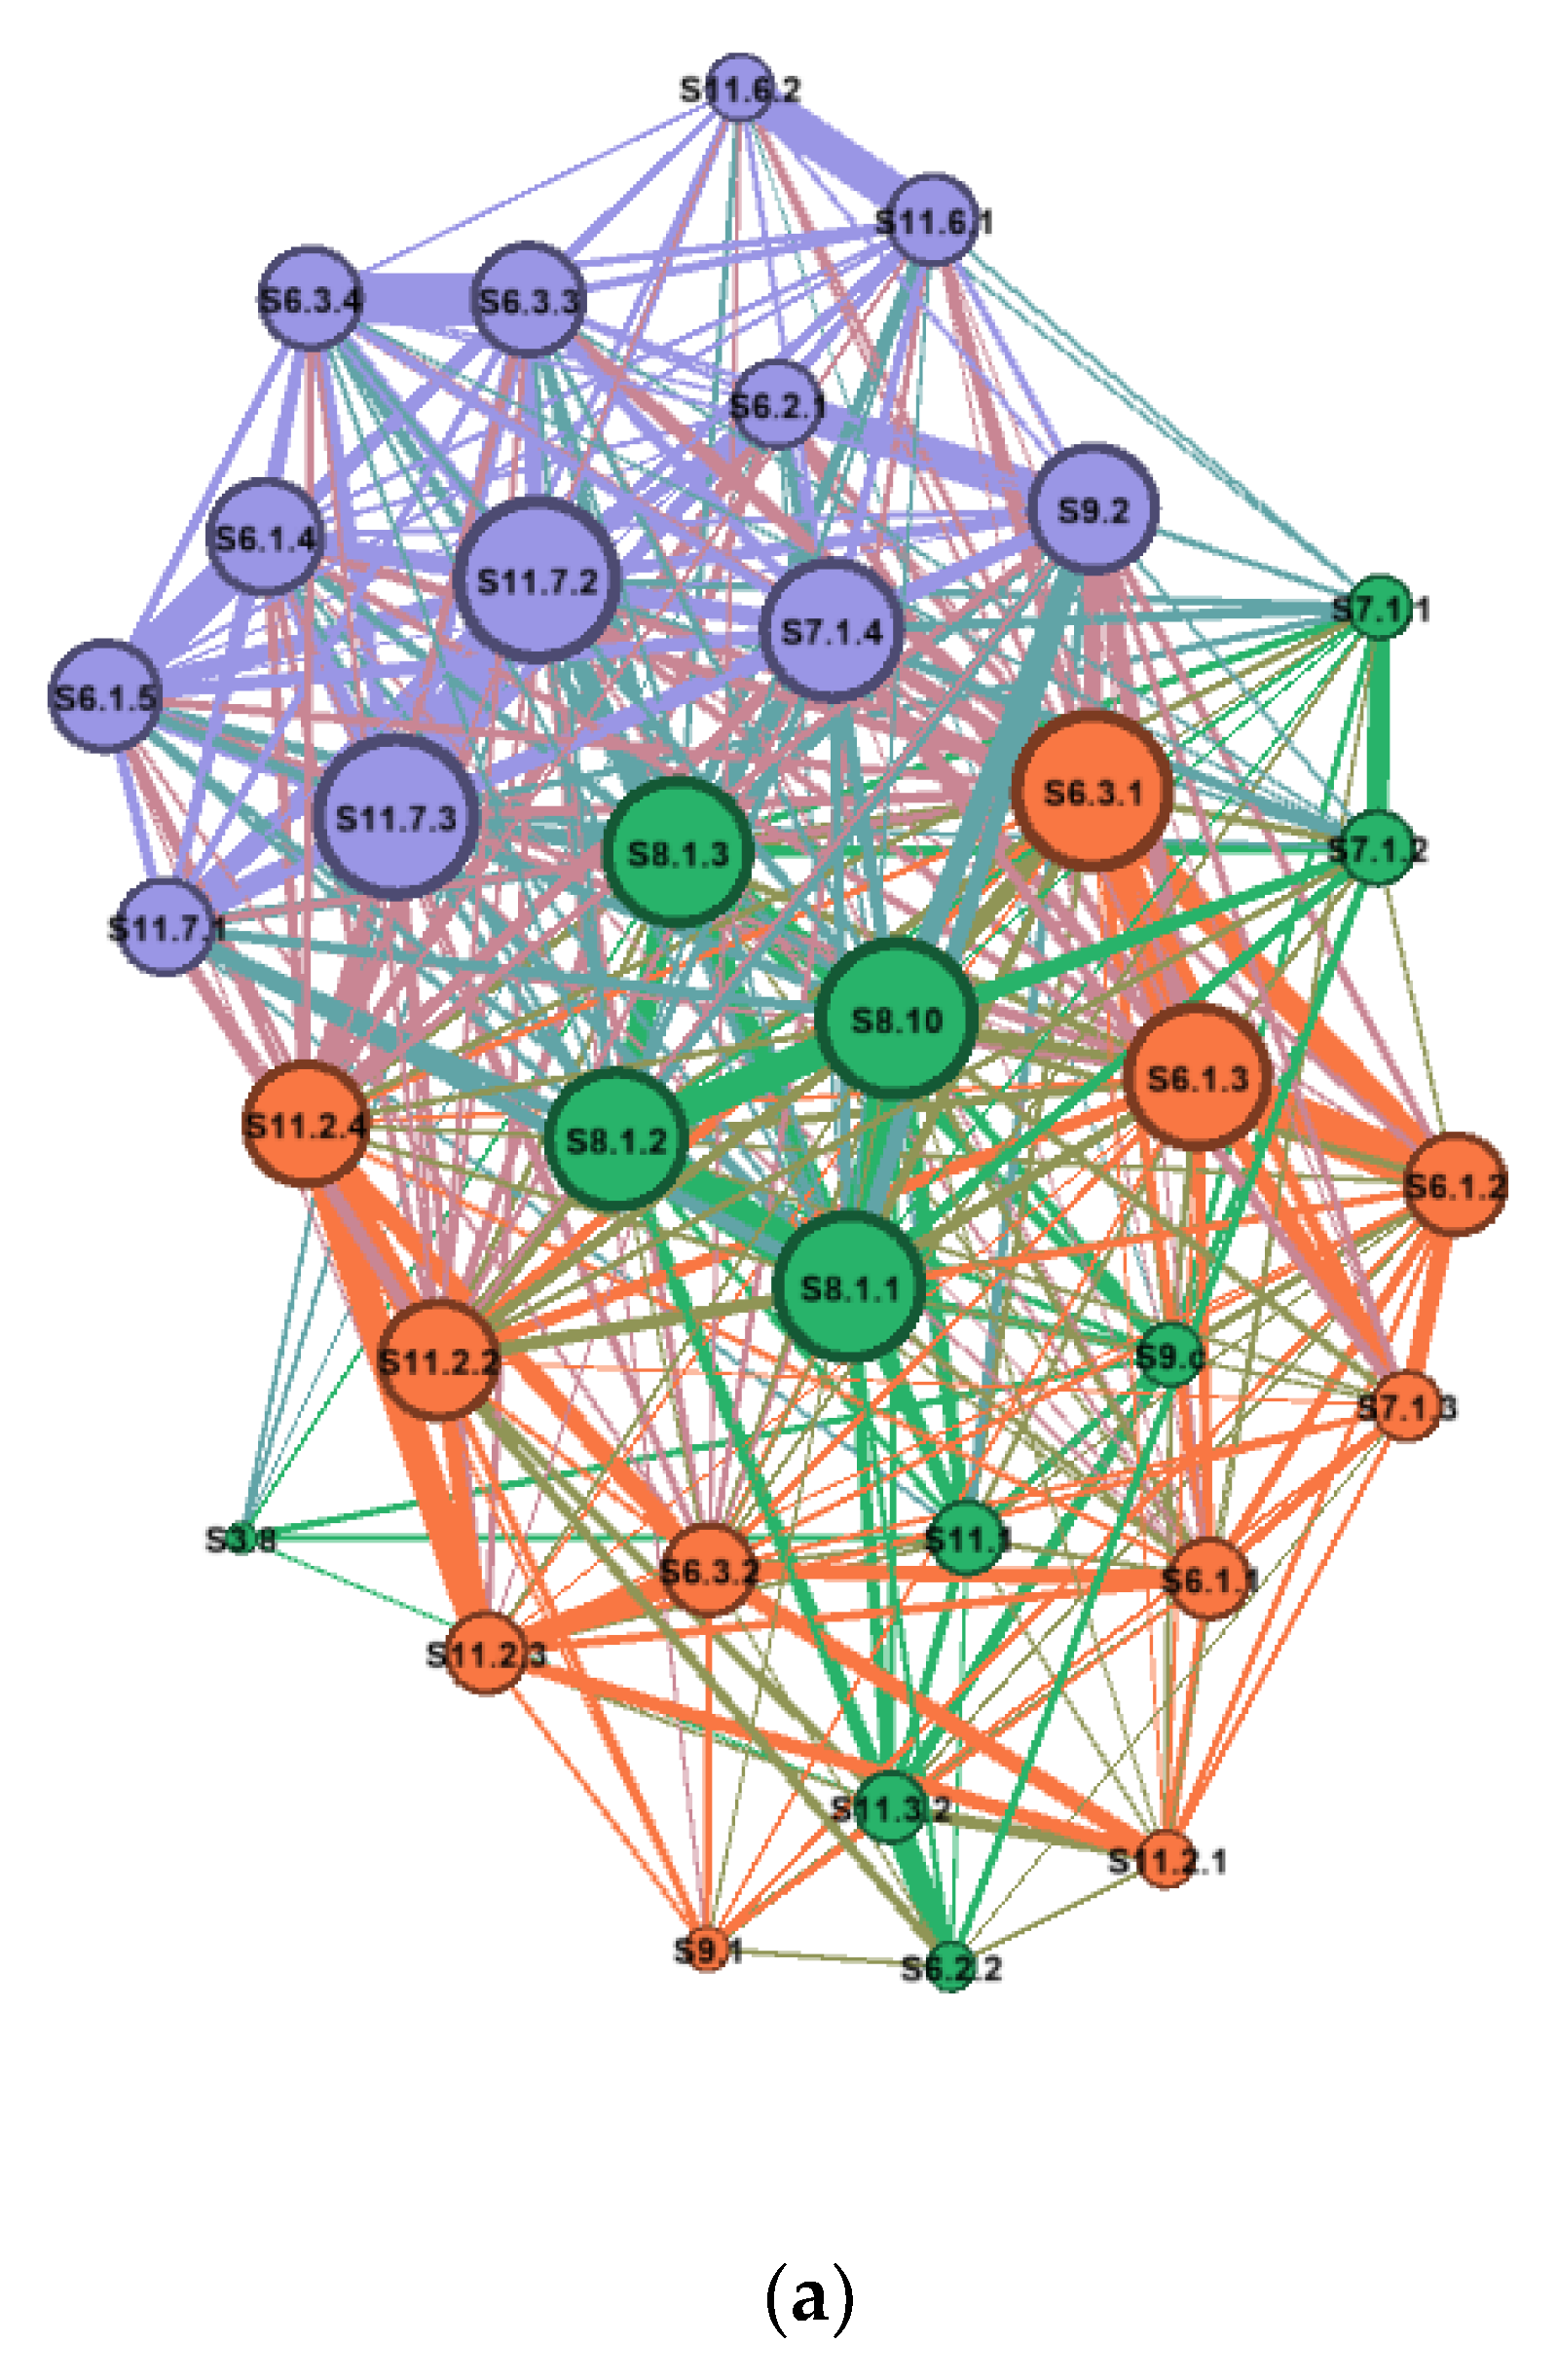
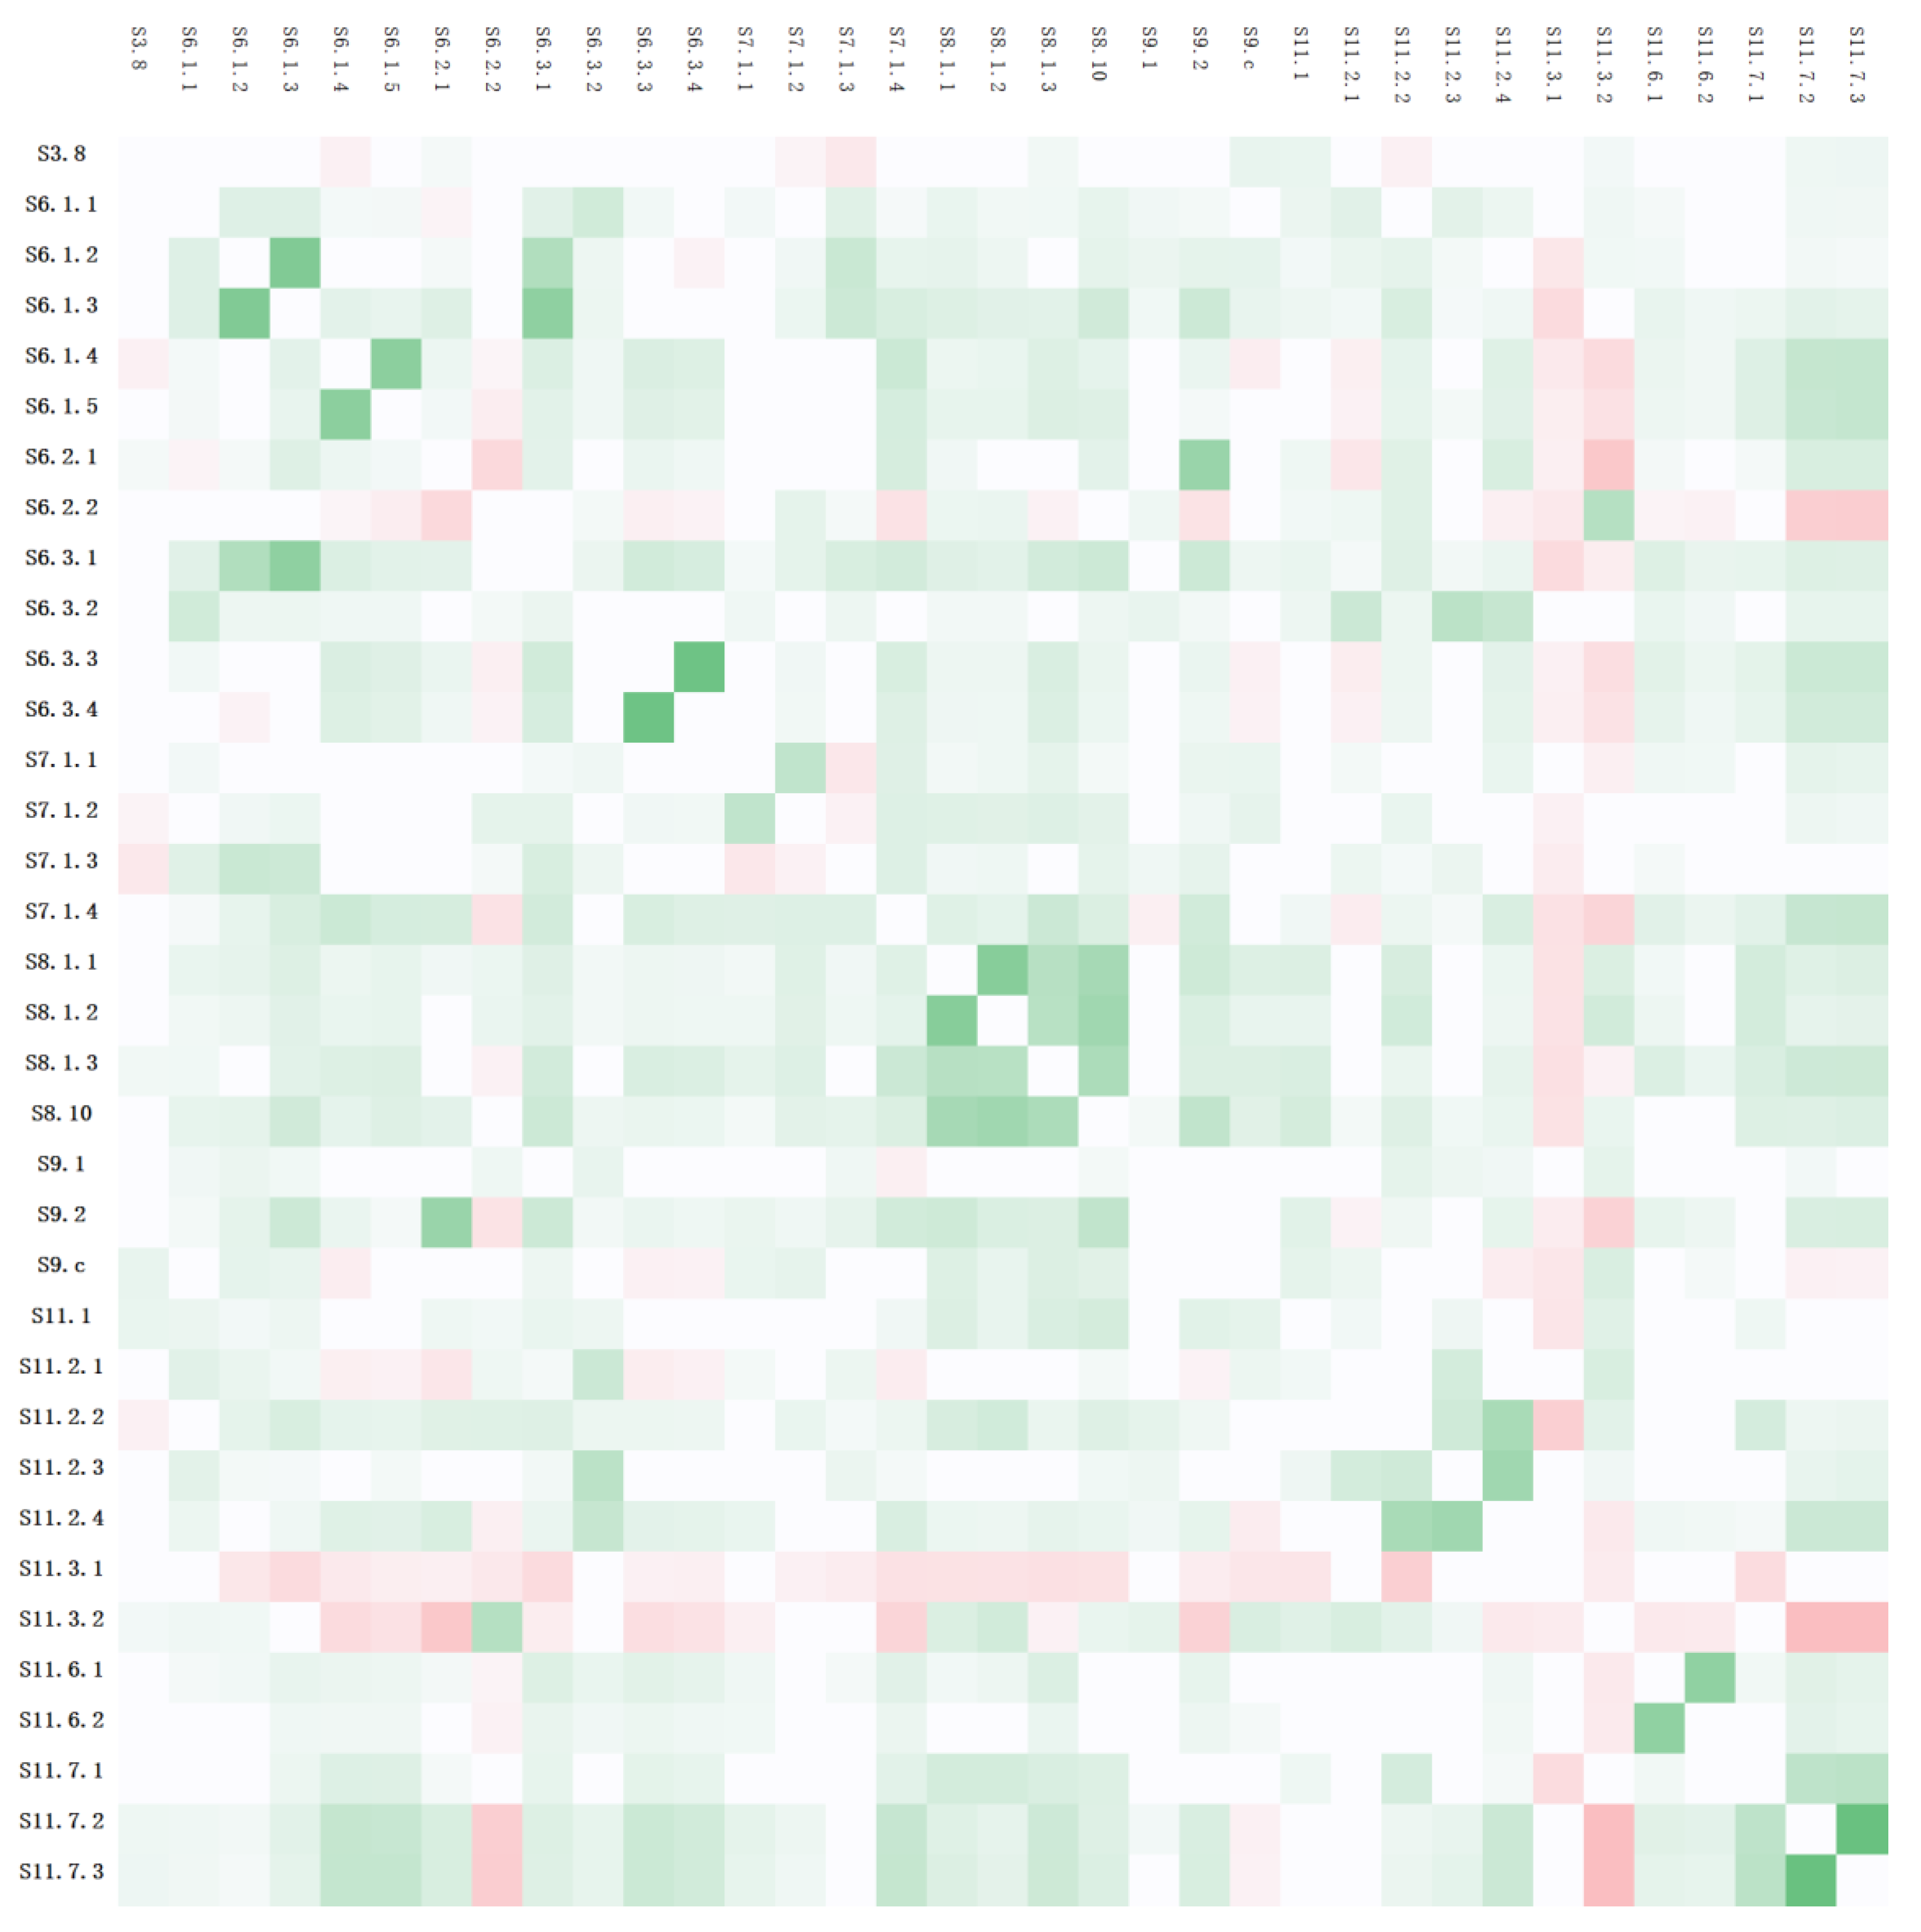
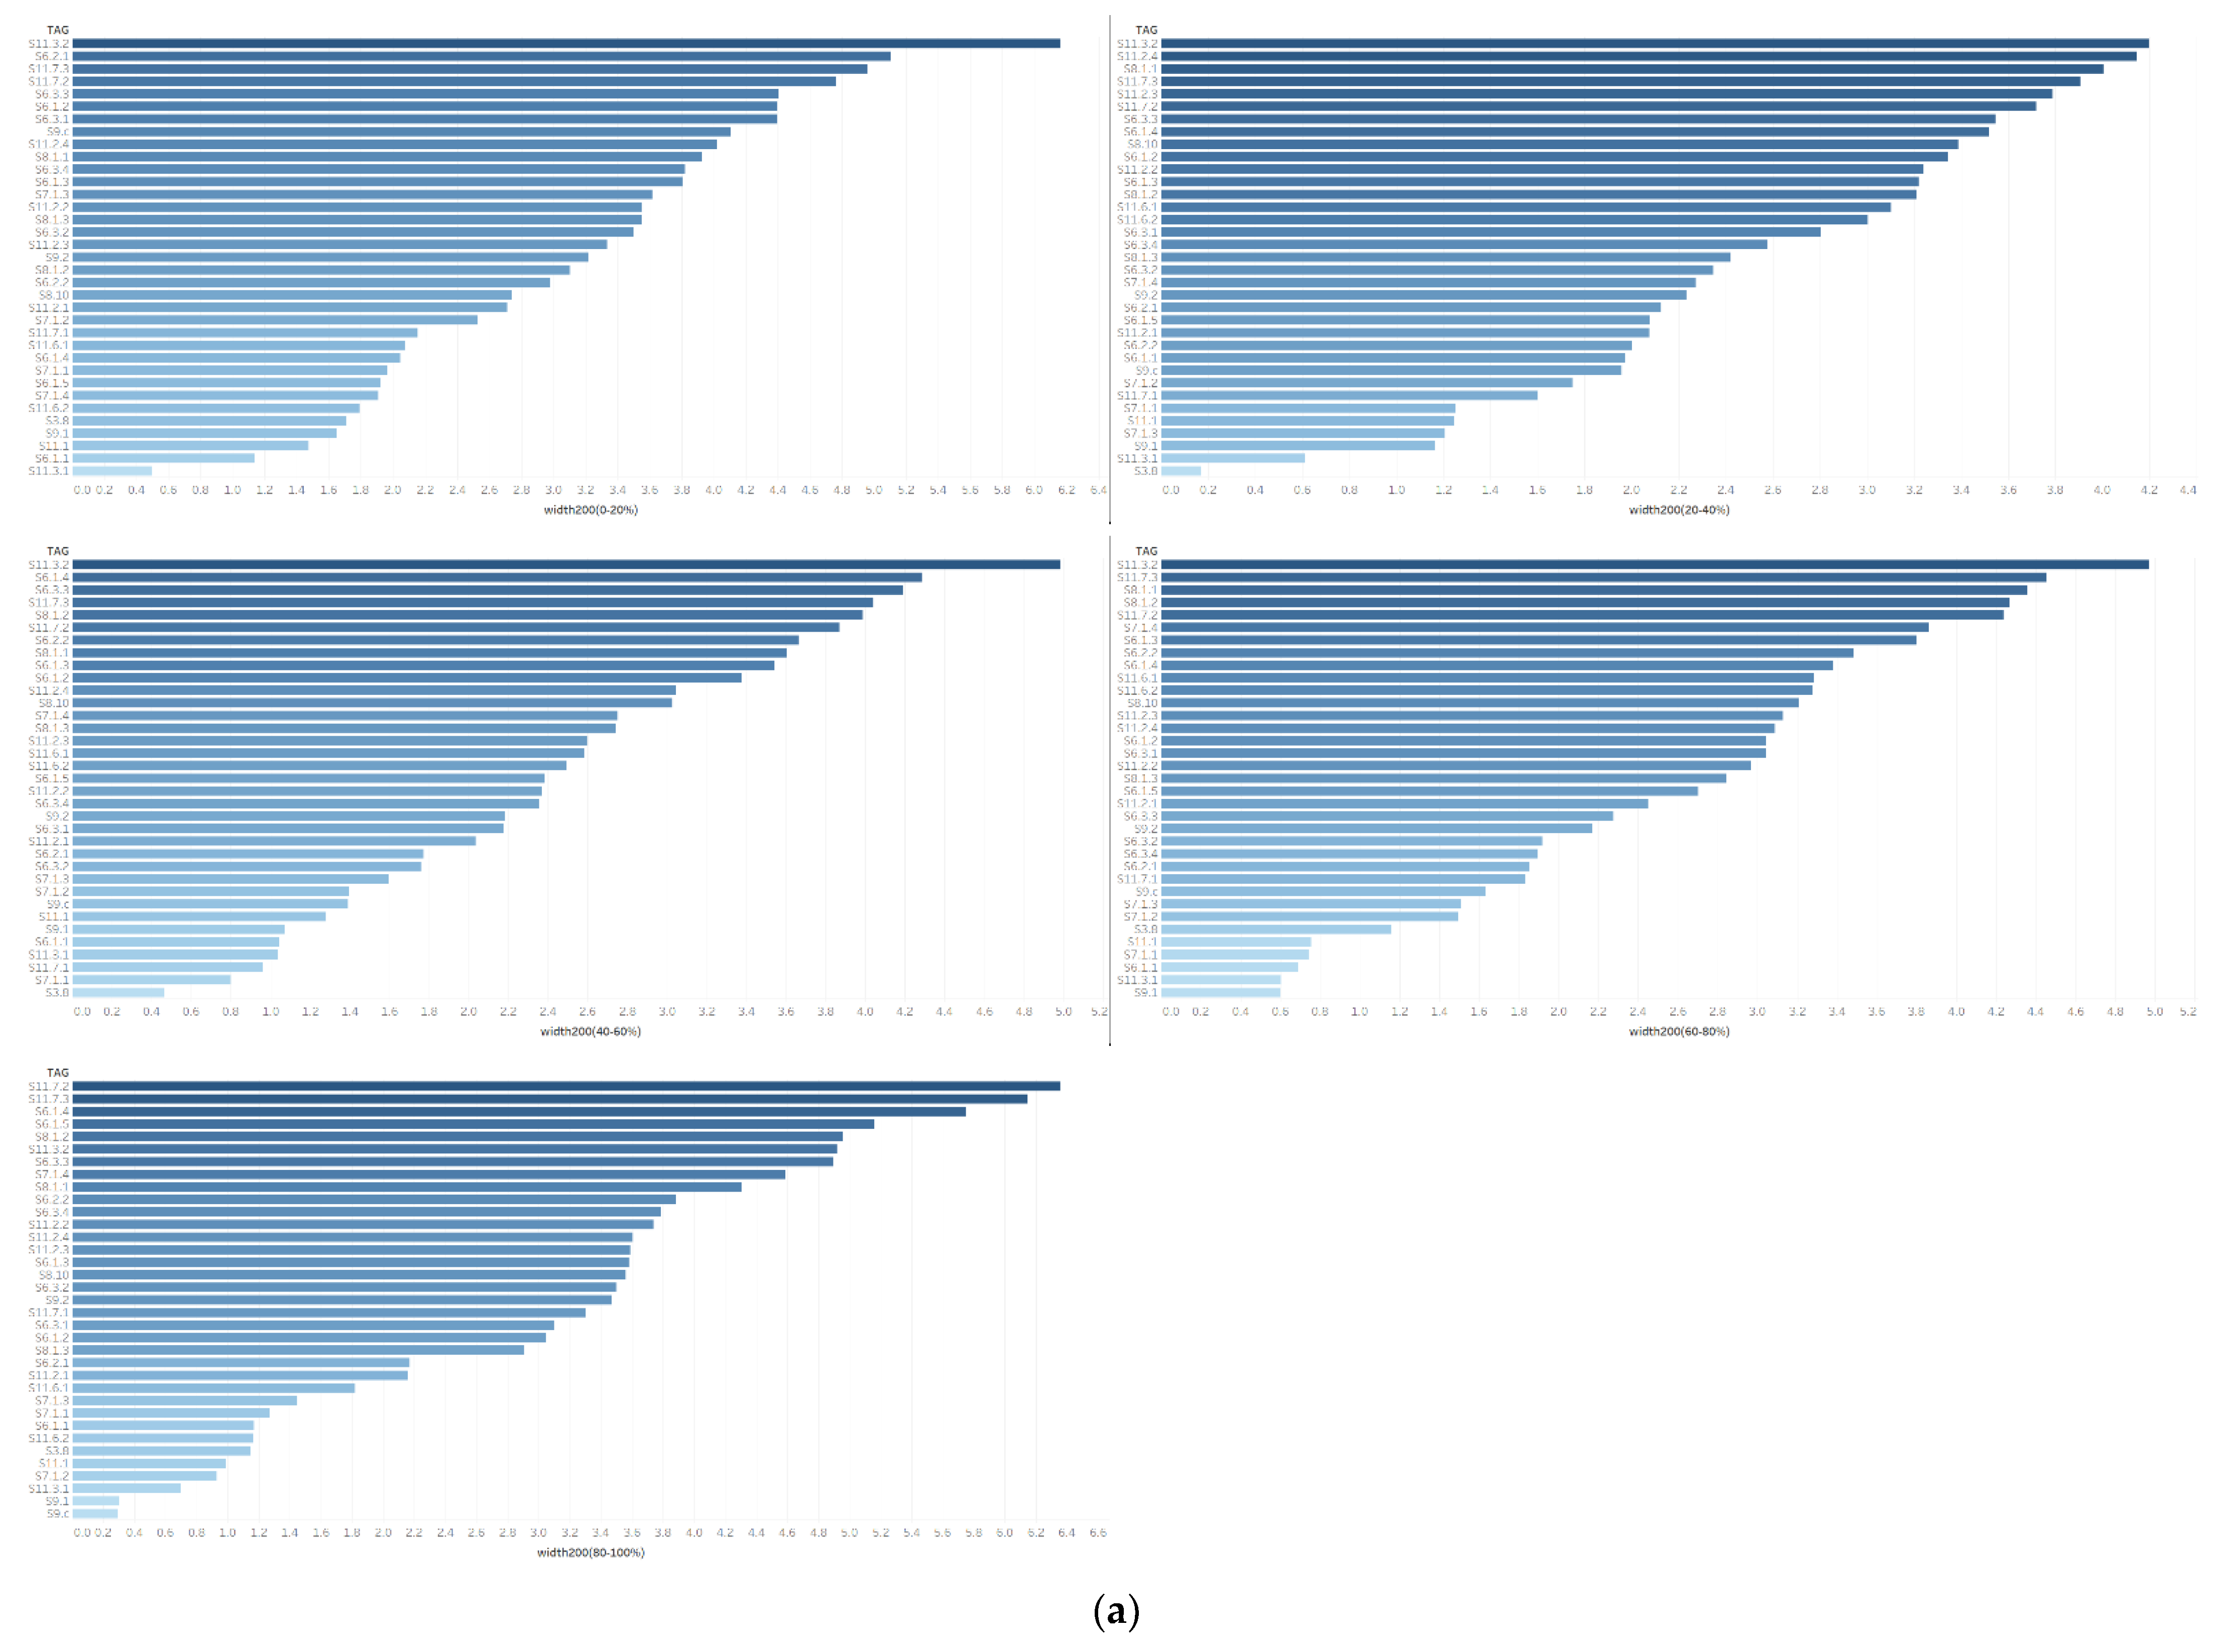
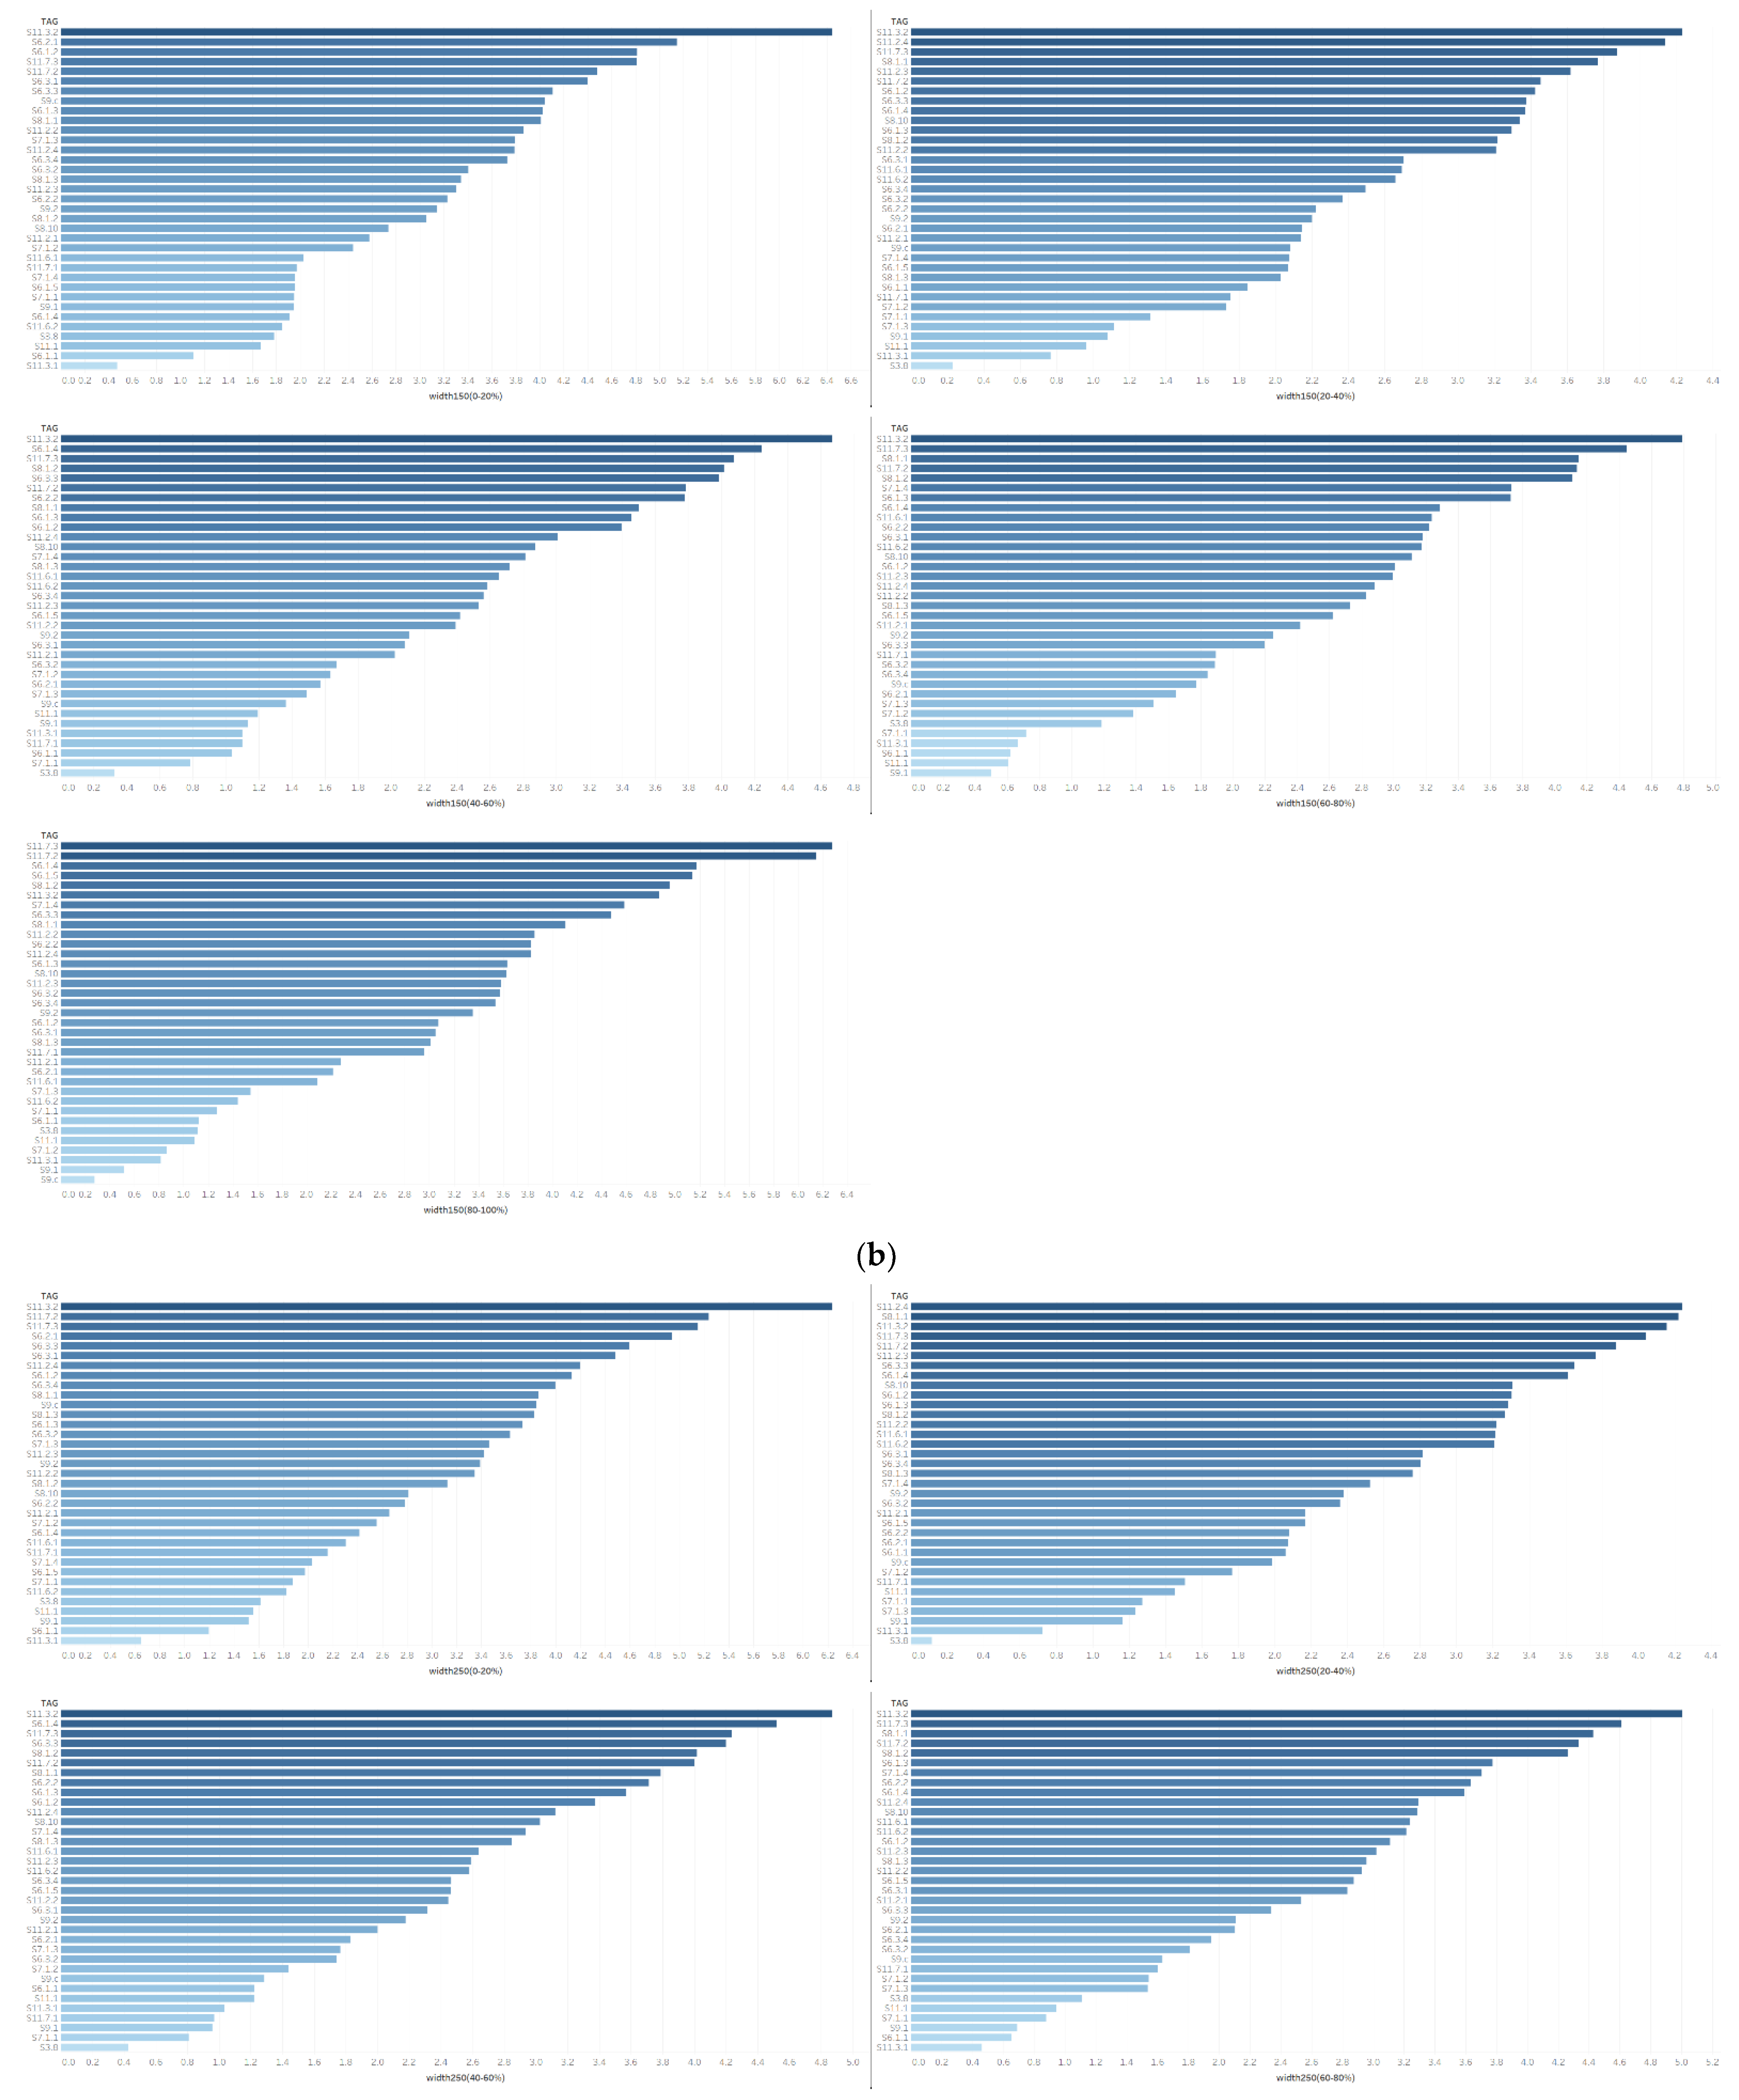
- Within the above SDG targets, the indicators with high average weighted degrees (AWD) are related to targets 6.1, 8.1, 11.3 and 11.7, while those with low AWD are related to targets 3.8, 6.1, 7.1, 9.1, 11.1, 11.2 and 11.3. The high/low AWD is explained by the fact that this indicator is highly/lowly connected to other indicators. In other words, if the total index is generated from the existing indicators/targets, the indicators/targets with high AWDs are the dominant ones in the index.
- Here, 6.1 and 11.3 have several different indicators, and the influences of them diverge significantly. In general, safe and affordable drinking water, economic growth, the public budget expenditures for sustainable development and the supply of green space are treated as the most important detailed targets. On the other hand, the supply of basic health care services, the supply of modern energy, the newly acquired fixed assets for infrastructure and basic housing services are not set as key statistics at the county level.
- The setting of targets is performed in relation to the general development level of the counties. During 2016–2021 (the Thirteenth Five-Year Plan), the fight against poverty in China came to the final stage. In 2020, the goal was to remove the 832 impoverished counties from the country’s poverty list. Based on the data from 2020 collected in this research, most counties have met the standard of poverty alleviation. Few indicators would be set to measure the minimum living standards. For example, the housing need in the countryside is not a serious problem, as rural residents are supplied with homesteads to satisfy their basic needs. The health care services at the county level are positioned to cover the treatment of common diseases. Patients with difficult or severe diseases are usually transferred to city hospitals. Therefore, the development targets on the county level are not being paid much attention.
- For the water supply, the importance of two indicators diverges. Density of Water Supply Pipelines in Built District evaluates the water supply facilities but does not consider the population density. A county with a low density may still satisfy the need for water if its population density is also low. Instead, the Public Water Coverage Rate can accurately measure the proportion of households that have benefited from the public water supply. The rates in 249 counties are lower than 90%, and those in 94 are lower than 80%. A government with a low rate of public water supply would face great pressure to improve this indicator. This indicator supplements a much more stated objective for the local government than the Density of Water Supply Pipelines in Built District and should have a high correlation with other indicators in the assessment network. On the contrary, Density of Water Supply Pipelines in Built District is not regarded as a clear indicator and has weak correlations with other indicators.
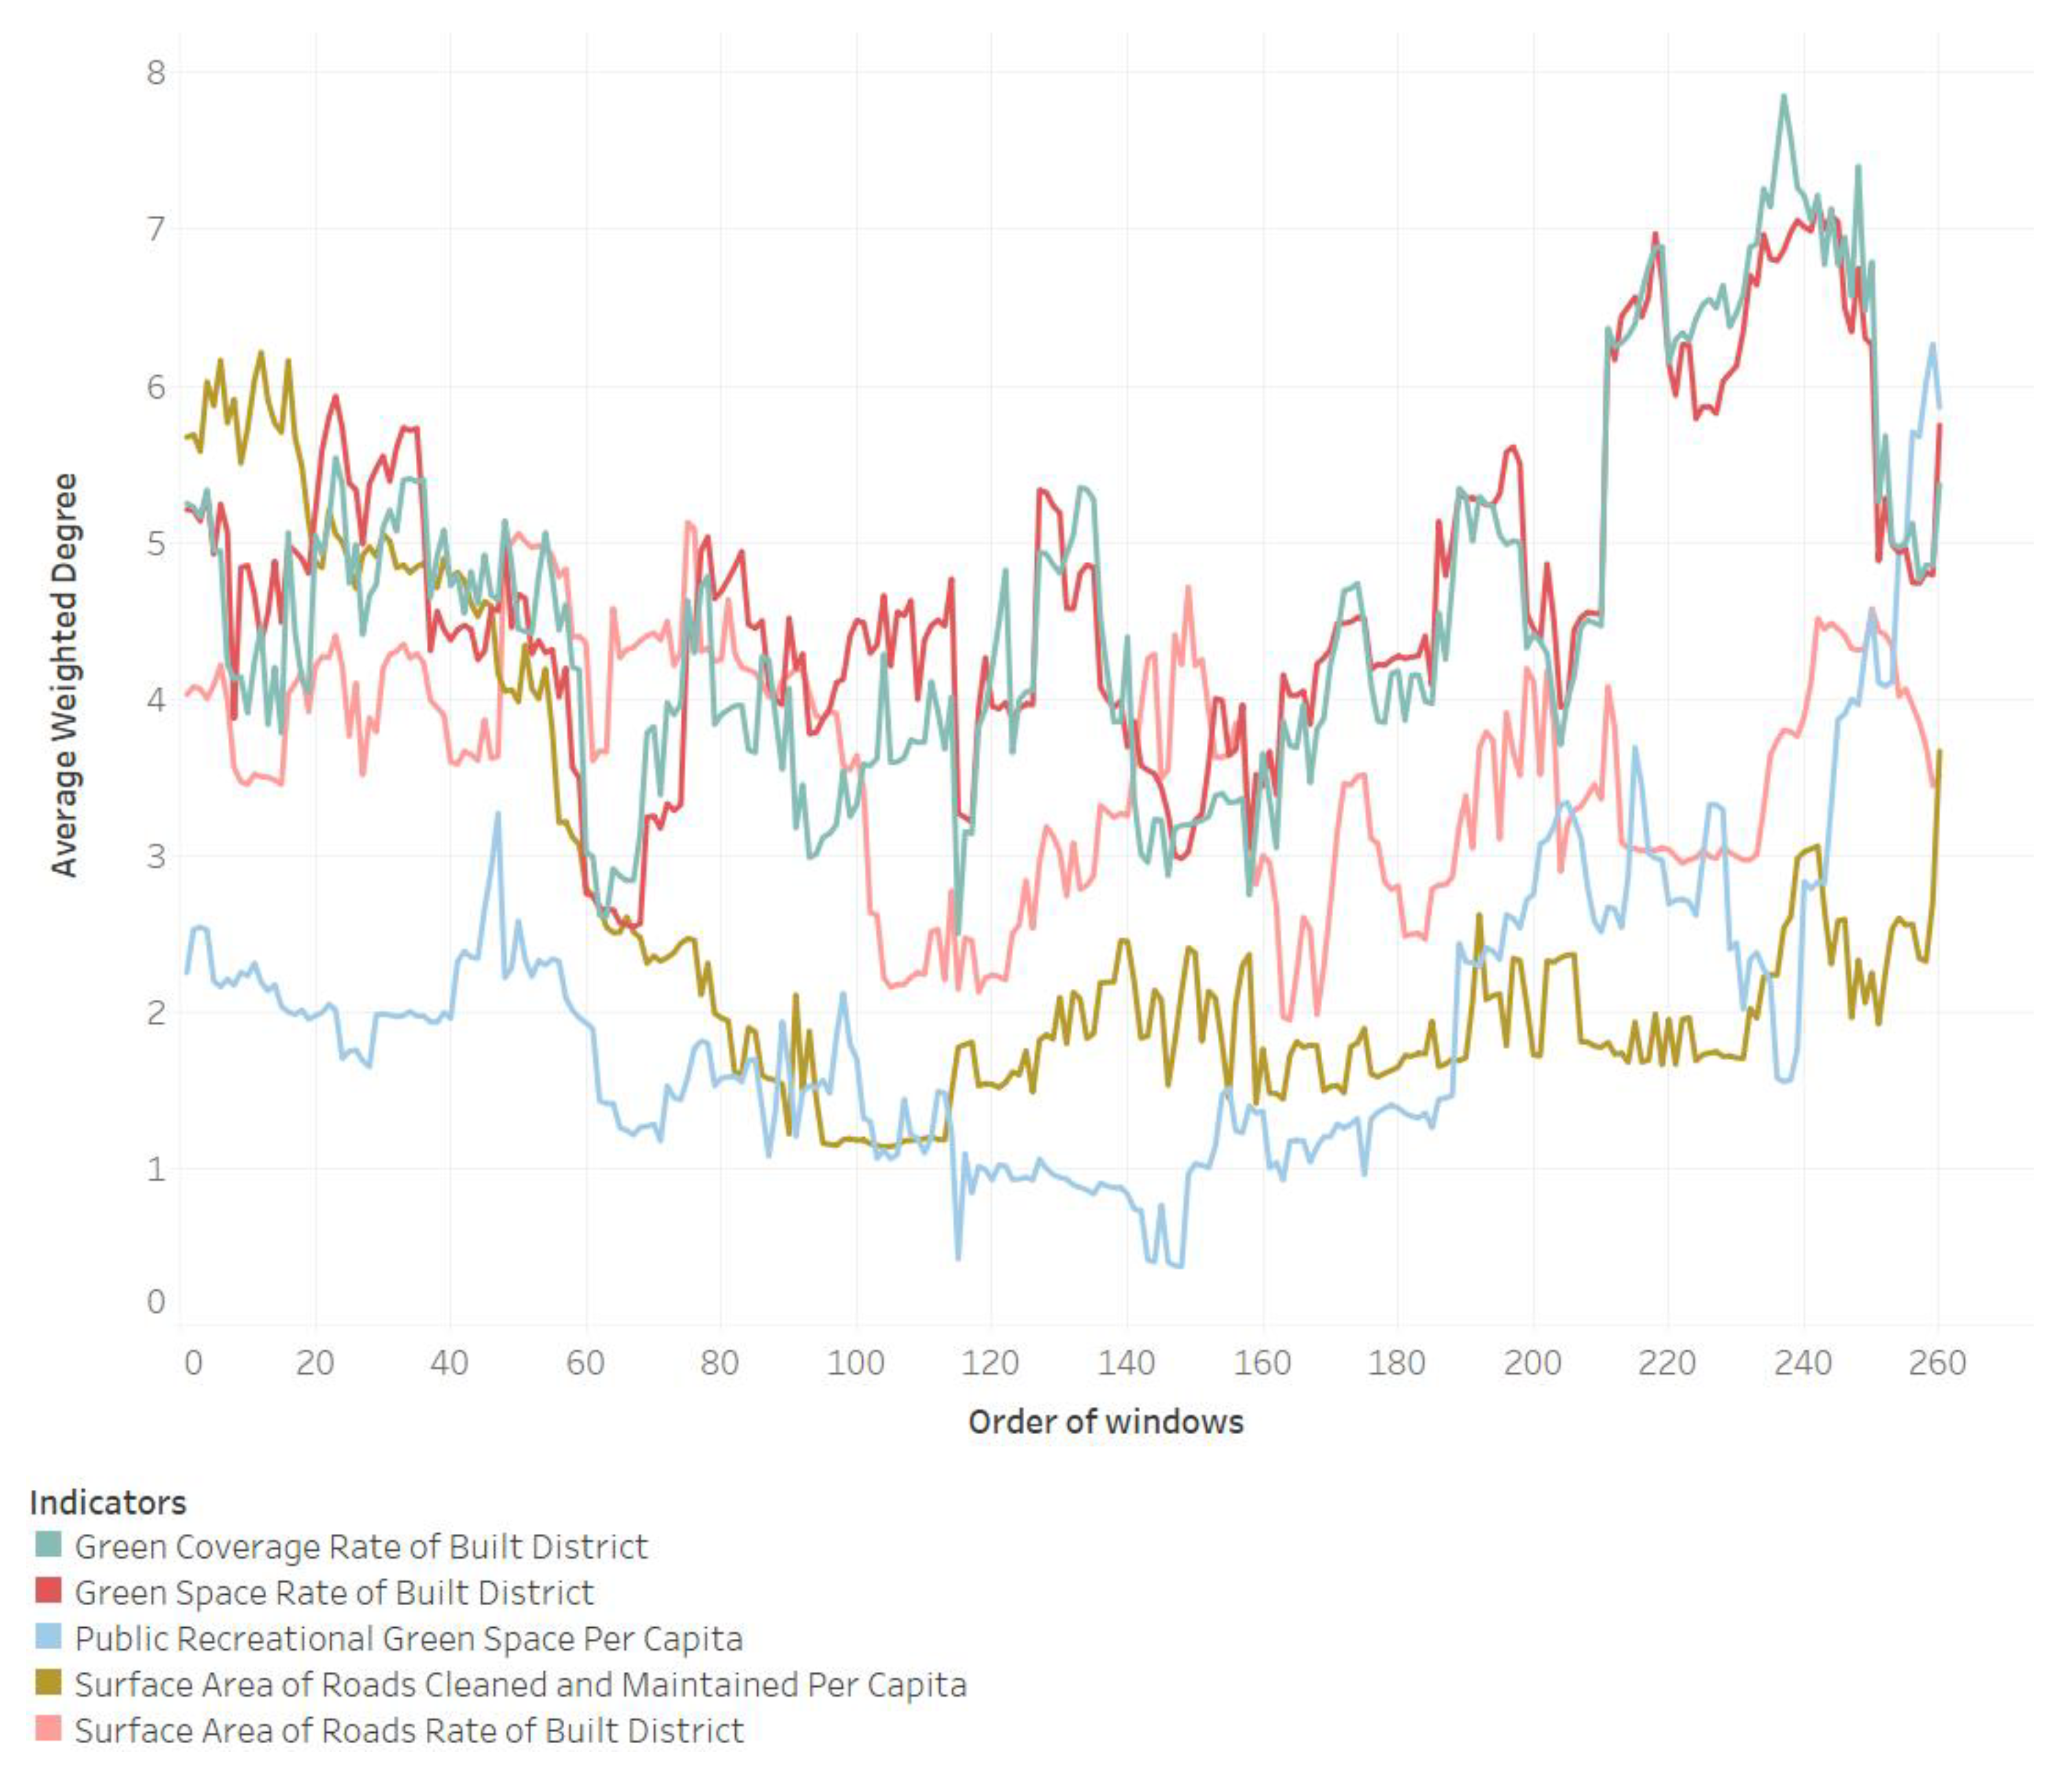
- The comparison among the 14 indicators with high values shows that the indicators related to greening are stable at different levels of the total index. For counties at various development stages, the construction of green space is always taken into account. Even in counties at the 0–20% level of the total index, the residents’ minimum requirement for housing is already satisfied, and they are looking for an improvement in the quality of life, such as greening. The high AWD of this indicator is explained as the desire to live with the natural environment of the county residents, especially those who lived in the countryside and moved to nearby county seats.
- If the samples are ordered based on the water supply rate (not the public water supply rate) and divided into five equal parts, the average of each part should be 91.1%, 95.6%, 97.0%, 98.0% and 98.6%, respectively. On the one hand, even the lowest 20% of counties still supply water to more than 90% of residents, on average. The fundamental demand is realized for most residents. On the other hand, it requires great effort to further improve this rate. For counties with rates of over 97%, the rest of the residents usually live in isolated areas and under poor conditions to achieve stable water supply. This requires an active investment by the government to answer these residents’ demand, which may be much higher than the investment to supply the same number of households with drinking water. This can explain why the Water Coverage Rate becomes an important indicator again when the total index grows to the middle and high level. The improvement of the water supply for the rest of the residents may require a comprehensive construction project to improve their housing quality. Hence, this indicator becomes highly correlated with others.
- Wastewater Treatment Rate is an indicator with unstable AWD. In three types of window widths, it has a high AWD at levels of 0–20%, 40–60% and 80–100% along the total index. However, the AWD falls to the middle of all indicators at the levels of 20–40% and 60–80%. Here, the sewerage includes the domestic sewage, industry wastewater and wastewater in the public space, such as wastewater from catering in the commercial regions. It does not represent the treatment of domestic sewage. Additionally, when the Water Coverage Rate is lower than 100%, this indicates that the water supply system does not fully cover the whole population. When a county’s Wastewater Treatment Rate is lower than 100%, this county lacks the capacity to collect or to deal with the total amount of wastewater. When the Wastewater Treatment Rate is over a certain level, the untreated wastewater would be diluted, so that the harm of water pollution is not evident in the short term. Moreover, the precipitation and hydrological conditions are diversified in different counties, which may also change the damage from the polluted water. Hence, an upgrade of the wastewater treatment system may sometimes incur a high cost but produce a low return in the development, and it is not regarded as a major target in some cases. In fact, more than 500 counties have achieved a water supply rate of 100%, but only 119 counties have reached a Wastewater Treatment Rate of 100%.
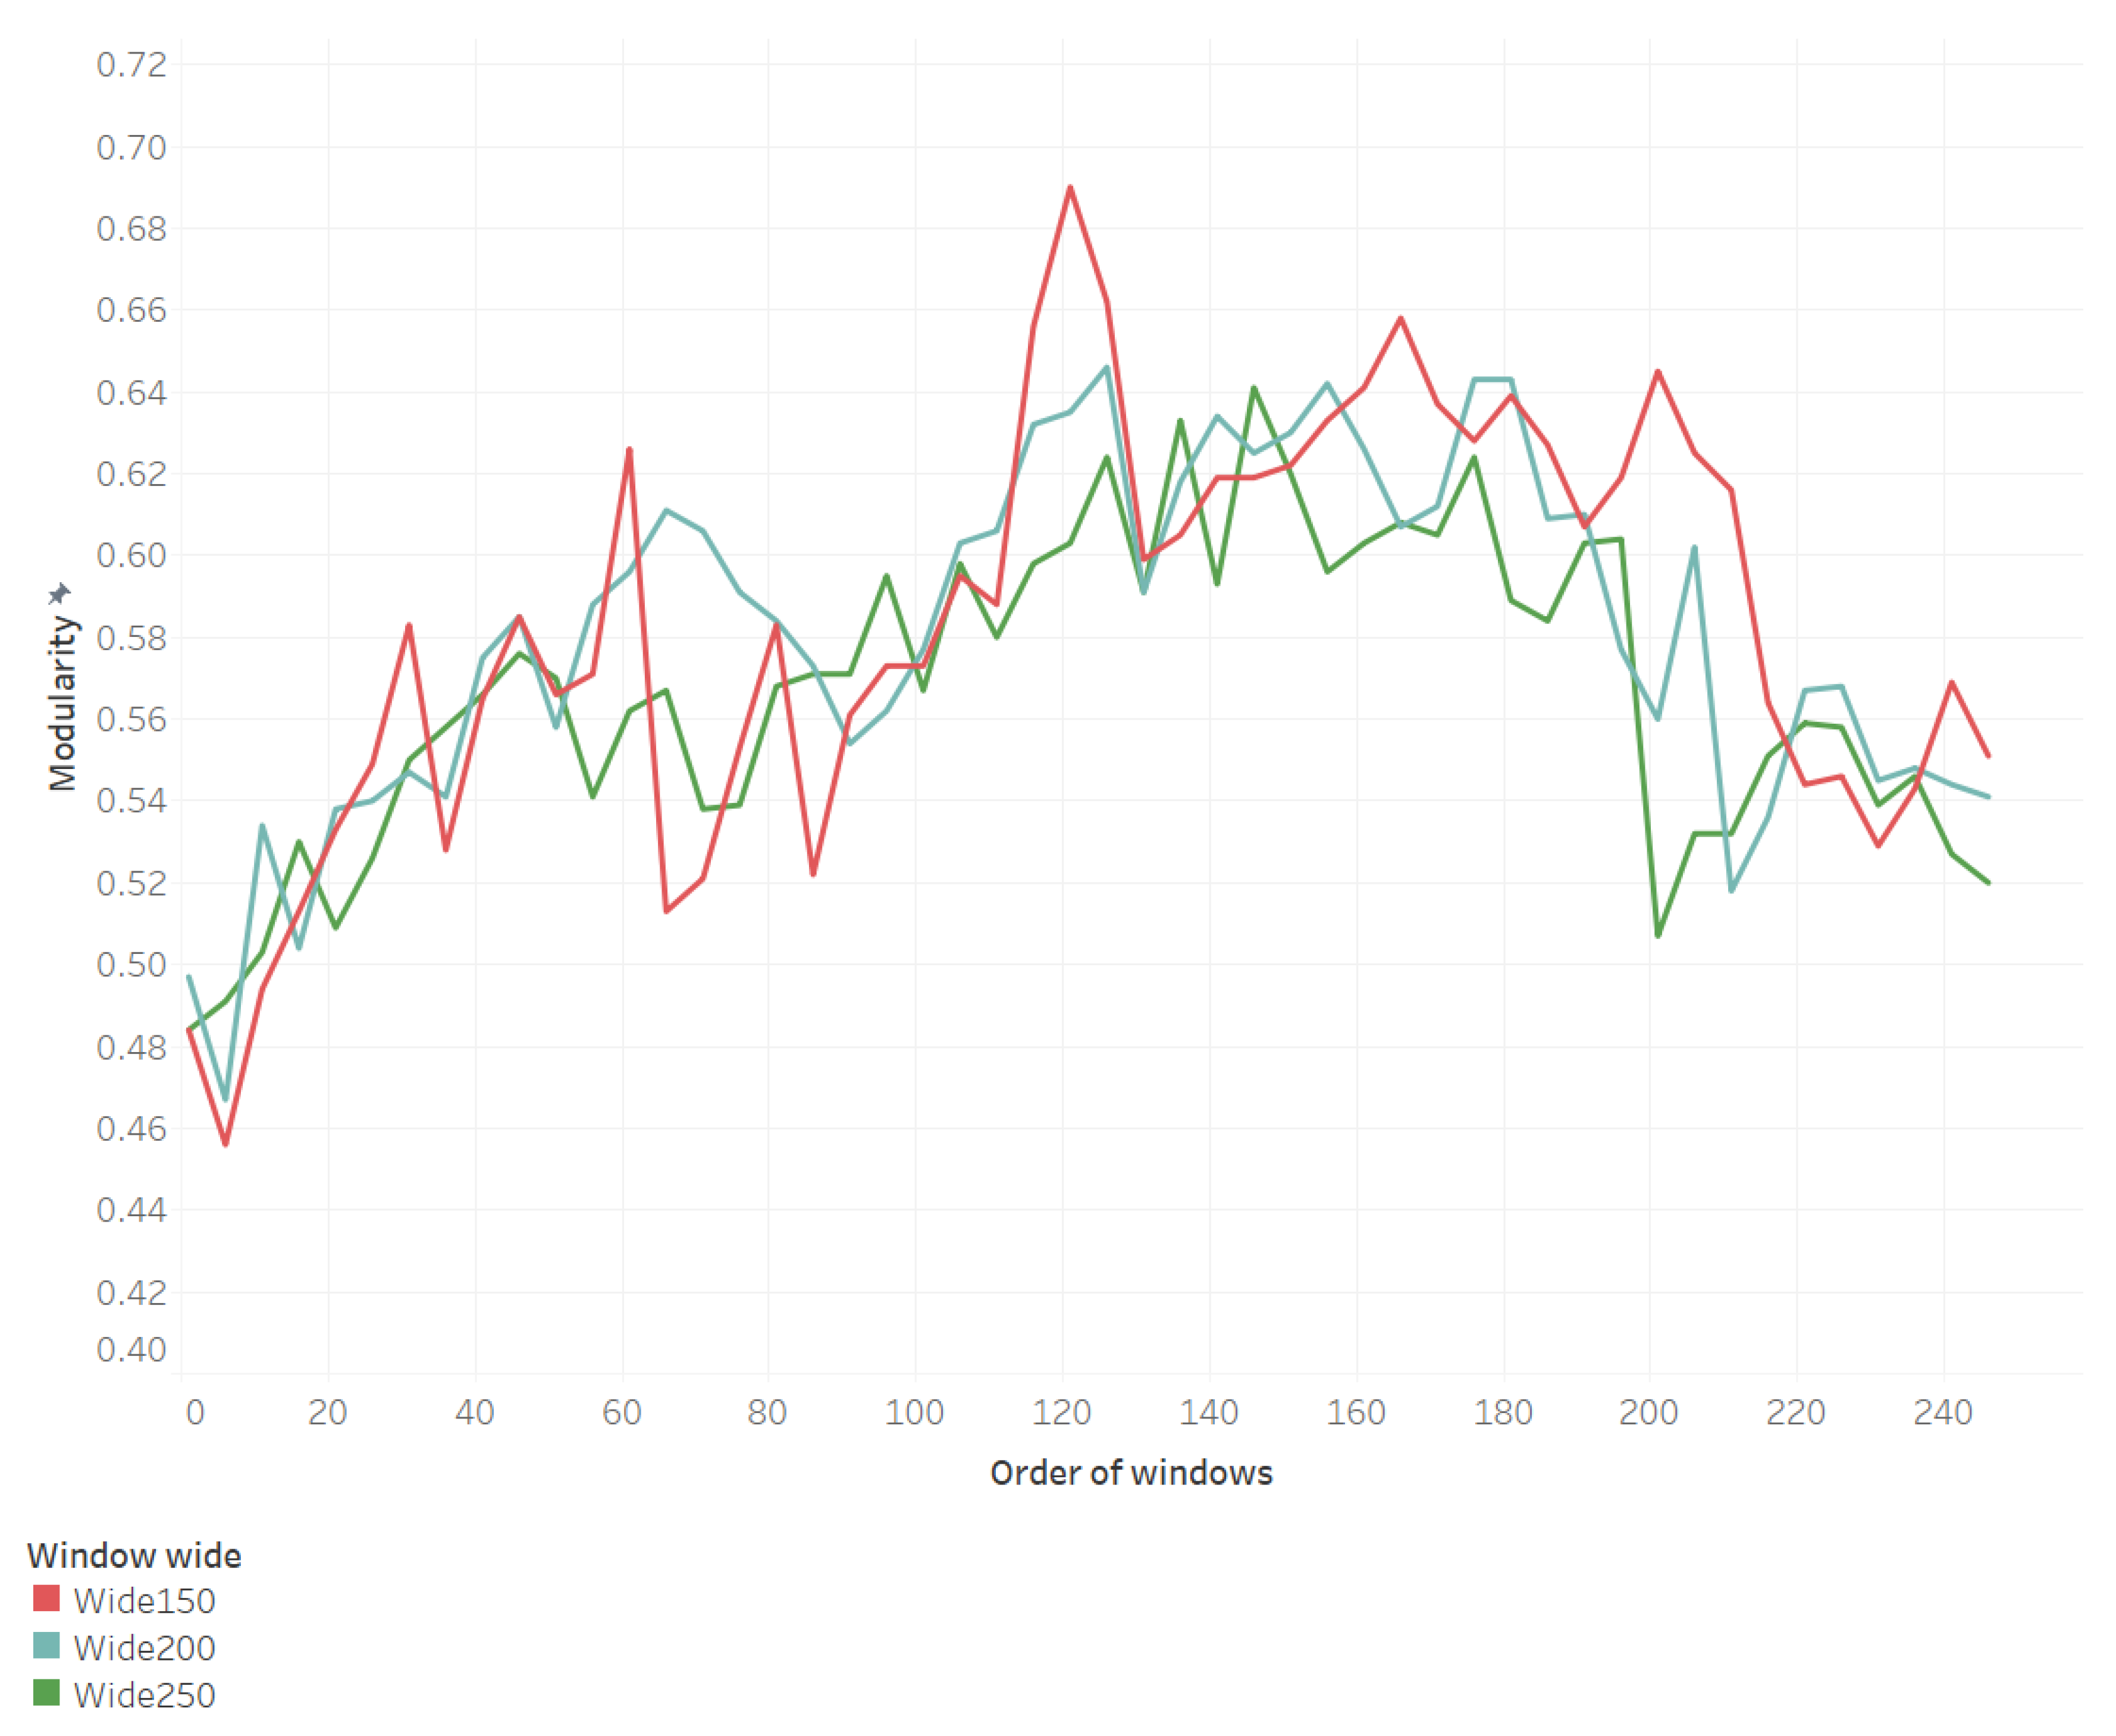
- The inverted U curve of the modularity states that when the total index is at the middle level, the indicators tend to split into several separate parts. It is difficult to improve the total index by just enhancing some key indicators. When the total index is at the low level or at the high level, most indicators have significant correlations with each other. The change of some indicators is more likely to spread to other indicators. This indicates that a county would run into a development bottleneck at the middle development level. To break this bottleneck, a comprehensive development strategy has to be designed to deal with multiple targets simultaneously.
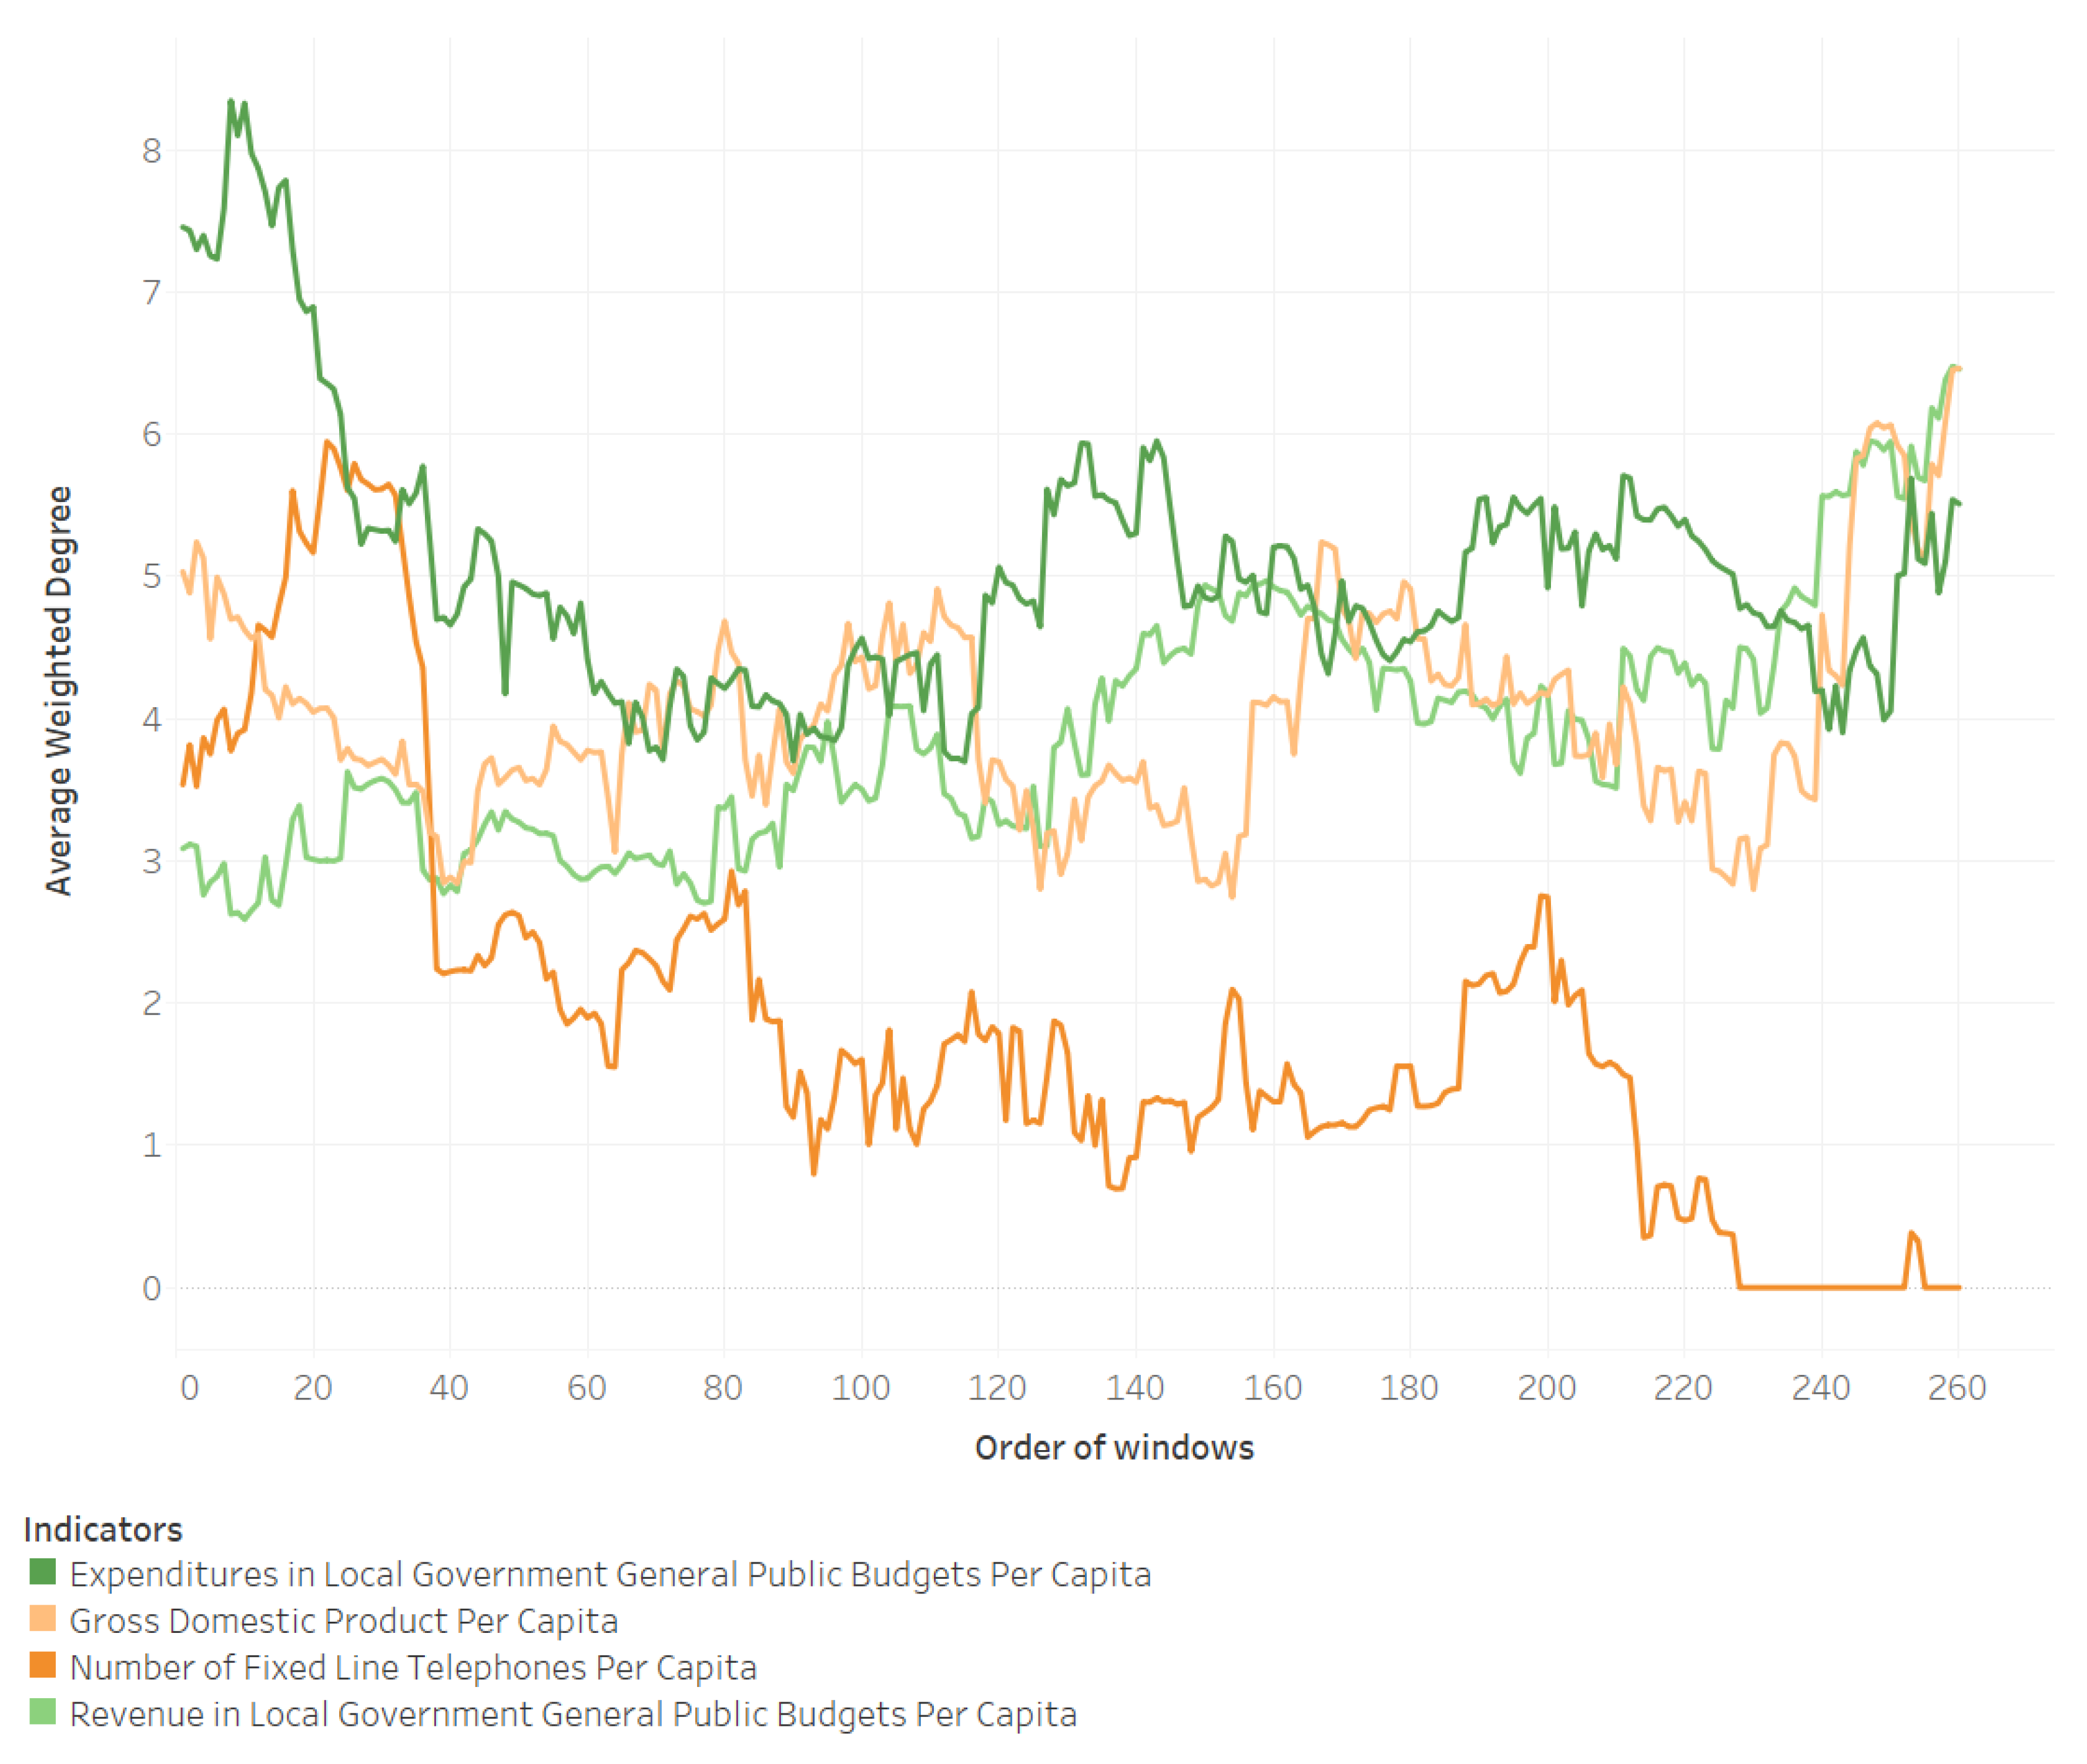
- As the major economic indicators, it is not surprising that Gross Domestic Product Per Capita, Expenditures in Local Government General Public Budgets Per Capita and Revenue in Local Government General Public Budgets Per Capita are captured as important indicators. However, the AWD of Expenditures in Local Government General Public Budgets Per Capita falls significantly at the 0–20% level. This phenomenon suggests that when the total index is low, a simple strategy to increase the Revenue in General Public Budgets can promote a reinforcement of most indicators. This usually occurs in poverty alleviation. However, the efficiency of increasing the Expenditures in General Public Budgets first drops sharply and then remains stable as the total index rises to a certain level. The county cannot just follow its previous strategy of eliminating extreme poverty but has to discover the key development problem and invest. Of course, continuous expenditures are still necessary. On the other hand, as a capacity to maintain the fiscal income, Revenue in Local Government General Public Budgets Per Capita is a foundation for further development at all stages, especially when the county is above the average level. Fiscal subsidy is only provided to counties with the lowest fiscal income. Sustainable development in most counties depends on their own fiscal capacity.
5.2. Comparison with Two Assessment Reports in China
5.3. Summary of Conclusions
Author Contributions
Funding
Data Availability Statement
Conflicts of Interest
Appendix A

References
- Liu, Y.-S. Research on the urban-rural integration and rural revitalization in the new era in China. Acta Geogr. Sin. 2018, 73, 637–650. (In Chinese) [Google Scholar] [CrossRef]
- Lang, W.; Chen, T.; Li, X. A new style of urbanization in China: Transformation of urban rural communities. Habitat Int. 2016, 55, 1–9. [Google Scholar] [CrossRef]
- Liu, Y.; Li, Y. Revitalize the world’s countryside. Nature 2017, 548, 275–277. [Google Scholar] [CrossRef] [PubMed]
- Xu, Y. County, township and village government: The structural transformation in the rural government. Jiangsu Soc. Sci. 2002, 2, 27–30. (In Chinese) [Google Scholar]
- Ding, C.; Gao, H. The major content in urban-rural coordination in the county economic development in China. Theory J. 2010, 11, 49–53. (In Chinese) [Google Scholar] [CrossRef]
- Liu, E.; Han, T.; Yue, Z. The construction of the rural multi-level elderly care service system in the view of county coordination. Issues Agric. Econ. 2022, 7, 133–142. (In Chinese) [Google Scholar]
- Li, X.; Hui, E.C.; Chen, T.; Lang, W.; Guo, Y. From Habitat III to the new urbanization agenda in China: Seeing through the practices of the “three old renewals” in Guangzhou. Land Use Policy 2018, 81, 513–522. [Google Scholar] [CrossRef]
- Sachs, J.; Schmidt-Traub, G.; Kroll, C.; Lafortune, G.; Fuller, G. SDG Index and Dashboards Report 2018; Bertelsmann Stiftung and Sustainable Development Solutions Network (SDSN): New York, NY, USA, 2017; p. 479. [Google Scholar]
- Xu, Z.; Chau, S.N.; Chen, X.; Zhang, J.; Li, Y.; Dietz, T.; Wang, J.; Winkler, J.A.; Fan, F.; Huang, B.; et al. Assessing progress towards sustainable development over space and time. Nature 2020, 577, 74–78. [Google Scholar] [CrossRef]
- Lu, Y.; Nakicenovic, N.; Visbeck, M.; Stevance, A.-S. Policy: Five priorities for the UN Sustainable Development Goals—Comment. Nature 2015, 520, 432–433. [Google Scholar] [CrossRef]
- Schmidt, H.; Gostin, L.O.; Emanuel, E.J. Public health, universal health coverage, and Sustainable Development Goals: Can they coexist? Lancet 2015, 386, 928–930. [Google Scholar] [CrossRef]
- Ospina-Forero, L.; Castanñeda, G.; Guerrero, O.A. Estimating networks of sustainable development goals. Inf. Manag. 2020, 59, 103342. [Google Scholar] [CrossRef]
- Pedercini, M.; Barney, G.O. Dynamic analysis of interventions designed to achieve millennium development goals (MDG): The case of Ghana. Socio-Econ. Plan. Sci. 2010, 44, 89–99. [Google Scholar] [CrossRef]
- Allen, C.; Metternicht, G.; Wiedmann, T. Prioritising SDG targets: Assessing baselines, gaps and interlinkages. Sustain. Sci. 2019, 14, 421–438. [Google Scholar] [CrossRef]
- Czyżewska, M.; Mroczek, T. Bayesian approach to the process of indentification of the determinants of innovativeness. e-Finanse Financ. Internet Q. 2014, 10, 44–56. [Google Scholar] [CrossRef]
- Cinicioglu, E.N.; Ulusoy, G.; Ekici, Ş.Ö.; Ülengin, F.; Ülengin, B. Exploring the interaction between competitiveness of a country and innovation using Bayesian networks. Innov. Dev. 2016, 7, 175–209. [Google Scholar] [CrossRef]
- Le Blanc, D. Towards Integration at Last? The Sustainable Development Goals as a Network of Targets. Sustain. Dev. 2015, 23, 176–187. [Google Scholar] [CrossRef]
- Weitz, N.; Carlsen, H.; Nilsson, M.; Skånberg, K. Towards systemic and contextual priority setting for implementing the 2030 Agenda. Sustain. Sci. 2017, 13, 531–548. [Google Scholar] [CrossRef]
- Joint Research Centre (European Commission); Neher, F.; Miola, A.; Borchardt, S.; Buscaglia, D. Interlinkages and Policy Coherence for the Sustainable Development Goals Implementation; Publications Office of the European Union: Luxembourg, 2019. [Google Scholar] [CrossRef]
- Vandyck, T.; Keramidas, K.; Kitous, A.; Spadaro, J.V.; Van Dingenen, R.; Holland, M.; Saveyn, B. Air quality co-benefits for human health and agriculture counterbalance costs to meet Paris Agreement pledges. Nat. Commun. 2018, 9, 4939. [Google Scholar] [CrossRef]
- Vladimirova, K.; Le Blanc, D. Exploring Links Between Education and Sustainable Development Goals Through the Lens of UN Flagship Reports. Sustain. Dev. 2016, 24, 254–271. [Google Scholar] [CrossRef]
- Fuso Nerini, F.; Tomei, J.; To, L.S.; Bisaga, I.; Parikh, P.; Black, M.; Borrion, A.; Spataru, C.; Castán Broto, V.; Anandarajah, G.; et al. Mapping synergies and trade-offs between energy and the Sustainable Development Goals. Nat. Energy 2018, 3, 10–15. [Google Scholar] [CrossRef]
- Singh, G.G.; Cisneros-Montemayor, A.M.; Swartz, W.; Cheung, W.; Guy, J.A.; Kenny, T.-A.; McOwen, C.J.; Asch, R.; Geffert, J.L.; Wabnitz, C.C.; et al. A rapid assessment of co-benefits and trade-offs among Sustainable Development Goals. Mar. Policy 2018, 93, 223–231. [Google Scholar] [CrossRef]
- Mainali, B.; Luukkanen, J.; Silveira, S.; Kaivo-Oja, J. Evaluating Synergies and Trade-Offs among Sustainable Development Goals (SDGs): Explorative Analyses of Development Paths in South Asia and Sub-Saharan Africa. Sustainability 2018, 10, 815. [Google Scholar] [CrossRef]
- von Stechow, C.; Minx, J.C.; Riahi, K.; Jewell, J.; McCollum, D.L.; Callaghan, M.W.; Bertram, C.; Luderer, G.; Baiocchi, G. 2 °C and SDGs: United they stand, divided they fall? Environ. Res. Lett. 2016, 11, 034022. [Google Scholar] [CrossRef]
- Scherer, L.; Behrens, P.; de Koning, A.; Heijungs, R.; Sprecher, B.; Tukker, A. Trade-offs between social and environmental Sustainable Development Goals. Environ. Sci. Policy 2018, 90, 65–72. [Google Scholar] [CrossRef]
- Sebestyén, V.; Bulla, M.; Rédey, Á.; Abonyi, J. Network model-based analysis of the goals, targets and indicators of sustainable development for strategic environmental assessment. J. Environ. Manag. 2019, 238, 126–135. [Google Scholar] [CrossRef] [PubMed]
- Nilsson, M.; Griggs, D.; Visbeck, M. Policy: Map the interactions between Sustainable Development Goals. Nature 2016, 534, 320–322. [Google Scholar] [CrossRef]
- Pradhan, P.; Costa, L.; Rybski, D.; Lucht, W.; Kropp, J. A Systematic Study of Sustainable Development Goal (SDG) Interactions. Earths Future 2017, 5, 1169–1179. [Google Scholar] [CrossRef]
- Nilsson, M.; Chisholm, E.; Griggs, D.; Howden-Chapman, P.; McCollum, D.; Messerli, P.; Neumann, B.; Stevance, A.-S.; Visbeck, M.; Stafford-Smith, M. Mapping interactions between the sustainable development goals: Lessons learned and ways forward. Sustain. Sci. 2018, 13, 1489–1503. [Google Scholar] [CrossRef]
- Schiavo, S.; Reyes, J.; Fagiolo, G. International trade and financial integration: A weighted network analysis. Quant. Financ. 2010, 10, 389–399. [Google Scholar] [CrossRef]
- Ghazalpour, A.; Doss, S.; Zhang, B.; Wang, S.; Plaisier, C.; Castellanos, R.; Brozell, A.; Schadt, E.E.; Drake, T.A.; Lusis, A.J.; et al. Integrating Genetic and Network Analysis to Characterize Genes Related to Mouse Weight. PLoS Genet. 2006, 2, e130. [Google Scholar] [CrossRef]
- Swain, R.B.; Ranganathan, S. Modeling interlinkages between sustainable development goals using network analysis. World Dev. 2020, 138, 105136. [Google Scholar] [CrossRef]
- Zeng, Y.; Runting, R.K.; Watson, J.E.M.; Carrasco, L.R. Telecoupled environmental impacts are an obstacle to meeting the sustainable development goals. Sustain. Dev. 2021, 30, 76–82. [Google Scholar] [CrossRef]
- Wu, X.; Fu, B.; Wang, S.; Song, S.; Li, Y.; Xu, Z.; Wei, Y.; Liu, J. Decoupling of SDGs followed by re-coupling as sustainable development progresses. Nat. Sustain. 2022, 5, 452–459. [Google Scholar] [CrossRef]
- Spaiser, V.; Ranganathan, S.; Swain, R.B.; Sumpter, D.J.T. The sustainable development oxymoron: Quantifying and modelling the incompatibility of sustainable development goals. Int. J. Sustain. Dev. World Ecol. 2016, 24, 457–470. [Google Scholar] [CrossRef]
- Blondel, V.D.; Guillaume, J.-L.; Lambiotte, R.; Lefebvre, E. Fast unfolding of communities in large networks. J. Stat. Mech. Theory Exp. 2008, 2008, P10008. [Google Scholar] [CrossRef]
- Sachs, J.; Schmidt-Traub, G.; Kroll, C.; Lafortune, G.; Fuller, G.; Woelm, F. The Sustainable Development Goals and COVID-19; Sustainable Development Report 2020; Cambridge University Press: Cambridge, UK, 2020. [Google Scholar]
- Huang, Y.; Li, X. Research on rural construction problems in Guangdong Province: Based on the practice of rural construction evaluation in three counties. Constr. Sci. Technol. 2021, 7, 14–18+24. (In Chinese) [Google Scholar]
- Li, X.; Huang, Y.; Chen, W.; Qin, X.; Chen, L.; Xu, W. Exploration and practice of rural construction evaluation system: Based on a survey of twelve counties in four provinces. City Plan. Rev. 2021, 45, 9–18. (In Chinese) [Google Scholar]



| Target No. | Description of Target | Indicators in This Study | Serial Number |
|---|---|---|---|
| 3.8 | Achieve universal health coverage, including financial risk protection, access to quality essential health care services and access to safe, effective, quality and affordable essential medicines and vaccines for all | Number of Beds in Health Care Institutions Per Thousand Persons (unit) | S3.8 |
| 6.1 | By 2030, achieve universal and equitable access to safe and affordable drinking water for all | Density of Water Supply Pipelines in Built District (kilometer/square kilometer) | S6.1.1 |
| Daily Water Consumption Per Capita (liter) | S6.1.2 | ||
| Quantity of Water Supply Per Capita (m3) | S6.1.3 | ||
| Water Coverage Rate (%) | S6.1.4 | ||
| Public Water Coverage Rate (%) | S6.1.5 | ||
| 6.2 | By 2030, achieve access to adequate and equitable sanitation and hygiene for all and end open defecation, paying special attention to the needs of women and girls and those in vulnerable situations | Surface Area of Roads Cleaned and Maintained Per Capita (m3) | S6.2.1 |
| Number of Latrines Per Thousand Persons (unit) | S6.2.2 | ||
| 6.3 | By 2030, improve water quality by reducing pollution, eliminating dumping and minimizing release of hazardous chemicals and materials, halving the proportion of untreated wastewater and substantially increasing recycling and safe reuse globally | Quantity of Wastewater Treated Per Capita (m3) | S6.3.1 |
| Density of Sewers in Built District (kilometer/square kilometer) | S6.3.2 | ||
| Wastewater Treatment Rate (%) | S6.3.3 | ||
| Centralized Treatment Rate of Wastewater Treatment Plants (%) | S6.3.4 | ||
| 7.1 | By 2030, ensure universal access to affordable, reliable and modern energy services | Density of Gas Supply Pipeline (kilometer/square kilometer) | S7.1.1 |
| Gas Supplied Per Capita (m3) | S7.1.2 | ||
| Liquefied Petroleum Gas Supplied Per Capita (ton) | S7.1.3 | ||
| Gas Coverage Rate (%) | S7.1.4 | ||
| 8.1 | Sustain per capita economic growth in accordance with national circumstances and, in particular, at least 7 per cent gross domestic product growth per annum in the least developed countries | Gross Domestic Product Per Capita (CNY 10,000) | S8.1.1 |
| Revenue in Local Government General Public Budgets Per Capita (CNY 10,000) | S8.1.2 | ||
| Balance of Household Saving Deposit Per Capita (CNY 10,000) | S8.1.3 | ||
| 8.10 | Strengthen the capacity of domestic financial institutions to encourage and expand access to banking, insurance and financial services for all | Loans Balance of Financial Institutions at Year-End Per Capita (CNY 10,000) | S8.10 |
| 9.1 | Develop quality, reliable, sustainable and resilient infrastructure, including regional and transborder infrastructure, to support economic development and human well-being, with a focus on affordable and equitable access for all | Newly Added Fixed Assets of This Year Per Capita (CNY 10,000) | S9.1 |
| 9.2 | Promote inclusive and sustainable industrialization and, by 2030, significantly raise industry’s share of employment and gross domestic product, in line with national circumstances, and double its share in least developed countries | Number of Industrial Enterprises above Designated Size (unit) | S9.2 |
| 9.c | Significantly increase access to information and communications technology and strive to provide universal and affordable access to the internet in least developed countries by 2020 | Number of Fixed Line Telephones Per Capita (unit) | S9.c |
| 11.1 | By 2030, ensure access for all to adequate, safe and affordable housing and basic services and upgrade slums | Number of Beds in Social Welfare Institutions with Accommodation (unit) | S11.1 |
| 11.2 | By 2030, provide access to safe, affordable, accessible and sustainable transport systems for all, improving road safety, notably by expanding public transport, with special attention to the needs of those in vulnerable situations, women, children, persons with disabilities and older persons | Density of Bridges (unit/square kilometers) | S11.2.1 |
| Road Surface Area Per Capita (m2) | S11.2.2 | ||
| Density of Road Network in Built District (kilometer/square kilometer) | S11.2.3 | ||
| Surface Area of Roads Rate of Built District (%) | S11.2.4 | ||
| 11.3 | By 2030, enhance inclusive and sustainable urbanization and capacity for participatory, integrated and sustainable human settlement planning and management in all countries | Population Density (person/square kilometer) | S11.3.1 |
| Expenditures in Local Government General Public Budgets Per Capita (CNY 10,000) | S11.3.2 | ||
| 11.6 | By 2030, reduce the per capita adverse environmental impact of cities, including by paying special attention to air quality and municipal and other waste management | Domestic Garbage Treatment Rate (%) | S11.6.1 |
| Domestic Garbage Harmless Treatment Rate (%) | S11.6.2 | ||
| 11.7 | By 2030, provide universal access to safe, inclusive and accessible green and public spaces, in particular for women and children, older persons and persons with disabilities | Public Recreational Green Space Per Capita (m2) | S11.7.1 |
| Green Coverage Rate of Built District (%) | S11.7.2 | ||
| Green Space Rate of Built District (%) | S11.7.3 |
| SDG Target | Indicator | Trend |
|---|---|---|
| 6.1 | Public Water Coverage Rate | Stable, and increasing after 80% |
| 11.7 | Public Recreational Green Space Per Capita | Stable, and increasing after 80% |
| 6.1 | Water Coverage Rate | Increasing |
| 7.1 | Gas Coverage Rate | Increasing |
| 8.1 | Revenue in Local Government General Public Budgets Per Capita | Increasing |
| 6.1 | Quantity of Water Supply Per Capita | Stable |
| 8.1 | Gross Domestic Product Per Capita | Stable |
| 11.2 | Surface Area of Roads Rate of Built District | Stable |
| 11.7 | Green Coverage Rate of Built District | Stable |
| 11.7 | Green Space Rate of Built District | Stable |
| 9.c | Number of Fixed Line Telephones Per Capita | Decreasing |
| 6.2 | Surface Area of Roads Cleaned and Maintained Per Capita | Decreasing, and stable after 20% |
| 11.3 | Expenditures in Local Government General Public Budgets Per Capita | Decreasing, and stable after 20% |
| 6.3 | Wastewater Treatment Rate | Unclear |
Publisher’s Note: MDPI stays neutral with regard to jurisdictional claims in published maps and institutional affiliations. |
© 2022 by the authors. Licensee MDPI, Basel, Switzerland. This article is an open access article distributed under the terms and conditions of the Creative Commons Attribution (CC BY) license (https://creativecommons.org/licenses/by/4.0/).
Share and Cite
Zhong, J.; Li, X. Interlinkages among County-Level Construction Indicators and Related Sustainable Development Goals in China. Land 2022, 11, 2008. https://doi.org/10.3390/land11112008
Zhong J, Li X. Interlinkages among County-Level Construction Indicators and Related Sustainable Development Goals in China. Land. 2022; 11(11):2008. https://doi.org/10.3390/land11112008
Chicago/Turabian StyleZhong, Jiawei, and Xun Li. 2022. "Interlinkages among County-Level Construction Indicators and Related Sustainable Development Goals in China" Land 11, no. 11: 2008. https://doi.org/10.3390/land11112008
APA StyleZhong, J., & Li, X. (2022). Interlinkages among County-Level Construction Indicators and Related Sustainable Development Goals in China. Land, 11(11), 2008. https://doi.org/10.3390/land11112008


