Article

Evaluating Whether Farmland Consolidation Is a Feasible Way to Achieve a Balance of Potential Crop Production in Southeastern Coastal China

1
School of Geography and Tourism, Anhui Normal University, Wuhu 241002, China
2
School of Public Affairs, Zhejiang University, Hangzhou 310058, China
3
Anhui Provincial Territorial Space Planning Institute, Hefei 230601, China
4
The Key Laboratory of JiangHuai Arable Land Resources Protection and Eco-Restoration, Hefei 230031, China
*
Author to whom correspondence should be addressed.
Land 2022, 11(11), 1918; https://doi.org/10.3390/land11111918
Submission received: 20 August 2022 / Revised: 17 October 2022 / Accepted: 24 October 2022 / Published: 28 October 2022
(This article belongs to the Special Issue Arable Land System Resilience and Sustainable Use-Ways and Methods)

Abstract

:
The requisition–compensation balance of farmland (RCBF) policy proposes that all farmland requisitioned for development must be compensated with new farmland, of which the continued implementation in economically developed counties in China faces great challenges. The extent to which a balance of potential crop production can be achieved merely through farmland consolidation has important theoretical and practical significance. This study proposes measurement procedures to investigate this degree and takes seven counties in southeastern coastal China as examples on which to conduct an empirical study. The results show the following: (1) there is a significant negative correlation between GDP and the index of the balance of potential crop production of each county, that is, the more developed the county, the lower the potential to achieve the balance; (2) with an increase in elevation, the possibility of increasing potential crop production shows an inverted U-shaped curve, with the maximum values occurring at elevations between 50 and 500 m and more attention should be paid to farmland with an elevation of between 50 m and 500 m when implementing farmland consolidation projects; (3) although it is difficult for economically developed counties to strike a balance of potential crop production merely through farmland consolidation, the potential of which to compensate for the loss of potential crop production from requisition is great, reaching more than 40%, which plays an important role in realizing the requisition–compensation balance of potential crop production; and (4) the potential of farmland consolidation to compensate for the loss of potential crop production and the difference of which between counties should be paid adequate attention when implementing RCBF policy adjustment. Therefore, the proposed approach illustrated in this study clearly reveals the relationship between the loss of potential crop production from requisition and the compensation of potential crop production by farmland consolidation, which has important implications for the adjustment of the RCBF policy in China.

1. Introduction

As farmland is responsible for ensuring national food security, great importance has always been attached to it in many countries, especially populous ones [1,2]. In China, great emphasis has been placed on farmland protection, and a series of farmland protection policies have been enacted since the 1990s. One of the strictest policies, the requisition–compensation balance of farmland (RCBF), proposes that all farmland requisitioned for development must be compensated with new farmland, that are equivalent to the quantity and quality of the requisitioned farmland [3,4,5,6,7,8,9,10]. The policy has effectively alleviated the expansion of construction land and the reduction in farmland [11]. Globally, the policy could be perceived as a representative large-scale reclamation strategy associated with rapid urbanization and agricultural expansion [12]. However, 63% of the total compensatory farmland area comes from the frequent exploitation of grasslands, woodlands, and wetlands [13,14]. Therefore, after more than 20 years, China has barely any land remaining that is suitable for farmland reclamation [1], and the continuous implementation of the RCBF policy faces great challenges. The issue of how to adjust the RCBF policy to cope with the shortage of reserved farmland resources in economically developed areas is of concern. Based on the existing research and local practices, there are two main routes for further reform and improvement of the RCBF policy in China.

1.1. Exploitation-Oriented Route That Ensures No Reduction in the Area of Farmland

The exploitation-oriented route takes the quantity of farmland as the core and ensures that there is no reduction in the total area of farmland during a certain period, the basic logic of which is that the amount of compensated farmland, namely new farmland reclaimed for the purpose of achieving the requisition–compensation balance of farmland, should be equal to or more than the occupied farmland, and farmland displacement is operationalized here as lost farmland that is compensated by new farmland elsewhere in the same period [15,16]. Following this course, if a county does not have enough resources to implement the RCBF policy, “occupation in one county and compensation in another county” will work, meaning that the same area of farmland will be exploited in other counties. Moreover, due to the uneven distribution of cultivated land reserves in China, the policy started to allow the compensation project with permission from the State Council to be carried out in separate provinces different from the actual locations of the occupation [17]. Anyway, the quality of farmland has also been considered in this exploitation-oriented route, namely “substitute quantity for quality”. That is, if the quality of the compensation farmland is lower, a greater amount of farmland should be exploited to compensate for the reduction in quality. Additionally, along with the structural reform of ecological civilization in China, ecological balance is also considered with regard to compensating cultivated lands [18].
Many studies argue that the exploitation-oriented route always results in large amounts of new, low-quality farmland that has been cyclically reclaimed and abandoned [19,20,21,22], and although this route guarantees the red line of 1.8 billion mu of farmland, the minimum amount of farmland that must be ensured according to Chinese policy, the type of land has gradually changed from plain to sloping or terraced [6]. As a consequence, Chinese cropland protection yielded a balance in terms of cropland quantity but not in terms of cropland quality [23]. Moreover, exploiting progressively more new, low-quality farmland, especially in fragile ecological areas, is not only contrary to farmland utilization principles, but could also generate a series of potential ecological and environmental problems, such as soil erosion and geological disasters [1,2,6,8,24,25,26,27,28]. Additionally, the exploitation-oriented route always leads to a considerable loss of ecological land to supplement the lost cropland due to urban expansion, and consequently it may lead to the loss of carbon storage [29].

1.2. Upgrade-Oriented Route That Focuses on Improving the Quality of Exisiting Farmland

The second approach is the upgrade-oriented route, which considers the quality of farmland as the core but does not pursue a quantity balance. However, only ensuring the quantity balance of farmland does not guarantee that the grain production capacity of compensatory farmland is at least equal to that of the requisitioned farmland [30]. Thus, rather than continuously exploiting new farmland, the upgrade-oriented approach focuses on upgrading low-and medium-yielding farmland, and is aimed at balancing the potential crop production of farmland via farmland consolidation, namely improving the quality of farmland by irrigation and water conservancy projects, by comprehensive design of rural road, ridges and ditches, etc. [31]. Clearly, compared to the exploitation-oriented route, the upgrade-oriented approach does not aim to reclaim new farmland, but focuses on improving the quality of existing farmland.
Actually, the current situation of China’s farmland presents two problems. One is that the proportion of medium- and low-yielding fields is high, accounting for more than two-thirds of the total fields [32]. The other is land abandonment, which has been common in the mountainous and arid regions, meaning that the massive amounts of newly reclaimed land have not been utilized effectively [1]. Thus, the upgrade-oriented route is considered to be more eco-friendly and more sustainable. Many scholars suggest that governments should rethink the RCBF policy and replace the existing exploitation-oriented strategy with an upgrade-oriented one to stop the reclamation of large amounts of new farmland when they implement the RCBF policy in economically developed areas [1,25,27,28,31].
However, whether the upgrade-oriented route can be adopted in a specific region depends on one inevitable issue that must be clarified, that is, whether counties in economically developed areas have the potential to achieve the requisition–compensation balance based on potential crop production, and to what extent they can achieve that balance. Alternatively, what does the potential look like in different counties with different natural resource conditions and economic development levels? These questions are undoubtedly critical to determining whether to implement the upgrade-oriented course of action.
To our best knowledge, no published studies have ever addressed this specific topic. Previous studies concerning RCBF have focused principally on implementation of the policy [11], comparison between the farmland either damaged or lost for development and new or improved farmland [17,20], and the impact of RCBF [5,6,7,29]. As for changes in potential crop production, existing literature mainly focuses on cropland area [33], cropland displacement [5], land abandonment [34], policy changes [35], and urban expansion [36]. We propose this study to develop measurement procedures to investigate the potential of the counties to achieve a requisition–compensation balance of potential crop production merely through farmland consolidation, and seven counties in Wenzhou, Zhejiang province are taken as examples. Furthermore, we aim to identify the differences between counties with different natural resource conditions and economic development levels. Based on the results, we offer specific policy recommendations and provide valuable scientific information for the sustainable implementation of the RCBF policy in economically developed areas.

2. Materials and Methods
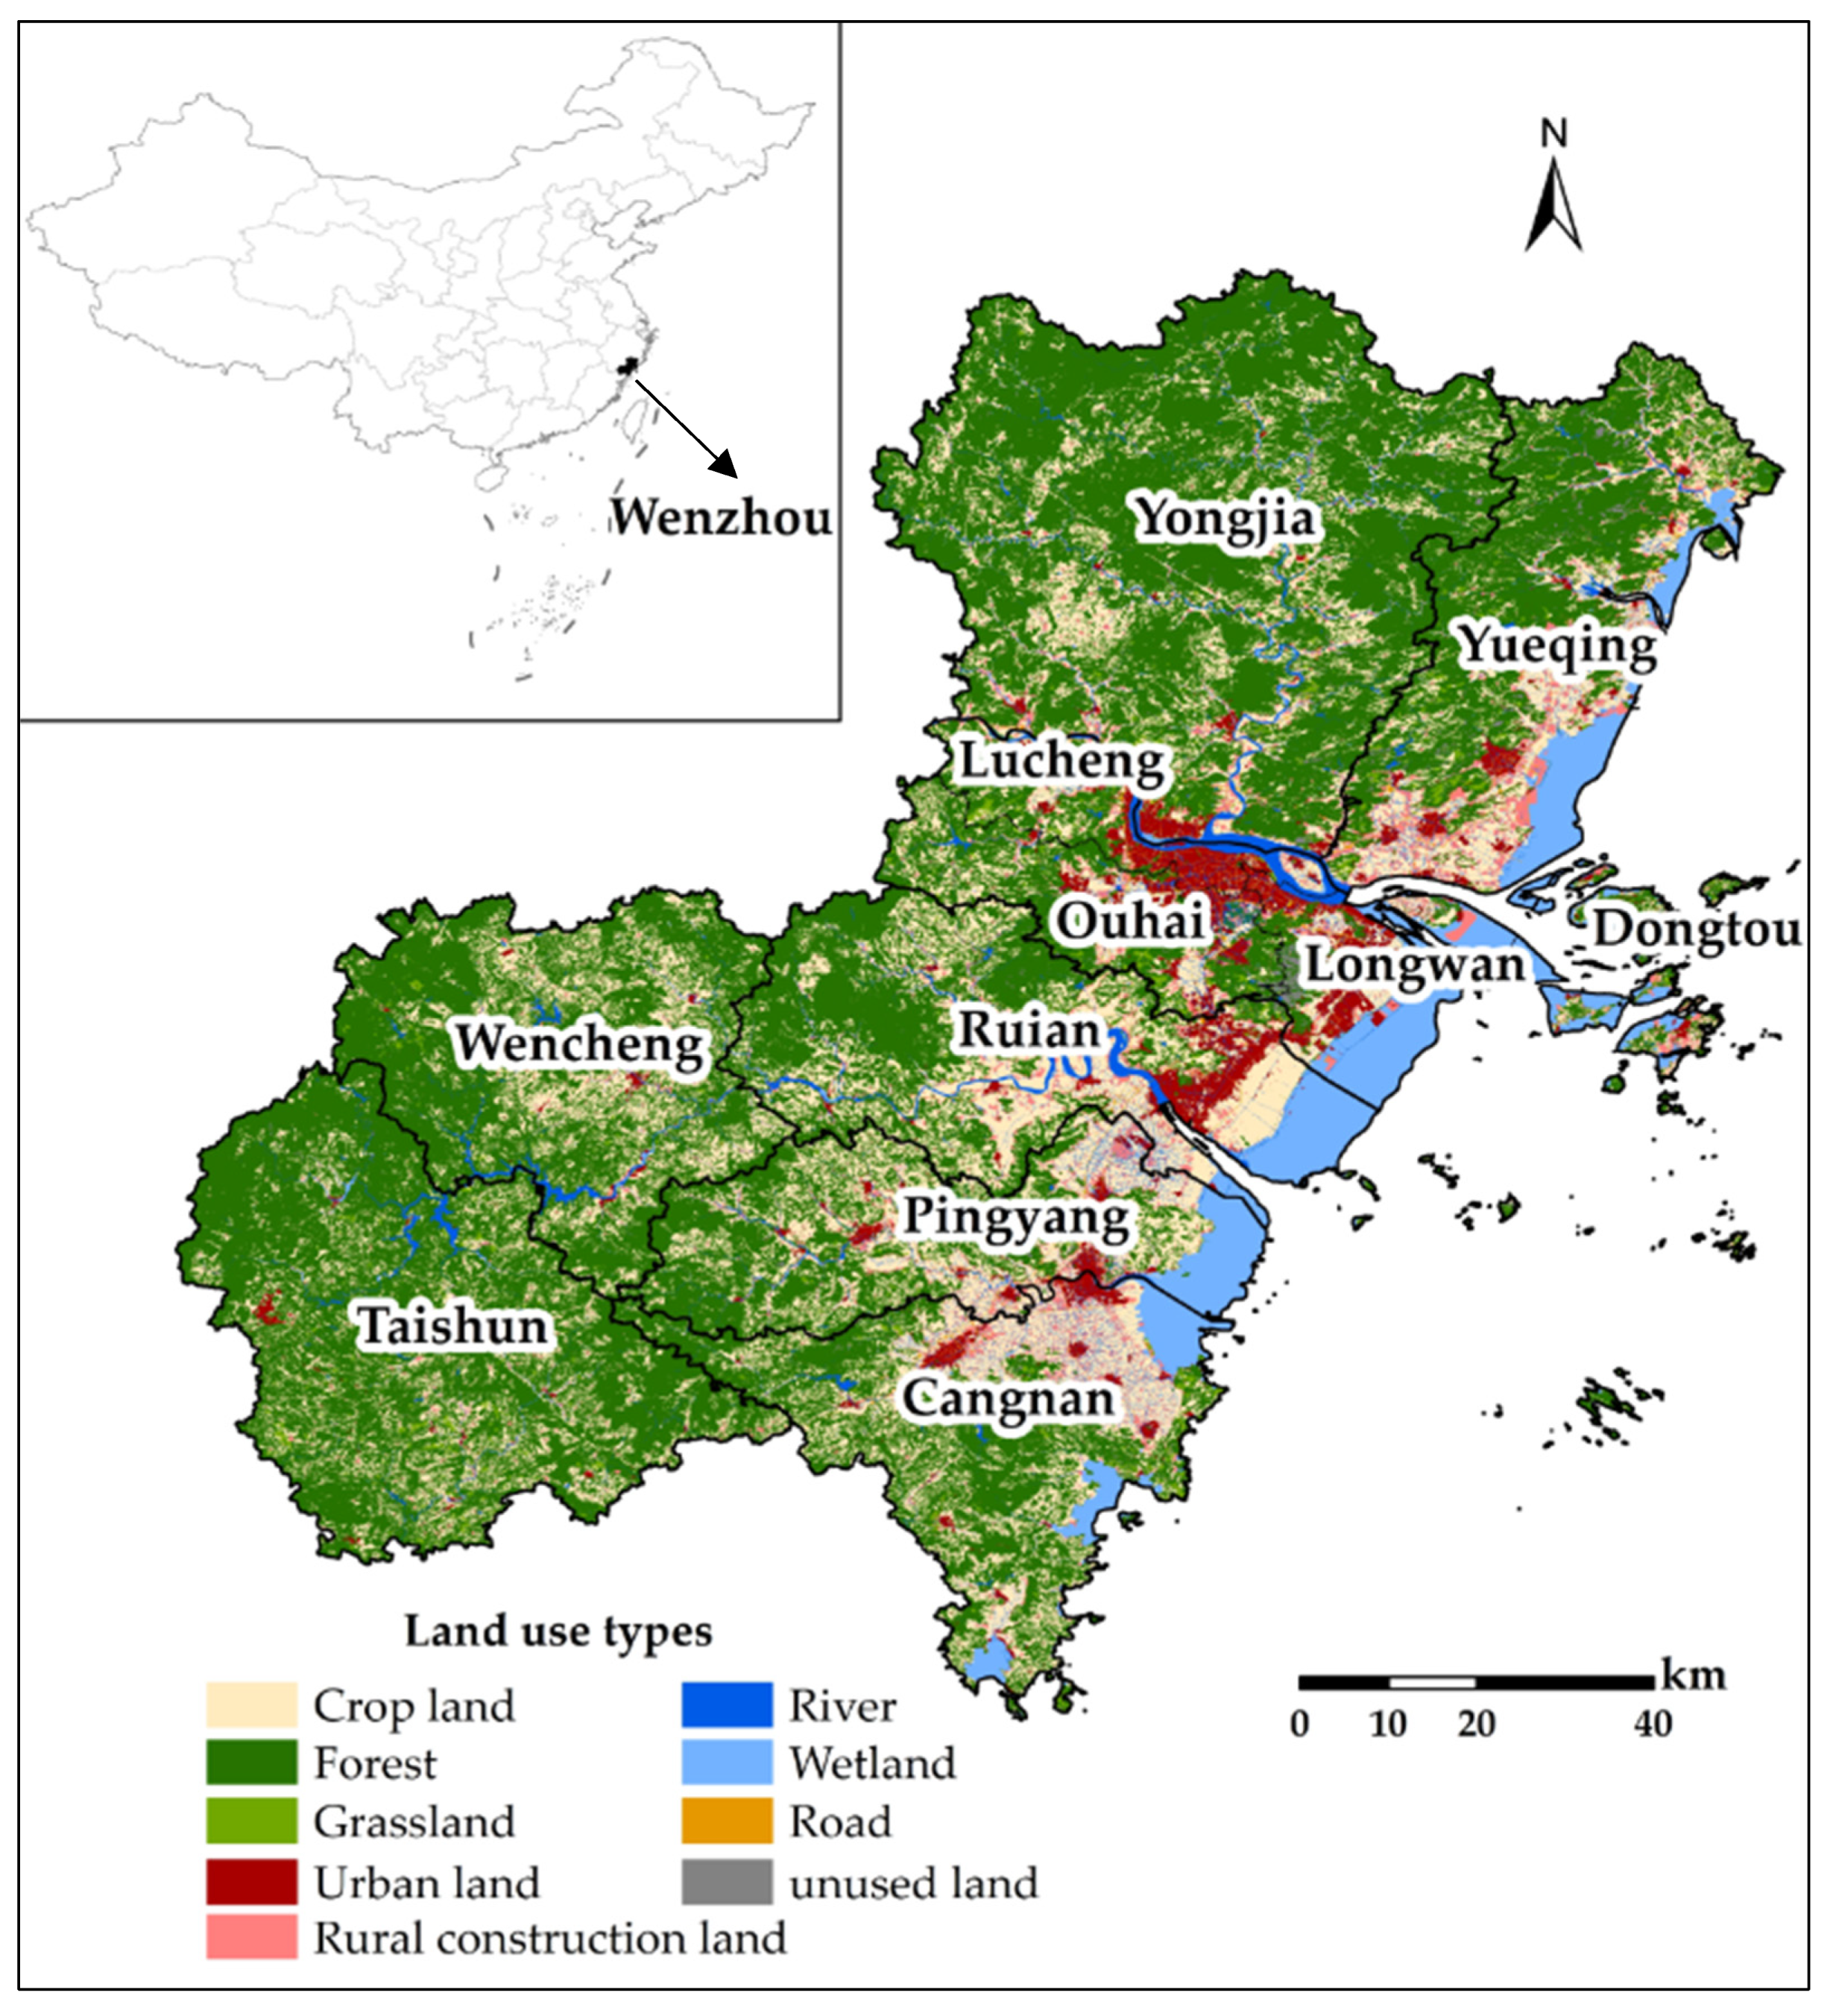
2.1. Study Area

Our study area is situated in a coastal region of southeastern China, covering a land area of 12,065 km2 (119°37′–121°16′ E and 27°2′–28°37′ N), and composed of 11 county-level districts, namely Lucheng, Longwan, Ouhai, Dongtou, Yueqing, Ruian, Yongjia, Pingyang, Cangnan, Wencheng, and Taishun. Furthermore, Lucheng, Longwan, Ouhai, and Dongtou constitute the municipal district (Figure 1). Wenzhou is dominated by mountains and hills, the area of which is 7057 km2 and 2331 km2, respectively, accounting for 58.49% and 19.32% of the total land area, while the plain area is only 2181 km2, accounting for 18.08% of the city’s land area. Therefore, farmland resources in Wenzhou are extremely limited, particularly high-quality arable land, most of which is located in the plain area and can easily be turned into construction land.
To implement the RCBF policy, many barren hills have been cultivated and a large amount of mud flats have been reclaimed in Wenzhou. As the data shows, from 1995 to 2005, approximately 110.98 km2 of arable land was transformed into construction land, and 110.73 km2 of new farmland was reclaimed, most of which was from barren hills, accounting for 83.98%, and from mud flats, accounting for 16.02% [37]. Furthermore, according to the results of the national reserved farmland resources survey in 2016, the amount of reserved farmland resources in Wenzhou is 23.33 km2, consisting mainly of coastal tidal land covering 13.33 km2, accounting for 57% of the total resources, and the inland tidal flat covering an area of 4.67 km2, accounting for 20%. As is well known, apart from the ecological damage, there are many other problems, such as low farmland quality, high cost, a long construction period and high technical difficulty, making it impossible for Wenzhou to achieve a balance of requisition and compensation for the quantity of farmland in the short-term.

2.2. Data Source and Processing

Vector data for land-use actuality (2010) with a scale of 1:10,000 were obtained from the Wenzhou Land and Resources Bureau. These land use data were extracted from yearly updating data based on the second national land investigation in China, which was conducted by the Ministry of Land Resources and local governments. The outcomes of the second national land investigation were interpreted using high-resolution remote sensing images and aerial photos with sub-meter spatial resolution, and they were then modified by an extensive field survey to improve accuracy. The land-use plan (2006–2020), the quality of the farmland, and farmland data that had already been consolidated before 2010 were also all provided by the Bureau of Wenzhou Land and Resources.
As mentioned, the timeframe of the local annual land-change survey database was 2010. However, the farmland gradation database was based on the 2011 land-change survey, which contained no information on the quality of the arable land that had been turned into construction land during the 2010–2011 period. To solve this problem, we first extracted patches of farmland without information on quality, and then assigned a gradation value, equal to that of the nearest known patch, to these patches.
Furthermore, data on the relationship between grain productivity and farmland gradation was derived from the survey, as well as an evaluation of the comprehensive production capacity of agricultural land in Zhejiang province, containing 448 agricultural land grading samples in southeast coastal areas. In addition, socio-economic statistical data were obtained from the Wenzhou Statistical Yearbook.

2.3. Methodology

2.3.1. Requisition Aspect: Loss of Potential Crop Production

Farmland is an irreplaceable resource in crop production, and its occupation for construction directly leads to the loss of potential crop production. Crop production is the product of the yield per unit area of farmland and its corresponding area [38]. The potential crop production referred to in this study is the current theoretical production capacity, which depends on two aspects, the area of farmland occupied by construction in a certain period and the quality of that area of farmland. The formula is as follows:
P R = S i × L i
where PR is the loss of potential crop production due to land occupation by construction; Si represents the area of farmland type i (i is the index of farmland utilization, a different i means a different quality of the farmland); and Li denotes the potential crop production per unit area of farmland type i.
According to the method of farmland gradation calculation and the Regulations of Agricultural Land Quality Classification [39], the index of farmland utilization (i) is the maximum annual output of standard grain converted from the designated crops in standard farming systems under the influence of natural conditions, local agricultural production technology, and farmland management, which most reflect the agricultural synthesis production capacity [39,40]. In view of this, the potential crop production per unit area of farmland depends on the value of the index of farmland utilization, and the relationship between these two variables that can be obtained using a sampling survey. The formula of Li based on i is as follows:
L i = c i + d
where c and d are the undetermined coefficients that can be obtained from the actual yield per unit area of sampled farmland and its corresponding type i.

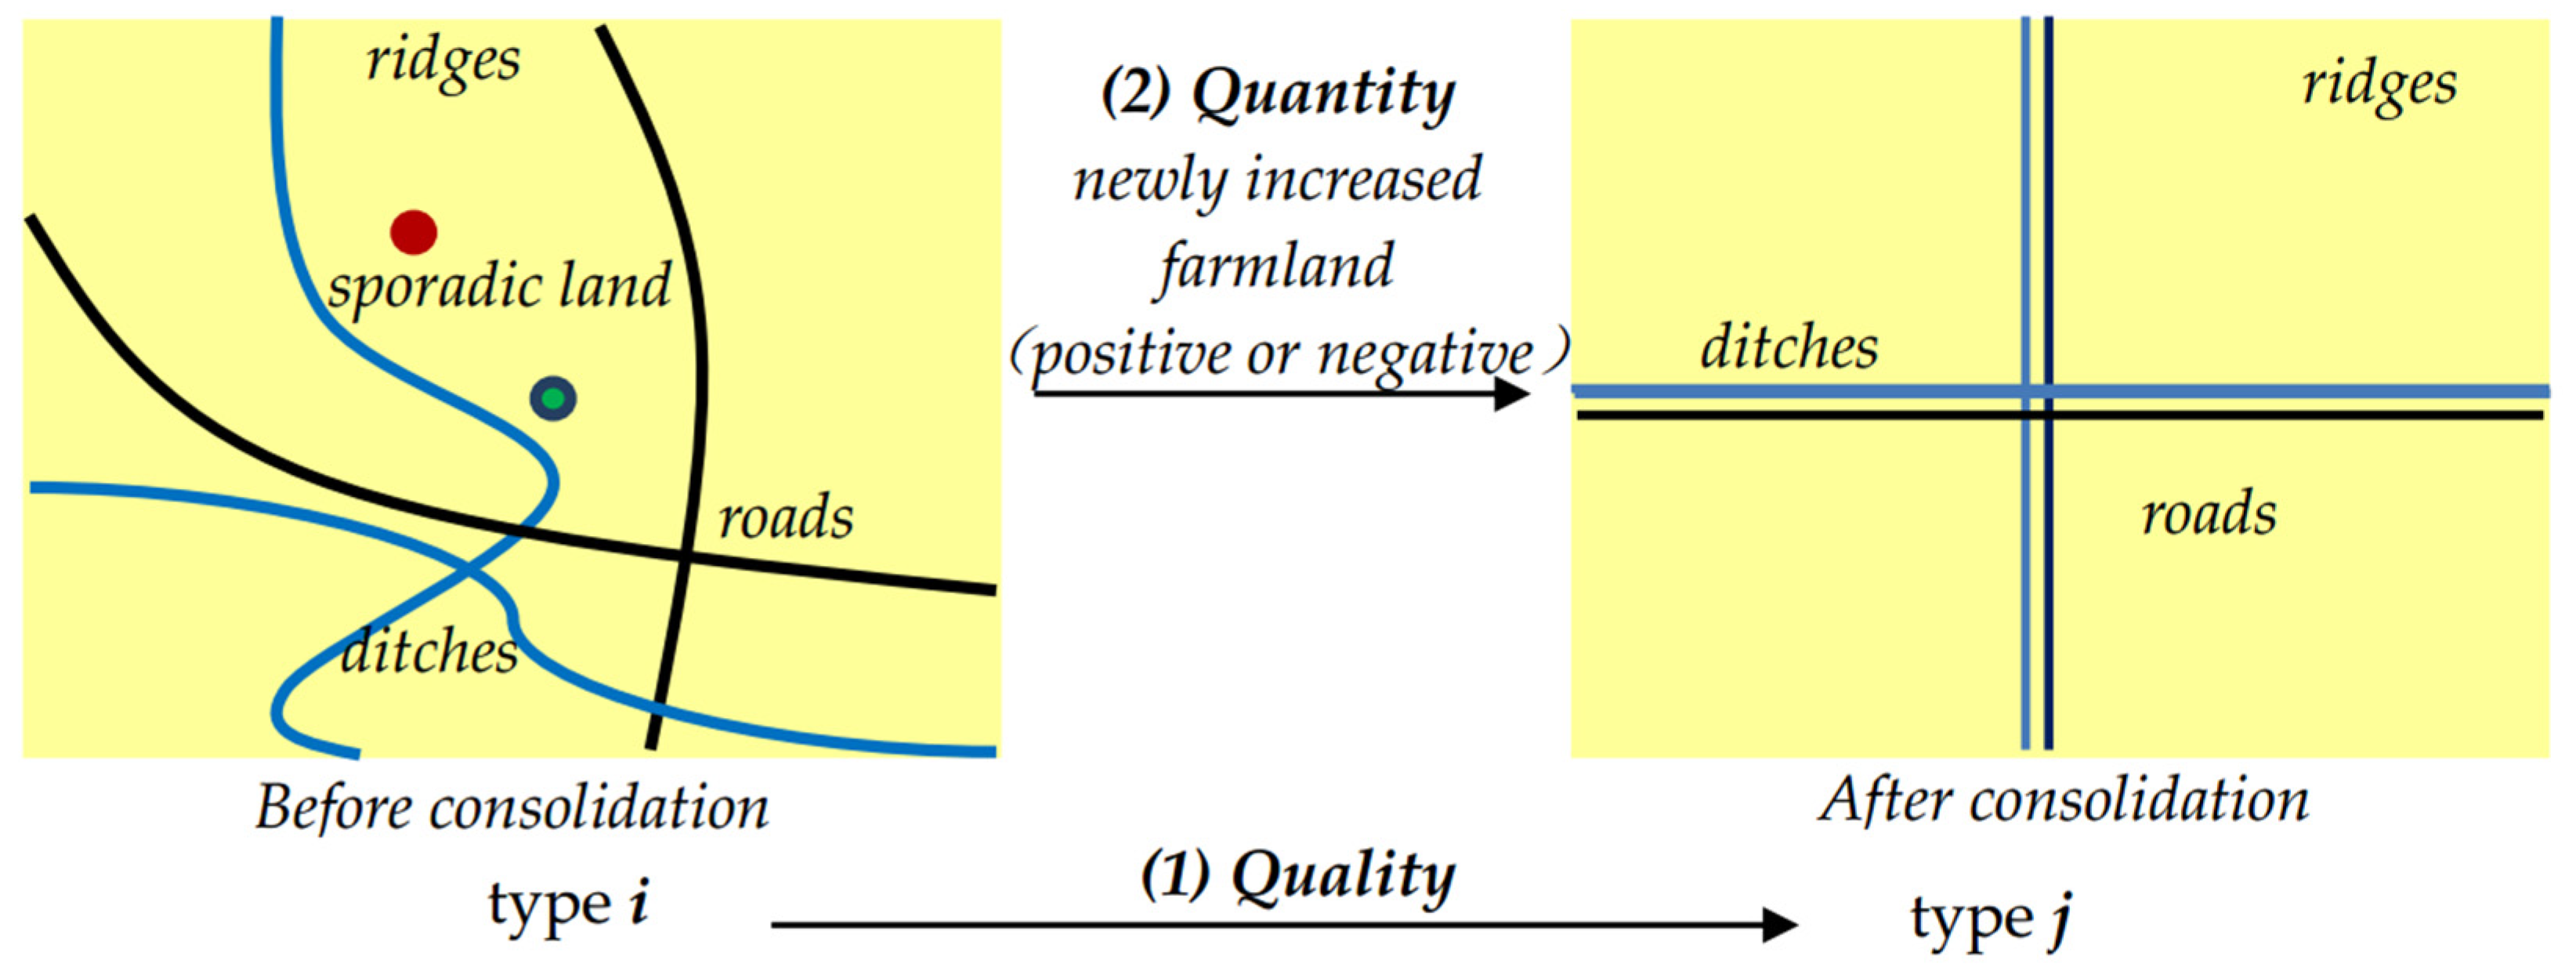
2.3.2. Compensation Aspect: Potential Crop Production That Could Be Added through Farmland Consolidation

The main ways to improve the quality of farmland include the construction of high-standard prime farmland, the transformation of medium-to-low yield farmland, irrigation and water conservancy projects, the improvement of farmland fertility projects, etc. By implementing these schemes, potential crop production will be increased for two reasons (Figure 2). Clearly, the first one is the enhancement of farmland quality, which is the outcome of the improvement of natural conditions such as field flatness and topsoil texture, as well as social and economic conditions such as input of production means and field management. The other reason is the newly increased farmland, coming after the arrangement of sporadic land features, and the comprehensive planning and design of rural roads, ridges, and ditches [41].
To measure the potential crop production that could be added through farmland consolidation, the farmland that needed to be consolidated in the planning period should be selected first, and then measure the added potential crop production from the two aspects of quality and quantity, respectively.
(1)
The Area of Farmland Intended to Be Consolidated
The area of farmland that is intended to be consolidated depends on the social and economic development of the county, the ecological environment, and the topography and landforms of the farmland. Firstly, driven by comparative interests, urban construction land will constantly erode the surrounding agricultural land. Thus, improving the quality of farmland within the boundary of urban growth will undeniably result in a wasted investment [42], so farmland intended to be consolidated should be out of the urban growth boundary. Secondly, as a semi-natural ecosystem, farmland influences and restricts the surrounding ecosystem and the social and economic system. The improvement of farmland quality is bound to bring disturbance to itself and to the surrounding ecosystems [43]. Therefore, areas of ecological restoration and ecological control should be avoided in the choice of farmland to be consolidated. Thirdly, based on economic benefits and social needs, the consolidation of farmland should be accompanied by an improvement of any narrow, scattered, and inefficient garden land, woodland, pits, ponds, and other agricultural land adjacent to the farmland, so as to achieve the goal of concentrated and contiguous farmland. Finally, farmland that has recently been consolidated and farmland with the highest utilization index should not be considered.
S d = S i z S i c S i p S i s S m y + S f
where Sd is the area of farmland that is intended to be consolidated; Siz represents the area of the i type of farmland in the region, where i is the index of farmland utilization; Sic denotes the area of the i type of farmland that is inside the urban growth boundary; Sip stands for the area of the i type of farmland with a high slope (more than 25 degrees); Sis is the area of the i type of farmland that is inside the ecological control area; Smy represents the area of farmland that has been consolidated recently with the highest grade in the region; and Sf stands for the area of fine (less than 500 m2) garden, woodland, or pond surface adjacent to, or interspersed with, the farmland to be consolidated.
(2)
Potential Crop Production to Be Added through Quality Improvement
As the formula shows, added potential crop production through farmland consolidation depends on the extent to which the farmland quality level can be improved, being determined by the current quality level of the farmland to be consolidated and the target quality level, as well as the farmland area. Based on dividing the research area into different regions of small areas, the highest farmland utilization index (j) of each region is taken as the corresponding target quality level:
P L = L j L i × S j i
where PL is the potential crop production that could be added via quality improvement; Lj stands for the target theoretical yield per unit of farmland, the type of which is j; Li represents the present theoretical yield per unit of farmland, the type of which is i; and Sji denotes the farmland area in which the type will be improved from i to j.
(3)
Potential Crop Production to Be Added through Quantity Increase
Added potential crop production due to the expansion of effective farmland depends on the area and the quality of the newly added farmland. The calculation formula is as follows:
P N = L j × S j a
where PN is the potential crop production that could be added via the expansion of effective farmland; Lj represents the target theoretical yield per unit of farmland, the type of which is j; and Sja denotes the area of newly increased farmland via land consolidation.
As we can see from Figure 2, the area of newly increased farmland depends on the actuality of the farmland to be improved and the target. Regarding the actuality, information about the area of rural roads, ridges, and ditches can be acquired from the database of local annual land-change surveys. For the target, based on the three different resources of newly increased farmland, we arranged things separately. We treated rural roads, ridges, and ditches as a whole and focused on the coefficient, which was equal to the total area of farmland, rural roads, ridges, and ditches divided by the total area of rural roads, ridges, and ditches. Since the distribution of rural roads, ridges, and ditches differs greatly between flat and sloping farmland, we thus used elevation and slope as the main factors for the partition of the farmland of each county, and divided the farmland into different regions. The target coefficient is that of the farmland with the highest farmland utilization index (j) for each region. With regard to the scattered features, all except those features with a special function should be a source of newly increased farmland, deducting the same target coefficient. The calculation of the area of newly increased farmland is as follows:
S j a = S d × S t / S d z + A l M l × 1 z + S f × 1 z
where Sja is the area of newly increased farmland via land consolidation; Sd stands for the area of farmland intended to be consolidated; St represents the total area of ridges, roads, and ditches spread on the farmland; z denotes the target coefficient; Al is the total area of scattered features (construction land less than 400 m2, garden area less than 600 m2, wooded area less than 1500 m2); Ml represents the area of scattered scenic spots and special land; and Sf stands for the area of fine (less than 500 m2) garden, woodland, and pond surface adjacent to, or interspersed with, the farmland that is planned to be consolidated.

2.3.3. Index of the Balance of Potential Crop Production

To reveal the relationship between the potential crop production that could be added through farmland consolidation and the loss of potential crop production in a certain plan period, we created a requisition–compensation balance index of potential crop production via farmland consolidation:
W = P L + P N P R × 100 %
where W is the requisition–compensation balance index of potential crop production via farmland consolidation; and PR stands for the loss of potential crop production due to land occupation by construction.
If W ≥ 1, the county can achieve the requisition–compensation balance of potential crop production via farmland consolidation. If W < 1, the county cannot achieve the requisition–compensation balance of potential crop production via farmland consolidation.

3. Results

3.1. Loss of Potential Crop Production Due to Occupation by Construction

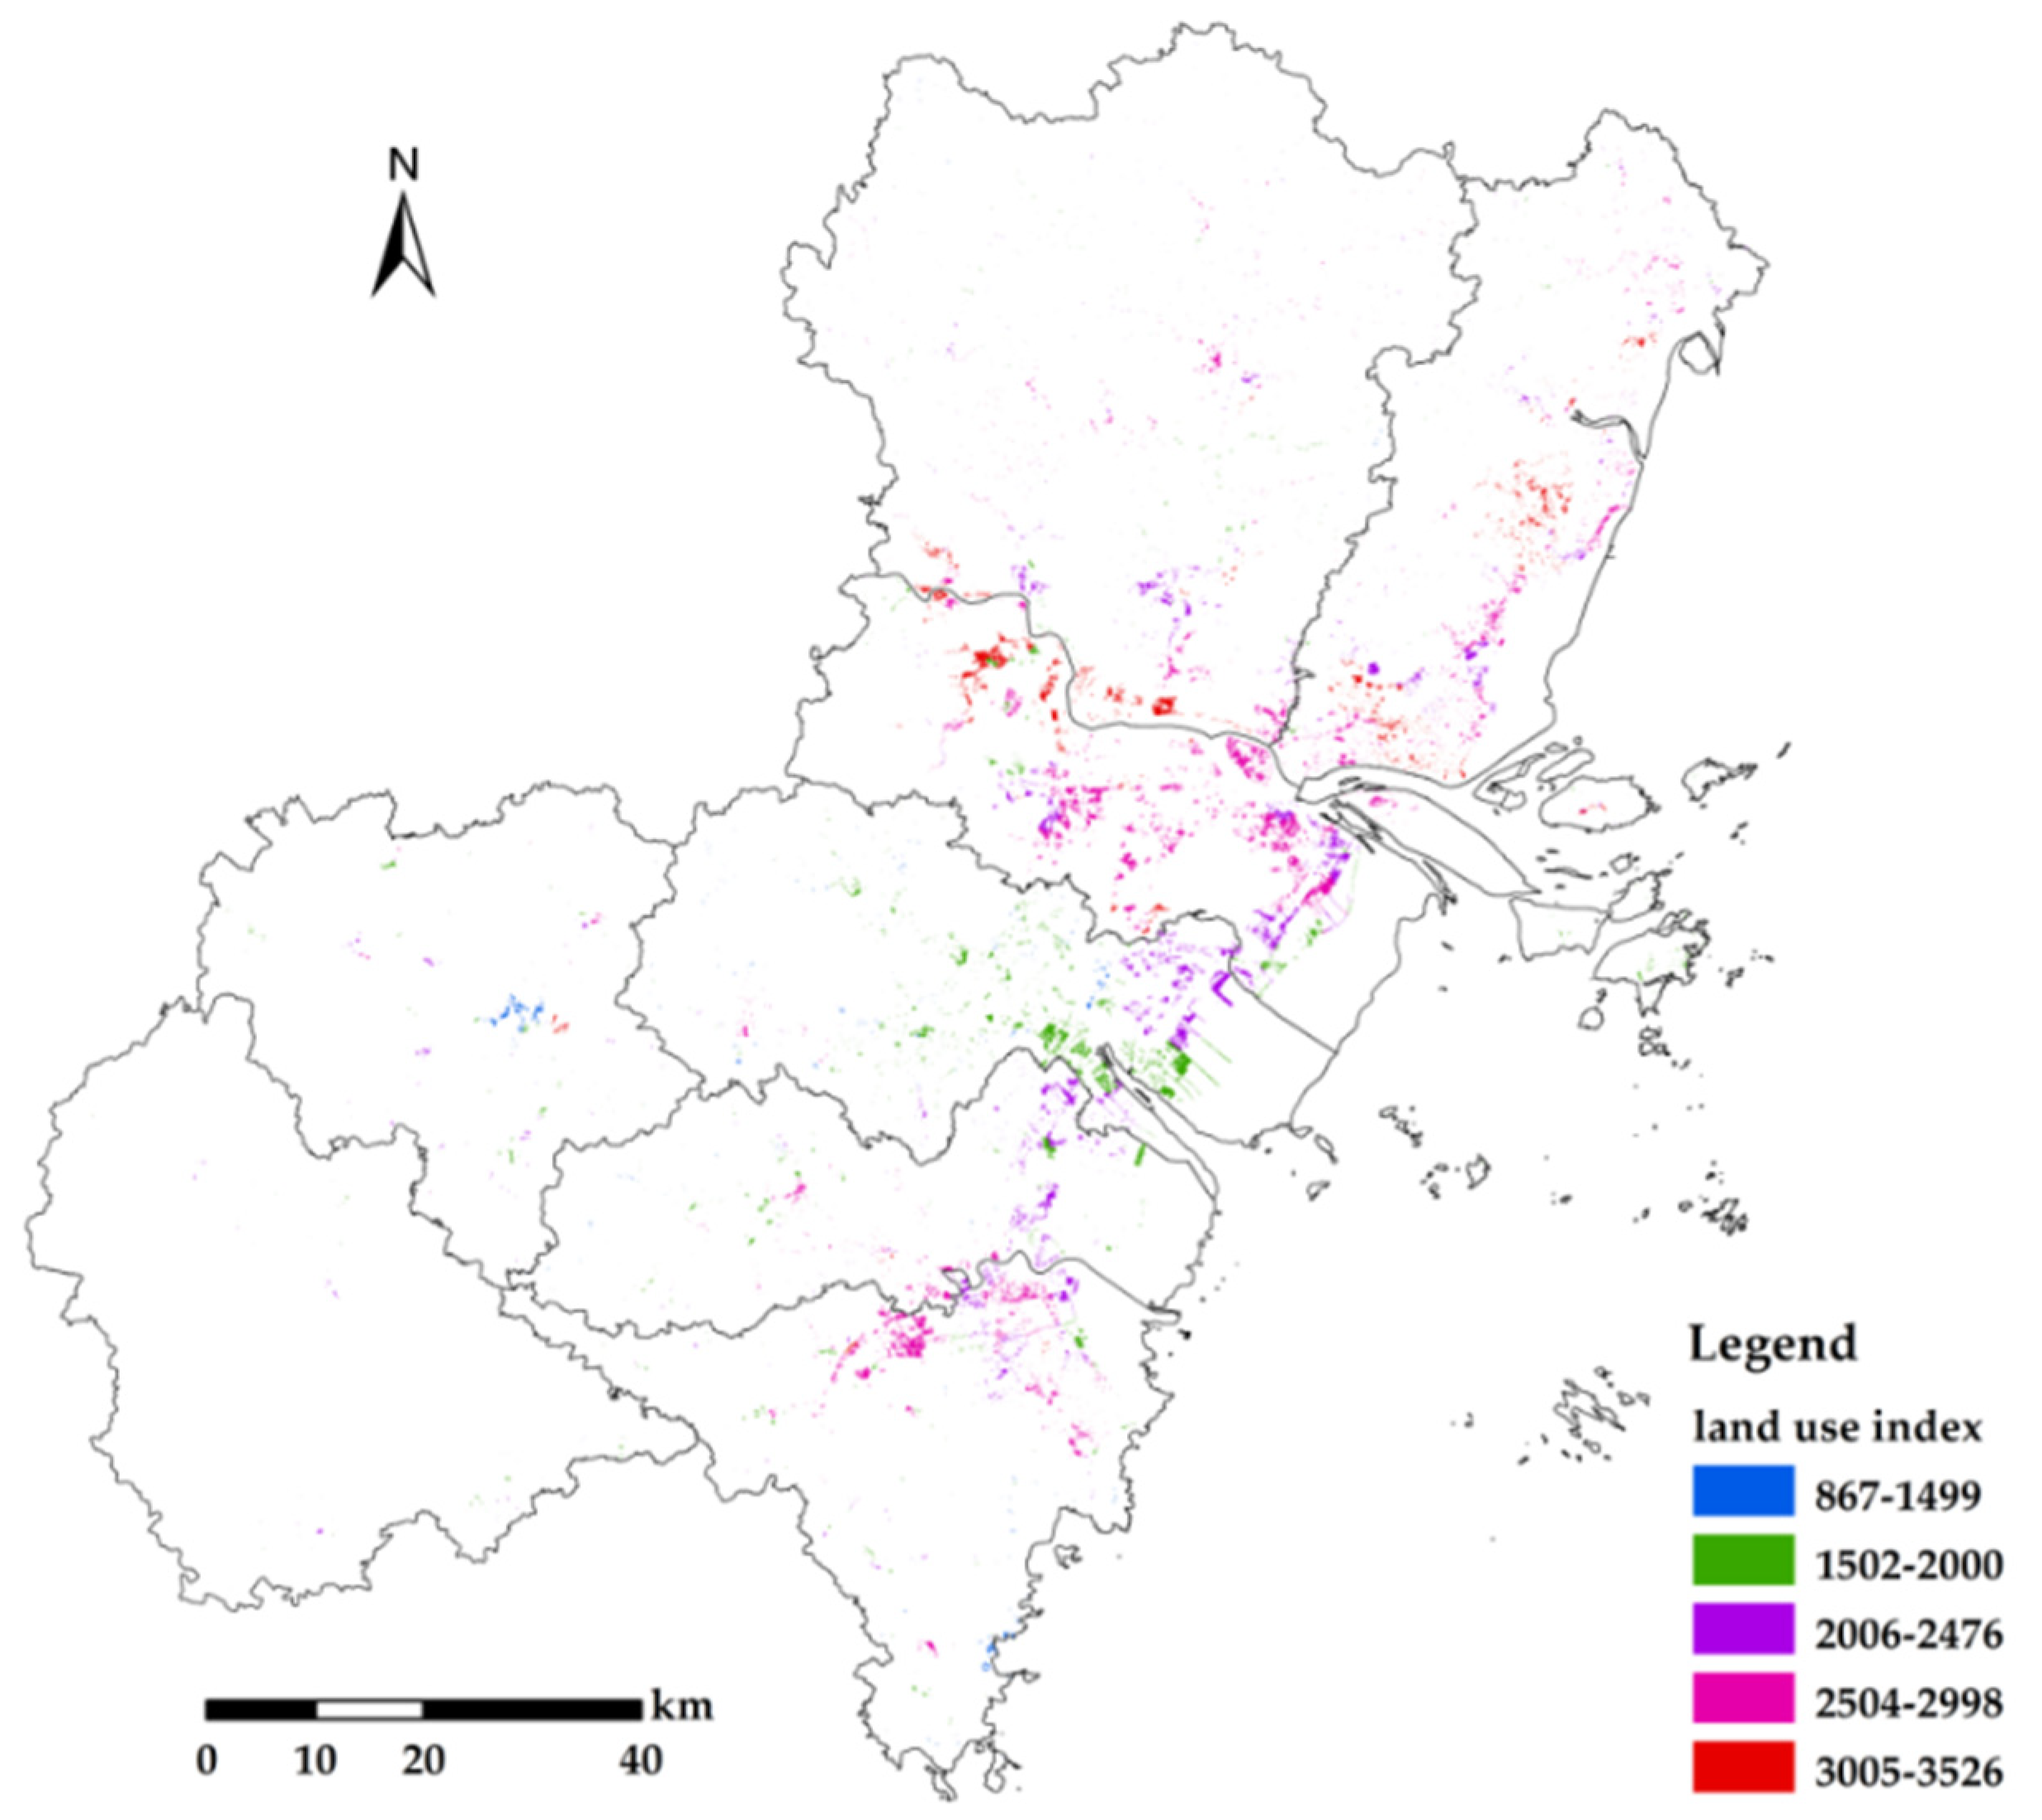
3.1.1. The Area and Quality of Farmland Occupied by Construction during the Planing Period

According to the land-use plan of Wenzhou city (2006–2020), the planned use for every piece of land throughout the city can be obtained. By comparing the land-use type of each piece of land in 2010 with the planned land-use type, it is possible to easily extract the farmland occupied by construction. Combining those pieces of farmland with the quality data, the area and quality of occupied farmland are established. As shown in Table 1 and Figure 3, the total area of farmland to be turned into construction land is 17,829.88 ha, and the land use index of the farmland is between 867 and 3526.

3.1.2. Loss of Potential Crop Production

According to the survey and evaluation of the comprehensive production capacity of farmland in Zhejiang province, containing 448 farmland grading samples in southeast coastal areas, we determined the relationship between potential crop production and farmland use index. In Formula (2), if c is 2.0391 and d is 9650.5, the result is: Li = 2.0391i + 9650.5. Calculated by the formula, the results of the loss of potential crop production are as shown in Table 1. From 2011 to 2020, the total amount of loss of potential crop production is 262,318,950 kg, and the municipal district accounts for the largest proportion, 32.04%. In addition, Ruian, Yueqing, and Cangnan also take up a large proportion at 16.79%, 15.50%, and 13.78%, respectively.

3.2. Supplement of Potential Crop Production Root in Farmland Consolidation

3.2.1. Regions of Farmland Consolidation and the Area of Farmland to Be Consolidated in Wenzhou City

Evidently, due to the differences in topography, soil, and management, it is impossible to increase the quality of all the farmland in a county to the same level, so it is more reasonable to divide the farmland of a county into different regions and setting different consolidation targets for each region. To set a consolidation target at the county level, three factors regarding the area in which the farmland is located should be considered: elevation, town, and slope [44]. The elevation and the slope of farmland are natural factors that affect farmland consolidation, and it is unreasonable to set the same consolidation target for two pieces of arable land that differ greatly in elevation or slope. The township where farmland is located is the economical factor; different towns have different levels of economic development, which supports the economic basis of farmland consolidation, leading to the difference in consolidation potential between farmland located in different towns.
Based on the topography of Wenzhou city and the status of the farmland intended to be consolidated, we divided the elevation of Wenzhou into five grades: e ≤ 50 m, 50 m < e ≤ 300 m, 300 m < e ≤ 500 m, 500 m < e ≤ 800 m, and e > 800 m. According to the classification standard of cultivated land slope in China, the slope is divided into two categories: flat farmland (s ≤ 2°) and slope farmland (s > 2°). According to the above partition logic, farmland of a township in Wenzhou can be divided into a maximum of ten categories. Combined with Formula (3), we extracted the farmland to be consolidated in each region of Wenzhou city. In total, there are 497 regions of farmland consolidation in Wenzhou, and the total area of farmland to be consolidated is 194,593.77 ha, accounting for 68.73% of the total area of farmland in Wenzhou city (Table 2).

3.2.2. Targets of Farmland Consolidation in Wenzhou City

As mentioned above, farmland consolidation can improve the quality of farmland on one hand and increase the effective area of farmland on the other. Therefore, targets of farmland consolidation contain two aspects.
In terms of quality, the highest index of farmland utilization that can be achieved in each region of farmland consolidation is taken as the quality target. As we mentioned above, the higher the farmland utilization index, the better the soil quality. Take a region of farmland consolidation in Shuitou Town, Pingyang County as an example: after farmland consolidation, the soil organic matter content will increase from 2% to more than 3% and the irrigation guarantee rate will be raised from 30% to over 70%. In terms of the increase of effective area of farmland, the target coefficient (z) depends on three factors: elevation, slope, and the farmland that has been consolidated. The farmland that has been consolidated is classified into different groups using elevation and slope, and the land occupation coefficient of the total area of roads, ridges, and ditches of each group is taken as the target coefficient (z) of the farmland to be consolidated under the corresponding elevation and slope.

3.2.3. Supplement of Potential Crop Production by the Enhancement of Farmland Quality and the Increase of the Effective Area of Farmland

According to Formula (4), Formula (2) (Li = 2.0391i + 9650.5), and the land consolidation quality targets, we can easily measure the supplement of potential crop production by the enhancement of farmland quality in each county of Wenzhou city from 2011 to 2020. The total amount of the supplement of potential crop production by the enhancement of farmland quality in Wenzhou city is 150,051,780 kg, with Cangnan county and Yongjia county accounting for the highest proportion at 18.31% and 16.60%, respectively (Table 3).
According to Formula (6) and the target coefficient (z) of the farmland to be consolidated under the corresponding elevation and slope, we can measure the increase of effective area of farmland derived from the reduction in the coefficient of total area of roads, ridges, and ditches, and the adjustment of the scattered garden, woodland, and water surface of potholes and ponds around the farmland to be consolidated. From 2011 to 2020, the potential of the total area of newly increased farmland via farmland consolidation in Wenzhou city is 3355.77 ha, with Yongjia, Wencheng, and Taishun taking up a large proportion at 26.25%, 22.09%, and 18.76%, respectively (Table 3).
According to Formula (5), Formula (2), and Formula (6), the potential crop production supplemented by newly increased farmland in the process of improving the quality of farmland in each region was obtained, then merged according to the administrative regions, with the data of each county in Wenzhou city finally derived. The total amount of potential crop production supplemented by newly increased farmland in the process of improving the quality of farmland in Wenzhou city is 49,322,220 kg, with Yongjia county and Wencheng county accounting for the highest proportion at 27.06% and 22.33%, respectively (Table 3), while Pingyang county accounted for the lowest proportion at only 0.96%.

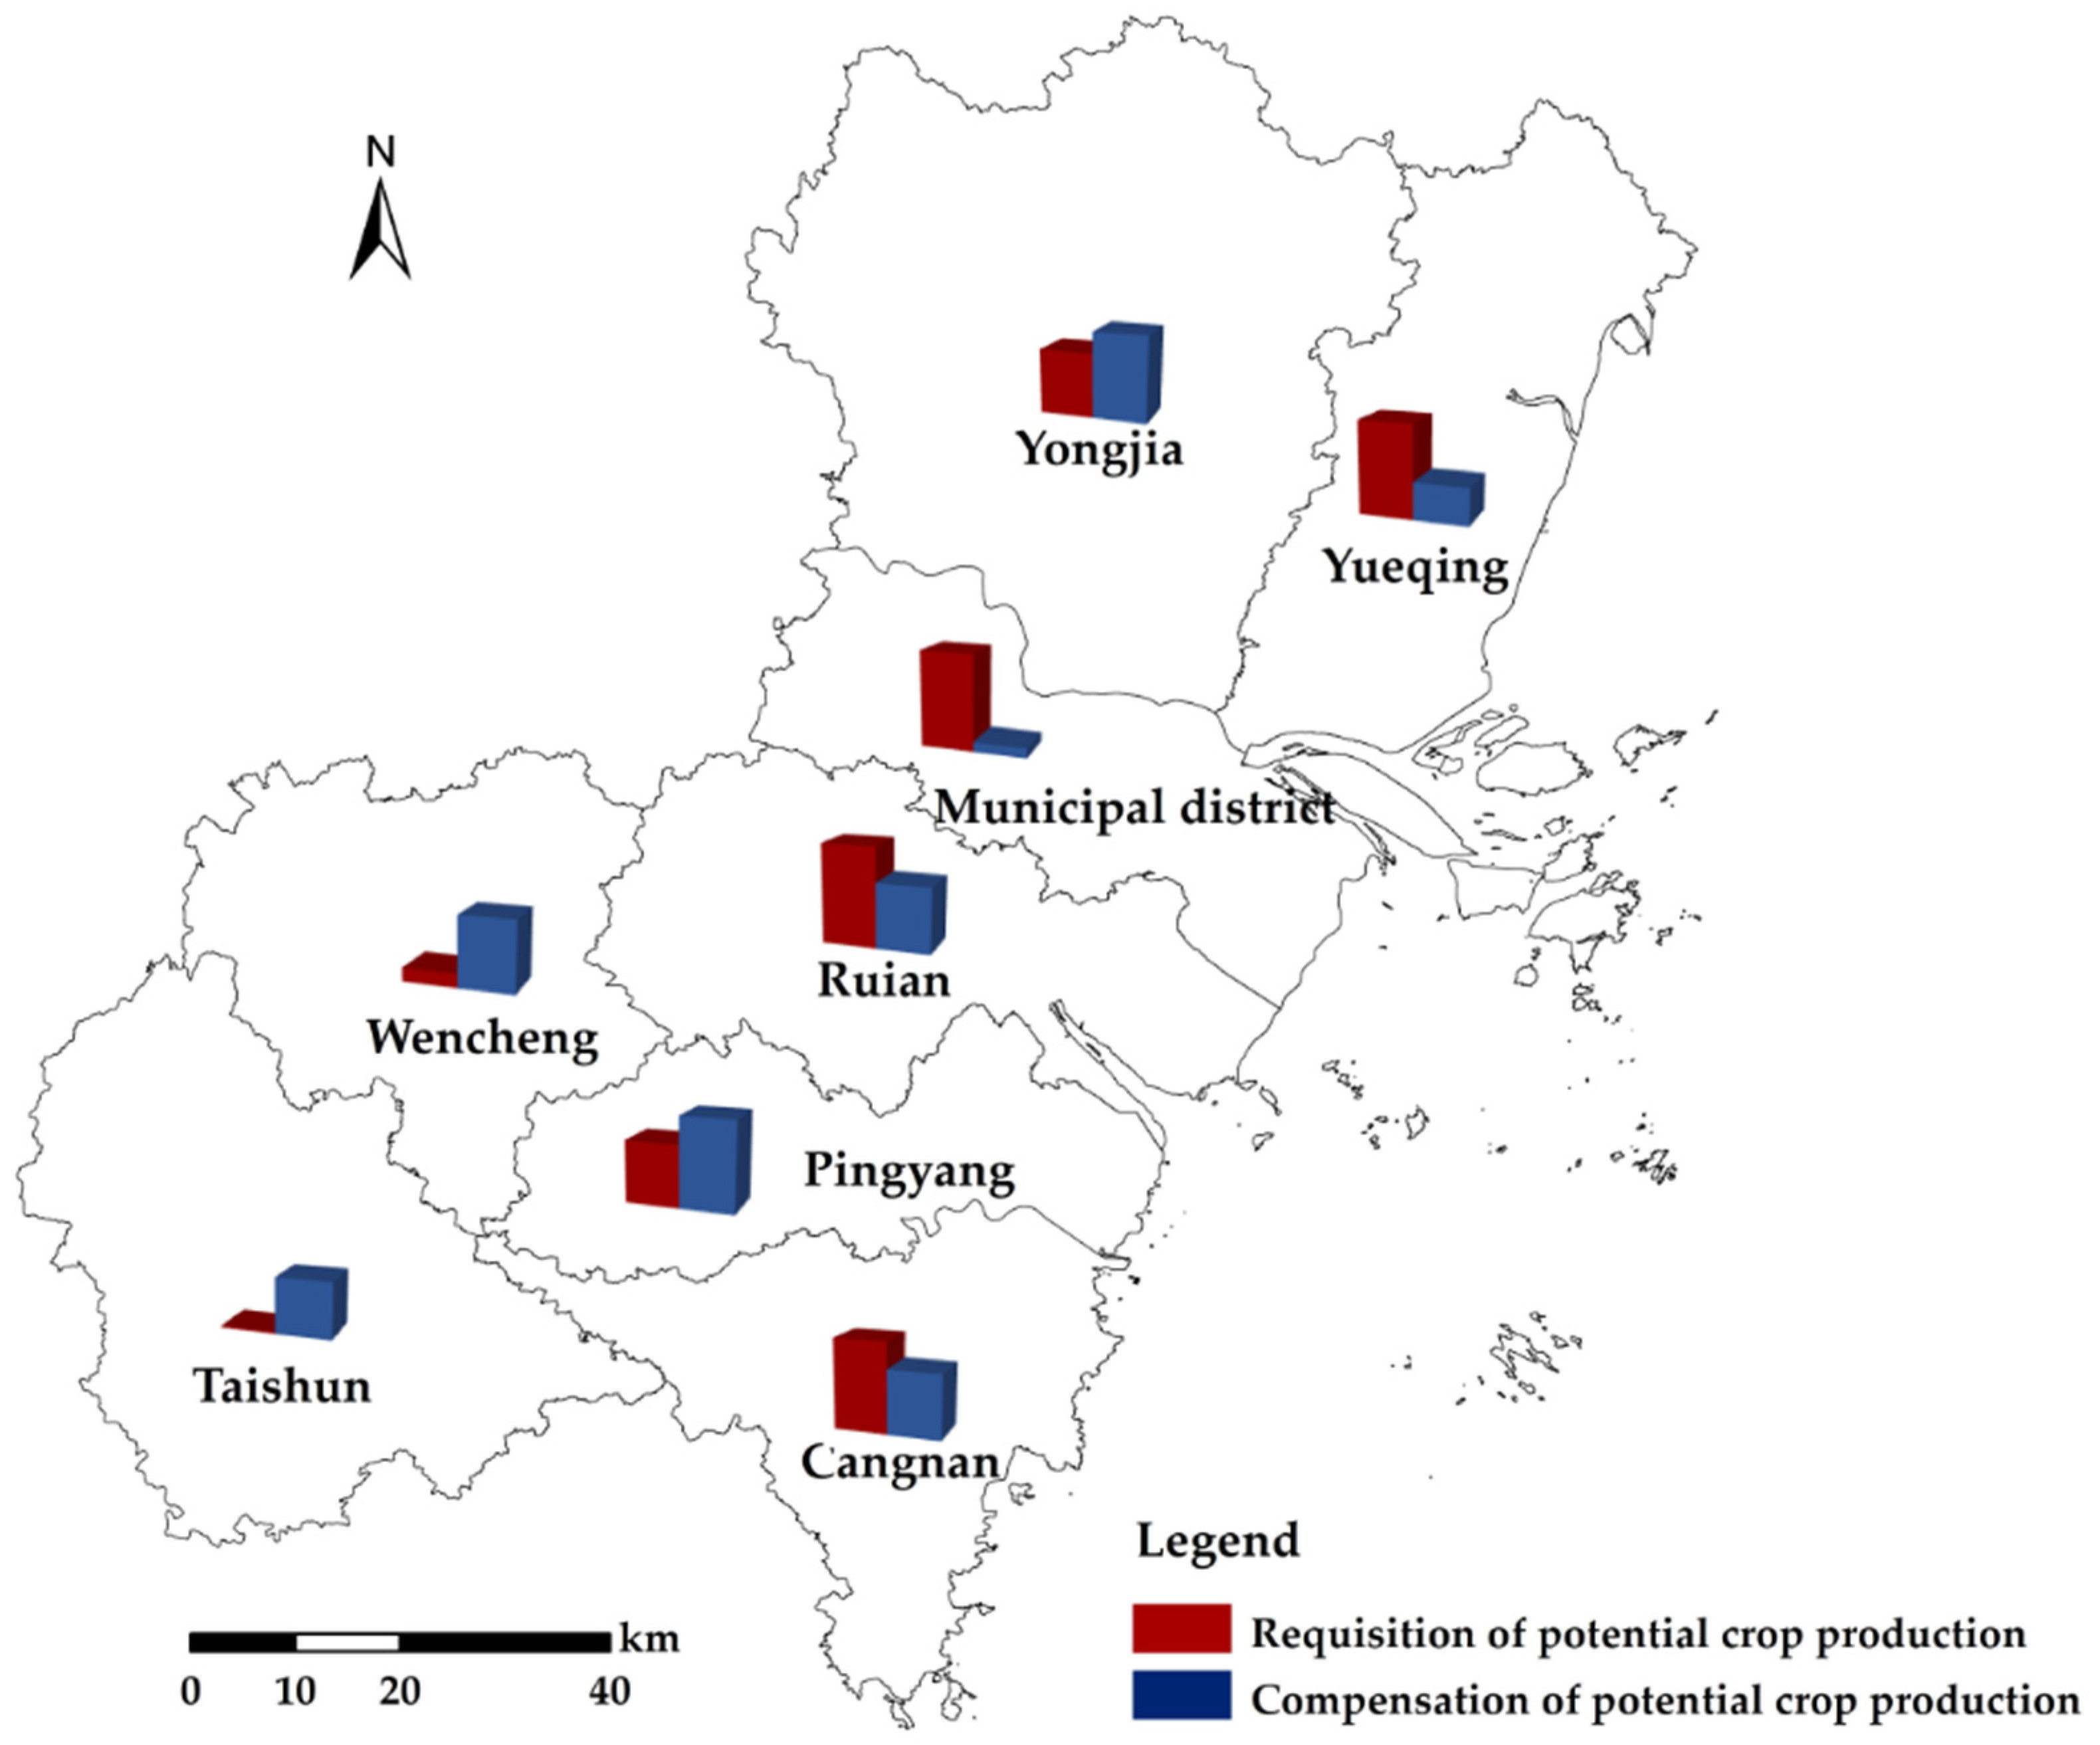
3.3. Index of the Balance of Loss and Supplement of Potential Crop Production

In terms of Wenzhou city as a whole, the total amount of loss of potential crop production due to the occupation of construction from 2011 to 2020 is 262,318,950 kg, while the supplement of potential crop production due to farmland consolidation is 199,374,000 kg, the latter accounting for 76.00% of the former, less than 100% (Table 4). That is, the requisition–compensation balance of potential crop production in Wenzhou city cannot be realized only by farmland consolidation based on the current economic and technological level. In addition, the total supplement of potential crop production due to farmland consolidation in Wenzhou city is 199,374,000 kg, with the enhancement of farmland quality contributing 75.26% and newly increased farmland contributing 24.74%.
In terms of the difference between counties in Wenzhou city, there are huge differences (Table 4 and Figure 4). The index of the balance of potential crop production in Taishun, Wencheng, Yongjia, and Pingyang is greater than one, up to 2866.67% in Taishun. However, the index of the balance of potential crop production in Yueqing, Ruian, and Cangnan is below zero, with values as low as 40.04%.

4. Discussion

4.1. Interpretation of the Findings

This study has shown that Wenzhou city as a whole cannot achieve that balance, with the potential index of the balance of potential crop production being 76.00%, less than 100%.
However, there is a significant negative correlation between GDP and the index of the balance of potential crop production of each county in Wenzhou city (Figure 5). The index of the balance of potential crop production varies greatly among counties, being more than 100% in Taishun, Wencheng, Yongjia, and Pingyang, and less than 100% in Yueqing, Ruian, and Cangnan; that is, the more developed the county, the lower the potential to achieve a requisition–compensation balance. This result is consistent with previous studies, that the peripheral counties of major cities and counties along the major traffic routes are more difficult to achieve the balance of requisition and compensation of farmland than that in the mountainous areas [17]. The reasons for this phenomenon can be explained from two perspectives. From the aspect of requisition, many studies have shown that the faster the county economy develops, the faster the construction land expands, and the more cultivated land is occupied, most of which is usually the high-quality cultivated land around the city [1,2,29,45]. From the compensation aspect, in the regions with rapid economic development, the terrain is relatively flat, the quality of the cultivated land is relatively high, and the potential of supplementing potential crop production through quality improvement is relatively small. Comparatively speaking, the amount of farmland occupied in underdeveloped counties is less, where the potential of compensating potential crop production is larger.
Additionally, with the increase in elevation, the potential of increasing potential crop production shows an inverted U-shaped curve (Figure 6). When the elevation is between 50 m and 500 m, the potential of supplementing potential crop production through farmland quality improvement is the greatest. We can interpret this phenomenon from the following two perspectives. First, farmland with an elevation of less than 50 m usually has a higher quality level (land-use index), and the gap between it and the target of farmland consolidation is very small. As a result, the potential of increasing potential crop production is relatively low. Furthermore, the farmland consolidation in flat areas usually requires the construction of field roads and ditches, which will occupy part of the existing farmland, and could even lead to the area of newly increased farmland becoming less than zero. As mentioned above, the total amount of newly increased farmland in townships with an elevation of less than 50 m in Pingyang county is −37.04 ha (Table 3). Second, regarding farmland with an elevation of more than 500 m, the farmland consolidation target is relatively low, and the gap between the current situation and the farmland consolidation target is narrow. These results are similar to those obtained in previous studies, and elevation is often regarded as one of the important indicators of farmland consolidation [44,46]. According to the above results, for Wenzhou, the medium-productivity farmland is mainly distributed at the elevation of 50–500 m, which has a relatively high potential of increasing potential crop production. Jiang et al. also affirm that medium-productivity farmlands should be the key target for implementing land consolidation projects [44].
More importantly, as shown in Table 4, except for the Municipal district, the potential indexes of the balance of potential crop production of the counties in Wenzhou are all more than 40%. Our results confirm earlier viewpoints presented in [1,32,44] which show that the quality improvement of medium- and low-yield fields has a huge effect on increasing potential crop production. On top of that, these findings also clearly show the extent of the impact. The fundamental goal of farmland protection policies is to ensure national food security, which depends not only on the quantity of farmland, but also on the quality of farmland and its utilization [47,48,49,50]. Foley et al. affirm that the best way to simultaneously maintain global food security and ecological integrity is to increase the productivity potential of existing cultivated land resources [51]. Many previous studies have advocated halting the massive reclamation of new farmland and instead focusing on improving the quality of existing farmland to achieve a requisition–compensation balance of potential crop production [1,23,25,27,28,31]. However, few studies have focused on the extent to which a balance of potential crop production can be achieved only through farmland consolidation [52]. Therefore, the work here bridges the gap in research by providing a theoretical and practical reference for the adjustment of RCBF policy and farmland protection in China.

4.2. Policy Implications

To enhance the sustainable utilization of farmland resources and to implement the RCBF policy in economically developed counties wisely, we propose the following recommendations for policymakers based on the findings of this study:
(1)
Expand sources of built-up land supply and improve its efficiency. Regarding rapid economic development, it is assumed that the loss of farmland resources has become an inevitable result of urbanization, especially for the farmland with lower elevation and that slope around the city [2]. According to this study, it is impossible to achieve the balance of potential crop production merely through farmland consolidation for the economically developed counties. Therefore, reducing the occupation of farmland is important and necessary. In practice, however, there are ways to reduce the occupation of farmland that are worthy of attention. With regard to the rapid economic development of southern mountainous areas, to reduce the occupation of farmland for urban development in this area, the central government in China has implemented pilot projects for the development of sloping land in some regions since 2006. In 2011, it published the “Guidance on Comprehensive Development and Urbanization of Low-slope Hilly Areas” to promote urban build-up on land uphill and preserve high-quality farmland. This measure has played a significant role in preserving farmland in southern mountainous areas [6,53,54]. Unfortunately, this proposal has not been adequately implemented, due to considerations of ecological sensitivity, risks of geological disaster, and the cost of developing sloping land. According to this study, loss of potential crop production due to occupation by construction in Wenzhou city is high, and the government should consider the development of sloping land based on a comprehensive evaluation of resources, environmental carrying capacity, and suitability for the development of territorial space. In addition, improving the utilization efficiency of existing construction land to reduce the newly increased construction land area would be of benefit, and this can be implemented by revitalizing idle rural residential land, improving the utilization efficiency of urban inefficient industrial land, and strengthening the utilization level of urban underground spaces.
(2)
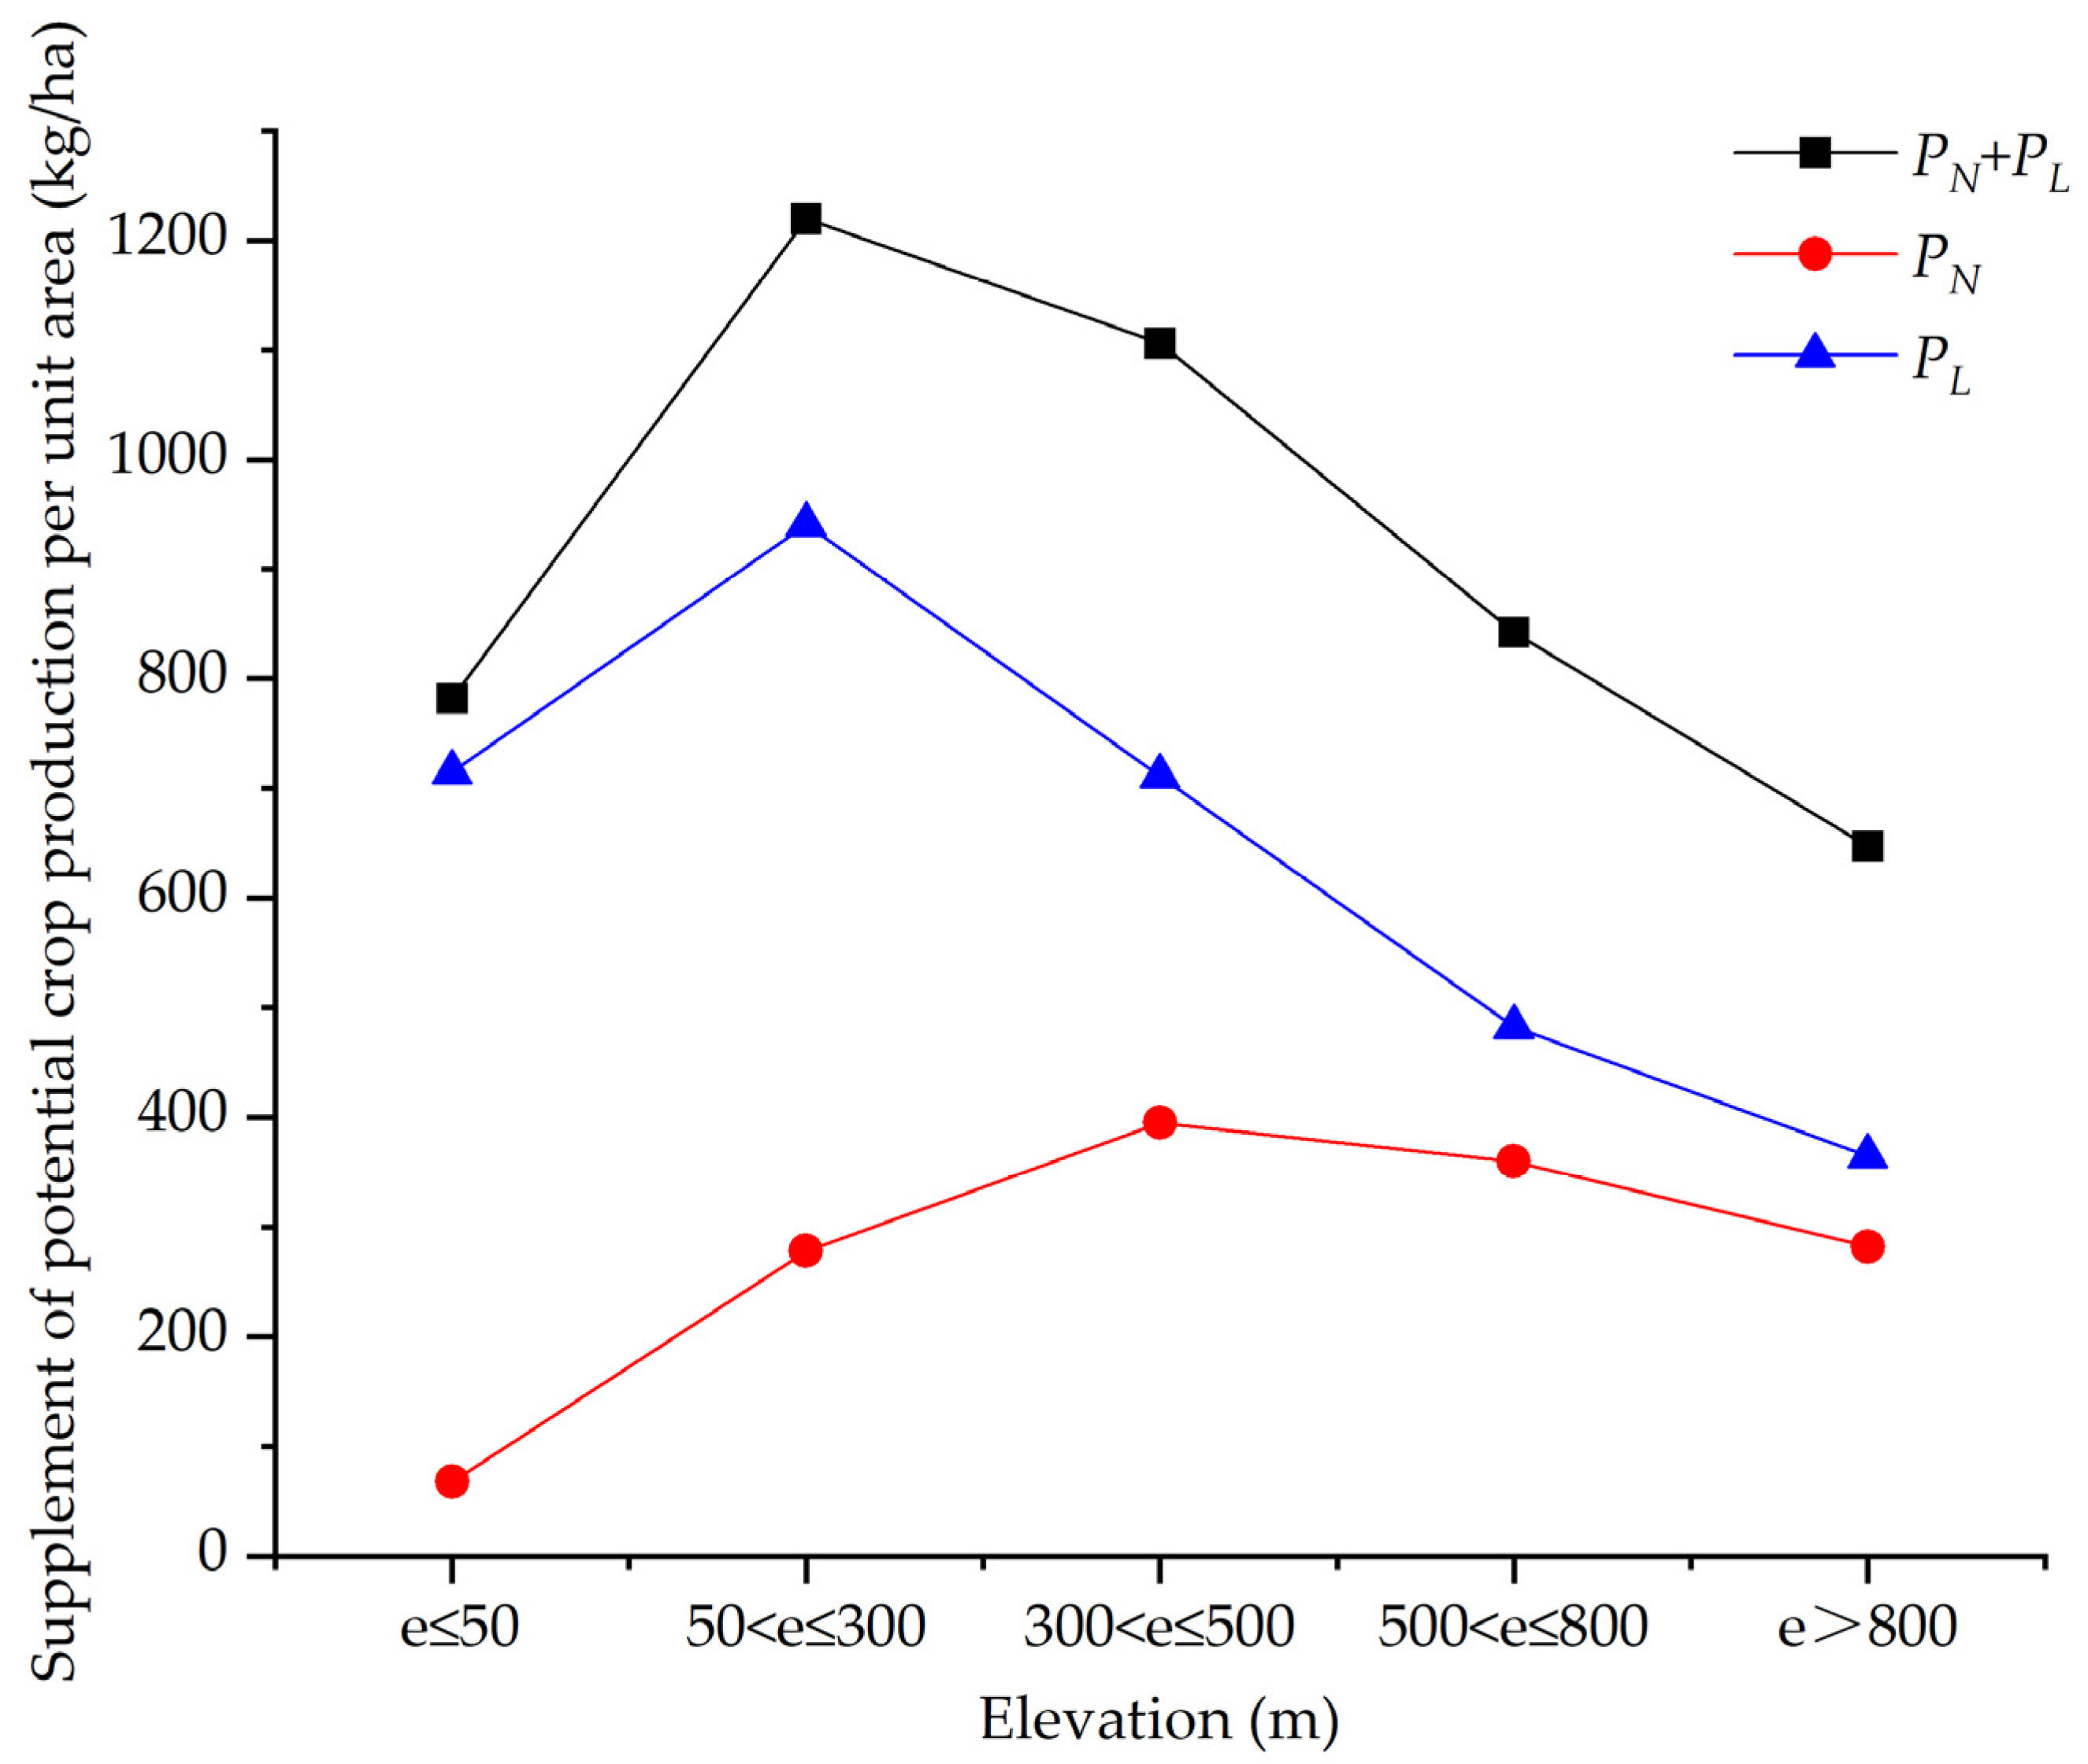
The potential to increase crop production through the quality improvement of farmland should be taken seriously. According to this study, although a balance of potential crop production can only be achieved through the quality improvement of farmland in economically developed counties, the amount of potential crop production that is added through the quality improvement of farmland is still relatively large, reaching more than 40% of the losses, and for Wenzhou city as a whole, the figure reached 76% (Table 4). That is, the potential to increase crop production through quality improvement of farmland is noteworthy and should be the focus. It is especially important for economically developed counties with a severe shortage of reserve farmland that cannot compensate for newly reclaimed farmland. Against the background of 40–46 million hectares of medium-to-low-yield farmland [32], we believe that the core of farmland protection policies lies in protecting farmland resources and improving the quality of the existing farmland, to ultimately ensure national food security. Additionally, according to this study, more attention should be paid to farmland with an elevation of between 50 m and 500 m in economically developed counties along the east coast of China.
(3)
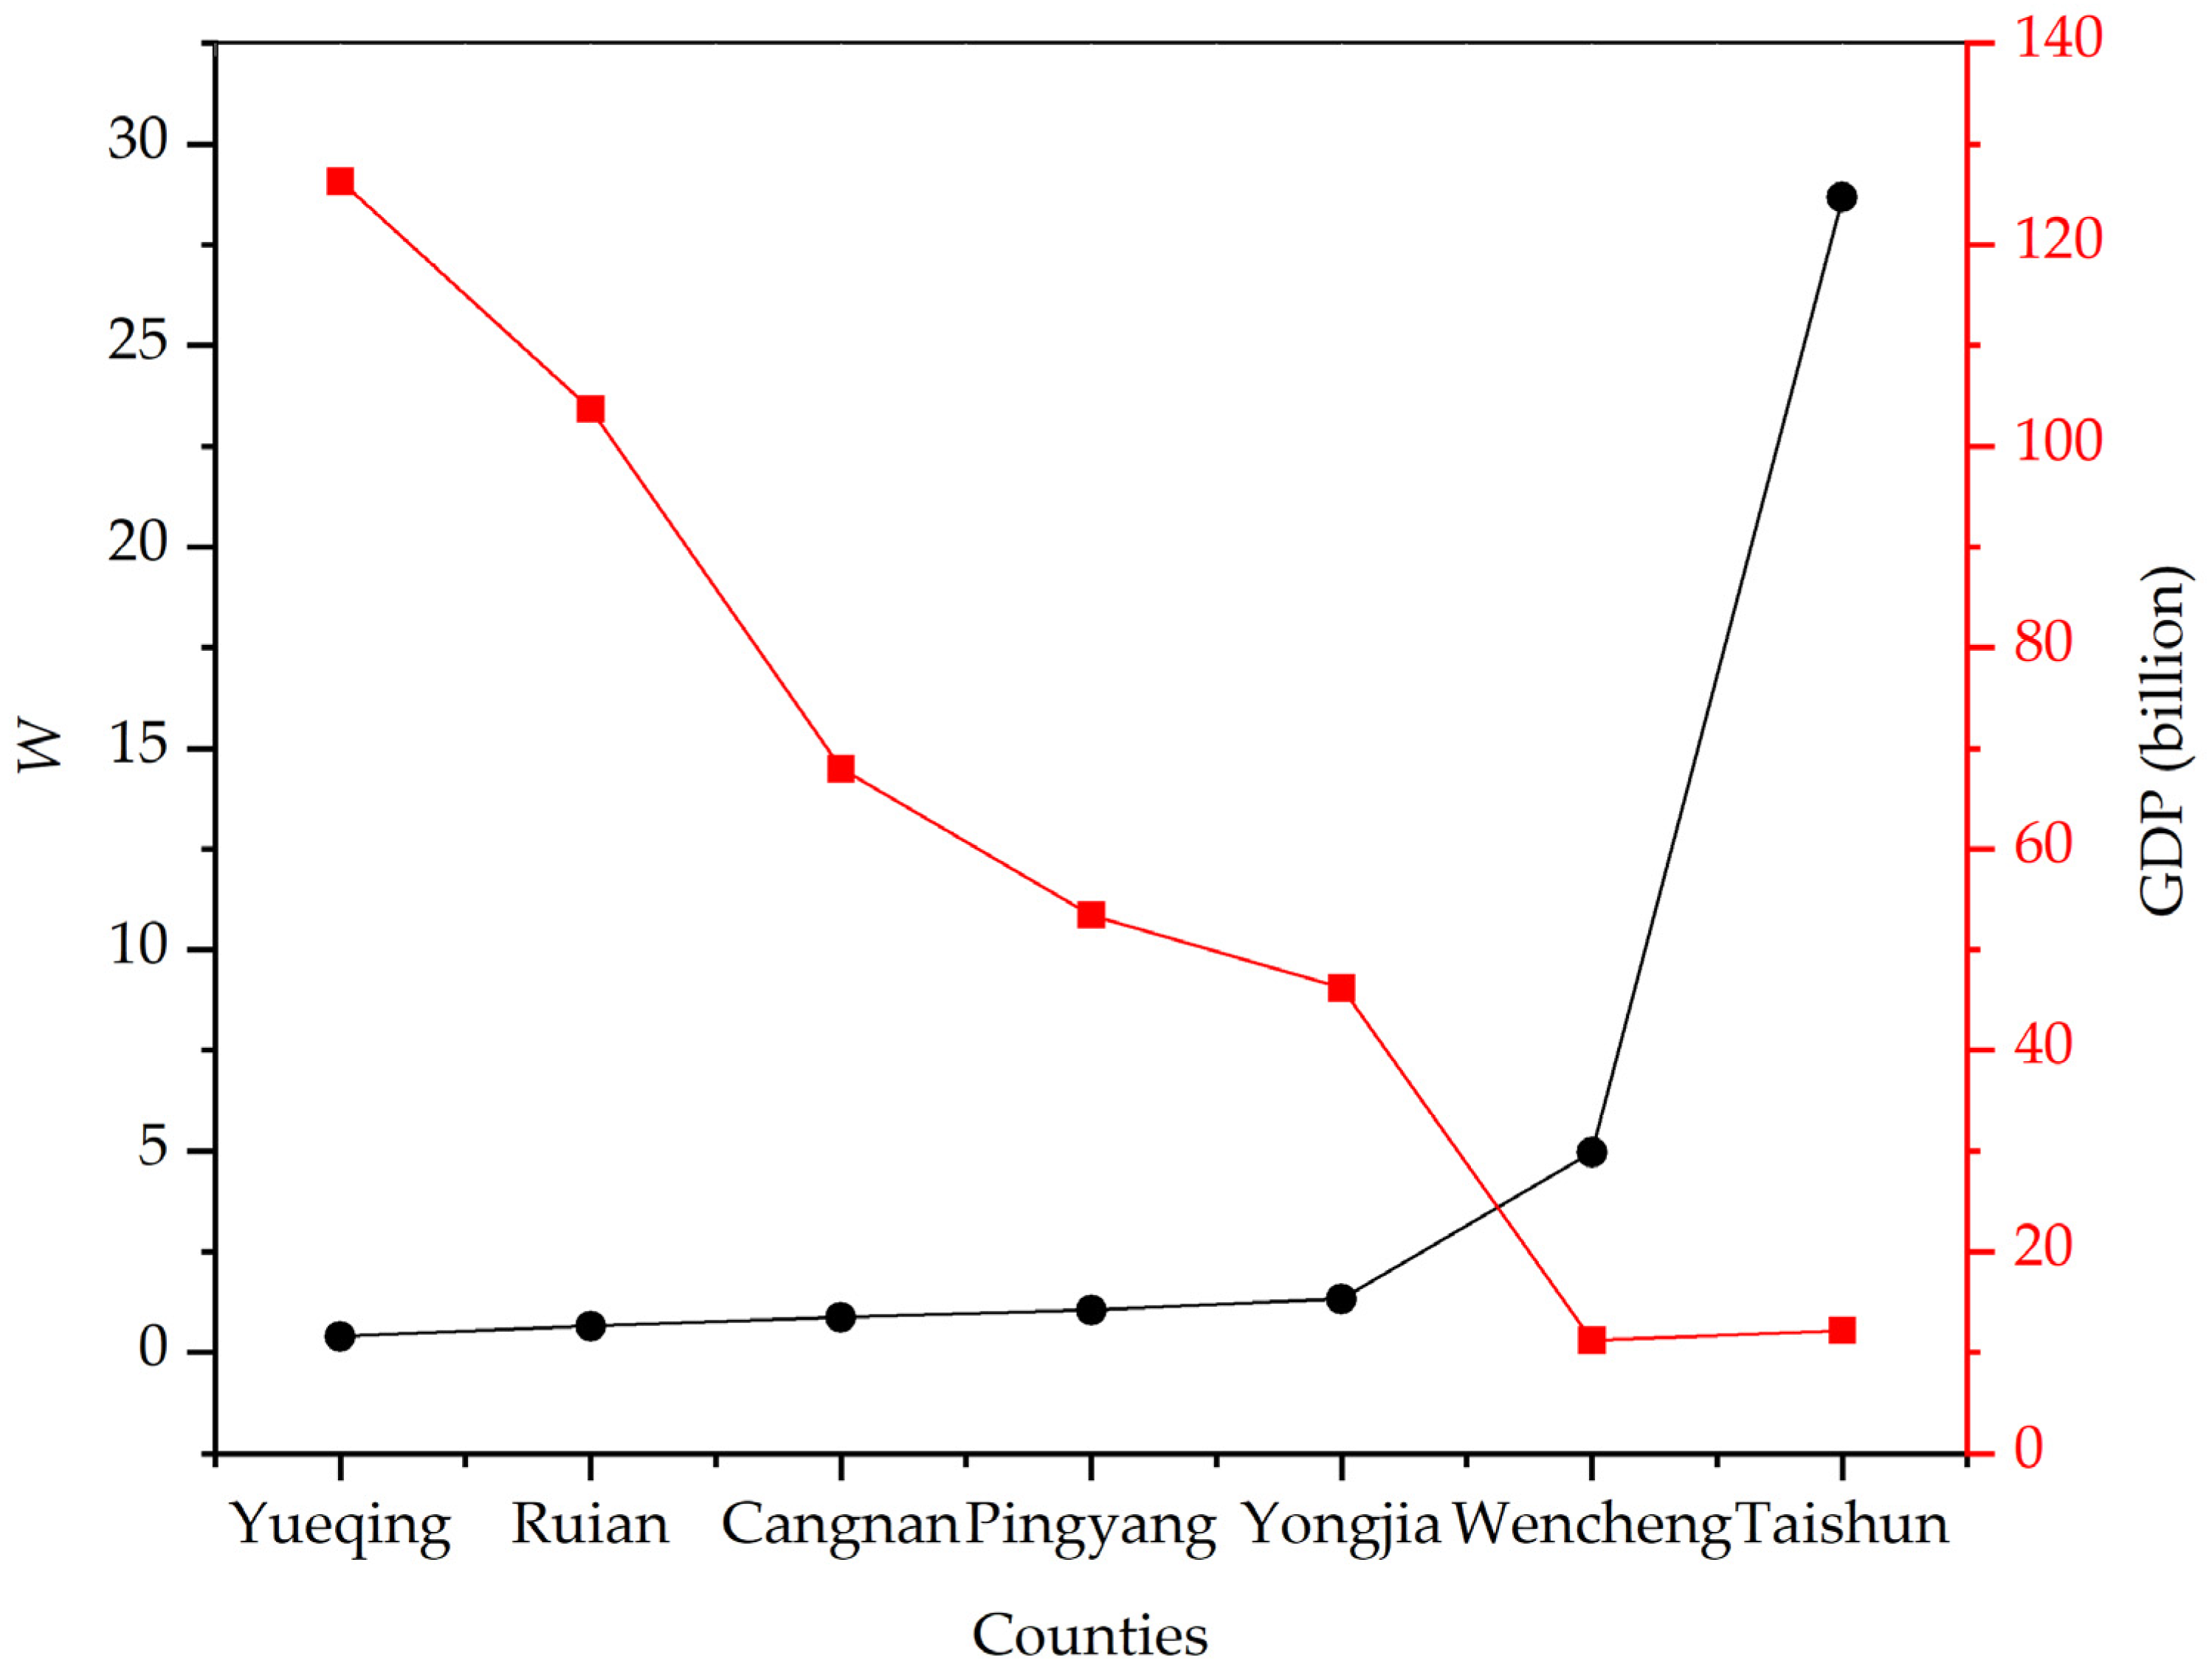
The difference in potential crop production that is added by farmland consolidation between counties should be focused on in the adjustment of the RCBF policy. As mentioned above, there is a significant negative correlation between GDP and the index of the balance of potential crop production of each county in Wenzhou city (Figure 5). We believe that the potential index of the balance of potential crop production (“W”) is an important parameter in deciding whether to implement land reclamation and exploitation programs to expand farmland, or whether to strive for provincial adjustment or national overall planning in implementing or adjusting the RCBF policy, and it can be used as one of the bases for the determination of the project and the overall quantity.

4.3. Limitations of Our Study and Perspectives

This study offers measurement procedures for investigating the potential of the counties to achieve a requisition–compensation balance of potential crop production merely through quality improvement, and it takes seven counties in Wenzhou city as examples to carry out an empirical study. However, there are some deficiencies in the work presented here. First, although the method used here has been improved and optimized in terms of dividing the farmland into different regions and setting consolidation targets [51], it still has high requirements with regard to the existing land data resources. In addition, while the results reveal certain patterns, they would be more convincing if more economically developed counties were included in the analysis, which would require more in-depth research.

5. Conclusions

In this study, based on land data results such as farmland gradation at the county level, general land-use planning, detailed land-use survey data, and GIS spatial analysis technology, seven counties in Wenzhou city were taken as examples to estimate the potential to achieve a requisition–compensation balance of potential crop production merely through farmland consolidation in the planning period. According to the results, the following conclusions can be drawn: (1) there is a significant negative correlation between GDP and the index of the balance of potential crop production of each county in Wenzhou city; that is, the more developed the county, the lower the potential to achieve the balance; (2) with an increase in elevation, the potential of increasing potential crop production showed an inverted U-shaped curve, thus more attention should be paid to farmland with an elevation of between 50 m and 500 m when implementing farmland consolidation projects; (3) although it is difficult for economically developed counties to strike a balance for potential crop production merely through farmland consolidation, the potential to compensate for the occupation of potential crop production is great, reaching more than 40%; and (4) to adjust the RCBF policy, the potential to compensate for the occupation of potential crop production through farmland consolidation and the difference between counties should be the focus. Moreover, the proposed approach illustrated in this study can clearly reveal the relationship between requisition and compensation of potential crop production, which is the basis to judge the realization degree of the balance of potential crop production merely through farmland consolidation, having important implications for the adjustment of the RCBF policy in China.

Author Contributions

Conceptualization, C.L. and X.J.; methodology, C.L. and X.J.; software, Y.L. and J.Z.; validation, C.L.; formal analysis, C.L.; investigation, Y.L.; resources, C.L. and W.L.; data curation, Y.L.; writing—original draft preparation, C.L. and M.L.; writing—review and editing, X.J.; visualization, M.L.; supervision, X.J.; project administration, C.L.; funding acquisition, C.L. and Y.L. and J.Z. All authors have read and agreed to the published version of the manuscript.

Funding

This research was funded by the Natural Science Foundation of China [Grant No. 42201286], the Natural Science Foundation of Anhui Province [Grant No. 2008085QD163], the Natural Science Foundation of Anhui Province [Grant No. 2208085MD91], the Youth Fund for Humanities and Social Science Research of Ministry of Education [Grant No. 20YJC630057], the Youth Fund for Humanities and Social Science Research of Ministry of Education [Grant No. 19YJC630115] and the Philosophy and Social Science Planning Project of Anhui Province of China [Grant No. AHSKQ2020D20].

Institutional Review Board Statement

Not applicable.

Informed Consent Statement

Not applicable.

Data Availability Statement

Not applicable.

Conflicts of Interest

The authors declare no conflict of interest.

References

  1. Xin, L.; Li, X. China should not massively reclaim new farmland. Land Use Policy 2018, 72, 12–15. [Google Scholar] [CrossRef]
  2. Liu, L.; Liu, Z.; Gong, J.; Wang, L.; Hu, Y. Quantifying the amount, heterogeneity, and pattern of farmland: Implications for China’s requisition-compensation balance of farmland policy. Land Use Policy 2019, 81, 256–266. [Google Scholar] [CrossRef]
  3. Zhao, H.; Zhang, H.; Miao, C.; Ye, X.; Min, M. Linking heat source–sink landscape patterns with analysis of urban heat islands: Study on the fast-growing Zhengzhou city in central China. Remote Sens. 2018, 10, 1268. [Google Scholar] [CrossRef] [Green Version]
  4. Deng, Z.; Zhao, Q.; Bao, H.X.H. The impact of urbanization on farmland productivity: Implications for China’s requisition-compensation balance of farmland policy. Land 2020, 9, 311. [Google Scholar] [CrossRef]
  5. Yang, B.; Ke, X.; van Vliet, J.; Yu, Q.; Zhou, T.; Verburg, P.H. Impact of cropland displacement on the potential crop production in China: A multi-scale analysis. Reg. Environ. Change 2020, 20, 97. [Google Scholar] [CrossRef]
  6. Chen, H.; Tan, Y.; Xiao, W.; Li, G.; Meng, F.; He, T.; Li, X. Urbanization in China drives farmland uphill under the constraint of the requisition–Compensation balance. Sci. Total Environ. 2022, 831, 154895. [Google Scholar] [CrossRef]
  7. Gao, R.; Chuai, X.; Ge, J.; Wen, J.; Zhao, R.; Zuo, T. An integrated tele-coupling analysis for requisition–compensation balance and its influence on carbon storage in China. Land Use Policy 2022, 116, 1060507. [Google Scholar] [CrossRef]
  8. Ke, X.; Zhou, Q.; Zuo, C.; Tang, L.; Turner, A. Spatial impact of cropland supplement policy on regional ecosystem services under urban expansion circumstance: A case study of Hubei Province, China. J. Land Use Sci. 2020, 15, 673–689. [Google Scholar] [CrossRef]
  9. Liu, Y. Introduction to land use and rural sustainability in China. Land Use Policy 2018, 74, 1–4. [Google Scholar] [CrossRef]
  10. Liang, C.; Jiang, P.; Chen, W.; Li, M.; Wang, L.; Gong, Y.; Pian, Y.; Xia, N.; Duan, Y.; Huang, Q. Farmland protection policies and rapid urbanization in China: A case study for Changzhou City. Land Use Policy 2015, 48, 552–566. [Google Scholar] [CrossRef]
  11. Shen, X.; Wang, L.; Wu, C.; Lv, T.; Lu, Z.; Luo, W.; Li, G. Local interests or centralized targets? How China’s local government implements the farmland policy of Requisition–Compensation Balance. Land Use Policy 2017, 67, 716–724. [Google Scholar] [CrossRef]
  12. Li, W.; Wang, D.; Liu, S.; Zhu, Y.; Yan, Z. Reclamation of Cultivated Land Reserves in Northeast China: Indigenous Ecological Insecurity Underlying National Food Security. Int. J. Environ. Res. Public Health 2020, 17, 1211. [Google Scholar] [CrossRef] [PubMed] [Green Version]
  13. Xiong, B.; Chen, R.; Xia, Z.; Ye, C.; Anker, Y. Large-scale deforestation of mountainous areas during the 21st Century in Zhejiang Province. Land Degrad. Dev. 2020, 31, 1761–1774. [Google Scholar] [CrossRef]
  14. Li, C.; Chen, L.; Liu, D.; Wei, J.; He, J.; Duan, X. The hidden risk in China’s cropland conversion from the perspective of slope. Catena 2021, 206, 105536. [Google Scholar] [CrossRef]
  15. Meyfroidt, P.; Rudel, T.K.; Lambin, E.F. Forest transitions, trade, and the global displacement of land use. Proc. Natl. Acad. Sci. USA 2010, 107, 20917–20922. [Google Scholar] [CrossRef] [PubMed] [Green Version]
  16. van Vliet, J. Direct and indirect loss of natural area from urban expansion. Nat. Sustain. 2019, 2, 755–763. [Google Scholar] [CrossRef]
  17. Chen, W.; Ye, X.; Li, J.; Fan, X.; Liu, Q.; Dong, W. Analyzing requisition–compensation balance of farmland policy in China through telecoupling: A case study in the middle reaches of Yangtze River Urban Agglomeration. Land Use Policy 2019, 83, 134–146. [Google Scholar] [CrossRef]
  18. Lu, S.; Qin, F.; Chen, N.; Yu, Z.; Xiao, Y.; Cheng, X.; Guan, X. Spatiotemporal differences in forest ecological security warning values in Beijing: Using an integrated evaluation index system and system dynamics model. Ecol. Indic. 2019, 104, 549–558. [Google Scholar] [CrossRef]
  19. Li, S.; Li, X. Global understanding of farmland abandonment: A review and prospects. J. Geogr. Sci. 2017, 27, 1123–1150. [Google Scholar] [CrossRef]
  20. Lin, L.; Ye, Z.; Gan, M.; Shahtahmassebi, A.; Weston, M.; Deng, J.; Lu, S.; Wang, K. Quality Perspective on the Dynamic Balance of Cultivated Land in Wenzhou, China. Sustainability 2017, 9, 95. [Google Scholar] [CrossRef]
  21. Lichtenberg, E.; Ding, C. Assessing farmland protection policy in China. Land Use Policy 2008, 25, 59–68. [Google Scholar] [CrossRef]
  22. Martellozzo, F.; Ramankutty, N.; Hall, R.J.; Price, D.T.; Purdy, B.; Friedl, M.A. Urbanization and the loss of prime farmland: A case study in the Calgary–Edmonton corridor of Alberta. Reg. Environ. Change 2015, 15, 881–893. [Google Scholar] [CrossRef]
  23. Song, W.; Pijanowski, B.C. The effects of China’s cultivated land balance program on potential land productivity at a national scale. Appl. Geogr. 2014, 46, 158–170. [Google Scholar] [CrossRef]
  24. Ormerod, S.J.; Marshall, E.J.P.; Gillian, K.; Rushton, S.P. Meeting the ecological challenges of agricultural change: Editors’ introduction. J. Appl. Ecol. 2010, 40, 939–946. [Google Scholar] [CrossRef]
  25. Norse, D.; Ju, X. Environmental costs of China’s food security. Agric. Ecosyst. Environ. 2015, 209, 5–14. [Google Scholar] [CrossRef]
  26. Wang, L.; Zheng, W.; Tang, L.; Zhang, S.; Liu, Y.; Ke, X. Spatial optimization of urban land and cropland based on land production capacity to balance cropland protection and ecological conservation. J. Environ. Manag. 2021, 285, 112054. [Google Scholar] [CrossRef]
  27. Yin, F.; Zhou, T.; Ke, X. Impact of cropland reclamation on ecological security in the Yangtze River Economic Belt, China. Sustainability 2021, 13, 12735. [Google Scholar] [CrossRef]
  28. Wu, X.; Xu, Z. Study on the transformation of cropland protection under the background of rehabilitation system. Resour. Sci. 2019, 41, 9–22. (In Chinese) [Google Scholar]
  29. Tang, L.; Ke, X.; Zhou, T.; Zheng, W.; Wang, L. Impacts of cropland expansion on carbon storage: A case study in Hubei, China. J. Environ. Manag. 2020, 265, 110515. [Google Scholar] [CrossRef]
  30. Leipnik, M.; Su, Y.; Lane, R.; Ye, X. Agriculture and Food Production in China and the U.S. In A Comparative Geography of China and the U.S.; Hartmann, R., Wang, J., Ye, T., Eds.; Springer: Dordrecht, The Netherlands, 2014; pp. 117–158. [Google Scholar]
  31. Han, L.; Meng, P.; Jiang, R.; Xu, B.; Zhang, B.; Chen, M. Logical root, pattern exploration and management innovation of balancing cultivated land occupation and reclamation in the new era: Based on the workshop “improvement methods and management innovation of balancing cultivated land occupation and reclamation in the new era”. China Land Sci. 2018, 32, 90–96. (In Chinese) [Google Scholar]
  32. Wu, Y.; Shen, X. Governance Transformation for Cultivated Land Protection in China: Provision, Regulation and Enabling. China Land Sci. 2021, 35, 32–38. (In Chinese) [Google Scholar]
  33. Griffiths, P.; Müller, D.; Kuemmerle, T.; Hostert, P. Agricultural land change in the Carpathian ecoregion after the breakdown of socialism and expansion of the European Union. Environ. Res. Lett. 2013, 8, 45012–45024. [Google Scholar] [CrossRef]
  34. Zumkehr, A.; Campbell, J.E. Historical U.S. Cropland Areas and the Potential for Bioenergy Production on Abandoned Croplands. Environ. Sci. Technol. 2013, 47, 3840–3847. [Google Scholar] [CrossRef] [PubMed]
  35. Gibson, G.R.; Campbell, J.B.; Zipper, C.E. Sociopolitical influences on cropland area change in Iraq, 2001–2012. Appl. Geogr. 2015, 62, 339–346. [Google Scholar] [CrossRef]
  36. van Vliet, J.; Eitelberg, D.A.; Verburg, P.H. A global analysis of land take in cropland areas and production displacement from urbanization. Glob. Environ. Change 2017, 43, 107–115. [Google Scholar] [CrossRef]
  37. Chen, R. The Analysis of Dynamic Balance Between Cultivated Land Supply and Demand of Wenzhou City. Ph.D. Thesis, Tongji University, Shanghai, China, 2007. (In Chinese). [Google Scholar]
  38. Zhang, G.; Wu, Y.; Zhao, Y. Physical suitability evaluation of reserve resources of cultivated land in China based on SOTER. Trans. Chin. Soc. Agric. Eng. 2010, 26, 1–8. (In Chinese) [Google Scholar]
  39. Ministry of Land Resources of the People’s Republic of China. Regulation for Gradation on Agriculture Land Quality; China Plan Press: Beijing, China, 2012. (In Chinese) [Google Scholar]
  40. Chen, Y.; Zhang, L.; Zhang, J.; Liu, H. Model for measuring cultivated land that could be non-agriculturally transformed based on crop productivity. J. Nat. Resour. 2013, 28, 450–458. (In Chinese) [Google Scholar]
  41. Zhang, H.; Li, X.; Huo, X.; Zhang, L. Study on the realistic potential of farmland consolidation on the theory of productivity—A case study on Suning County, Hebei Province. Res. Soil Water Conserv. 2011, 18, 202–206. (In Chinese) [Google Scholar]
  42. Ye, Q.; Chen, J.; Xiao, J.; Wei, W. Location choice for farmland consolidation based on constraints of ecology and non-agriculture land conversion. Trans. Chin. Soc. Agric. Eng. 2011, 27, 293–299. (In Chinese) [Google Scholar]
  43. Wang, J.; Yan, S.; Bai, Z.; Yu, L.; Guo, Y. Review on landscape patterns of land consolidation and the ecological effects. China Land Sci. 2012, 26, 87–94. (In Chinese) [Google Scholar]
  44. Jiang, G.; Zhang, R.; Ma, W.; Zhou, D.; Wang, X.; He, X. Cultivated land productivity potential improvement in land consolidation schemes in Shenyang, China: Assessment and policy implications. Land Use Policy 2017, 68, 80–88. [Google Scholar] [CrossRef]
  45. Bren D Amour, C.; Reitsma, F.; Baiocchi, G.; Barthel, S.; Güneralp, B.; Erb, K.; Haberl, H.; Creutzig, F.; Seto, K.C. Future urban land expansion and implications for global croplands. Proc. Natl. Acad. Sci. USA 2017, 114, 8939–8944. [Google Scholar] [CrossRef] [PubMed] [Green Version]
  46. Liu, S.; Dong, Y.; Li, D.; Liu, Q.; Wang, J.; Zhang, X. Effects of different terrace protection measures in a sloping land consolidation project targeting soil erosion at the slope scale. Ecol. Eng. 2013, 53, 46–53. [Google Scholar] [CrossRef]
  47. Deng, X.; Lian, P.; Zeng, M.; Xu, D.; Qi, Y. Does farmland abandonment harm agricultural productivity in hilly and mountainous areas? Evidence from China. J. Land Use Sci. 2021, 16, 433–449. [Google Scholar] [CrossRef]
  48. Liu, Y.; Zhou, Y. Reflections on China’s food security and land use policy under rapid urbanization. Land Use Policy 2021, 109, 105699. [Google Scholar] [CrossRef]
  49. Zhang, Z.; Meng, X.; Elahi, E. Protection of Cultivated Land Resources and Grain Supply Security in Main Grain-Producing Areas of China. Sustainability 2022, 14, 2808. [Google Scholar] [CrossRef]
  50. Zhi, J.; Cao, X.; Zhang, Z.; Qin, T.; Qu, L.; Qi, L.; Ge, L.; Guo, A.; Wang, X.; Da, C.; et al. Identifying the determinants of crop yields in China since 1952 and its policy implications. Agric. For. Meteorol. 2022, 327, 109216. [Google Scholar] [CrossRef]
  51. Foley, J.A.; Ramankutty, N.; Brauman, K.A.; Cassidy, E.S.; Gerber, J.S.; Johnston, M.; Mueller, N.D.; O’Connell, C.; Ray, D.K.; West, P.C.; et al. Solutions for a cultivated planet. Nature 2011, 478, 337–342. [Google Scholar] [CrossRef]
  52. Li, C.; Jin, X. Potential evaluation of requisition-compensation balance of arable land production capacity in the planning period based on quality improvement at county level. J. Nat. Resour. 2016, 31, 265–274. (In Chinese) [Google Scholar]
  53. Zhou, L.; Dang, X.; Mu, H.; Wang, B.; Wang, S. Cities are going uphill: Slope gradient analysis of urban expansion and its driving factors in China. Sci. Total Environ. 2021, 775, 145836. [Google Scholar] [CrossRef]
  54. Yang, C.; Xia, R.; Li, Q.; Liu, H.; Shi, T.; Wu, G. Comparing hillside urbanizations of Beijing-Tianjin-Hebei, Yangtze River Delta and Guangdong–Hong Kong–Macau greater Bay area urban agglomerations in China. Int. J. Appl. Earth Obs. 2021, 102, 102460. [Google Scholar] [CrossRef]
Figure 1. The location of Wenzhou in China and land use of Wenzhou in 2011.
Land 11 01918 g001
Figure 2. Schematic diagram of farmland consolidation and two sources of increased potential crop production.
Land 11 01918 g002
Figure 3. Quality and spatial distribution of farmland to be turned to construction land in counties (2011~2020).
Land 11 01918 g003
Figure 4. Requisition and compensation of potential crop production in counties of Wenzhou (2011~2020).
Land 11 01918 g004
Figure 5. The negative correlation between GDP and the index of the balance of potential crop production of each county in Wenzhou city.
Land 11 01918 g005
Figure 6. The potential of increasing potential crop production shows an inverted U-shaped curve as elevation increases.
Land 11 01918 g006
Table 1. Quantity and quality of farmland to be turned into construction land, and the loss of potential crop production in different counties (2011~2020) (ha, 103 kg).
Administrative RegionAreaQuality
(Land Use Index)
Loss of Production CapacityProportion
Municipal district 15674.101576–314585,600.4332.63%
Cangnan2460.771110–303136,134.0013.78%
Pingyang1428.671096–303120,218.067.71%
Ruian3228.391177–268844,050.2616.79%
Taishun62.311373–2288851.060.32%
Wencheng451.21867–32636103.892.33%
Yongjia1885.001184–352628,690.8210.94%
Yueqing2639.431589–346940,670.4315.50%
Wenzhou17,829.88867–3526262,318.95100%
1 Municipal district comprises Lucheng district, Longwan district, Ouhai district, and Dongtou district.
Table 2. Regions of farmland consolidation and the area of farmland to be consolidated in Wenzhou city (ha).
Administrative RegionRegionsFarmland to Be Consolidated
Municipal district 18011,287.58
Cangnan5329,657.29
Pingyang6024,441.16
Ruian5027,364.34
Taishun4025,525.35
Wencheng4523,269.03
Yongjia10032,676.60
Yueqing6920,372.43
Wenzhou497194,593.77
1 Municipal district comprises Lucheng district, Longwan district, Ouhai district, and Dongtou district.
Table 3. Supplement of potential crop production due to farmland consolidation (2011~2020) (ha, 103 kg).
Elevation Municipal District 1CangnanPingyangRuianTaishunWenchengYongjiaYueqingWenzhou
e ≤ 50 mSd4585.3312,135.989288.9615,320.700.000.002641.8811,841.6355,814.48
PL2593.028875.985341.0711,690.150.000.003026.778364.8639,891.85
Sja56.8380.53−37.0494.750.000.0029.2017.73242.00
PN880.141238.80−542.221425.490.000.00474.50291.853768.56
PN + PL3473.1610,114.794798.8413,115.640.000.003501.278656.7143,660.41
50 m < e ≤ 300 mSd3265.7115,482.1011,505.008059.713665.017067.1314,686.387720.8971,451.93
PL3663.4817,588.2511,699.516024.963346.596972.5812,068.125872.6667,236.15
Sja22.40177.4661.98328.2083.57228.03347.1990.481339.31
PN348.732616.87935.134546.231253.623431.215353.281397.3319,882.40
PN + PL4012.2120,205.1212,634.6410,571.194600.2110,403.7917,421.417269.9987,118.55
300 m < e ≤ 500 mSd2555.071873.523014.473661.7613,022.489432.9612,576.96809.9146,947.13
PL1728.831002.902424.032800.798236.038415.878555.30228.8833,392.64
Sja−58.388.7781.69155.99313.78341.16421.579.191273.78
PN−906.75119.361140.842108.014518.965109.076324.53130.0718,544.10
PN + PL822.081122.273564.874908.8012,754.9913,524.9414,879.84358.9551,936.73
500 m > e ≤ 800 mSd881.47165.69597.63205.637938.375895.512462.050.0018,146.35
PL263.800.00288.536.593489.833619.001090.390.008758.16
Sja10.360.64−6.409.55199.41169.4374.450.00457.44
PN150.038.53−81.63118.512821.452436.651076.270.006529.81
PN + PL413.838.53206.90125.106311.286055.662166.660.0015,287.97
e > 800 mSd0.000.0035.100.00899.50873.42309.320.002117.33
PL0.000.000.000.00277.55334.90160.530.00772.98
Sja0.000.00−0.610.0032.802.548.510.0043.25
PN0.000.00−7.200.00453.0634.45117.050.00597.35
PN + PL0.000.00−7.200.00730.61369.35277.580.001370.33
TotalSd11,287.5829,657.2924,441.1627,364.3425,525.3523,269.0332,676.6020,372.4319,4593.77
PL8249.1327,467.1319,753.1420,522.4915,350.0119,342.3624,901.1214,466.40150,051.78
Sja31.21267.4099.64588.48629.56741.16880.92117.403355.77
PN472.153983.571444.928198.239047.0811,011.3813,345.641819.2549,322.22
PN + PL8721.2831,450.7021,198.0628,720.7224,397.0930,353.7438,246.7616,285.65199,374.00
1 Municipal district comprises Lucheng district, Longwan district, Ouhai district, and Dongtou district.
Table 4. Loss and supplement of potential crop production in different counties (2011~2020) (103 kg).
Administrative RegionLoss of Potential Crop Production/PRSupplement of Potential Crop Production by the Enhancement of Farmland Quality/PLSupplement of Potential Crop Production by the Newly Increased Farmland Quality/PNPL + PNPotential Index of the Balance of Potential Crop Production/W
Municipal district 185,600.438249.13472.158721.2810.19%
Cangnan36,134.0027,467.133983.5731,450.7087.04%
Pingyang20,218.0619,753.141444.9221,198.06104.85%
Ruian44,050.2620,522.498198.2328720.7265.20%
Taishun851.0615,350.019047.0824,397.092866.67%
Wencheng6103.8919,342.3611,011.3830,353.74497.29%
Yongjia28,690.8224,901.1213,345.6438,246.76133.31%
Yueqing40,670.4314,466.401819.2516,285.6540.04%
Wenzhou262,318.95150,051.7849,322.22199,374.0076.00%
1 Municipal district comprises Lucheng district, Longwan district, Ouhai district, and Dongtou district.
Publisher’s Note: MDPI stays neutral with regard to jurisdictional claims in published maps and institutional affiliations.

