Abstract
In order to solve the problem of habitat fragmentation in the Beijing–Tianjin–Hebei region and realize the sustainable use of land, based on remote sensing data from 2010 to 2020, this paper uses GIS and the CA–Markov model to predict the land use structure in 2030, and uses the InVEST model to quantitatively analyze the changes in habitat quality in the Beijing–Tianjin–Hebei region from 2010 to 2030. The results indicate that (1) from 2010 to 2020, the area of construction land increased significantly, mainly from cultivated land, woodland and grassland; the proportion of cultivated land decreased by 7.2%. It was predicted that by 2030, the area of construction land will continue to expand, accounting for 19.6%. According to the results of land use dynamic degree, the conversion speed between land types in 2010–2015 was higher than that in 2015–2020. (2) The average habitat quality indexes of the study area in 2010, 2015, 2020 and 2030 were 0.57, 0.56, 0.55 and 0.52, respectively, and the habitat quality level was moderate and continued to decline. The habitat center of gravity moved in the north, from Fengning Manchu Autonomous County to the junction of Fengning Manchu Autonomous County and Longhua County, and then moved to the Mentougou District of Beijing. Therefore, in order to amendthe continuous decline in habitat quality, scientific measures should be taken according to local conditions to promote the improvement of habitat quality and the rational use of land.
1. Introduction
With the acceleration of urbanization and industrialization, human beings have put forward higher requirements for land use and the ecological environment, and land has both socio-economic performance and ecological effects [1]. However, in the past few decades, the high-intensity activities of human beings have seriously affected the balance of the ecosystem. The expansion of towns, economic development, and the surge of population have increased the utilization of land in every way. Ignoring the behavior of ecological economic development has led to the loss or degradation of a large number of suitable habitats, thus negatively affecting the role played by the whole environment [2]. The Beijing–Tianjin–Hebei region, as the largest and most economically dynamic region in northern China, plays an important role in relieving urban pressure and promoting the integration of industrial chains, so it has also become the most densely populated area of human activity, thus driving the high-intensity use of land and bringing pressure to the ecosystem of the Beijing–Tianjin–Hebei region [2]. Land is the carrier of habitat, and the quality of a habitat reflects the ability of a specific area to provide living conditions for organisms. For one thing, the status of habitat quality indicates the degree of land use, and for another, the quality of habitat also indicates whether the structure and function of the ecosystem are stable. The study of habitat quality is of great significance to the survival and reproduction of organisms and the balance of ecosystems.
At present, scholars have conducted extensive research on habitat, mainly including administrative division scale [3,4,5,6,7] and watershed scale [8,9]. The research on habitat quality mainly involves habitat assessment [4,10], correlation and analysis between habitat and landscape patterns [11,12], the temporal and spatial evolution of habitats [13], and so on. The models involved in habitat simulation include the PLUS model [14], SWAT model [15], FLUS model [16], CLUE-S model [17], CA–Markov model [1,18], and so on. The models for quantitative analysis of habitat quality include the SoIVES model [19], MIMES model [20] and InVEST model [21,22]. The InVEST model, developed by Stanford University and the WWF in the United States, has the characteristics of accurate quantification, visual results, and low application cost, so it is widely used [23]. Meanwhile, the CA–Markov model not only has the characteristics of the CA model to predict spatial form evolution, but also has the ability of the Markov model to deduce time series, so it is widely used in land use simulation [24].
The above two models have achieved good application results in their respective fields, but there are few studies on the simulation and prediction of habitat quality under the influence of future land use changes. Predicting future land use patterns and habitat quality is of great significance to understand the dynamic mechanism of land use evolution and explore ecological environment optimization policies and management strategies. Therefore, this paper uses the GIS spatial analysis function to study the change in land use structure in 2010, 2015 and 2020, and based on the land use data in 2010 and 2020, uses the CA–Markov model to predict the land use structure in the Beijing–Tianjin–Hebei region in 2030. By means of the InVEST model, the spatial and temporal changes in habitat quality in 2010, 2015, 2020 and 2030 were quantitatively analyzed, and the relationship between land use change and habitat quality was obtained, which provided a scientific basis for rational land planning and ecological quality improvement in the Beijing–Tianjin–Hebei region.
2. Materials and Methods
2.1. Study Area
The Beijing–Tianjin–Hebei region is located in the heart of the Bohai Rim in China (Figure 1), Northeast Asia. The terrain is mainly mountainous and has areas with plains, with the Yanshan Mountain, mountainous areas and the Bashang Plateau in the north, and Haihe Plain across the rest of the region. Beijing is dominated by mountainous areas, accounting for about 62% of the area. Tianjin is dominated by plains, with the proportion of plains exceeding 90%. The whole region has a continental seasonal climate and is in the warm temperate zone. It is in summer that about 70% of the annual rainfall is concentrated, and it is dry and windy in spring and autumn. In winter, the temperature and snowfall in Bashang Plateau, mountainous areas and plain areas are quite different. The average annual temperature is around 10 °C. The Beijing–Tianjin–Hebei urban agglomeration is located on the Pacific coast, adjacent to the Bohai Sea, and is rich in mineral resources, which are not found in other coastal areas of China. The Beijing–Tianjin–Hebei region is dominated by cultivated land, followed by woodland, and the area of construction land accounts for about 11.6% of the whole country, which is significantly higher than the national average.
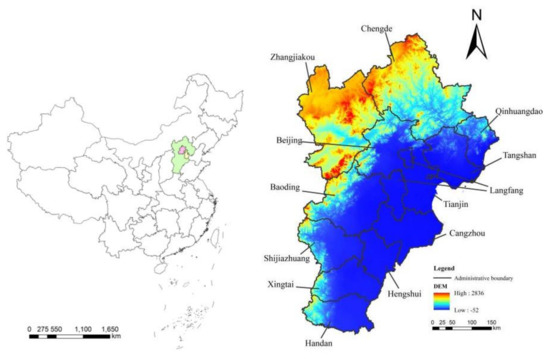
Figure 1.
Beijing–Tianjin–Hebei administrative territorial entity. The left picture shows Chinese administrative division, and the green area in the picture symbolizes Hebei Province; pink symbolizes Beijing; yellow symbolizes Tianjin.
2.2. Data Source and Preprocessing
With the help of the ENVI5.1 and ArcGIS10.2 software platforms, the Landsat TM/ETM remote sensing images (http://www.geodata.cn/index.html) (accessed on 2 May 2022) in 2010, 2015 and 2020 were preprocessed, including aspects such as band synthesis, image mosaic, cropping and geometric correction. The land use types were classified according to National Land Classification Standard and Land Use Status Classification (GB/T21010-2017). The 90m resolution DEM data comes from geospatial data cloud (http://www.gscloud.cn/) (accessed on 2 May 2022). Due to the large scope of the study area, in order to facilitate data processing, all data were resampled to 500m, and the data were projected as Krasovsky_1940_Albers.
2.3. Research Methods
2.3.1. Land Use Change
Since 1990s, the study of land use change has become one of the popular research topics in the field of environmental science. The technology and theory in foreign countries developed earlier than those of China, so they are relatively mature. The research content not only reflects the change in land use type and area, but also analyzes the relationship between nature, climate and land resource change [21]. The practice of analyzing land use change is relatively mature, so this study uses the experience of predecessors for reference, and uses GIS to convert, fuse and intersect the land use status map to obtain the attribute table of land type transfer, and then import it into the chart show website for visualization. In the cause of understanding the transfer rate of different land types, the dynamic degree of land use was calculated by counting the area of different land types in 2010, 2015 and 2020.
Single land use dynamic degree reflects the range and speed of land use type change, and the calculation formula is as follows:
where Ua and Ub are the areas of a certain land use type at the initial and final stages of the study, respectively; T is the research period, in years; and K represents the degree of change in a certain land type in the study period, reflecting the intensity of land change.
The comprehensive land use dynamic degree reflects the speed and intensity of mutual transformation between various land use types in a certain period of time, and its formula is:
k is the annual comprehensive change rate of area change in all land use types in the study area; Ua and Ub are the areas of a certain land use type at the initial and final stages of the study, respectively; T is the research period, in years; T is the research period; and n is the number of land use types.
2.3.2. CA–Markov Model
CA–Markov model combines a multi-criteria evaluation and multi-objective decision support system to define the rules of land use type transfer, and applies a Markov chain to obtain the long-term forecast results through multiple-objective matrix transfers. Practice has proved that, compared with GIS technology, the CA–Markov model has a stronger spatial simulation ability, more convenient operation and greater accuracy, and has been successfully applied in many fields. The specific method is shown in [24]: ① Unify the data resolution, number of rows and columns, projection coordinates, and convert the data format. ② Obtain the Markov matrix. ③ Implement the Markov simulation to evaluate the accuracy.
2.3.3. Habitat Quality Model
The habitat module in the InVEST model can quantitatively reflect distribution and change in habitats, so this paper uses this module to analyze the quality of habitats. This module establishes the relationship between land use and threat sources, reflecting the impact of human activities on the environment. The greater the intensity of human activities, the greater the damage to biodiversity and habitats, and vice versa [25]. In this paper, referring to the related literature [8,26,27], combined with the existing land use data and the actual situation of the Beijing–Tianjin–Hebei region, cultivated land, urban land, rural residential areas, other construction land and bare land with high human interference intensity were taken as the threat sources, and the weights and maximum influence distances of these threat sources were assigned by referring to version 3.2.0 of the InVEST model user manual. As shown in Table 1, the input data of the model operation also included the habitat suitability of different land cover types and their sensitivity to stress factors. This paper synthesized relevant research [1,2,3,4,5,8] and the specific parameter settings are shown in Table 2.

Table 1.
Threat and its maximum influence distance and weight.
Table 2.
Habitat suitability of each land use type and its sensitivity to threat factors.
2.3.4. Habitat Quality Barycenter Calculation
The center of gravity distribution can show the changing track of regional geographical objects in time and space, in detail and objectively [28]. The shift of habitat center of gravity drives the change in the overall regional ecological environment, and at the same time causes the continuous change in land use structure in the Beijing–Tianjin–Hebei region. For example, a large number of cultivated land, woodland and grassland areas around the city are occupied and converted into construction land, which will reduce ecological environment suitability.
The formula for calculating the center of gravity is:
Among them, Xt and Yt, respectively, represent the horizontal and vertical coordinates of the center of gravity in the t period; ati represents the area of the I-th plaque; and xi and yi represent the horizontal and vertical coordinates of the center of gravity of the i-th plaque, respectively [29].
The formula for calculating the shift distance of the center of gravity is:
where d represents the distance of center of gravity transfer; , , respectively, represent the horizontal and vertical coordinates after the center of gravity is shifted; and , , respectively, represent the reference horizontal and vertical coordinates before the center of gravity shifts [30].
3. Results
3.1. Analysis of Land Use Change in Beijing–Tianjin–Hebei Region
3.1.1. Analysis of Land Use Change in the Study Area from 2010 to 2020
Through the reclassification of remote sensing images of the Beijing–Tianjin–Hebei region in 2010, 2015 and 2020, six land use types were obtained (Figure 2). According to Table 1 and Table 2, it is concluded that construction land has a major negative impact on habitat quality, and the habitat suitability weights of woodland, grassland and water areas are all greater than 0.5, which has a significant positive effect. Analyzing the spatial and temporal changes in land use is of great significance for solving land ecological problems and improving habitat quality in the study area. Figure 2 shows that in the Beijing–Tianjin–Hebei region, cultivated land accounts for about 48% of the area and woodland accounts for about 21%. Cultivated land is widely distributed in the North China Plain and Bashang Plateau, and some of it is concentrated in the western part of North China. Woodland and grassland are found across the whole mountainous area of North China; the water area is widely distributed at the edge of coastal areas; construction land is distributed in blocks in Beijing and Tianjin, and scattered in other areas; unused land is concentrated in coastal areas. According to the area and proportion statistics of land use types in 2010, 2015 and 2020, Table 3 was created. From 2010 to 2020, the waters in coastal areas expanded and extended inland, with a small change in area, up by 0.2%. In the western part of the dam plateau and the central and southern part of the North China mountainous area, some grasslands were converted into forestland, and the forestland area increased by 0.20 × 10⁶ ha; The grassland near cultivated land in the northwest mountainous area of North China is significantly decreased, and the grassland area decreased by 0.28 × 10⁶ ha, accounting for 1.2%. The construction land mainly spread to other areas in Beijing and Tianjin, with a significant increase of 2.4%. The area of unused land in the Beijing–Tianjin–Hebei region accounts for less than 1%, with a small change, and unused land is scarce as reserve resources.
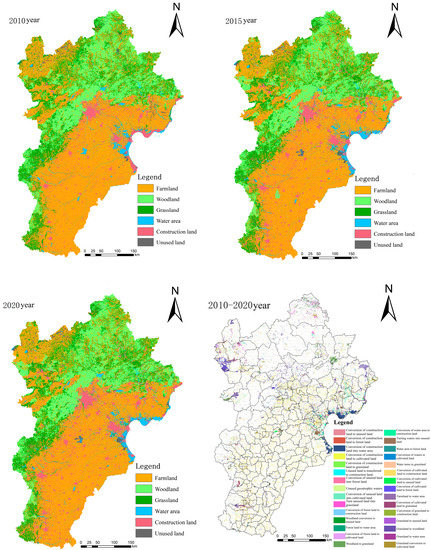
Figure 2.
Land cover and change in the Beijing–Tianjin–Hebei region.
Table 3.
Area statistics of land use types from 2010 to 2030.
In order to further understand the situation of land use transfer, ArcGIS10.2 was used to reclassify, transform, merge, intersect and calculate the current land use map of the third phase to obtain the land use transfer table, and further form the land use transfer chord map (Figure 3). The color, width and transfer direction of each transfer line in the chord graph represent the corresponding land type, transfer area and the conversion relationship between land types. In 2010–2015, the transferred-out area of water area was larger than that of other land types, and the area converted to forest land accounted for 19.9% of the total area of the study area, followed by forest land and cultivated land converted to construction land and unused land converted to water area, with the transferred-out areas being 1,549,925 ha, 928,600 ha and 402,225 ha, respectively, accounting for 7.2% and 4.3% of the total area of the study area. From 2015 to 2020, the land type transformation mainly occurred between cultivated land and construction land, while other land types had a smaller area, and the area of cultivated land converted into construction land was 147,783 ha.
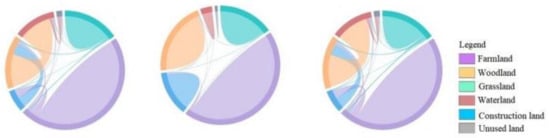
Figure 3.
Transformation of six land use types in the Beijing–Tianjin–Hebei region in 2010–2015, 2015–2020 and 2010–2020. The color, width and transfer direction of each transfer line in the chord diagram represent the corresponding land type, transfer area and the conversion relationship between land types, respectively (e.g., in the third picture, the green lines turn to yellow and purple areas, that is, the areas of grassland turning to cultivated land and woodland are 103200.26 ha and 191218.61 ha, respectively.).
3.1.2. Change in Dynamic Attitude of Land Use in the Study Area from 2010 to 2020
In order to judge the conversion speed of different land use types more intuitively, the dynamic degree of land use is calculated according to Formula (1) and (2). From 2010 to 2020, the single dynamic degree of land use of each land use type was as follows: construction land > unused land > water area > woodland > cultivated land > grassland. According to Figure 4, the dynamic degree of grassland single land use was the lowest in 2010–2015 and 2015–2020, which are 0.5% and 0.0%, respectively; it also shows that grassland was transferred to other types less from 2010 to 2020. In the period 2010–2015, the dynamic degree of single land use of construction land was the highest, with an average annual transfer rate of 3.5%, indicating that this type of land transfer was more active in the study period. The dynamic degree of comprehensive land use in 2010–2015, 2015–2020 and 2010–2020 was 0.6%, 0.1% and 0.4%, respectively, and the rate of land use change decreased by 74.4% in 2015–2020. From the dynamic degree of land use, it can be concluded that human activities and economic changes were relatively strong from 2010 to 2015.
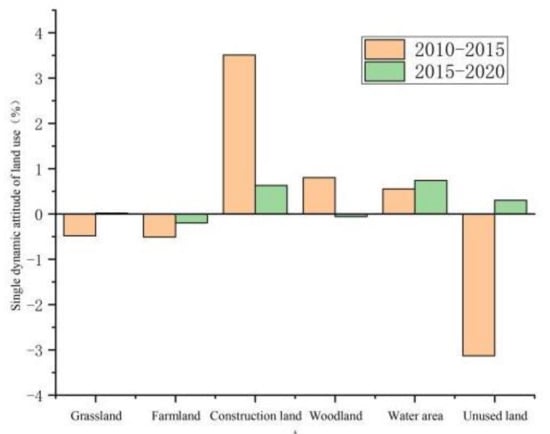
Figure 4.
Dynamic degree of single land use in the Beijing–Tianjin–Hebei region from 2010 to 2020.
To sum up, in the past 10 years, the area of construction land, cultivated land, and woodland has changed significantly, among which the area of construction land has increased significantly, with the area increasing by 0.52 × 10⁶ ha, accounting for 2.4% of the total. The cultivated land area decreased significantly, with the area reduced by 0.45 × 10⁶ ha and the area ratio decreased by 2.1%. The grassland area decreased significantly; the area decreased by 0.28 × 10⁶ ha, and the area ratio decreased by 1.2%. The transformation between cultivated land, construction land, woodland, water area and unused land is the most obvious. The substantial decrease in the size of cultivated land area comes from the continuous expansion of urban areas, and the reserve land resources in the Beijing–Tianjin–Hebei region being limited. In order to expand the effective cultivated land area and ensure the red line of “1.8 billion mu” of cultivated land, some forestland and grassland were converted into cultivated land when the urban areas expanded, thus ensuring basic grain production. In the Beijing–Tianjin–Hebei region, afforestation is the mainstay, ecological barriers are built, and returning farmland to forests is the center to control land desertification. A lasting ecological revolution is carried out in desertification areas, and the range of artificial trees is expanded, and the woodland area is also expanding year by year. In the process of land use, due to the climate, topography, natural disasters and other problems in the Beijing–Tianjin–Hebei region. The higher survival rate of forest trees compared with grassland leads to the transferred area of grassland being larger than the transferred area.
3.2. Prediction of Land Use Pattern in the Study Area in 2030
According to the current land use map, the CA–Markov model was used to predict the land use status in 2030, which is of great significance for understanding the changes in various land types and making reasonable plans in time. Here, Kappa is used to test its accuracy and ensure the scientificity of the results. Firstly, the existing data, including the land use status maps in 2010 and 2015, were used and brought into the CA–Markov model to obtain the land use status map in 2020. Secondly, the Kappa = 0.91 > 0.75 was compared with the existing land use status map in 2020, which shows that the prediction result of this model is credible and can be used to predict land use change in the Beijing–Tianjin–Hebei region.
Through ArcGIS10.2 and IDRISI17.0, the land use pattern in 2030 was simulated by using the remote sensing data in 2020, and finally the land use pattern in 2030 was obtained. As shown in Figure 5, the spatial distribution trend of different land use types will not change significantly by 2030. Due to the influence of climate and policies, the water area in coastal areas will obviously increase, and the area of construction land with Beijing as the center will gradually expand.
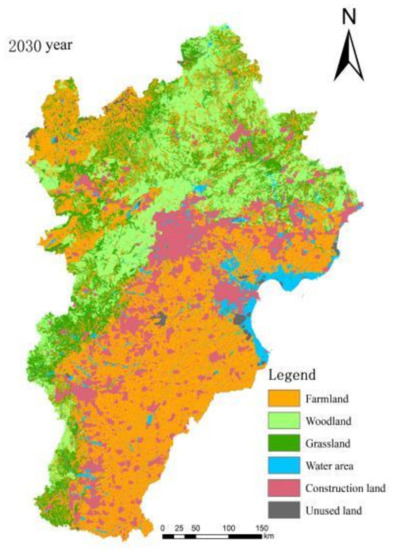
Figure 5.
Forecast of land use pattern in the Beijing–Tianjin–Hebei region in 2030.
Using the data derived from ArcGIS, the area of each land use type in 2030 was obtained (Table 3), and the cultivated land area will continue to decrease, accounting for 9.8% of the total area of the Beijing–Tianjin–Hebei region. From 2010 to 2030, the woodland area increases first and then decreases. Compared with 2010, the decrease in woodland area in 2030 accounts for 0.1% of the total area of the Beijing–Tianjin–Hebei region; however, the area of the two still accounts for a large proportion. The grassland area also decreases, accounting for 1.8% of the total area in the Beijing–Tianjin–Hebei region. Unused land and water areas do not change much, and the area of construction land increases substantially, mainly from cultivated land, woodland and grassland, from 9.3% in 2010 to 19.6% in 2030.
3.3. Spatial and Temporal Changes in Habitat Quality in the Beijing–Tianjin–Hebei Region
3.3.1. Analysis of Time Change in Habitat Quality
Using the InVEST model, the distribution maps of habitats in 2010, 2015, 2020 and 2030 were obtained, and they were imported into GIS for grading. The results showed that the average habitat quality indexes in 2010, 2015, 2020 and 2030 were 0.57, 0.56, 0.55 and 0.52, respectively, and the habitat quality level was moderate and declined continuously. From 2010 to 2030, the average habitat index decreased by 7.4%. The internal differences of habitats in the Beijing–Tianjin–Hebei region were analyzed, and in order to better explore the changes in habitats, the reclassification function of ArcGIS was used to divide them into four grades: poor, medium, good and excellent. The areas of habitats in four grades in 2010, 2015, 2020 and 2030 were extracted and the proportions were calculated. The results are shown in Figure 6.
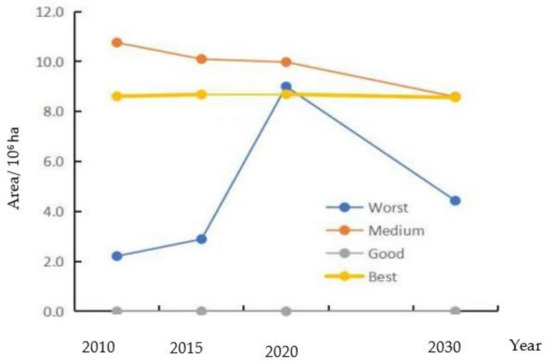
Figure 6.
Changes of habitat area in different grades.
It can be seen from Figure 6 that the habitat grades in the study area are mainly middle grade and excellent grade, and the sum of their areas is close to 86%. Among them, the middle habitat is the most widely distributed, and the area ratio is stable at about 48% from 2010 to 2020, indicating that overall habitat quality in the Beijing–Tianjin–Hebei region is medium. According to the change in area proportion of each grade with time, from 2010 to 2015, the medium area decreased, and the area and proportion decreased by 0.67 × 10⁶ ha and 3.3%, respectively; the proportion of poor grade areas has greatly increased, increasing by 3.1% in five years; the proportion of excellent grade areas increased by 0.2%. The change in habitat quality in 2015–2020 is similar to that in 2010-2015. From 2010 to 2020, the proportion of medium areas decreased by 3.8% in 10 years; the total excellent area and proportion increased slightly, 0.08 × 10⁶ ha and 0.2%, respectively; the area of a poor grade increased obviously, with an increase of 0.80 × 10⁶ ha in 10 years. It is predicted that by 2030, the habitat index will decrease to 0.52, and the area ratio of poor grade habitats will increase to 20.6%. Compared with 2020, the area ratio of medium grade and excellent grade habitats will both decrease.
3.3.2. Analysis of Spatial Change in Habitat Quality
There are obvious differences in the spatial distribution of different levels of habitats in the Beijing–Tianjin–Hebei region (Figure 7). Based on the analysis of the response of habitat quality to land use change, the Beijing–Tianjin–Hebei region is mainly divided into three landforms. From Figure 7, we can see that the overall habitat quality in the Beijing–Tianjin–Hebei region gradually decreases from north to south. The distribution of habitat quality is generally consistent with the distribution trend of land use, and the area of superior grade in the northern region is relatively large, accounting for about 65% of the total, and it is mainly forest and grassland; the habitat quality in the central region is low, mainly distributed in urban land and cultivated land, accounting for about 80% of the central region. The rapid expansion of urban areas and the continuous improvement of basic transportation facilities have gradually reduced the habitat quality. Therefore, the increase in construction land is the biggest threat to the habitat quality in the study area. The distribution of habitat grades in the Beijing–Tianjin–Hebei region is as follows: the middle grades are distributed in the North China Plain and Bashang Plateau in a large area, the superior grades are concentrated in the Taihang Mountains, Yanshan Mountains and coastal areas, and the poor grades are distributed in blocks in Beijing and Tianjin and scattered in other areas. From 2010 to 2030, the habitat grades in coastal areas of Tianjin, Cangzhou, Tangshan and Qinhuangdao gradually changed from poor and medium grades to excellent grades, and there was a trend towards internal expansion. The poor grades spread around the south of Beijing, and will form a concentrated distribution in Beijing, Baoding, Shijiazhuang and Handan by 2030; although the distribution area of the top grade in the mountainous areas of North China has increased, it will still be lower than that of the middle grade.
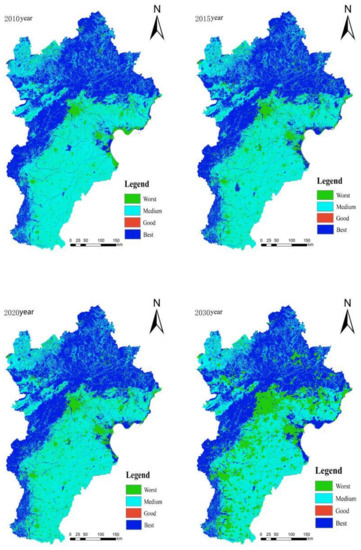
Figure 7.
Habitat quality distribution in the Beijing–Tianjin–Hebei region from 2010 to 2030.
Based on the above results, the area of poor grades in the Beijing–Tianjin–Hebei region increases more than other grades, and it is mainly located in the North China Plain. By comparing the land use change map and the habitat quality map, it can be found that the habitat quality of the construction land distribution area is worse than other land use types. It can be determined from Table 2 that the threat value of construction land is higher than that of cultivated land, while the threat value of cultivated land is higher than that of unused land. Therefore, the habitat quality of cultivated land is higher than that of construction land but lower than that of other land use types. Woodlands and grasslands are distributed in strips in the mountainous areas of North China, and their habitat quality is excellent. According to Table 3, the water area is increasing, accounting for 4.3% by 2030. According to Figure 7, the habitat quality in coastal areas is high, and its area is increasing. Therefore, the change in habitat quality grade is closely related to the distribution of different land use types, and with the substantial increase in construction land area, overall habitat quality decreases.
3.4. Analysis of Center of Gravity Shift of Habitat Quality
After analyzing the distribution and change in land use and the spatial and temporal changes in habitats, it can be found that there is little difference between 2015 and 2020. In order to explore the movement of the center of gravity of habitats more intuitively, the shift of the center of gravity from 2010 to 2030 was analyzed at intervals of 10 years. Based on the principles of Formulas (3)–(5), using the direction distribution and average center of gravity tools of GIS10.2, the moving map of the center of gravity of habitat can be obtained (Figure 8). The center of gravity of the habitat is in the northern part of the study area. From 2010 to 2030, the center of gravity of the habitat moved 55,607.67 m to the northeast and then 155,532 m to the southwest. In the past 20 years, the center of gravity of the habitat moved 135°27′ 28″ in longitude and 26°4′5″ in latitude, with a total movement of 106,715.33 m to the south. The location moved from Fengning Manchu Autonomous County to the junction of Fengning Manchu Autonomous County and Longhua County and then moved to Mentougou District, Beijing. The expansion of construction land area destroys biological communities in the land, breaks the balance of the corresponding land ecosystem, and leads to the decline or disappearance of the original habitat. With the decline in the average habitat quality, the center of gravity of the habitat moves to the middle. As can be seen from Figure 8, the center of gravity of the habitat moves to the north first and then to the middle by a large margin, which indicates that the distribution of the overall habitat grade has changed significantly. Between 2010, 2020 and 2030, the center of gravity of the habitat moves to the north, which indicates that the quality of the northern habitat is dropping faster than that of the southern one. Urbanization not only represents economic development but also reflects the fragmentation of habitats. From 2010 to 2020, the circular expansion of construction land in Beijing and Tianjin achieved the purpose of alleviating urban pressure. The urbanization rate in the central and southern areas of Hebei was lower than that around Beijing and Tianjin, so the habitat in the north declined rapidly, resulting in the habitat center shifting to the north. From 2020 to 2030, the habitat center of gravity moved to the central part of China, which showed that the habitat quality in the southern part of China declined faster than that in the northern part. In the past 10 years, urban areas expanded rapidly, and a large amount of cultivated land was occupied in the central and southern parts of China, and forests and grasslands in the central and southern parts were relatively small, some of which were converted into construction land, which aggravated the decline in quality of the southern part of China’s habitat. Therefore, the habitat center of gravity shifted to the central part.
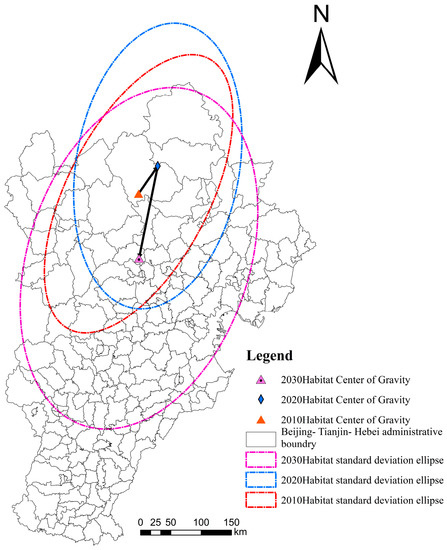
Figure 8.
Moving map of habitat quality center of gravity in the Beijing–Tianjin–Hebei region from 2010 to 2030.
4. Discussion
Combining the InVEST model and CA–Markov model, we predicted the land use layout in 2030 according to the present situation of land use, visualize the habitat situation from 2010 to 2030, and provided reference for improving the ecological environment and reducing the fragmentation of land habitats. The calculation of Kappa coefficient verifies the accuracy of the CA–Markov model, and the results of habitat module operation in InVEST model are consistent with those of Chang Yuxi and Wu Jiansheng [27,31]. It shows the stability of the model and increases the rationality of the results. The combination of models better reveals the evolution of land use structure and habitat under current development conditions. In the periods 2010–2015 and 2015–2020, the land use structure changed significantly, and the land use types continued to transform. In the past 10 years, due to the increasing urban pressure in Beijing and Tianjin, the influx of a large number of migrant workers has led to a substantial increase in construction land, rising by 2.4%, and the threat index of construction land is higher than other land types. Forest and grassland are distributed in higher altitude areas, including Yanshan Mountain and Taihang Mountain, with the forest land area increasing by 0.20 × 10⁶ ha and grassland area decreasing by 0.28 × 10⁶ ha, and cultivated land being mainly distributed in the North China Plain and Bashang Plateau. Because it is difficult to develop unused land and the area suitable for cultivated land is limited, the expansion of construction land will inevitably compress the agricultural land in the suburbs of cities and towns, resulting in a significant reduction in cultivated land area, while other land types experience a small change. On the premise of realizing the modernization of agriculture, industry, science and technology, and national defense, developing the economy can provide financial support for subsequent development. However, in the face of huge population pressure, how to adjust land use patterns, improve land use patterns, and balance the relationship between ecology, economy and production has become an important challenge. In this study, it was found that in the period 2010–2015, the high land use dynamic degree indicates that human activities and economic changes were relatively strong at this stage. After 1990, the expansion rate of the Beijing–Tianjin–Hebei metropolitan area gradually decreased. From 2008 to 2020, the expansion rate of urban areas slowed down compared with the historical period [32], and the expansion of construction land covered other land types. Based on the principle of balancing occupation and compensation and maintaining ecology, the conversion rate of land types in the early stage was higher than that in the later stage.
Based on the present situation of land use and the prediction of future land use structure, the spatial and temporal changes and distribution of land quality were visualized using the habitat quality module in InVEST model. The Beijing–Tianjin–Hebei region is characterized by complex landform types, fragile ecosystems, prominent contradictions between humans and land, low coverage rate of regional forest land and single species forest land. In addition, there is a shortage of water resources and serious water pollution, and the development of regional ecological civilization still lags behind the level of economic development. From 2010 to 2030, the habitat gradually worsened. With the rapid worsening of the southern habitat, the center of gravity of the habitat moved greatly to the middle, and the poor-grade habitats with Beijing and Tianjin as the center increased greatly [2]. The degradation of habitat quality will cause the original ecological imbalance and affect the survival and development of human beings and other organisms. Land use pattern affects land use structure, and the change in land use structure not only affects the land use function but also determines the material and information flow transmission of land ecosystems. Therefore, in order to improve the situation of habitat decline, regional spatial development should be optimized and the expansion of city scales should be controlled. At the same time, we need to systematically monitor the urban, suburban, natural, semi-natural and artificial ecosystems, especially the priority habitats and endangered plant and fauna species, use new technologies supported by classic scientific cultivation and ecological methods, and create sustainable cities with the appropriate green infrastructure and especially a minimum of good quality green spaces ranging to 8-10 square meters per inhabitant. As the national capital economic circle, the Beijing–Tianjin–Hebei region has attracted much attention. Recently, the normalization mechanism of joint construction, joint prevention and the treatment of the ecological environment in the three places was formally established, but the problem of urban area expansion and rising population proportion has not been improved. The unbalanced development of the Beijing–Tianjin–Hebei region is one of the reasons that restricts ecological improvement. Some heavy industries are mainly distributed in county cities in the Hebei Plain, resulting in the overall southern habitat of the Beijing–Tianjin–Hebei region being lower in quality than the northern habitat. It is necessary to establish a development mode of regional circular accumulation and industrial division and cooperation. The expansion of cities and the loss of superior cultivated land have an impact on land habitat and the independence of food supplies. In the Beijing–Tianjin–Hebei region, afforestation is the main method. In order to improve the survival rate of forest and grassland, vegetation is planted according to local soil characteristics. Single-variety planting not only reduces soil quality, but also aggravates the occurrence of local crop diseases and insect pests. Therefore, it is necessary to stabilize the cultivated land area, improve cultivated land quality, strengthen the restoration of polluted cultivated land, establish mixed forests with the appropriate indigenous and endemic forest species following the principles of silviculture, avoid the single planting of forest and grassland varieties, and improve the ability of soil sand fixation and prevention.
Our research still has some limitations. We used the CA–Markov model to predict the land use structure in 2030, GIS to analyze the temporal and spatial changes in land use types in 2010, 2015, 2020 and 2030, and visualized the habitat distribution in 2010–2030 through InVEST model. This method is simple and easy to operate, and effectively reflects the impact of land use structure changes on land habitats. However, the parameters in the model have no uniform values and are subjective, which leads to the deviation of the results to some extent. This study mainly reflects the impact of land use change on habitat, without considering the impact of climate, economy and human activities. In future research, these indicators can be included in a multi-level analysis.
5. Conclusions
Through the study, it is found that the distribution trend of land use in the Beijing–Tianjin–Hebei region is basically unchanged from 2010 to 2030, and the area has changed greatly. Cultivated land is the main type in the study area, followed by woodland. Through calculation and analysis, the area of cultivated land has dropped sharply, and the area of woodland and grassland has changed slightly. Due to the transfer of other land types, the area of construction land has increased significantly, and the area of water areas has increased slightly. In 2010–2020, land type transformation mainly occurred in 2010–2015, mainly between cultivated land, construction land, forest land, water area and unused land. Compared with the single land use dynamic attitude from 2010 to 2020, it can be concluded that the transfer rate of construction land is much higher than other land types, and the transfer rate of grassland is the lowest. The average habitat quality index of the study area in 2010, 2015 and 2020 was 0.57, 0.56 and 0.55, respectively, and the habitat quality level was moderate and kept declining. From 2010 to 2030, the habitat grade in the coastal areas of Tianjin, Cangzhou, Tangshan and Qinhuangdao gradually changed from poor and medium grade to excellent grade, and there was a trend to internal expansion. The differential grade spreads from the south of Beijing to the surrounding areas, and will form a concentrated distribution in Beijing, Baoding, Shijiazhuang, Tianjin and Handan by 2030; although the strip distribution area of excellent grade habitats in mountainous areas of North China has increased, it is still lower than the medium area. The shift of the habitat center of gravity in 2010, 2020 and 2030 was analyzed. The habitat center of gravity was in the northern part of the study area, moved from Fengning Manchu Autonomous County to the junction of Fengning Manchu Autonomous County and Longhua County, and then moved to the Mentougou District of Beijing. On the whole, the quality of habitat in the northern part was better than that in the southern part.
Our research provides information reference for sustainable land use and the improvement of the land ecological environment in the Beijing–Tianjin–Hebei region, which is beneficial to the scientific planning of land space in the later period. Corresponding measures should be taken to reduce cultivated land, continuously expand construction land and gradually decrease habitat. In order to improve the decline of habitats, optimize regional spatial development, control the expansion of cities and systematically monitor urban, suburban, natural, semi-natural and artificial ecosystems, use new technologies supported by classical scientific cultivation and ecological methods and create sustainable cities with appropriate green infrastructure. Establish a development mode of regional circular accumulation and industrial division and cooperation. Stabilize the cultivated land area, improve the quality of cultivated land, strengthen the restoration of polluted cultivated land, avoid the single planting of forest and grassland varieties, and improve the ability of soil to fix and prevent sand.
Author Contributions
Conceptualization, Methodology, Funding Acquisition, L.Z.; Software, Investigation, M.S.; Formal analysis, X.W.; Writing—original draft, X.C. and X.L.; Writing—Review and Editing, P.Z. All authors have read and agreed to the published version of the manuscript.
Funding
This paper is funded by the Research Project of Social Science Development in Hebei Province in 2022 (Grant No. 20220202227).
Institutional Review Board Statement
Not applicable.
Informed Consent Statement
Not applicable.
Data Availability Statement
All data generated or analyzed during this study are included in this published article.
Acknowledgments
The authors would like to thank the anonymous reviewers for their constructive comments on improving this research.
Conflicts of Interest
The authors declare no conflict of interest.
References
- Zhong, C.; Bei, Y.; Gu, H.; Zhang, P. Spatiotemporal Evolution of Ecosystem Services in the Wanhe Watershed Based on Cellular Automata (CA)-Markov and InVEST Models. Sustainability 2022, 14, 13302. [Google Scholar] [CrossRef]
- Deng, Y.; Jiang, W.; Wang, W.; Lv, J.; Chen, K. Urban expansion leads to the decline of habitat quality in Beijing-Tianjin-Hebei region. Acta Ecol. Sin. 2018, 38, 4516–4525. [Google Scholar]
- Zhu, S.; Li, L.; Wu, G.; Liu, J.; Slate, T.J.; Guo, H.; Li, D. Assessing the Impact of Village Development on the Habitat Quality of Yunnan Snub-Nosed Monkeys Using the INVEST Model. Biology 2022, 11, 1487. [Google Scholar] [CrossRef] [PubMed]
- Li, Y.; Duo, L.; Zhang, M.; Yang, J.; Guo, X. Habitat quality assessment of mining cities based on InVEST model—A case study of Yanshan County, Jiangxi Province. Int. J. Coal Sci. Technol. 2022, 9, 28. [Google Scholar] [CrossRef]
- Sun, X.; Yu, Y.; Wang, J.; Liu, W. Analysis of the Spatiotemporal Variation in Habitat Quality Based on the InVEST Model- A Case Study of Shangri-La City, Northwest Yunnan, China. J. Phys. Conf. Ser. 2021, 1961, 012016. [Google Scholar] [CrossRef]
- Ye, S.; Song, C.; Shen, C.; Gao, P.; Cheng, C.; Cheng, F.; Wan, C.; Zhu, D. Spatial pattern of arable land-use intensity in China. J. Land. Use. Pol. 2020, 99, 104845. [Google Scholar] [CrossRef]
- Yang, W.; Long, D.; Bai, P. Impacts of future land cover and climate changes on runoff in the mostly afforested river basin in North China. J. Hydrol. 2019, 570, 201–219. [Google Scholar] [CrossRef]
- Zhang, D.; Wang, J.; Wang, Y.; Xu, L.; Zheng, L.; Zhang, B.; Bi, Y.; Yang, H. Is There a Spatial Relationship between Urban Landscape Pattern and Habitat Quality? Implication for Landscape Planning of the Yellow River Basin. Int. J. Environ. Res. Public Health 2022, 19, 11974. [Google Scholar] [CrossRef] [PubMed]
- Dong, J.; Zhang, Z.; Liu, B.; Zhang, X.; Zhang, W.; Chen, L. Spatiotemporal variations and driving factors of habitat quality in the loess hilly area of the Yellow River Basin: A case study of Lanzhou City, China. J. Arid. Land 2022, 14, 637–652. [Google Scholar] [CrossRef]
- Zhang, Y.; Zhang, C.; Zhang, X.; Wang, X.; Liu, T.; Li, Z.; Lin, Q.; Jing, Z.; Wang, X.; Huang, Q.; et al. Habitat Quality Assessment and Ecological Risks Prediction: An Analysis in the Beijing-Hangzhou Grand Canal (Suzhou Section). Water 2022, 14, 2602. [Google Scholar] [CrossRef]
- Wang, J.; Li, L.; Li, Q.; Hu, S.; Wang, S. Monitoring Spatio-Temporal Dynamics and Causes of Habitat Quality in Yellow River Basin from the Perspective of Major Function-Oriented Zone Planning. Contemp. Probl. Ecol. 2022, 15, 418–431. [Google Scholar] [CrossRef]
- Wen, X.; Zhou, Z.; Zhang, M.; Zhang, P.; Zhang, G.; Zhang, Q. Identification of key areas for ecological restoration of land space in Taihang Mountain area—Taking Tangxian County as an example. J. Chin. J. Eco-Agric. 2021, 29, 2093–2106. [Google Scholar]
- Zhao, L.; Yu, W.; Meng, P.; Zhang, J.; Zhang, J. InVEST model analysis of the impacts of land use change on landscape pattern and habitat quality in the Xiaolangdi Reservoir area of the Yellow River basin, China. Land Degrad. Dev. 2022, 33, 2870–2884. [Google Scholar] [CrossRef]
- Wei, Q.; Mukadasi, A.; Abudureheman, H.; Yao, K.; Yao, L.; Tang, H.; Buweiayixiemu, T. Temporal and spatial variation analysis of habitat quality on the PLUS-InVEST model for Ebinur Lake Basin, China. Ecol. Indic. 2022, 145, 109632. [Google Scholar] [CrossRef]
- Gu, Y.; Lin, N.; Ye, X.; Xu, M.; Qiu, J.; Zhang, K.; Zou, C.; Qiao, X.; Xu, D. Assessing the impacts of human disturbance on ecosystem services under multiple scenarios in karst areas of China: Insight from ecological conservation red lines effectiveness. Ecol. Indic. 2022, 142, 109202. [Google Scholar] [CrossRef]
- Wu, J.; Luo, J.; Zhang, H.; Qin, S.; Yu, M. Projections of land use change and habitat quality assessment by coupling climate change and development patterns. J. Sci. Total Environ. 2022, 847, 157491. [Google Scholar] [CrossRef] [PubMed]
- Tang, F.; Fu, M.; Wang, L.; Zhang, P. Land-use change in Changli County, China: Predicting its spatio-temporal evolution in habitat quality. Ecol. Indic. 2020, 117, 1067. [Google Scholar] [CrossRef]
- Li, Z.; Ma, Z.; Zhou, G. Impact of land use change on habitat quality and regional biodiversity capacity: Temporal and spatial evolution and prediction analysis. Front. Environ. Sci. 2022, 10, 1041573. [Google Scholar] [CrossRef]
- Brown, G.; Brabyn, L. The extrapolation of social landscape values to a national level in New Zealand using landscape character classification. Appl. Geophys. 2012, 35, 84–94. [Google Scholar] [CrossRef]
- Boumans, R.; Roman, I.; Altman, I.; Kaufman, L. The Multiscale integrated model of ecosystem services (MIMES): Simulating the interactions of coupled human and natural systems. Ecosyst. Serv. 2015, 12, 30–41. [Google Scholar] [CrossRef]
- Yang, Y.; Tian, Y.; Zhang, Q.; Tao, J.; Huang, Y.; Gao, C.; Lin, J.; Wang, D. Impact of current and future land use change on biodiversity in Nanliu River Basin, Beibu Gulf of South China. Ecol. Indic. 2022, 141, 109093. [Google Scholar] [CrossRef]
- Tian, J.; Du, Z.; Jia, Q.; Jia, Q.; He, L. Spatial differentiation of habitat quality and its influencing factors in Taihang Mountain with different topographic gradients—A case study of Fuping County, Hebei Province. J. For. Ecol. Sci. 2022, 37, 426–436. [Google Scholar]
- Li, Y.; DUO, L.; Zhang, M. Spatio-temporal evolution and prediction of land use pattern and habitat quality based on CA-Markov and InVEST models—A case study of Nanchang City, Jiangxi Province. J. Res. Soil Water Conserv. 2022, 29, 345–354. [Google Scholar]
- Mohamed, A.; Worku, H. Simulating urban land use and cover dynamics using cellular automata and Markov chain approach in Addis Ababa and the surrounding. Urban Clim. 2020, 31, 100545. [Google Scholar] [CrossRef]
- Gong, J.; Xie, Y.; Cao, E.; Huang, Q.; Li, H. Integration of InVEST-habitat quality model with landscape pattern indexes to assess mountain plant biodiversity change: A case study of Bailongjiang watershed in Gansu Province. J. Geogr. Sci. 2019, 29, 1193–1210. [Google Scholar] [CrossRef]
- Ye, H.; Song, Y.; Xue, D. Multi-Scenario Simulation of Land Use and Habitat Quality in the Guanzhong Plain Urban Agglomeration, China. Int. J. Environ. Res. Public Health 2022, 19, 8703. [Google Scholar] [CrossRef] [PubMed]
- Chang, Y.; Gao, Y.; Xie, Z.; Zhang, T.; Yu, X. Evolution and correlation of habitat quality and landscape pattern in Beijing-Tianjin-Hebei region. China Environ. Sci. 2021, 41, 848–859. [Google Scholar]
- Zhao, L.; Zhang, G.; Zhu, Y.; Zhang, P.; Xu, H. Multi-functional transformation and characteristic analysis of land based on land use transformation—A case study of Tang County, Hebei Province. China Land. Sci. 2017, 31, 42–50+97. [Google Scholar]
- Liu, S.; Chen, S. Study on the driving force of the spatial-temporal change of Xiamen’s construction land based on the center of gravity measurement. J. Fujian Norml. For. Univ. 2009, 25, 10–13. [Google Scholar]
- Zhang, X.; Liu, Y.; Chen, X.; Long, L.; Su, Y.; Yu, X.; Zhang, H.; Chen, Y.; An, S. Analysis of spatial and temporal changes of vegetation cover and its driving forces in the Huainan mining area. J. Environ. Sci. Pollut. Res. 2022, 29, 60117–60132. [Google Scholar] [CrossRef]
- Wu, J.; Cao, Q.; Shi, S.; Huang, X.; Lu, Z. Spatio-temporal evolution of habitat quality in Beijing, Tianjin and Hebei based on land use change. China J. Appl. Ecol. 2015, 26, 3457–3466. [Google Scholar]
- Xu, X.; Tong, L.; Zheng, K.; Zhang, X. Spatio-temporal process of urban expansion in Beijing-Tianjin-Hebei metropolitan area and its future scenario prediction. China J. Popul. Resour. 2012, 22, 256–261. [Google Scholar]


Disclaimer/Publisher’s Note: The statements, opinions and data contained in all publications are solely those of the individual author(s) and contributor(s) and not of MDPI and/or the editor(s). MDPI and/or the editor(s) disclaim responsibility for any injury to people or property resulting from any ideas, methods, instructions or products referred to in the content. |
© 2023 by the authors. Licensee MDPI, Basel, Switzerland. This article is an open access article distributed under the terms and conditions of the Creative Commons Attribution (CC BY) license (https://creativecommons.org/licenses/by/4.0/).