Article

Unraveling the Causal Mechanisms for Non-Grain Production of Cultivated Land: An Analysis Framework Applied in Liyang, China

1
College of Land Management, Nanjing Agricultural University, Nanjing 210095, China
2
National & Local Joint Engineering Research Center for Rural Land Resources Use and Consolidation, Nanjing 210095, China
3
China Resources, Environment and Development Academy, Nanjing 210095, China
*
Author to whom correspondence should be addressed.
Land 2022, 11(11), 1888; https://doi.org/10.3390/land11111888
Submission received: 6 September 2022 / Revised: 20 October 2022 / Accepted: 21 October 2022 / Published: 25 October 2022

Abstract

:
The excessive use of cultivated land for non-grain production activities is considered a threat to grain security. This study presents an analysis framework on unraveling the causal mechanisms for non-grain production of cultivated land. We apply the analysis framework in Liyang, which is located in the Yangtze River Delta and is also an important “national grain base” county of China. We first determine four non-grain production categories as immediately recoverable (IMR), simple-engineering recoverable (SER), engineering recoverable (ENR), and irrecoverable (IR) based on the effect of non-grain activities on the degree of soil damage of the cultivated land, especially the difficulty of restoring the capacity for grain production. Then, we analyze the spatial pattern features for non-grain production of four given categories at the village scale. Furthermore, we reveal the mechanisms of the four categories using multiple linear regression modeling with geophysical, demographic, economic, and policy variables. The results show that the total non-grain area of cultivated land in Liyang is 28,158.38 hectares, and the non-grain rate is 48.09%, ranging from 10.59% to 96.75% among villages. The IMR, SER, ER, and IR rates are 11.81%, 17.76%, 15.07%, and 3.45%, respectively. There is also a significant neighborhood effect among the four categories, indicating that non-grain production activities have a stimulating effect on the surrounding operators of cultivated land. Farming conditions such as the proportion of irrigated farmland and economic variables such as the tourism scale have stronger effects on non-grain production than demographic variables. Policy variables, especially the cultivated land transfer policy, neither inhibit nor promote non-grain production. Based on these findings, we make policy suggestions for reducing non-grain production activities and protecting cultivated land. This analysis framework contributes to a new perspective for unraveling the causal mechanisms and making categorical governance decisions of non-grain production on cultivated land at the village level.

1. Introduction

The 2015 United Nations Sustainable Development Summit released Transforming our World: The 2030 Agenda for Sustainable Development, and specifically SDG 2, to commit the international community to achieve zero hunger by 2030 through a renewed focus on agricultural development for food security and nutrition [1]. However, people affected by hunger in the world continue to increase in the shadow of the COVID-19 pandemic [2]. Achieving zero hunger by 2030 will not be achieved if recent trends continue [3,4]. Although China has a populous country with scarce cultivated land resources, it has long placed grain production as a high priority on the national political agenda and contributed to global grain security [5]. Cultivated land is the important carrier for grain production; both the quality and quantity of cultivated land are important guarantees for sustainable supply [6]. However, with rapid urbanization and economic development in recent years, the advantages of traditional grain production have been reduced, and cultivated land has become individualized by marketization [7,8,9]. The phenomenon of non-grain production on cultivated land has proliferated throughout rural in China [10,11]. As of 2018, there were 5.447 million hm2 of non-grain cultivated land in China, and the non-grain production rate was 32.9% [12]. Non-grain activities such as the pond farming of fish and shrimp and the cultivation of eucalyptus and poplar trees have had destructive effects on irrigation facilities, fertility, and the soil tillage layer, making future cultivation difficult [13,14]. Cultivated land has also been occupied for non-grain-related activities such as rural tourism and farmhouse entertainment [15]. Excessive non-grain production would not only reduce the total area of cultivated land for grain production but also destroy the quality of cultivated land and have a negative impact on grain production and security [16]. In the context of the Sustainable Development Goals and the COVID-19 pandemic, China increasingly faces a contradiction between a huge demand for grain and excessive non-grain production that threatens both national and international grain security [17]. In 2020, China’s General Office of the State Council issued the “Opinions on Preventing Non-Grain Activities and Stabilizing Grain Production of Cultivated Land” (http://www.gov.cn/zhengce/, accessed on 4 November 2020) to reflect the resolution of the Chinese government to safeguard national grain security.
The above information has led to the question of “What is non-grain production on cultivated land?” Some studies have described it as planting traditional cash crops such as oil, sugar, vegetables, and melons on cultivated land [8]. Others have expanded it to include breeding, forestry, fruit industry, land abandonment, and leisure and tourism [11,18]. Based on the attributes of output products, non-grain production has been further divided into non-grain food (edible cash crops, including vegetables, fruits, sugar, and fish), non-edible agricultural products (e.g., fast-growing poplar, fast-growing eucalyptus, green flowers, and seedlings), and non-agricultural products (tourism, farmhouse entertainment, and infrastructure) [14].
To measure non-grain production on cultivated land, most studies have used the “non-grain ratio”, which is the proportion of non-grain crops area to the area of total crops sown or the total cultivated land area [8,19]. However, grain production is regional and seasonal, and there are differences in farming systems among regions. Thus, if only the non-grain ratio is used for calculation, it may lead to a bias prejudice in which areas with greater sowing frequency under the same amount of arable land have higher levels of non-grain production. Therefore, the suitability of the non-grain ratio as a measurement method has not been sufficiently verified.
The effects of the non-grain production of cultivated land have been shown to positively affect the agricultural economy, thereby bringing higher profits to operators [20,21]. Non-grain production can also provide goods and services that can meet various consumer demands [22]. However, because non-grain production can cause soil damage and nutrient loss, it can have negative effects on the grain-production potential of cultivated land [23,24]. In China, the strategy of “Storing Grain in the Land” refers to protecting the productive capacity of cultivated land and ensuring grain security in the future. Since non-grain production has different effects on cultivated land [14,25,26], it is necessary to divide non-grain production activities into given categories based on the degree of impact on the soil tillage layer. Few studies, however, have attempted such classification.
What causes non-grain production? Studies have variously focused on land-related factors (e.g., quantity, terrain, location, and irrigation facilities) [27], social and economic factors (industrial scale and structure, and labor force) [28,29], and the individual characteristics of land operators (age, education, cognition, and decision-making ability) [29,30]. Others have focused on policy effects such as grain subsidies [31] and prime farmland regulation [27]. Ultimately, land-use behaviors can be understood as the result of farmers balancing production risks and profits [32]. Some studies have analyzed the factors affecting non-grain production on a larger scale, noting that urban expansion [8], rising labor prices [33], and land transfer policies [34] all drive non-grain production on cultivated land. Others have suggested that capital flowing into the countryside has increased the scale of non-grain production [35]. However, there have been some contrary viewpoints: some believe that industrial and commercial capital flowing into the countryside has provided productive services that promoted the transfer of farmland to farmers and increased the input of mechanical factors, which was beneficial to farmers for expanding grain production [28]. At the village level, cultivated land use is affected by not only the individual attributes of operators but also the external influence of factors such as economic and policy decision-making by village chiefs and higher-level governments [27,36]. However, the ways in which natural, social, and economic factors affect non-grain production at the village level remains poorly understood.
We presented an analysis framework on unraveling the causal mechanisms for non-grain production of cultivated land, and applied it in Liyang, which is located in the Yangtze River Delta of China and is an important “commodity grain base” county, to address key questions: Where exactly do non-grain production activities take place in villages? How are the causal mechanisms for non-grain production activities of cultivated land revealed, and how are they governed in rural areas at the village level? Our goals include (i) classifying non-grain production activities on cultivated land into given categories, (ii) analyzing spatial pattern features of given non-grain production categories in villages, and (iii) revealing the causal mechanisms of each given non-grain production category. Finally, governance suggestions for non-grain production of cultivated land will be formed.

2. Materials and Methods

2.1. Study Area

Liyang county is located in the Yangtze River Delta of China. Its digital elevation model (DEM) value is 9–495 m, including low mountains, hills, and plains, among which the south has low mountains, the northwest is hilly, and the plains are distributed from west to east. Liyang has undergone rapid urbanization, with population, land, and economy flowing into the city faster than into other cities. The large amount of capital flowing into the countryside has promoted the rapid development of industries such as rural tourism and distinctive agricultural undertakings on cultivated land. From 2009 to 2020, the urbanization rate increased from 45.38% to 60.41%. Tourism has also developed rapidly, with the number of tourists increasing from 2.4 million to 19.3 million and tourism revenues increasing by more than 11 times. Liyang is also an important national grain base and cultivated land accounted for 28.92% (irrigation land: 26.34%) of the total in 2020. Liyang has successively built a number of characteristic product bases, including 43,000 hectares of high-quality grain and oil, 4600 hectares of tea, 4000 hectares of specialty fruits, and 13,000 hectares of aquatic products. It was selected as the third batch of advantageous areas of agricultural products with Chinese characteristics. However, the cultivated land area decreased by about 6%, the grain-planting area decreased by 5.9%, grain production decreased by 8.5%, and the loss of labor forces exceeded 31%. Liyang has experienced significant non-grain production expansion. This situation is a serious challenge for the local government and can be seen as a typical case of non-grain production in the rapid urbanization of major grain-producing regions of China. So, this study took Liyang as a case area since it can reflect the current situation of non-grain production in rapidly urbanizing grain-producing areas and provide a reference for the governance of similar regions—namely, those that are in the same stage of urbanization but must also supply grain, especially in the context of increasing instability (Figure 1). Furthermore, data availability in Liyang is good.

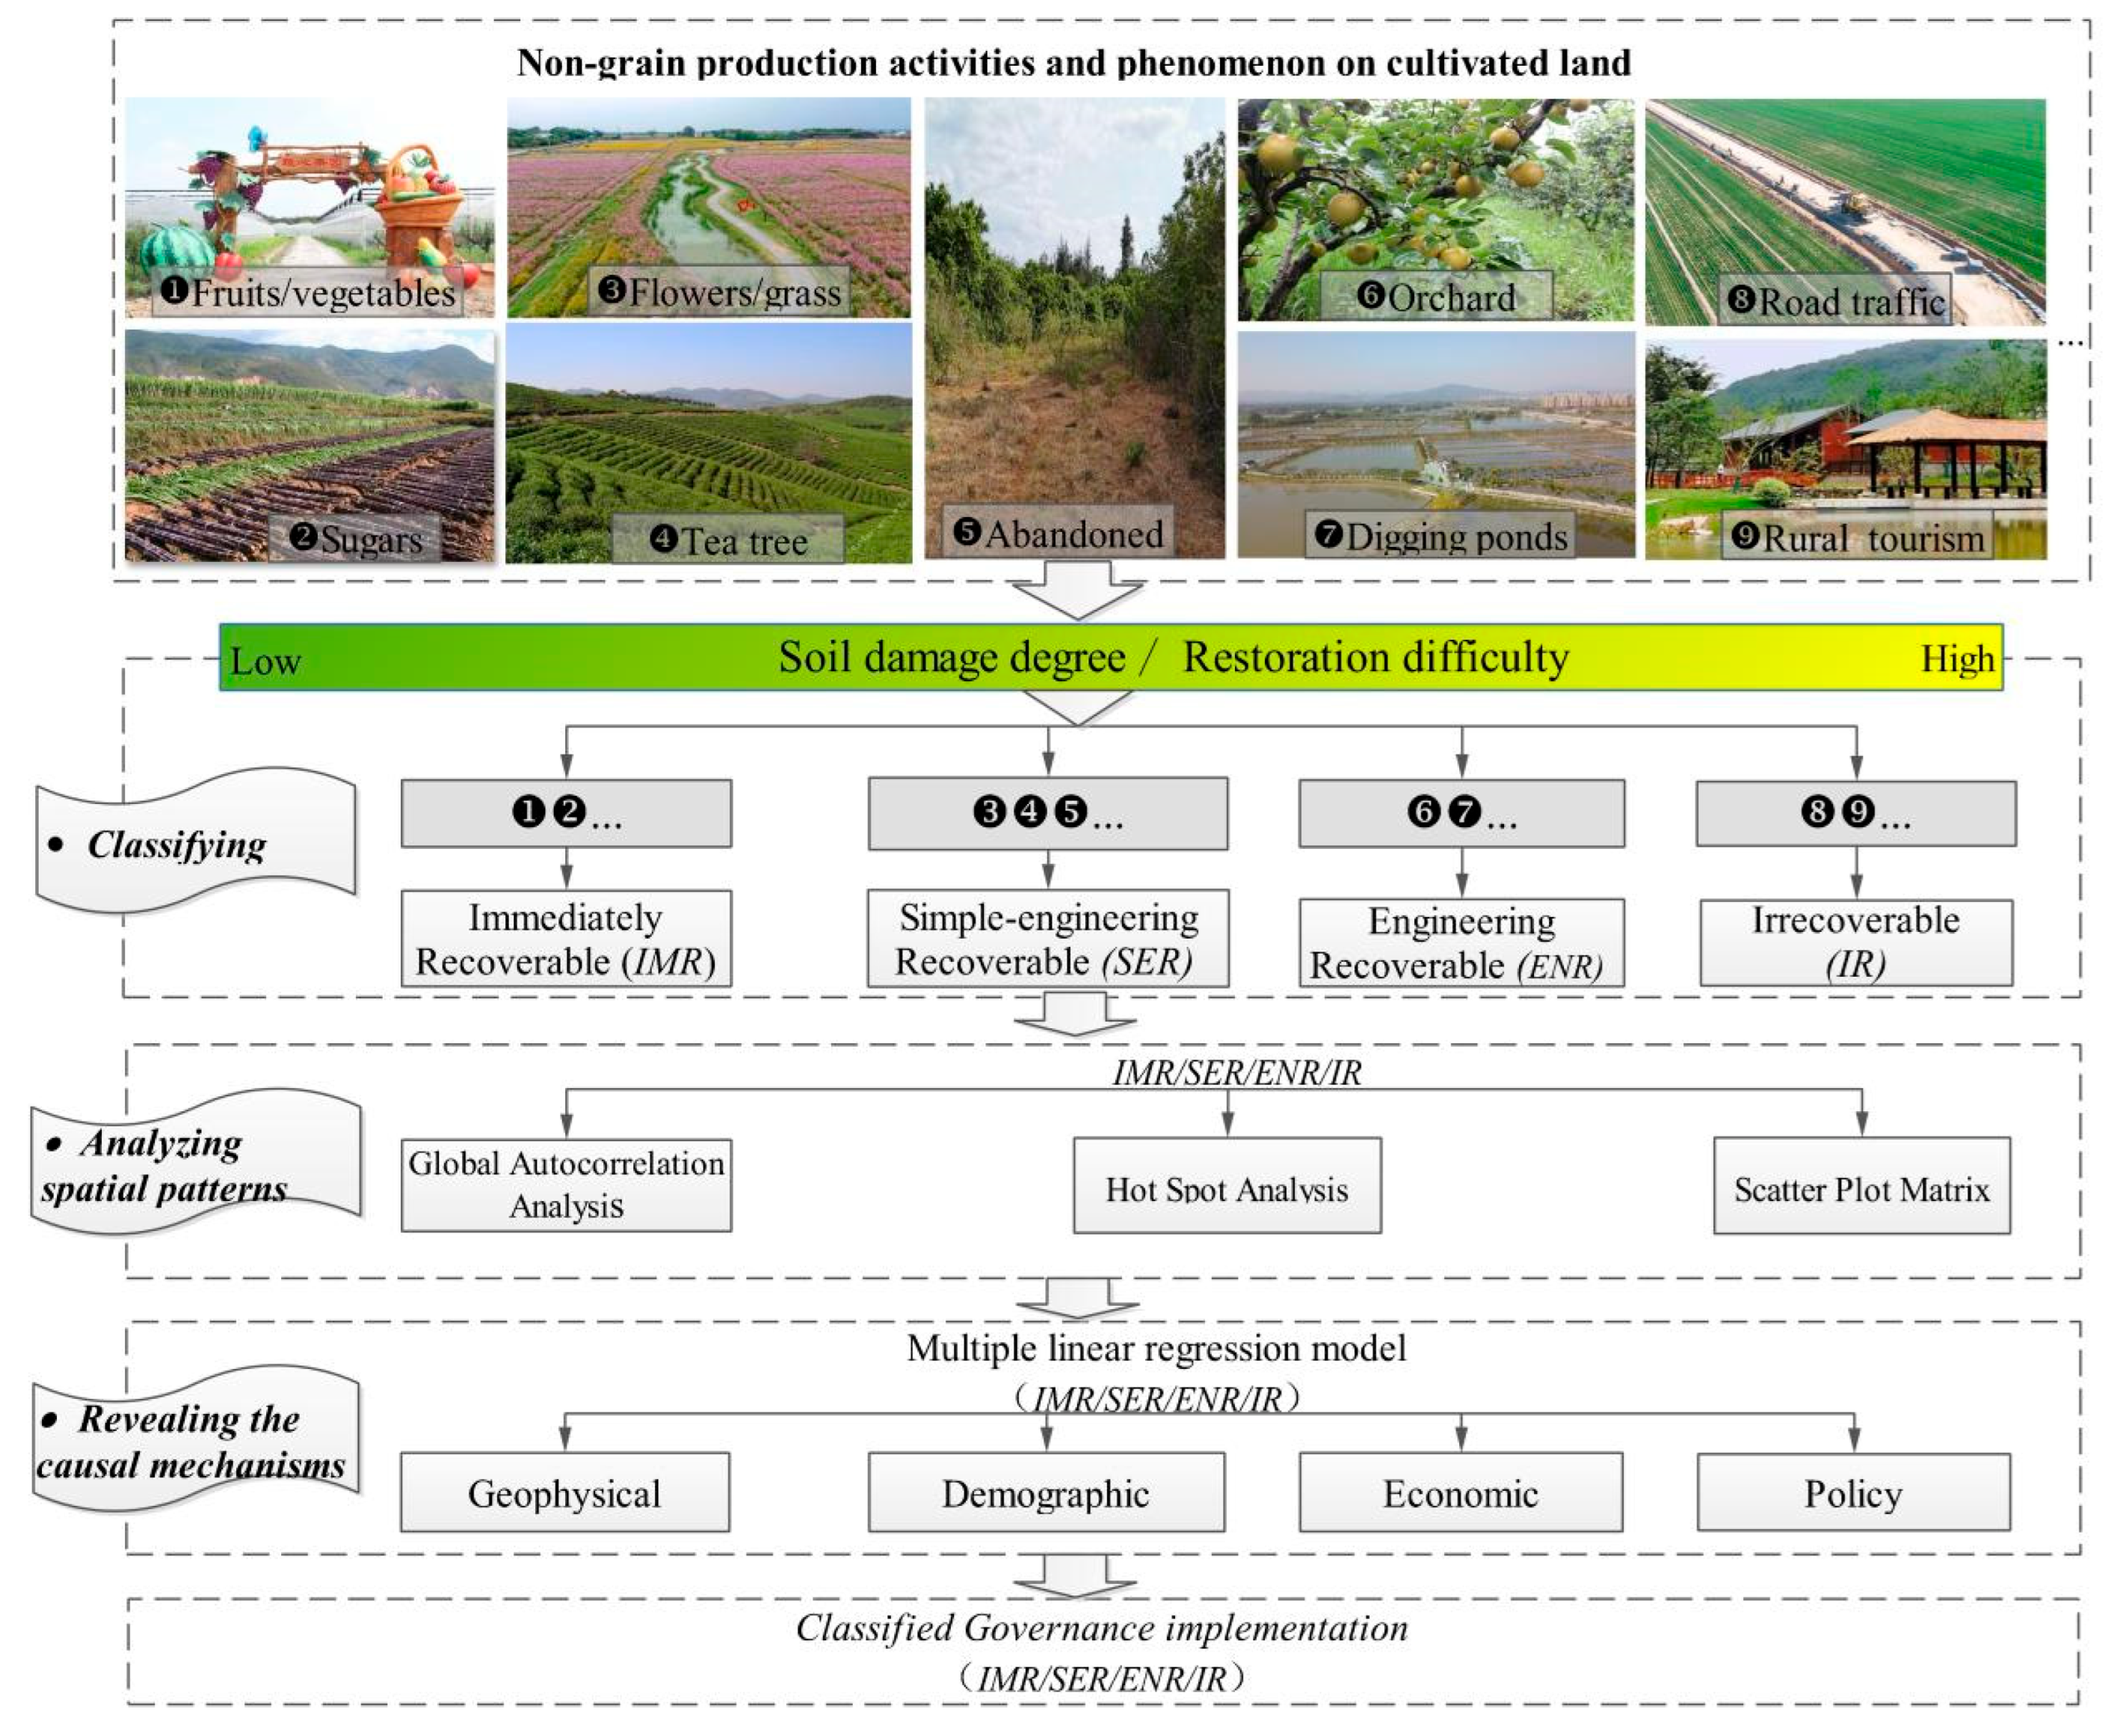
2.2. An Analysis Framework

Farmers and organizations make decisions about cultivated land based on balancing risks and profits [32,37]. In recent years, with agricultural industry adjustments, large differences have emerged between using cultivated land for cash crops or non-agricultural activities and using it for grain production [36]. Thus, operators usually prioritize non-grain production or non-agricultural activities over grain production to obtain higher profits [38]. However, excessive non-grain production can have negative effects on grain security for China and the international community. To ensure grain security, the government needs to take effective measures to prevent the continuation of non-grain production behaviors. In addition, when formulating measures, the government cannot ignore the fact that different non-grain production activities have different effects on soil layer quality [14]. For example, planting vegetables, sugars, or melons has little effect on the soil layer, but digging ponds for fish and shrimp breeding, planting shrubs, and using land for tourism can all harm or destroy the soil tillage layer, making it unsuitable for grain production [39]. The degree of soil layer damage can characterize the ability of cultivated land to provide fertility, water, and other nutrients for grain production [25]. The fact is consistent with China’s strategy of “Storing Grain in the Land”; the strategy aims to preserve the soil layer quality of cultivated land for grain production. Therefore, we propose that the government use damage degree and restoration difficulty as criteria to classify non-grain activities and enact related governance.
Generally, non-grain production refers to all non-grain activities on cultivated land. At the same time, the problem of the destruction of the cultivated soil layer caused by non-grain production has become increasingly prominent [14]. There is a certain internal correlation between the non-grain production of cultivated land and the destruction of the tillage soil layer. For example, planting vegetables, fruits, and sugar will not destroy the tillage soil layer. However, digging fishponds and raising livestock will lead to the direct loss of it, especially because of agricultural facilities, such as buildings—the hardened ground will directly lose the soil layer and be irreversible [14,25]. As shown in Figure 2, we propose an analysis framework of a three-step process for unraveling the causal mechanisms for four non-grain production categories of cultivated land. So, first of all, we will classify four non-grain production categories according to the effect of non-grain activities on soil damage degree and the difficulty of restoring land for grain production. Then, we analyze spatial pattern features of the four given non-grain production categories in villages of Liyang through global autocorrelation, hotspots, and scatterplot matrix detecting, respectively. After that, using multiple linear regression, the causal mechanisms for each given category will be revealed. Finally, we will propose strategies for governing excessive non-grain production activities in local and other similar regions.

2.3. Classifying and Extracting Non-Grain Production Categories

At present, there is no quantitative standard for determining the damage of cultivated soil layer caused by non-grain production on cultivated land. We refer to the existing related studies [14,25,40,41,42], and choose the qualitative methods to classify non-grain production into four categories based on the degree of damage to cultivated land and the difficulty of restoration. We classified non-grain activities as immediately recoverable, simple-engineering recoverable, engineering recoverable, and irrecoverable.
Immediately recoverable (IMR) refers to the cultivation of cash crops such as vegetables, oil, seeds, sugars, and melons on cultivated land in the form of perennial crops or crop rotation. There is no negative effect on the soil tillage layer. This land can be switched to grain production without restoration costs.
Simple-engineering recoverable (SER) refers to cultivated land that is abandoned or used to plant flowers, grass, tea trees, or shrubs. The soil layer has suffered slight damage, and grain production can be restored at relatively little cost.
Engineering recoverable (ENR) refers to cultivated land where trees have been planted or ponds have been dug to raise fish and shrimp, resulting in significant soil loss or destruction. Restoring the land for grain production requires significant engineering and technology costs.
Irrecoverable (IR) cultivated land has been used to build settlements, roads, and industrial or commercial infrastructures. The soil tillage layer is completely lost and cannot be restored for agricultural production.
Using information from the third land survey of Liyang in 2020, the classification method was as follows: cash crops and grain rotation on cultivated land were categorized as IMR; gardens, forestland, and aquaculture arising from adjustments to the industrial structure were considered ENR; remaining gardens, forestland, and grassland, as well as abandoned farmland, arising from changes to cultivated land, were categorized as SER; and cultivated land that became construction land was considered IR. Figure 3 shows the method for classifying the four non-grain production categories.
The non-grain production rate for each category refers to the proportion of cultivated land area to the total cultivated land area in a village for the corresponding non-grain category:
PIMR = (s5 + s6/r)/S × 100%
PSER = (s3 + s4)/S × 100%
PENR = (s2 + s8)/S × 100%
PIR = s1 +/S × 100%
P = (s1 + s2 + s3 + s4 + s5 + s6/r + s8)/S × 100%
where PIMR, PSER, PENR, and PIR, are the non-grain rates of four given categories; S is the area of cultivated land in 2009; s1, s2, s3, s4, s5, s6, and s8 are the areas of several types of non-grain production (Figure 3); and r is the number of rotations. r = 2, according to the actual crop rotation system in Liyang.

2.4. Analyzing Spatial Patterns of Four Categories

Specifically, we used the exploratory spatial data analysis (ESDA) functions of global spatial autocorrelation analysis and hotspot detection. The global Moran’s I calculated based on the non-grain rates of all units (villages) for four given categories was used to evaluate the spatial non-grain production pattern. We explore non-grain production hotspots through local Getis–Ord G i * statistics [43]. The goal of the hotspot analysis tool is to identify areas with statistically significant clustering. The p-value corresponds to the significance level, which can be understood as the probability level of obvious failure of the hypothesis. The corresponding confidence levels are respectively converted to 90%, 95%, and 99%, and the higher the confidence, the more confident the hypothesis [44].

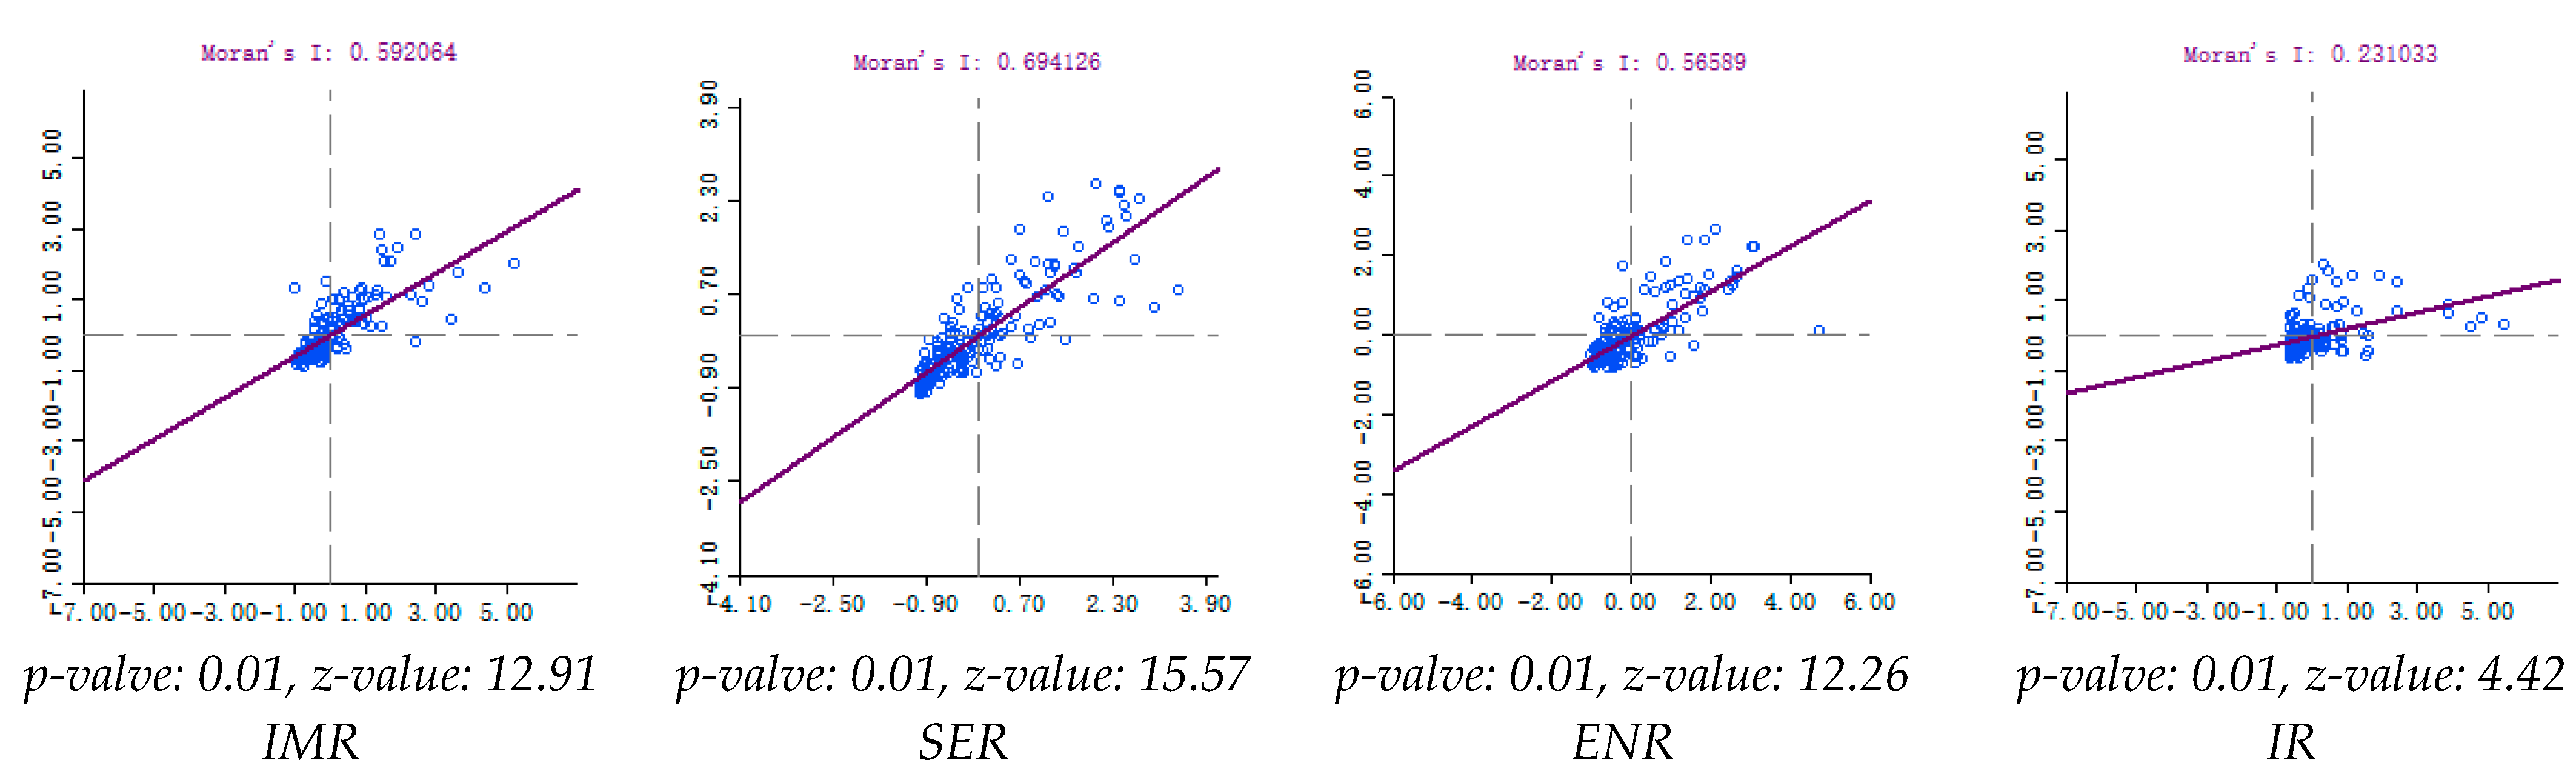
2.4.1. Spatial Autocorrelation Analysis

Spatial autocorrelation tests whether a unit’s observations are correlated with its neighbor’s observations, including global autocorrelation and local autocorrelation. Global autocorrelation is usually measured by the global Moran’s I index to reveal the overall distribution of the spatial unit’s observations and determine whether there are spatial agglomerations or outliers at the overall level [45]. The formula is as follows:
I = n S 2 × i = 1 n j = 1 n w i j ( p i p ¯ ) i = 1 n j = 1 n w i j  
S 2 = i = 1 n ( p i p ¯ ) / n
where n is equal to the total number of units (villages), pi and pj are the observation values (non-grain rates) of area units i and j, respectively, p ¯ is the mean value of pi, wij is the space weight matrix, and S2 is the sum of all elements of the spatial weight matrix, which is the core of the ESDA-based spatial analysis [46]. A binary-symmetric spatial weight matrix (wn×n) is determined based on either the adjacency standard or the distance standard. In this study, the adjacency standard is adopted. That is, when there is a shared side between two adjacent units i and j, then wij = 1; otherwise, wij = 0. The standardized Moran’s I is tested through z statistics. The Moran’s I index is between −1 and 1. Moran’s I > 0 means the unit’s observations are spatially agglomerated; Moran’s I < 0 means the observations are discretely distributed; Moran’s I = 0 means the observations are randomly distributed [47].

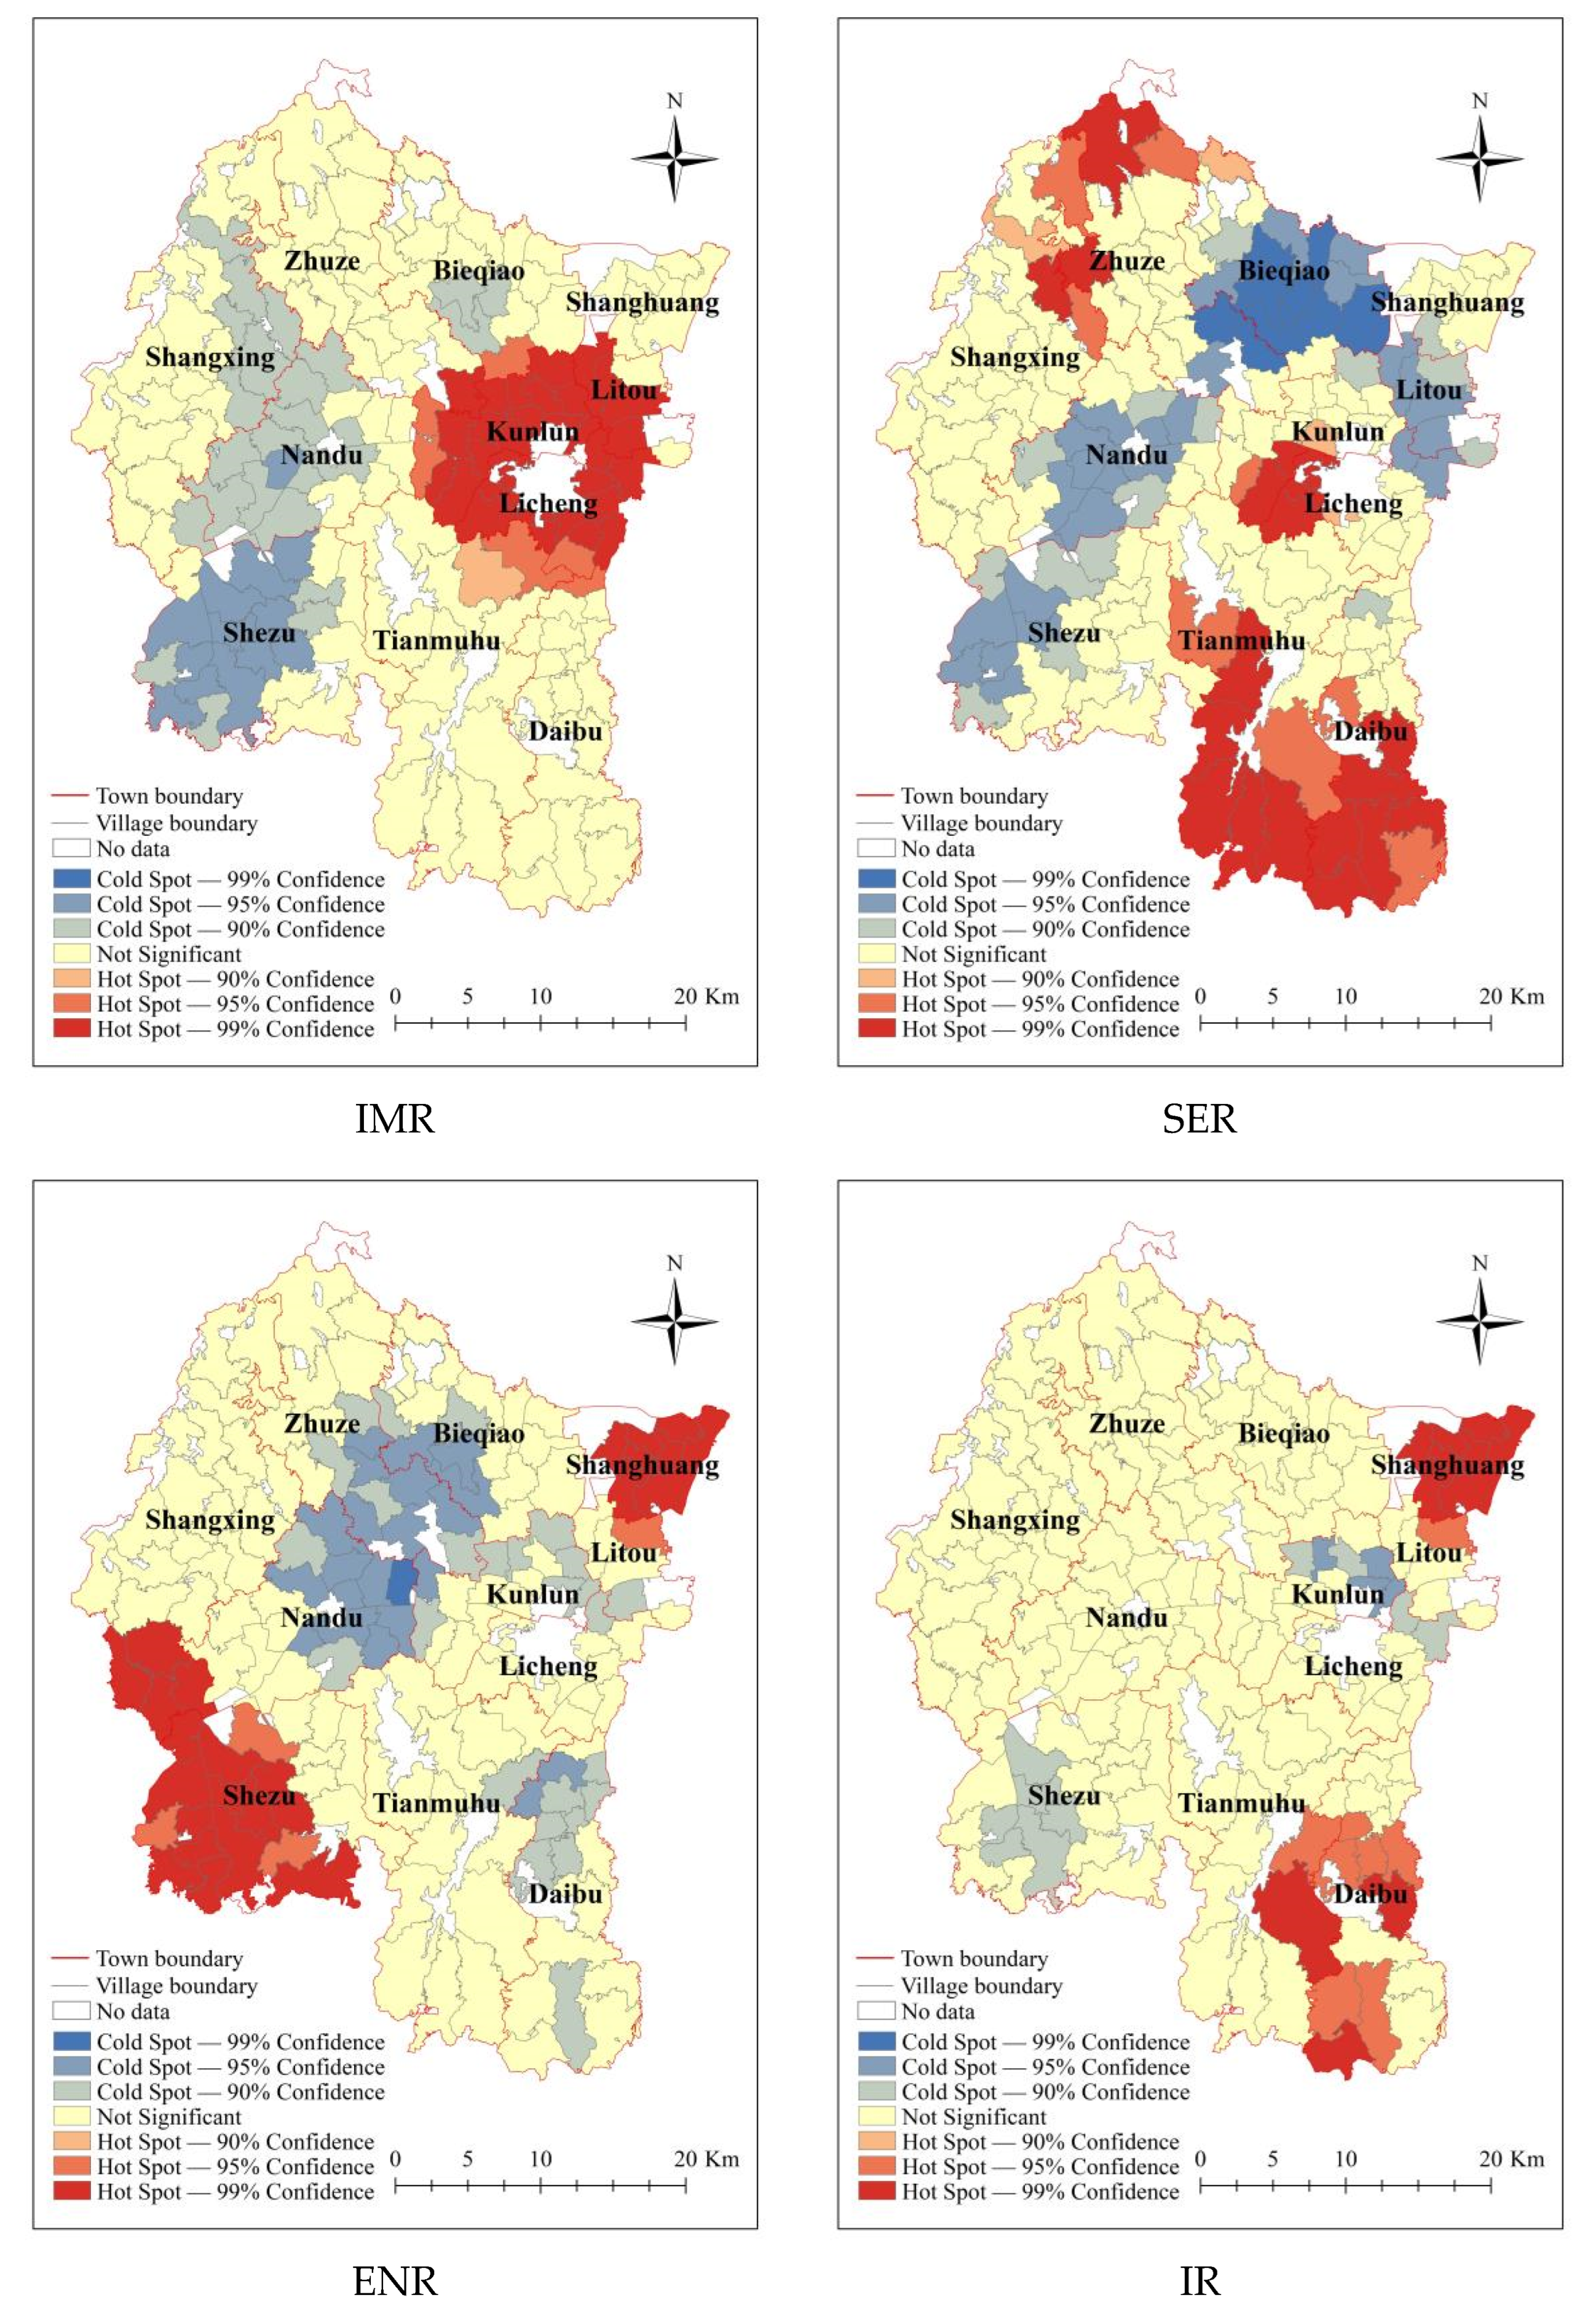
2.4.2. Spatial Hotspot Analysis

Global spatial autocorrelation analysis can reveal the spatial agglomeration characteristics of the data as a whole but cannot reflect the spatial agglomeration of data in local areas. Therefore, we used the Getis–Ord G i * statistic to identify hot/cold spots [48]. The formula is as follows:
G i * = j = 1 n w i j p j p j = 1 n w i j ¯ [ j = 1 n p j 2 / n ( p ¯ ) 2 ] × [ n j = 1 n w i j 2 ( j = 1 n w i j ) 2 ] / ( n 1 )
where G i * is the Getis–Ord local statistic; pj is the observed value of spatial unit j, wij is the spatial weight matrix of units i and j, which represents the proximity relationship between them, and n is the sum of all elements of the spatial weight matrix. To standardize G i * for the convenience of comparison, it can be transformed into:
Z ( G i * ) = G i * E ( G i * ) V a r ( G i * )
where E( G i * ) is the mathematical expectation of G i * (i.e., the Getis–Ord local statistic), and Var ( G i * ) is the variance of G i * . If the Z ( G i * ) values in unit i and its surrounding units are positively high (i.e., greater than the mean value), the spatial cluster forms a hotspot zone.

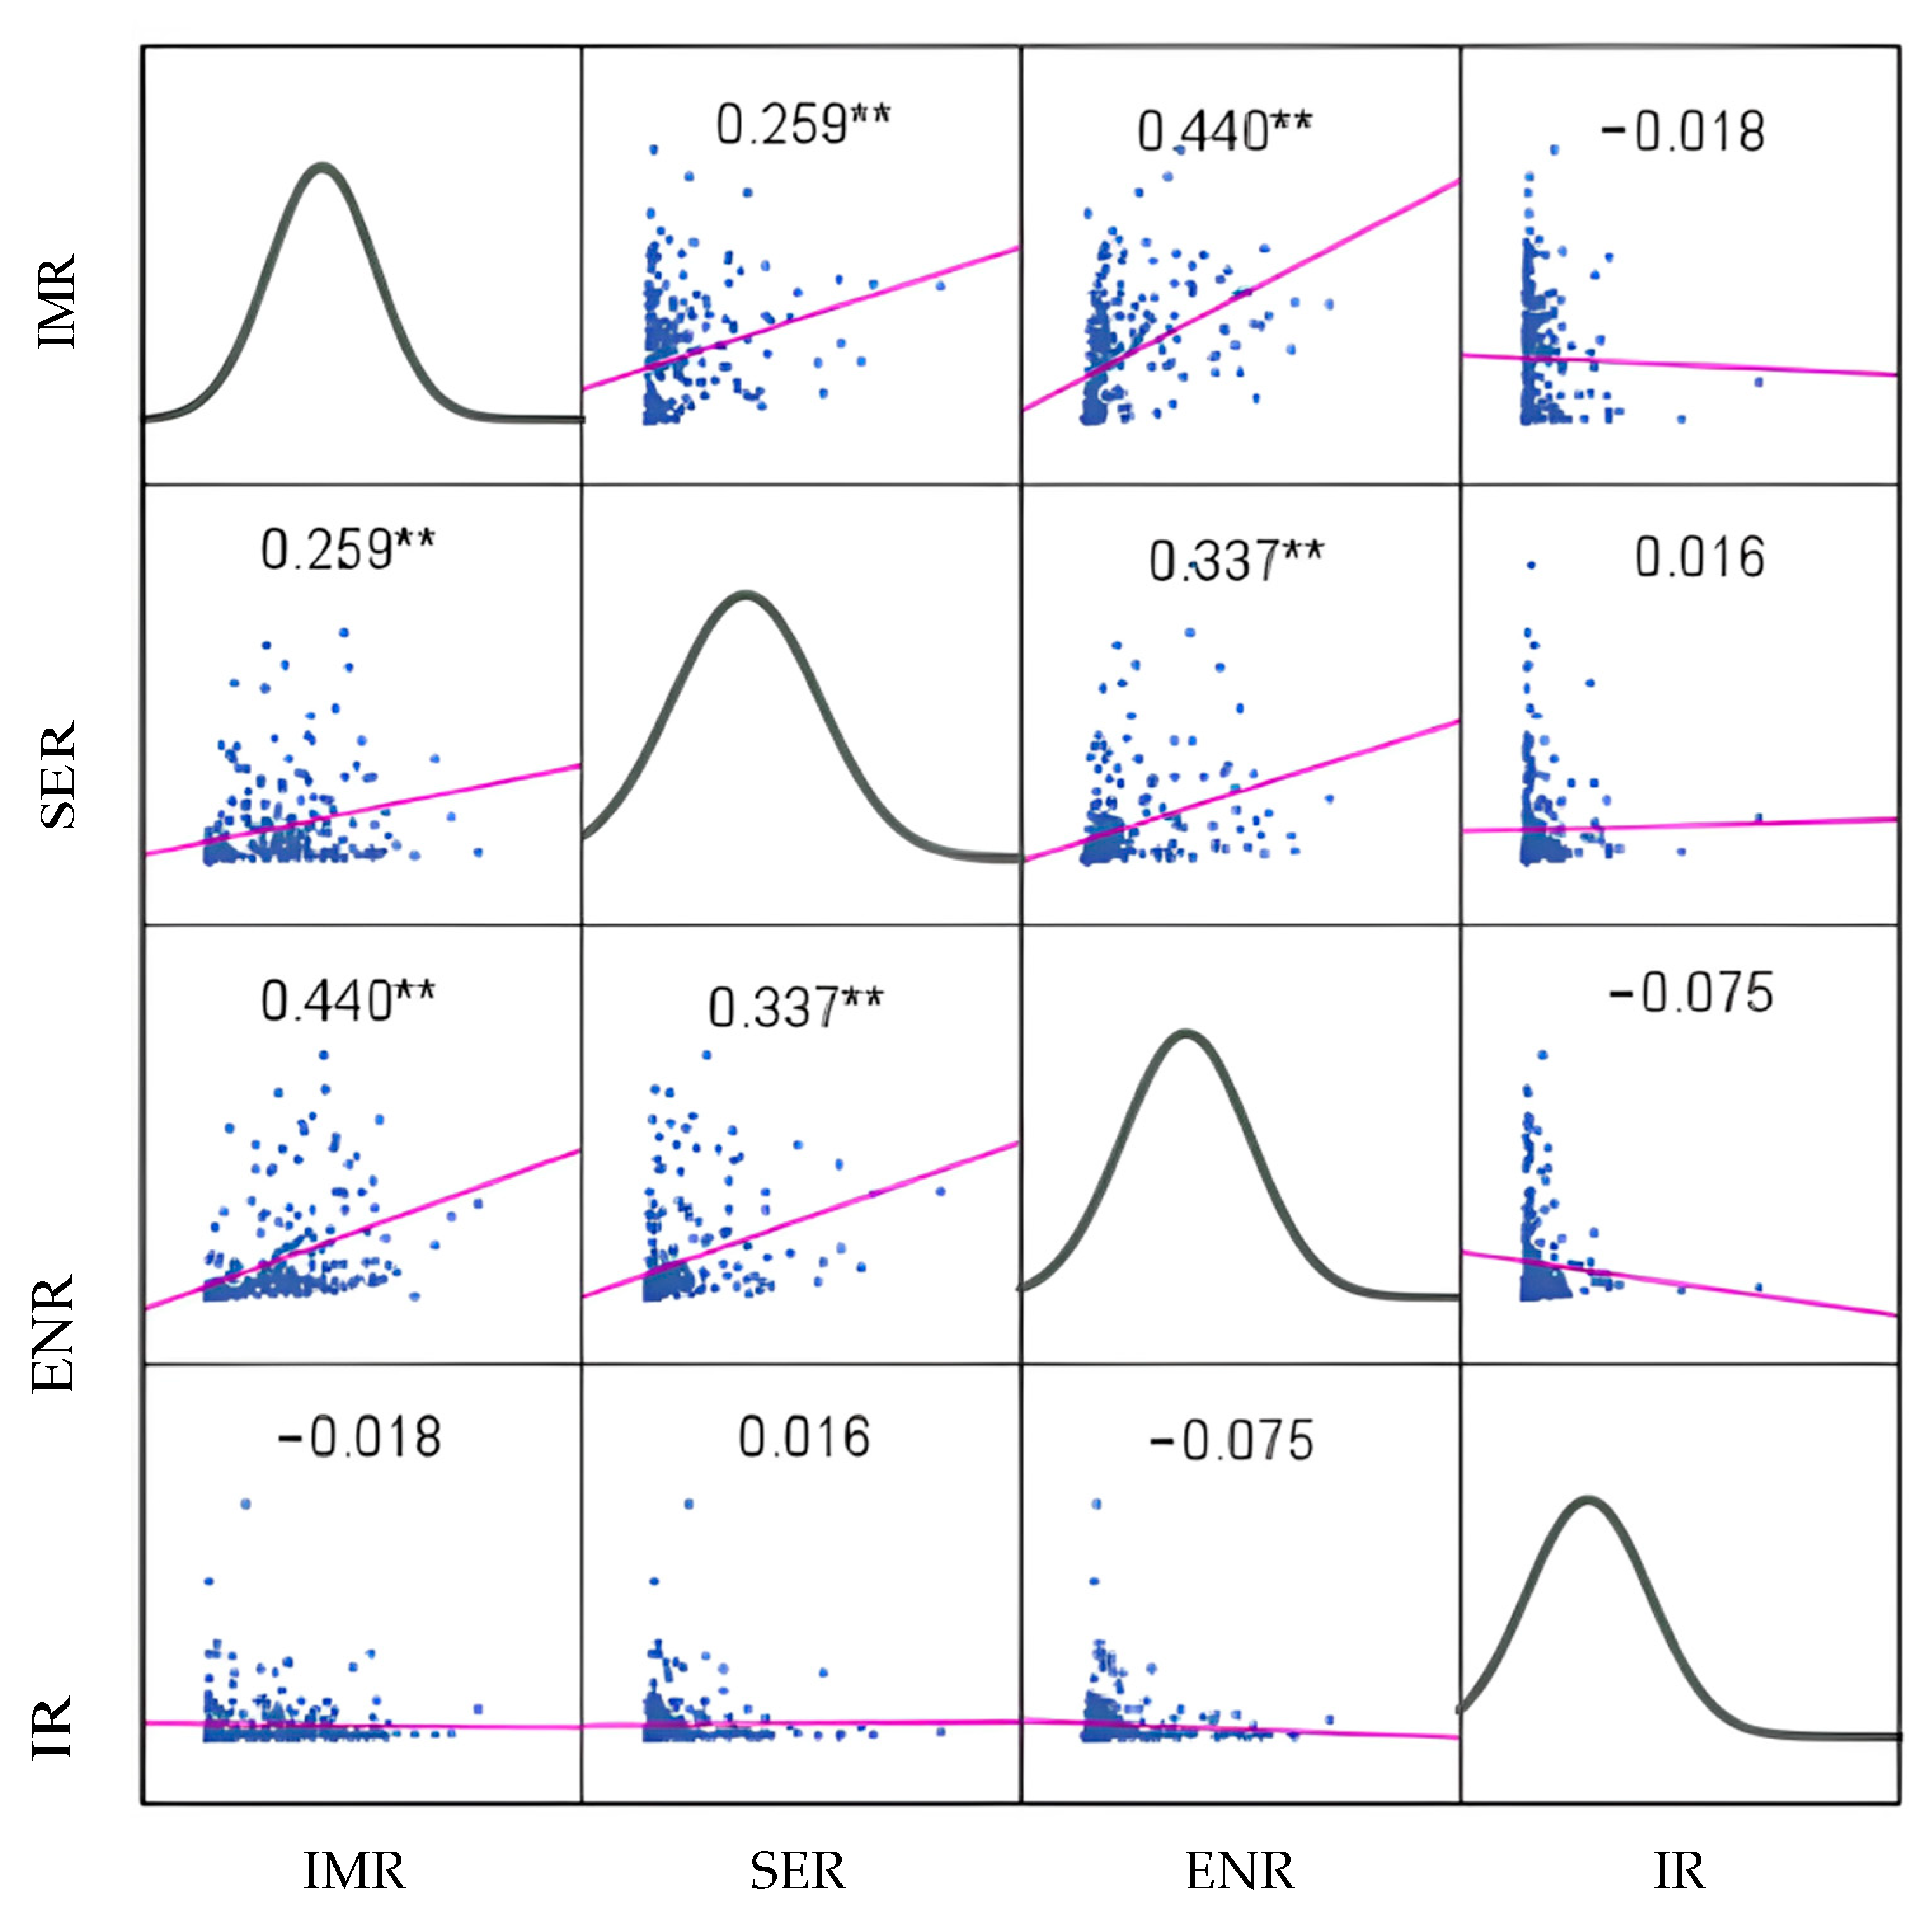
2.4.3. Scatterplot Matrix

A scatterplot matrix is commonly used for high-dimensional data visualization. It combines high-dimensional data into a scatterplot for every two variables and then forms them into a scatter matrix in a certain order. In this way, the relationships among the four non-grain production categories in the high-dimensional data can be shown in pairs [49].

2.5. Revealing the Causal Mechanisms of Four Categories

2.5.1. Factors Selection

Dependent variables: we chose the non-grain production rate as the dependent variable of the each given category. Independent variables: we chose indicators in terms of four aspects—geophysical, demographic, economic, and policy [50]—based on regional differences, scale characteristics, and data availability (Table 1).
Geophysical factors underlie the direction and scale of agricultural production. We prioritized terrain and cropland conditions (irrigated or non-irrigated) as two geophysical conditions. Distance plays an important role in land-use accessibility and costs [51]. Thus, we used the indicator “distance to town or city” to explore the influence of the land location condition variable.
Demographic factors pertained to land operators and village chiefs. Land operators’ determinants reflected the proportion of different land-use types according to labor force quantity, age, and education [52]. The village chief’s management experience is also an important factor in cultivated land protection [6]. Therefore, four variables were selected: proportion of population over 60 years old, proportion of labor force leaving the township for more than 6 months, proportion of operators with a high school education or above, and age of the village chief.
Economic factors included transportation facilities or industry, commerce, and tourism [28,36]. Importantly, commerce, industry, and tourism have all increased the demand for non-grain or non-agricultural production, stimulating non-grain activities on cultivated land [53]. However, machinery, technology, and capital can substitute for labor, reduce the cost of growing grain, and possibly alleviate non-grain production activity [28]. We chose four variables to explore the effect of economic variables on non-grain production: density of rural roads, industrial scale, commercial scale, and tourism scale.
In China, the farmland transfer and prime farmland protection policies have the most relevance for cultivated land use and protection [27]. Therefore, those two policies were selected to explore their relationship with non-grain production activities.

2.5.2. Multiple linear regression model

Multiple linear regression was used to reveal the causal mechanisms among each category of the dependent and independent variables [51]:
P l = a + β 1 x 1 + β 2 x 2 + + β i x i + ε
where Pl is the non-grain rate of given category l in one village (l = 1, 2, 3, and 4), xi is the value of the i factor, β1, β2, β3, … βn are the n + 1 parameter values to be estimated (i = 1, 2, … n), a is constant term, and ε is the random interference term.

2.6. Data Sources and Processing

Data for cultivated land in Liyang in 2009 came from China’s second national land survey. Data for land use in Liyang in 2020 came from China’s third national land survey. In addition, data and information for prime farmland were obtained from Liyang’s Natural Resources Bureau. Socioeconomic data used in this study included labor force quantity, age, and education, age of the village chief, and the scale of cultivated land transfer in each village. These data were all obtained from the County Rural Agricultural Statistical Yearbook of Liyang in 2020.
The most detailed statistics for Liyang were available at the village level; our statistical analysis covered 165 villages (Table 2).

3. Result Analysis

3.1. Spatial Patter Features of Four Non-Grain Production Categories in Liyang

3.1.1. Non-Grain Production Areas and Rates

There were 28,158.38 hectares of non-grain production area, of which 6915.17 hectares belonged to IMR, 10,399.10 hectares to SER, 8824.01 hectares to ENR, and 2020.09 hectares to IR. We also calculated the rates of different non-grain production categories in Liyang and the villages. The results showed that the comprehensive non-grain production rate was 48.09%, ranging from 10.59% to 96.75% in the villages. IMR, SER, ENR, and IR accounted for 11.81%, 17.76%, 15.07%, and 3.45%, respectively (Table 3). SER and ENR were the most widely distributed in Liyang.

3.1.2. Spatial Pattern Features of Four Categories

Global spatial autocorrelation analysis was performed using Moran’s I, and a Moran scatterplot was used for visualization. Figure 4 shows the Moran scatterplots of non-grain production, reflecting the global features of the spatial patterns of non-grain production rates. The z values were 12.91, 15.57, 12.26, and 4.42, respectively, indicating the significance test was passed. The global Moran’s I of the rates of IMR, SER, ENR, and IR were 0.592, 0.694, 0.566, and 0.231, respectively, indicating significantly positive spatial autocorrelation. In addition, a significant neighborhood effect was identified among IMR, SER, ENR, and IR in Liyang.
The maps in Figure 5 show the spatial hotspot and cold spot patterns of the four categories of non-grain production. While these clusters were dispersedly located in the administrative regions of Liyang, the distribution of hotspots and cold spots in each category was relatively concentrated in space. The IMR hotspots were concentrated around the urban area; SER was located in the south, central, and north regions; ENR was located in the east and west; and IR was located in the west and north regions. This reveals conspicuous regional disparities. Furthermore, spatial connections were observed among the four categories. In addition, most cold-spot clusters of IMR, SER, and ENR were relatively concentrated in the central region of Liyang.
We further verified spatial connections among IMR, SER, ENR, and IR in pairs (Figure 6). The results showed that although there was no relation between IR and the other three categories, there were positive relationships among IMR, SER, and ENR in pairs. There was a stronger relationship between IMR and ENR, followed by SER and ENR. This means that if there was ENR in a village, IMR and SER were easily found as well.
These results for spatial pattern relationships (including global spatial autocorrelation, hotpots, and the scatterplot matrix) showed significant neighborhood effects and spatial aggregation characteristics among the categories and in pairs.

3.2. Causal Mechanisms of Four Non-Grain Production Categories

The variance inflation factor (VIF) is a measure of the severity of multicollinearity in a multiple linear regression model. Our results showed that the VIF values of the variables were close to 1, indicating no multicollinearity problem among the variables. Table 4 shows other statistical results for the four non-grain production categories. They indicated that our multiple linear regression model suitably explained the relationship between non-grain production and the factors. The parameters of each factor showed good statistical significance, with sig F values of less than 0.001, indicating that the probability of all dependent and independent variables being uncorrelated was 0; that is, the model was statistically significant. The R2 of the fitting models of the four categories was 0.540, 0.397, 0.274, and 0.300, all of which had a good fit and fully explained the correlation between dependent and independent variables.
Table 4 shows that the IMR category had a negative correlation with the proportion of irrigated farmland (G2) and a positive correlation with the proportion leaving town for more than 6 months (D2), road traffic density in villages (E1), industrial scale (E2), and tourism scale (E4). SER had a negative correlation with the proportion of irrigated farmland (G2) and the proportion of prime farmland (P2) and a positive correlation with cultivated land topography (G1), proportion over age 60 (D1), commercial scale (E3), and tourism scale (E4). ENR had a negative correlation with the proportion of irrigated farmland (G2), proportion over age 60 (D1), and industrial scale (E2); it had a positive correlation with cultivated land topography (G1). IR had a negative correlation with the proportion of irrigated farmland (G2), age of the village chief (D4), road traffic density in villages (E1), and commercial scale (E3), as well as a positive correlation with tourism scale (E4). We also found that irrigated farmland was more likely to occur under the four categories than non-irrigated farmland, and a village with more tourism was more prone to non-grain production activities. However, the cultivated land transfer policy neither encouraged nor inhibited them.

4. Discussion

4.1. Spatial Patterns of Non-Grain Production Categories

Non-grain production activity is common in Liyang, with a total non-grain production area of 28,158.38 hectares and a non-grain production rate of 48.09%. The rate of non-grain production was much higher in Liyang than in other regions, as revealed by previous studies [8,11,36,54]. The reason for this difference is that while we included multiple types of non-grain production, previous studies only focused on a single one or part of them. In addition, our study is the first to consider construction activity on cultivated land as a non-grain production activity rather than a non-agricultural activity, as in previous studies [8,55]. Among the four categories, SER and ENR occupied a huge proportion of the total non-grain production area. Explanations include the following: Liyang is a typical tourism area, and there has been increased landscape construction, including the planting of trees, flowers, and fruit-picking gardens on cultivated land. Liyang is also a shrimp-breeding base, and a large amount of cultivated land has been converted into breeding pits and ponds. In addition, planting saplings, flowers, and fruits and farming fish and shrimp can bring higher profits than IMR activities, such as vegetable and melon planting. However, the initial investment, labor force, and technology input for SER and ENR are much higher than for IMR and grain production [51]. SER, in addition to orchards, landscape gardens, and abandoned land, also accounts for a large proportion. By contrast, the IR category occupied a small proportion of the total non-grain production area. This is likely because China has stringent policies for protecting cultivated land, especially with regard to converting cultivated land into construction land [56,57,58].
The Moran’s I value of four categories indicated significant spatial agglomeration. This is because most non-grain production activities on cultivated land can bring higher profits, which would motivate farmers in the surrounding areas to engage in similar activities [59,60]. Because of the neighborhood relationship, farmers can share techniques, equipment, and experience to improve the competitiveness of non-grain products [61]. Construction activities, meanwhile, such as building roads and irrigation facilities, are usually carried out in each village of the whole region and do not reflect personal behavior [62]. In addition, factories, commerce, and tourism construction activities all take place in special regions, mainly guided by governments and village collectives, not individual farmer behaviors. Thus, there was weak autocorrelation in the IR category and little correlation with the other three categories.

4.2. Reasons for the Significant Causal Mechanisms for Four Categories

A given category of non-grain production is often stimulated or inhibited by the features of certain key factors in a specific region. IMR was more likely to arise in a village with a lower proportion of irrigated farmland, a higher proportion of leaving town for more than 6 months, a higher density of road traffic in villages, and a larger scale of industry and tourism. This is reasonable since IMR corresponds to planting vegetables, fruits, oil, sugar, and raw agricultural materials, which does not require stripping the soil tillage layer or other engineering activities, thus requiring less labor input than the other three categories. In addition, vegetables and other cash crops are not suitable for long-term storage and, therefore, if needed, are quickly sent to supermarkets or processing plants via improved transportation [63]. Moreover, increased tourism has increased the demand for diversified cash crops. A village with the above factors and features is thus often more prone to non-grain production in the IMR category.
SER was more likely to be seen in villages with a lower proportion of irrigated farmland and prime farmland, a higher proportion of people over age 60, a larger scale of commerce and tourism, and more mountains. SER was partly formed by abandonment and partly by the planting of flowers, grasses, shrubs, and other landscape features. Villages that abandoned cultivated land because of a lack of a young labor force mainly comprised this category [64]. Compared with agricultural production, non-agricultural work in cities can bring more profits for young workers, better medical services for the elderly, and better educational resources for children [65,66]. Therefore, in villages with serious population and labor losses, some people, especially those with more education, prefer to stay in cities, and cultivated land is abandoned [67]. Moreover, the effect of terrain on the utilization of cultivated land is often manifested in the abandonment of cultivated land or the development of economic orchard planting in mountainous areas [68]. Then, when capital flows into the countryside, the larger the business scale, the greater the employment opportunities, and operators choose non-grain activities after comparing the profits with those from grain production. Furthermore, with increased rural tourism, the demand for landscapes with flowers and grasses has increased. However, planting such landscapes is often limited by prime-farmland protection policies.
ENR was more likely seen in villages with a lower proportion of irrigated farmland, a lower proportion of people over the age of 60, a smaller industrial scale, and proximity to mountains. ENR mainly corresponds to fruit-picking orchards and fish and shrimp breeding. Operators prefer to use cultivated land that is closer to mountainous areas with steep non-irrigated farmland to plant various fruits and develop fruit-picking activities. Meanwhile, some industries focus on grain production, processing, transportation, storage, and sales. High-quality rice is sold to the surrounding big cities, such as Nanjing, which can also obtain good profits from order service. Thus, some operators are encouraged to reconvert shrimp ponds into irrigated farmland for grain production in Liyang (http://www.liyang.gov.cn, accessed on 10 October 2019).
IR mostly corresponded to villages with a lower proportion of irrigated farmland, village chiefs with less management experience, lower-density road traffic, a smaller scale of commerce, and a larger scale of tourism. They tended to be dominated by buildings, roads, and commercial and service infrastructure. This category of non-grain production is related not only to farmers but also to village chiefs. Previous studies have shown that the village chief’s age is closely related to management decisions and experience [6]. The older the manager, the greater the awareness of farmland protection; thus, this type of non-grain phenomenon does not easily occur. The more complete the rural roads, the lower the demand for new roads in the village, which can also reduce this category of non-grain production activity. The development of rural commerce is different from that of cities owing to the limited scale of population and service consumption. When rural commerce develops to an appropriate scale, the demand may decrease, and the opportunities for cultivated land to be occupied by commercial development decrease [69]. On the contrary, against the background of China’s rural revitalization strategy, tourism, especially rural tourism, has been booming in recent years [70]. The demand for related facilities also changes with tourism development, indicating that IR is more likely to arise in such villages.
A village with a higher proportion of irrigated farmland is less prone to these four non-grain production categories. A reasonable explanation is that the higher the proportion of irrigated farmland, the higher the quality of cultivated land resources, and the more perfect the irrigation facilities. These are important guarantees for reducing risks and increasing confidence in the benefits of cultivated land utilization. Tianmuhu, Daibu, Shangxing, and Zhuze are mainly on non-irrigated land and have an average non-grain production rate of 54.2%. Nandu and Bieqiao, meanwhile, are flat plain regions, mainly with irrigated farmland, and they have an average non-grain production rate of 41.7%. This is 12.5% lower than in mountainous and hilly areas, which is in line with previous studies [71].
The results indicated that farming conditions (e.g., the proportion of irrigated farmland) and economic scale (e.g., tourism scale) had more of an effect than demographic variables on non-grain production in Liyang. Meanwhile, the land-transfer policy did not lead to non-grain production; this result is contrary to Jiang and Qi [72], and Leng et al. [34], but consistent with Zhang and Du [73]. Non-grain production activities by large-scale operators were restricted by the supply of capital and labor and the intensity of policy implementation at the village scale. Whether land-transfer activity can suppress non-grain production could be scenario dependent [74]. In Liyang, the small-scale cultivated land transfer of farmers coexists with the larger scale of economic groups and organizations. Small-scale land transfer is more easily used by farmers for non-grain planting. Organizations usually grow grain products, which are regulated by policies and encouraged by subsidies in Liyang. Since both scenarios were observed, it may have led to the result that the effect of the land-transfer policy on non-grain production was not obvious. The prime-farmland protection policy had a negative relationship with SER non-grain production. China is a populous country with a relatively small amount of cultivated land; thus, China has very strict cultivated land protection policies. Therefore, the higher the proportion of prime farmland in a village, the better the implementation of national or regional cultivated land protection policies. This also means there are more restrictions on farmers and operators changing the grain production activities in village regions.

4.3. Governance Implementation

Given the prevalence of non-grain production activities in Chinese villages, there is an urgent need to innovate the land-use policy to guarantee grain security. Non-grain production needs to be controlled through management to achieve sustainable land use and rural development while also considering farmers’ economic benefits. It is necessary to scientifically distinguish the phenomenon of non-grain production on cultivated land and formulate differentiated control measures and disposal methods under the principle of “Storing Grain in the Land”. We therefore put forward some suggestions for reducing non-grain production and protecting cultivated land according to the causal mechanisms of the four categories identified in this study.
First, we should promote agricultural consolidation projects, especially cultivated land irrigation facilities. A high proportion of irrigated farmland can curb the expansion of non-grain production in the four categories. For mountainous areas with more serious problems with non-grain production, investment in constructing irrigation facilities should be increased, which could enhance farmers’ enthusiasm for growing grain.
Regarding farmers, especially those lacking a labor force, they should be encouraged to transfer their cultivated land to agricultural enterprises. However, in the process of land transfer, special attention should be paid to clear agreements regarding the use of cultivated land and the types of grain in the transfer contract to ensure grain security. We should also increase village chiefs’ awareness of grain production and cultivated land protection, taking grain production as an important performance indicator that directly affects their promotion.
The flow of capital into the countryside is a double-edged sword. We should strike a balance between regional development and grain security and encourage industries that use grain as raw material to go into the countryside. Such industries can encourage operators to produce grain and can provide employment opportunities for local farmers with regard to storage, transportation, and processing. At the same time, the expansion of rural tourism should be controlled. New tourism development should not occupy cultivated land or destroy the soil layer. Non-grain production land that has already destroyed the soil layer can be used to develop projects that combine tourism and agriculture.
The management of non-grain production on cultivated land is based on adherence to regulations for the protection of prime farmland. Strict implementation of a farmland protection system depends on formulating clear rules, preventing new non-grain farming activities on permanent prime farmland, and specifying penalties for violations.

4.4. Limitations and Future Prospects

The present study provided new insights about governing cultivated land non-grain production at the village level. To our knowledge, this is a frontier study in China to classify and govern non-grain production according to the effect of non-grain activities on grain production. Our results have important policy implications on land-use decisions in response to non-grain production of cultivated land that evolves from ongoing urbanization and socio-economic transitions, but it is subject to several limitations. It is crucial to acknowledge the actual and quantifiable impact of various non-grain production activities on the soil layer, which would be different by each non-grain production behavior. Such acknowledgement plays an essential role in classifying non-grain production activities for governing them. The classification of cultivated land non-grain production in this study was formed by referring to the expert opinions of land, soil, ecology and environment, combined with field investigation and existing research knowledge; it could lead to some inaccuracy. Therefore, follow-up research should strengthen and collect the quantifiable and accuracy impact of various non-grain production activities on the soil layer based on multi-domain research. In terms of methods, the spatial regression model, such as geographically weighted regression (GWR), is useful to analysis the phenomenon of spatial heterogeneity, and it would be worth considering such studies in the future.

5. Conclusions

Unraveling the causal mechanisms for non-grain production of cultivated land is important for grain security but they are rarely studied. This study presented an analysis framework for non-grain production of cultivated land and applied it in Liyang. We first divided all non-grain production activities on cultivated land into four categories: IMR, SER, ER, and IR, according to the degree of damage to the soil tillage layer and the difficulty of restoration. We then analyzed spatial pattern features and revealed the causal mechanisms of the four given non-grain production categories. Finally, we put forward suggestions for reducing non-grain activities and protecting cultivated land. These conclusions were as follows:
(1)
Non-grain production activities were found to be widespread in Liyang, the comprehensive non-grain rate was 48.09%. The non-grain rates of IMR, SER, ENR, and IR were 11.81%, 17.76%, 15.07%, and 3.45%, respectively. SER and ENR were more widely distributed.
(2)
A significant neighborhood effect was identified among the four categories. While they exhibited different levels and obvious spatial agglomeration, there were positive relationships among IMR, SER, and ENR in pairs.
(3)
All four non-grain production categories were inclined to occur in places where the proportion of irrigated farmland was lower. In addition, IMR was more likely to occur around urban areas, which were characterized by more labor force loss, higher-density transportation infrastructures, and larger-scale industry and tourism. Furthermore, SER was mainly located in the south, central, and north of Liyang, mainly in areas closer to mountains and with an aging workforce and larger-scale commerce and tourism. ENR was mainly located in the east and west of Liyang, mainly in areas closer to mountains, with younger labor forces and smaller-scale industries. IR was mainly distributed in the west and north of Liyang, which were characterized by less experienced village leaders, less transportation infrastructure, smaller-scale commerce, and larger-scale tourism.
(4)
To ensure grain security, the government should improve farmland irrigation facilities, as well as increase the proportion of irrigated farmland and grain subsidies for mountainous farmland. A future policy orientation could be to increase the scale of land transfer and take grain production as a performance indicator for the promotion of village chiefs. In terms of industry imports, local governments should encourage industries that use grain as raw material to go into the countryside, effectively controlling the random expansion of rural tourism. The basis of the management of non-grain production on cultivated land lies in adhering to regulations on the protection of prime farmland and clarifying the penalties for occupying permanent prime farmland.

Author Contributions

Conceptualization, X.C.; data curation, X.C. and W.O.; formal analysis, X.C.; funding acquisition, W.O.; methodology, X.C., C.H. and Y.T.; project administration, W.O.; software, F.W., Q.T. and H.X.; supervision, W.O. and Y.T.; validation, X.C., J.Y. and D.Y.; visualization, X.C.; writing—original draft, X.C.; writing—review and editing, W.O., Y.T. and C.H. All authors have read and agreed to the published version of the manuscript.

Funding

This work was supported by the National Key R&D Program of China (No. 2018YFD1100103) and the Natural Sciences Foundation of Jiangsu Province, China (No. KJXM2020010).

Data Availability Statement

Not applicable.

Conflicts of Interest

The authors declare no conflict of interest.

References

  1. United Nations (UN). Sustainable Development Goal 2. Sustainable Development Knowledge Platform. 2015. Available online: https://www.un.org/sustainabledevelopment/hunger/ (accessed on 25 September 2015).
  2. Food and Agriculture Organization of the United Nations (FAO); International Fund for Agricultural Development (IFAD); United Nations International Children’s Emergency Fund (UNICEF); World Food Programme (WFP); World Health Organization (WHO). The State of Food Security and Nutrition in the World 2021. Transforming Food Systems for Food Security, Improved Nutrition and Affordable Healthy Diets for All; Food and Agriculture Organization: Rome, Italy, 2021. [Google Scholar]
  3. Bryan, B.A.; Hadjikakou, M.; Moallemi, E.A. Rapid SDG progress possible. Nat. Sustain. 2019, 2, 999–1000. [Google Scholar] [CrossRef]
  4. Liu, Y.; Zhou, Y. Reflections on China’s food security and land use policy under rapid urbanization. Land Use Policy 2021, 109, 105699. [Google Scholar] [CrossRef]
  5. Yu, B.; Lu, C. Change of cultivated land and its implications on food security in China. Chin. Geogr. Sci. 2006, 16, 299–305. [Google Scholar] [CrossRef]
  6. Yu, D.; Hu, S.; Tong, L.; Xia, C. Spatiotemporal dynamics of cultivated land and its influences on grain production potential in Hunan province, China. Land 2020, 9, 510. [Google Scholar] [CrossRef]
  7. Krusekopf, C.C. Diversity in land-tenure arrangements under the household responsibility system in China. China Econ. Rev. 2002, 13, 297–312. [Google Scholar] [CrossRef]
  8. Zhao, X.; Zheng, Y.; Huang, X.; Kwan, M.; Zhao, Y. The effect of urbanization and farmland transfer on the spatial patterns of non-grain farmland in China. Sustainability 2017, 9, 1438. [Google Scholar] [CrossRef] [Green Version]
  9. Yang, R.; Luo, X.; Xu, Q.; Zhang, X.; Wu, J. Measuring the impact of the multiple cropping index of cultivated land during continuous and rapid rise of urbanization in China: A study from 2000 to 2015. Land 2021, 10, 491. [Google Scholar] [CrossRef]
  10. Meng, F.; Tan, Y.; Chen, H.; Xiong, W. Spatial-temporal evolution patterns and influencing factors of ”non-grain” utilization of cultivated land in China. China Land Sci. 2022, 36, 97–106. [Google Scholar]
  11. Su, Y.; Li, C.; Wang, K.; Deng, J.; Shahtahmassebi, A.R.; Zhang, L.; Ao, W.; Guan, T.; Pan, Y.; Gan, M. Quantifying the spatiotemporal dynamics and multi-aspect performance of non-grain production during 2000–2015 at a fine scale. Ecol. Indic. 2019, 101, 410–419. [Google Scholar] [CrossRef]
  12. Chen, F.; Liu, J.; Chang, Y.; Zhang, Q.; Yu, H.; Zhang, S. Spatial pattern differentiation of non-grain cultivated land and its driving factors in China. China Land Sci. 2021, 35, 33–43. [Google Scholar]
  13. Choudhary, A.K.; Thakur, S.K.; Suri, V.K. Technology transfer model on integrated nutrient management technology for sustainable crop production in high-value cash crops and vegetables in Northwestern Himalayas. Commun. Soil Sci. Plant Anal. 2013, 44, 1684–1699. [Google Scholar] [CrossRef]
  14. Li, C.; Cheng, F. Thinking on the identification of ”non-grain” to the damage of cultivated layer. China Land 2021, 7, 12–14. [Google Scholar]
  15. Xiao, Y.; Wu, X.Z.; Wang, L.; Liang, J. Optimal farmland conversion in China under double restraints of economic growth and resource protection. J. Clean. Prod. 2017, 142, 524–537. [Google Scholar] [CrossRef]
  16. Khan, S.; Hanjra, M.A.; Mu, J.X. Water management and crop production for food security in China: A review. Agric. Water Manag. 2009, 96, 349–360. [Google Scholar] [CrossRef]
  17. Qiang, W.; Liu, A.; Cheng, S.; Kastner, T.; Xie, G. Agricultural trade and virtual land use: The case of China’s crop trade. Land Use Policy 2013, 33, 141–150. [Google Scholar] [CrossRef]
  18. Su, S.; Zhou, X.; Wan, C.; Li, Y.; Kong, W. Land use changes to cash crop plantations: Crop types, multilevel determinants and policy implications. Land Use Policy 2016, 50, 379–389. [Google Scholar] [CrossRef]
  19. Liu, Z.; Peng, Y.; Wu, W.; You, L. Spatio-temporal changes of cropping structure in China during 1980–2011. J. Geogr. Sci. 2018, 28, 1659–1671. [Google Scholar] [CrossRef] [Green Version]
  20. Kasem, S.; Thapa, G.B. Crop diversification in Thailand: Status, determinants, and effects on income and use of inputs. Land Use Policy 2011, 28, 618–628. [Google Scholar] [CrossRef]
  21. Tudor, M.M.; Alexandri, C. Structural changes in Romanian farm management and their impact on economic performances. Procedia Econ. Finance 2015, 22, 747–754. [Google Scholar] [CrossRef] [Green Version]
  22. Zhu, C.M.; Dong, B.Y.; Li, S.N.; Lin, Y.; Shahtahmassebi, A.; You, S.X.; Zhang, J.; Gan, M.Y.; Yang, L.X.; Wang, K. Identifying the trade-offs and synergies among land use functions and their influencing factors from a geospatial perspective: A case study in Hangzhou, China. J. Clean. Prod. 2021, 314, 128026. [Google Scholar] [CrossRef]
  23. Schierhorn, F.; Kastner, T.; Kuemmerle, T.; Meyfroidt, P.; Kurganova, I.; Prishchepov, A.V.; Erb, K.H.; Houghton, R.A.; Muller, D. Large greenhouse gas savings due to changes in the post-Soviet food systems. Environ. Res. Lett. 2019, 14, 065009. [Google Scholar] [CrossRef]
  24. Seto, K.C.; Ramankutty, N. Hidden linkages between urbanization and food systems. Science 2016, 352, 943–945. [Google Scholar] [CrossRef]
  25. Hao, S.; Wu, K.; Dong, X.; Yang, Q.; Gao, X. Identification criteria of cultivated horizon damage for ”non-grain” cultivated land. Chin. J. Soil Sci. 2021, 52, 1028–1033. [Google Scholar]
  26. Song, G.; Zhang, H. Cultivated land use layout adjustment based on crop planting suitability: A case study of typical counties in northeast China. Land 2021, 10, 107. [Google Scholar] [CrossRef]
  27. Su, Y.; Qian, K.; Lin, L.; Wang, K.; Guan, T.; Gan, M. Identifying the driving forces of non-grain production expansion in rural China and its implications for policies on cultivated land protection. Land Use Policy 2020, 92, 104435. [Google Scholar] [CrossRef]
  28. Jiang, G.; Hu, H. Will industrial and commercial capital go to the countryside lead to the ”non grain” of farmers‘ agricultural land utilization—Empirical evidence from CLDs. Financ. Trade Res. 2021, 32, 41–51. [Google Scholar]
  29. Bhandari, H.; Mishra, A.K. Impact of demographic transformation on future rice farming in Asia. Outlook Agric. 2018, 47, 125–132. [Google Scholar] [CrossRef]
  30. Peng, L.Y.; Zhou, X.H.; Tan, W.X.; Liu, J.J.; Wang, Y.S. Analysis of dispersed farmers? willingness to grow grain and main influential factors based on the structural equation model. J. Rural. Stud. 2022, 93, 375–385. [Google Scholar] [CrossRef]
  31. Yi, F.J.; Sun, D.Q.; Zhou, Y.H. Grain subsidy, liquidity constraints and food security—Impact of the grain subsidy program on the grain-sown areas in China. Food Policy 2015, 50, 114–124. [Google Scholar] [CrossRef] [Green Version]
  32. Burli, P.; Lal, P.; Wolde, B.; Jose, S.; Bardhan, S. Factors affecting willingness to cultivate switchgrass: Evidence from a farmer survey in Missouri. Energy Econ. 2019, 80, 20–29. [Google Scholar] [CrossRef]
  33. Wang, F.L.; Zhao, S.X.; Fu, X.M. Improved estimation model and empirical analysis of relationship between agricultural mechanization level and labor demand. Int. J. Agric. Biol. Eng. 2016, 9, 48–53. [Google Scholar]
  34. Leng, Z.; Wang, Y.; Hou, X. Structural and efficiency effects of land transfers on food planting: A comparative perspective on North and South of China. Sustainability 2021, 13, 3327. [Google Scholar] [CrossRef]
  35. Osawa, T.; Kohyama, K.; Mitsuhashi, H. Multiple factors drive regional agricultural abandonment. Sci. Total Environ. 2016, 542, 478–483. [Google Scholar] [CrossRef] [PubMed]
  36. Yang, Q.; Zhang, D. The influence of agricultural industrial policy on non-grain production of cultivated land: A case study of the ”one village, one product” strategy implemented in Guanzhong Plain of China. Land Use Policy 2021, 108, 105579. [Google Scholar] [CrossRef]
  37. Zhang, C.L.; Robinson, D.; Wang, J.; Liu, J.B.; Liu, X.H.; Tong, L.J. Factors Influencing Farmers’ Willingness to Participate in the Conversion of Cultivated Land to Wetland Program in Sanjiang National Nature Reserve, China. Environ. Manag. 2011, 47, 107–120. [Google Scholar] [CrossRef]
  38. Wadduwage, S. Drivers of peri-urban farmers‘ land-use decisions: An analysis of factors and characteristics. J. Land Use Sci. 2021, 16, 273–290. [Google Scholar] [CrossRef]
  39. Jin, H.; Zhong, Y.; Shi, D.; Li, J.; Lou, Y.; Li, Y.; Li, J. Quantifying the impact of tillage measures on the cultivated-layer soil quality in the red soil hilly region: Establishing the thresholds of the minimum data set. Ecol. Indic. 2021, 130, 108013. [Google Scholar] [CrossRef]
  40. Bruce, R.R.; Langdale, G.W.; West, L.T.; Miller, W.P. Surface soil degradation and soil productivity restoration and maintenance. Soil Sci. Soc. Am. J. 1995, 59, 654–660. [Google Scholar] [CrossRef]
  41. Kraaijvanger, R.; Veldkamp, T. Grain productivity, fertilizer response and nutrient balance of farming systems in tigray, ethiopia: A multi-perspective view in relation to soil fertility degradation. Land Degrad. Dev. 2015, 26, 701–710. [Google Scholar] [CrossRef]
  42. Chen, M. Analysis and countermeasures of ”non-grain” phenomenon of cultivated land. China Land 2021, 4, 9–10. [Google Scholar]
  43. Ord, J.K.; Getis, A. Local spatial autocorrelation statistics: Distributional issues and an application. Geogr. Anal. 1995, 27, 286–306. [Google Scholar] [CrossRef]
  44. Bivand, R.; Müller, W.G.; Reder, M. Power calculations for global and local Moran‘s I. Comput. Stat. Data Anal. 2009, 53, 2859–2872. [Google Scholar] [CrossRef]
  45. Sridharan, S.; Tunstall, H.; Lawder, R.; Mitchell, R. An exploratory spatial data analysis approach to understanding the relationship between deprivation and mortality in Scotland. Soc. Sci. Med. 2007, 65, 1942–1952. [Google Scholar] [CrossRef] [PubMed]
  46. Liu, X.; Wang, J. Analysis and application on the specification methods of the spatial weight matrix. Geo-Inf. Sci. 2002, 4, 38–44. [Google Scholar]
  47. Moran, P.A. Notes on continuous stochastic phenomena. Biometrika 1950, 37, 17–23. [Google Scholar] [CrossRef] [PubMed]
  48. Luc, A.; Ibnu, S.; Youngihn, K. GeoDa: An introduction to spatial data analysis. Geogr. Anal. 2006, 38, 5–22. [Google Scholar]
  49. Lehmann, D.J.; Albuquerque, G.; Eisemann, M.; Magnor, M.; Theisel, H. Selecting coherent and relevant plots in large Scatterplot Matrices. Comput. Graph. Forum 2012, 31, 1895–1908. [Google Scholar] [CrossRef]
  50. Liu, Y.; Feng, Y.; Zhao, Z.; Zhang, Q.; Su, S. Socioeconomic drivers of forest loss and fragmentation: A comparison between different land use planning schemes and policy implications. Land Use Policy 2016, 54, 58–68. [Google Scholar] [CrossRef]
  51. Xiao, R.; Su, S.; Mai, G.; Zhang, Z.; Yang, C. Quantifying determinants of cash crop expansion and their relative effects using logistic regression modeling and variance partitioning. Int. J. Appl. Earth Obs. Geoinf. 2015, 34, 258–263. [Google Scholar] [CrossRef]
  52. Wannasai, N.; Shrestha, R.P. Role of land tenure security and farm household characteristics on land use change in the Prasae Watershed, Thailand. Land Use Policy 2008, 25, 214–224. [Google Scholar] [CrossRef]
  53. Tan, M.H.; Li, X.B.; Lu, C.H. Urban land expansion and arable land loss of the major cities in China in the 1990s. Sci. China 2005, 48, 1492–1500. [Google Scholar] [CrossRef]
  54. Li, Y.F.; Zhao, B.C.; Huang, A.; Xiong, B.Y.; Song, C.F. Characteristics and driving forces of non-grain production of cultivated land from the perspective of food security. Sustainability 2021, 13, 14047. [Google Scholar] [CrossRef]
  55. Li, J.; Xiangzheng, D.; Karen, C.S. Multi-level modeling of urban expansion and cultivated land conversion for urban hotspot counties in China. Landsc. Urban Plan. 2012, 108, 131–139. [Google Scholar]
  56. Liu, X.; Zhao, C.; Song, W. Review of the evolution of cultivated land protection policies in the period following China‘s reform and liberalization. Land Use Policy 2017, 67, 660–669. [Google Scholar] [CrossRef]
  57. Qianwen, Z.; Wujun, G.; Shiliang, S.; Min, W.; Zhongliang, C. Biophysical and socioeconomic determinants of tea expansion: Apportioning their relative importance for sustainable land use policy. Land Use Policy 2017, 68, 438–447. [Google Scholar]
  58. Zhong, T.; Huang, X.; Zhang, X.; Wang, K. Temporal and spatial variability of agricultural land loss in relation to policy and accessibility in a low hilly region of southeast China. Land Use Policy 2011, 28, 762–769. [Google Scholar] [CrossRef]
  59. Anselin, L. Under the hood—Issues in the specification and interpretation of spatial regression models. Agric. Econ. 2002, 27, 247–267. [Google Scholar] [CrossRef]
  60. Gellrich, M.; Baur, P.; Koch, B.; Zimmermann, N.E. Agricultural land abandonment and natural forest re-growth in the Swiss mountains: A spatially explicit economic analysis. Agric. Ecosyst. Environ. 2007, 118, 93–108. [Google Scholar] [CrossRef]
  61. Hong, Y.; Li, X.B. Cultivated land and food supply in China. Land Use Policy 2000, 17, 73–88. [Google Scholar]
  62. Qun, O.J.; Xiangzheng, D.; Jinyan, Z.; Shujin, H. Estimation of land production and its response to cultivated land conversion in North China Plain. Chin. Geogr. Sci. 2011, 21, 685–694. [Google Scholar]
  63. Cherono, K.; Workneh, T.S. Effect of packing units during long distance transportation on the quality and shelf-life of tomatoes under commercial supply conditions. In Proceedings of the 30th International Horticultural Congress, Istanbul, Türkiye, 12–16 August 2018; pp. 165–173. [Google Scholar]
  64. Chong, L. Does household laborer migration promote farmland abandonment in China? Growth Change. 2020, 51, 1804–1836. [Google Scholar]
  65. Hou, B.; Nazroo, J.; Banks, J.; Marshall, A. Are cities good for health? A study of the impacts of planned urbanization in China. Int. J. Epidemiol. 2019, 48, 1083–1090. [Google Scholar] [CrossRef] [PubMed]
  66. Li, M.; Yang, R. Interrogating institutionalized establishments: Urban-rural inequalities in China‘s higher education. Asia Pac. Educ. Rev. 2013, 14, 315–323. [Google Scholar] [CrossRef] [Green Version]
  67. Levers, C.; Schneider, M.; Prishchepov, A.V.; Estel, S.; Kuemmerle, T. Spatial variation in determinants of agricultural land abandonment in Europe. Sci. Total Environ. 2018, 644, 95–111. [Google Scholar] [CrossRef]
  68. Jing, A.S.; Shichao, Z.; Xiubin, L. Effectiveness of farmland transfer in alleviating farmland abandonment in mountain regions. J. Geogr. Sci. 2016, 26, 203–218. [Google Scholar]
  69. Li, M.; Hualou, L.; Yingnan, Z.; Shuangshuang, T.; Dazhuan, G.; Xiaosong, T. Agricultural labor changes and agricultural economic development in China and their implications for rural vitalization. J. Geogr. Sci. 2019, 29, 163–179. [Google Scholar]
  70. Yang, J.; Yang, R.X.; Chen, M.H.; Su, C.H.; Zhi, Y.; Xi, J.C. Effects of rural revitalization on rural tourism. J. Hosp. Tour. Manag. 2021, 47, 35–45. [Google Scholar] [CrossRef]
  71. Wang, Y.H.; Li, X.B.; Xin, L.J.; Tan, M.H. Farmland marginalization and its drivers in mountainous areas of China. Sci. Total Environ. 2020, 719, 135132. [Google Scholar] [CrossRef]
  72. Jiang, Y.; Qi, M. Analysis on the characteristics of agricultural product structure change before 648 and after land transfer. Jiangxi Soc. Sci. 2017, 37, 81–89. [Google Scholar]
  73. Zhang, Z.; Du, Z. Will land circulation lead to ”non-grain”?—Empirical analysis based on 632 monitoring data of 1740 family farms in China. Econ. Perspect. 2015, 9, 63–69. [Google Scholar]
  74. Subedi, Y.R.; Kristiansen, P.; Cacho, O. Drivers and consequences of agricultural land abandonment and its reutilisation pathways: A systematic review. Environ. Dev. 2022, 42, 100681. [Google Scholar] [CrossRef]
Figure 1. Location and land-use types of Liyang county, China, in 2019.
Land 11 01888 g001
Figure 2. An analysis framework for unraveling the causal mechanisms for non-grain production.
Land 11 01888 g002
Figure 3. Method for classifying non-grain production categories. Land 11 01888 i001: cultivated land; Land 11 01888 i002: non-grain production categories. IMR: immediately recoverable, SER: simple-engineering recoverable, ENR: engineering recoverable; IR: irrecoverable. Areas in the figure are for reference only and are unrelated to the actual situation. (A) shows the operation status of cultivated land in the past. It is usually used to plant grain and cash crops and abandoned. (B) shows the current land-use structure and area (s1s8), which is changed from the former cultivated land, and the current situation includes non-agricultural, arbor, garden/shrub/grass, fish and shrimp ponds, and cultivated land. The current situation of cultivated land utilization includes planting grain, grain and cash crops rotation, cash crops and abandonment. (C) is the classification of non-grain production according to the current structure of land use in (B). In particular, the areas of (AC) are equal, and the total area: S = s1 + s2 + s3 + s4 + s5 + s6 + s7 + s8.
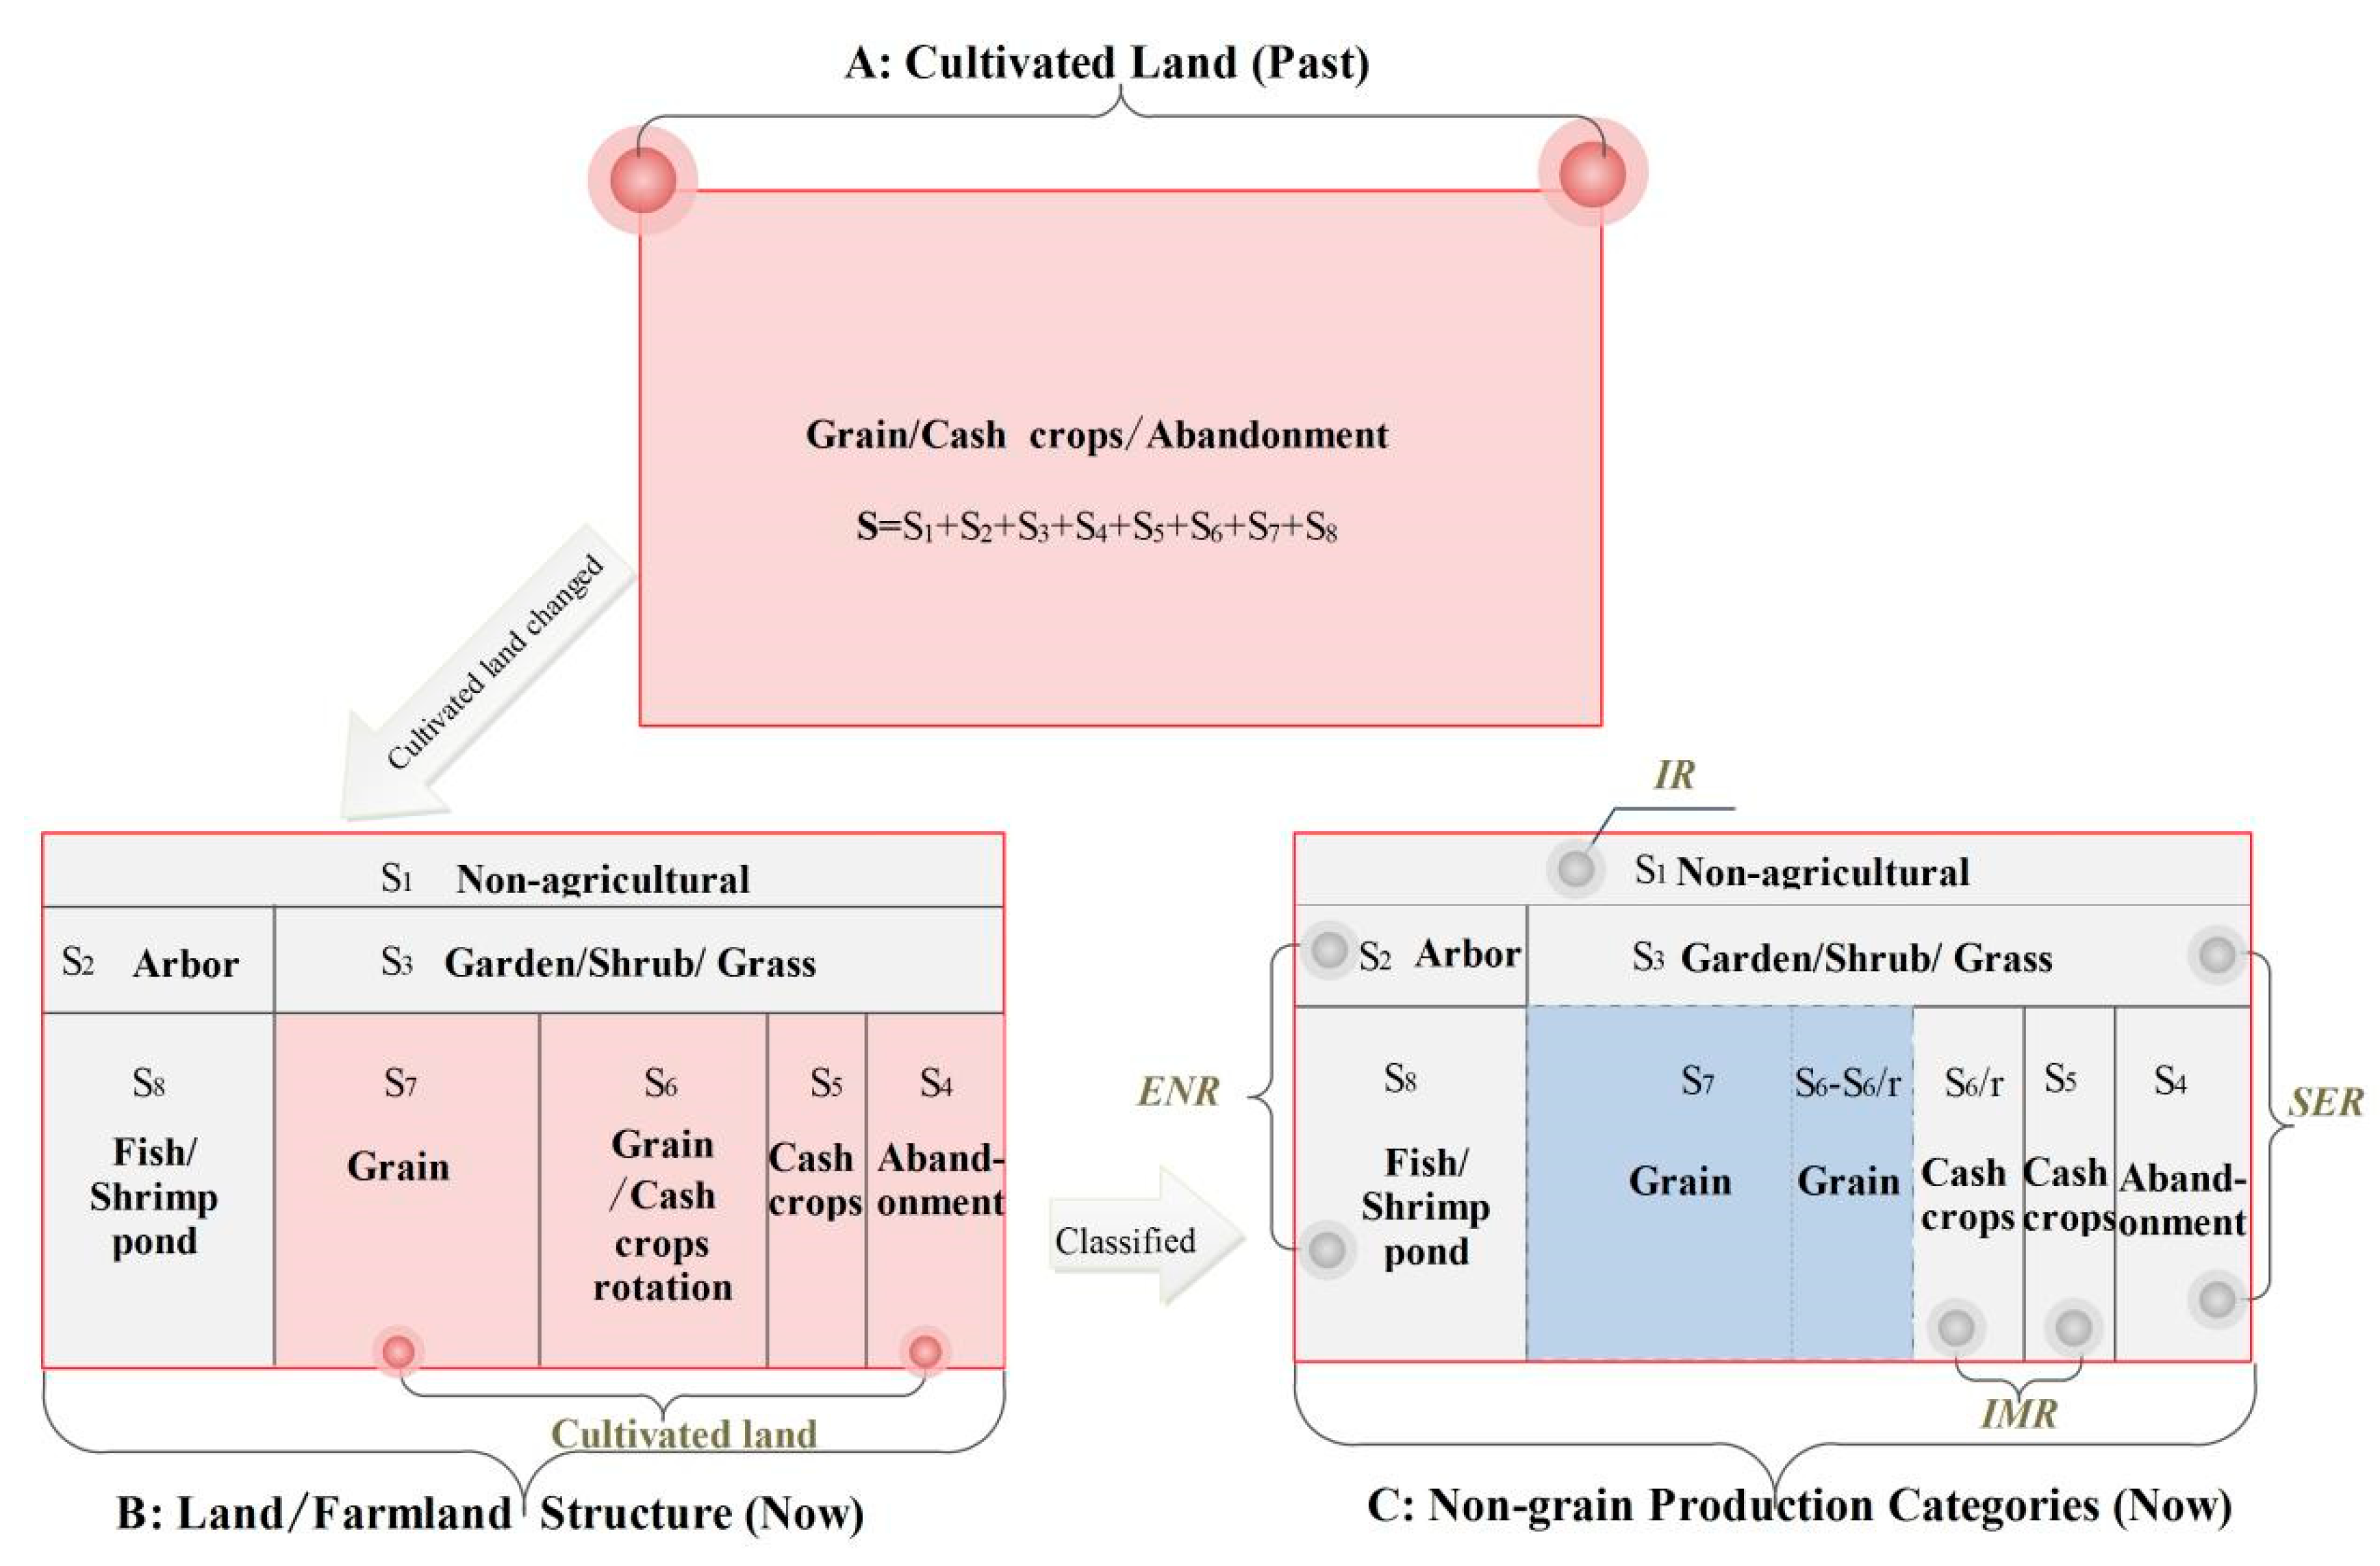
Land 11 01888 g003
Figure 4. Moran scatterplots of non-grain production rates in four categories.
Land 11 01888 g004
Figure 5. Spatial hot/cold pattern features of non-grain production rates in four categories.
Land 11 01888 g005
Figure 6. Scatterplots of different non-grain production categories in Liyang. ** p < 0.05.
Land 11 01888 g006
Table 1. Independent variables and descriptions.
VariableDescription
Geophysical variables
Cultivated land topography (G1)1 = plain, 2 = hill, 3 = mountain
Proportion of irrigated farmland (G2)Irrigated farmland area/total cultivated land area (%)
Distance to nearest town (G3)1 = town location, 2 = close to town, 3 = one village away from town,
4 = two or more villages away from town
Demographicvariables
Proportion over age 60 (D1)Population over age 60/total number (%)
Proportion leaving town for more than 6 months (D2)Amount of labor force leaving the township for more than 6 months/total labor force (%)
Proportion with high school education or above (D3)Amount of labor force with high school education or above/total labor force (%)
Age of the village chief (D4)1 = under 30, 2 = 31–40, 3 = 41–50, 4 = over 51
Economic variables
Road traffic density in villages (E1)Road area/rural area (%)
Industrial scale (E2)Area of industrial and storage land in a village (hm2)
Commercial scale (E3)Area of commercial land in a village (hm2)
Tourism scale (E4)Number of homesteads in three places and above/total number of households in a village (%)
Policy variables
Proportion of completed cultivated land transfer (P1)Area of completed transfer/total cultivated land area (%)
Proportion of prime farmland (P2).Area of prime farmland/total cultivated land area (%)
Table 2. Statistical results of independent variables.
VariableMinMaxAVGSTD
Cultivated land topography (G1)1320.53
Proportion of irrigated farmland (G2)33.599.2787.9611.88
Distance to nearest town (G3)131.850.79
Proportion over age 60 (D1)16.1246.7726.273.97
Proportion leaving town for more than 6 months (D2)055.2711.358.87
Proportion with high school education or above (D3)10.7629.3319.253.64
Age of the village chief (D4)143.490.68
Road traffic density in villages (E1)1.3317.915.032.69
Industrial scale (E2)053.794.447.42
Commercial scale (E3)023.872.424.52
Tourism scale (E4)033.81.694.55
Proportion of completed cultivated land transfer (P1)027.031.892.58
Proportion of prime farmland (P2)2.8899.148712
Table 3. Areas and rates among non-grain production categories in Liyang, China.
IMRSERENRIR
Liyang_areas (ha)6915.1710,399.18824.012020.09
Liyang_rates (%)11.8117.7615.073.45
Villages_range (%)1.35–61.060.48–75.960.19–96.690.02–30.88
Table 4. Multiple linear regression model results for four given non-grain production categories.
IMRSERENRIR
Cultivated land topography (G1)−0.0360.117 *0.146 *0.055
Proportion of irrigated farmland (G2)−0.279 ***−0.133 *−0.55 ***−0.547 ***
Distance to the nearest town (G3)0.036−0.019−0.0980.06
Proportion over age 60 (D1)0.0550.127*−0.153 *−0.002
Proportion leaving town for more than 6 months (D2)0.153 *0.0860.086−0.046
Proportion of high school education or above (D3)−0.104−0.0670.051−0.017
Age of village chief (D4)0.0450.0450.081−0.192 *
Road traffic density in villages (E1)0.269 ***−0.0480.084−0.197 **
Industrial scale (E2)0.154*−0.083−0.23 **−0.002
Commercial scale (E3)0.1190.209 *−0.143−0.172 *
Tourism scale (E4)0.271 **0.427 **−0.0240.139 *
Proportion of completed cultivated land transfer (P1)0.0080.003−0.058−0.111
Proportion of prime farmland (P2)−0.076−0.228 **0.044−0.082
a0.222/0.7570.301
n165165165165
F0.0000.0000.0000.000
R20.5400.3970.2740.300
The reference category is grain cultivation in all models. ***, **, and * indicate p < 0.01, p < 0.05, and p < 0.1.
Publisher’s Note: MDPI stays neutral with regard to jurisdictional claims in published maps and institutional affiliations.

