Abstract
With China facing the challenges of fragmentation, multidimensionality, and the dynamics of relative poverty under the present situation, more attention is being paid to the role of land in poverty alleviation. In order to improve the quality of precision in poverty alleviation, it is urgent to clarify the micromechanisms of precision poverty alleviation methods that utilize land elements. On the basis of panel data from 29 provinces from 2010 to 2016, this research uses a panel vector autoregressive model to empirically analyze the mechanisms of interaction among land resource endowment, land capital endowment, and rural poverty. The research results show that the improvement of land resource endowment has had a relatively prominent effect on short-term poverty reduction, while the improvement of land capital endowment has had a relatively longer-term effect on the improvement of rural poverty. Land capital endowment and rural poverty can constitute a positive, cumulative circular effect, which can play a sustainable role in improving poverty. The increase in land resource endowment has a positive effect on land capital endowment, but excessive increases in land capital endowment were found to have a negative effect on land resource endowment. Therefore, the implementation of land element resource-based and capital-based poverty alleviation policies can distinguish between shorter-term and relatively longer-term goals, enabling a more accurate improvement of the quality of poverty alleviation. At the same time, this approach is more sustainable, since it makes full use of the circular effect constituted by land capital endowment and rural poverty. However, attention should be paid to preventing damages to land resource endowment, which can be caused by the excessive capitalization of land.
1. Introduction
Since the Targeted Poverty Alleviation Policy was put forward, China’s poverty alleviation work has been continuously promoted and remarkable results have been achieved [1,2]. From 2014 to 2018, the number of poverty-stricken people in China dropped sharply from 70 million to less than 17 million, reflecting a decrease of over 50 million. According to the national rural poverty monitoring survey conducted by the National Bureau of Statistics, by the end of 2019, the poverty incidence in China had dropped to 0.6% and the number of rural poverty-stricken people had dropped to 5.51 million, which was 111.09 million less than that at the end of 2018 [3]. Moreover, the per capita disposable income of rural residents in poverty-stricken areas reached CNY 11,567 [3].
According to Heckscher’s resource-endowment theory, the efficient utilization of regionally advantageous resources is an important approach for achieving development advantages [4]. Owing to the foundation, safety, and value-added nature of land elements, land has become the most important means of production and activity carrier in the production and living activities of farmers in poor areas. Therefore, land policies that mainly focus on improving the attributes of regional land elements have become the most important tools in solving the poverty problem [5,6]. Since the 18th CPC National Congress, the Chinese government has allocated about CNY 16.4 billion in subsidies to major land improvement projects in poor areas and has given priority to pilot projects for protecting and restoring ecosystems in areas with fragile ecological environments. In 2019, poverty awards and subsidies reached CNY 17 billion. According to the website of the Ministry of Natural Resources, by the end of 2019, 28 provinces in China had benefited from the policy changes, with collective revenues of more than CNY 130 billion.
In China, land poverty alleviation policies involve a variety of policies and mechanisms, such as land consolidation poverty alleviation, industrial land supply poverty alleviation, poverty alleviation relocation, and land finance poverty alleviation [7]. Land can not only provide production materials and space for production, but also continuously creates wealth through market transfer and financial mechanisms [8,9,10]. Therefore, the existing land poverty alleviation policies of China can be divided into two categories: (1) land resource-based policies that directly improve the natural attributes of land and (2) land capital-based policies that optimize the allocation mechanism of land elements. The former aims to provide basic living and production welfare for poverty-affected people by improving the quantity, quality, and eco-environment of land resources, thus effectively alleviating the deep-poverty problem. This approach has a significant effect on poverty reduction, especially in poor areas with severe land resource constraints, such as karst and rocky regions. The latter category emphasizes the innovation and activation of the land-factor-allocation mechanism; additionally, it explores the value-realization mechanism of land capital by removing the shackles of land regulation without directly changing the natural attributes of land, providing new development impetus for poor areas [11,12,13,14,15].
Although numerous studies have focused on land-based poverty alleviation, the current research on land-based poverty alleviation tends to focus on the overall poverty alleviation models, mechanisms, and effects or on a specific policy, system, or project; thus, such studies ignore the potential of in-depth comparative study of the two poverty-reduction mechanisms of land resource endowment and capital endowment [16]. In ignoring this comparison, the difference of poverty reduction effect between land resource endowment and capital endowment remains unclarified. At the same time, this holistic research idea causes researchers to ignore the possible complex game relationship between land resource endowment and capital endowment; thus, researchers tend to either overestimate or underestimate the poverty reduction effect of land. In short, existing studies ignore the heterogeneity of poverty reduction effects and the interaction between land resource endowment and capital endowment, making it impossible to provide effective suggestions for accurately implementing policies and improving the quality of land poverty reduction.
In addition, existing studies generally ignore the two-way relationship between land and rural poverty, especially the impact of rural poverty on land factors. Changes in rural poverty are essentially brought about by changes in the income of the low-income population, which can affect change in regional industrial structure, energy consumption structure, and lifestyle, affecting land-use activities [17,18]. (1) The improvement of poverty often leads to land structure adjustment and changes in land-use activities, which have a direct impact on the quantity and quality of land elements as well as the quality of eco-environments. (2) Farmers’ willingness to conduct land ownership affirmation, land transfer, and financial activities will also be affected by household income. However, this interaction mechanism has not received enough attention in relevant research, which confines current research on land-based poverty alleviation to a static perspective, ignoring the impact of rural poverty on land and the dynamic interactions at play, as well as the cyclical, cumulative effect that may be formed by such interactions. Therefore, the dynamic mechanisms of land-based poverty alleviation cannot be accurately described.
This research focuses on the role of land resource endowment and capital endowment in poverty alleviation. Based on the perspective of resource and capital, this research investigates the mechanisms and roles of land resource and capital endowment in poverty reduction and constructs a panel vector autoregressive (PVAR) model to carry out empirical tests. The aim is to provide beneficial support for the overall improvement of the quality of land-based poverty alleviation and future responses in poverty management.
2. Theoretical Framework
2.1. Land Resource and Land Capital
2.1.1. Land Resource Endowment and Land Capital Endowment
Land has dual attributes: resource and capital. As the material basis of human survival and development, land resource endowment plays the roles of production factor, livelihood source, and ecological base, in production, living, and ecological activities, respectively. Land resource endowment can also be defined at the levels of land scale, land quality, and land eco-environmental status [19]. (1) Among these definitions, the former two represent the scale and quality of land owned by individuals that can be used for production and life. They determine the scale of production, output, and efficiency of agriculture and other industries as well as affecting individuals’ income and their ability to pay for reproduction and living costs [20]. (2) The eco-environmental status of land represents the ecological environment quality of the land itself and the above-ground space. Soil pollution, ecological degradation, and other problems will directly affect the human settlement environment [21].
Land capital endowment can be defined as the ability to generate value and increment after land transfer. Therefore, from the perspective of the process of value manifestation, it can be interpreted as the improvement of land property rights, land transfer, and land increment [22,23]. (1) First of all, the determination of land capital value is based on the integrity, clarity, and stability of property rights. Solutions to the problems of incomplete property rights, unclear boundaries, and uncertain duration of land property rights can help the rightful land holders eschew high transaction costs and transaction risks and flexibly use their property rights to ensure the realization of property income [24]. (2) Secondly, the manifestation of land capital value is based on the effectiveness of a given land transfer mechanism. After the land market provides a good mechanism of supply and demand and mechanism of price, land has an exchange value, and the land price is represented by a common currency—that is, the capitalization of land rent is completed [25]. (3) In addition, land capital incremental value mainly includes the natural increment caused by governmental and public actions, the artificial increment caused by direct investment of farmers in the land, and the multiplier effect brought about by all kinds of capital operational activities which use land as collateral and guarantee. Among them, the natural increment can usually be caused by social and economic development, infrastructural and environmental improvement, land use conversion or efficiency improvement, and land market volatility [26].
According to the above definition, the current land poverty alleviation policies of China can be divided into land resource-based policies and land capital-based policies (Table 1).

Table 1.
Land resource-based policies and land capital-based policies.
2.1.2. Mutual Feedback Effect of Land Resource and Land Capital
Land resource endowment and capital endowment are interrelated (Figure 1). Land capital is formed in the process of capitalizing land resources, which includes the improvement of land property rights, land transfer, and land increment. Therefore, the realization of these three processes affects the level of capital endowment. Obviously, these three processes are affected by the level of resource endowment of land elements. (1) First of all, the higher the quality of land resource, the stronger the farmers’ demand to confirm the right will be. Farmers with large-scale and high-quality land resources will likewise show a more positive attitude toward land ownership confirmation and registration. (2) Second, similar to high-quality commodities in the market, the improvement of land resource endowment will make it more favorable to consumers, thus promoting land transfer. (3) Finally, the improvement of land resource endowment is conducive to the enhancement of capital increment. High-quality land easily gains higher natural increment value because it is easier for owners to achieve infrastructure improvements and take advantage of the market. It can also more easily attract farmers to invest in improving production efficiency; thereby, farmers will gain artificial increments, obtain senior asset ratings (high-quality collateral) and participate in high-yield capital operations [27].
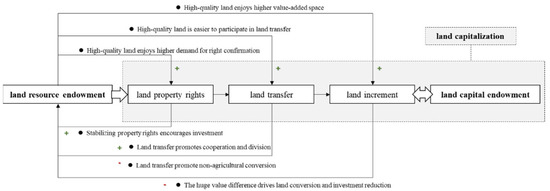
Figure 1.
Mutual feedback effect of land resources and land capital.
On the other hand, the impact of land capitalization on residents’ working and living conditions will impact their land resource utilization and protection behavior, thus affecting land resource endowment, which is still achieved through the improvement of land property rights, land transfer, and land increment. However, there is some controversy in the findings of the existing research. (1) Some scholars believe that land capitalization can promote the improvement of land resource endowment: (a) First of all, the tragedy of the commons proves that the integrity, clarity, and stability of land property rights can avoid unreasonable development activities and encourage users to actively increase investment and improve the quality of land resources. (b) Second, as the basis and premise of agricultural modernization, land transfer will effectively enhance land resource endowment. On the one hand, land transfer can promote the spatial integration of agricultural land resources, optimize land-use structures, reduce the costs of agricultural production, and realize the scale effect. On the other hand, it can promote the investment of capital, technology, labor, and management elements on the land [28,29]. (2) However, some studies show that this effect may be negative: (a) First of all, land transfer may accelerate the nonagricultural process of land, leading to problems such as the reduction in agricultural land, the decline in soil fertility, the reduction in ecological benefits, and the loss of biodiversity. (b) At the same time, the huge gap between construction land and agricultural land increases farmers’ preference for land transfer and reduces the motivation of the right holders to improve their land resources. A 2016 study based on six provinces in China found that most land users tend to invest their income from land transfer into nonagricultural affairs [30,31].
On the basis of the above analysis, we propose Hypothesis 1:
Hypothesis 1.
A mutual feedback effect exists between land resource endowment and capital endowment.
2.2. Effect of Land on Poverty Reduction
2.2.1. Poverty Reduction Effect of Land Resource Endowment Improvement
Land is the main carrier of human survival and production activities. Land resource endowment directly affects the income level of rural poor people. (1) First of all, as the most important and basic factor of production in poor areas, the amount of land resources that can be used for production has a significant impact on farmers. In China especially, deeply impoverished areas are often areas with a severe shortage of cultivated land, a lack of reserve resources, and a scarcity of cultivated land area per capita. Therefore, improving the amount of agricultural land resources through farmland consolidation can directly improve the agricultural income of farmers [32]. (2) Second, the improvement of the quality of land resources can improve the production conditions of rural poor people. The improvement of production conditions, such as land leveling, soil fertility, intensive utilization, and water conservancy facilities, can reduce the production cost and improve production efficiency [6,33]. (3) The improvement of land eco-environmental status will also have a positive impact on economic and social development. The reduction in the frequency and intensity of natural disasters, the improvement of human settlement environmental quality, and the improvement of production and living standards can effectively reduce poverty caused by illnesses and disasters. In addition, good ecological environment can activate the development potential of poor rural areas, providing a foundation for ecological economy development [34,35].
2.2.2. Poverty Reduction Effect of Land Capital Endowment Improvement
Land capitalization is a process in which land property rights are complete, clear, and stable; land transfer is promoted and the ability of land increment is enhanced; finally, the property income and operating income of farmers can be substantially improved. (1) First of all, the integrity, clarity, and stability of land property rights can directly increase the land property owned by farmers and reduce their risk exposure [36]. (2) Second, the improvement of the level of land transfer increase operative income. Land transfer in the market can effectively improve the efficiency of land resource allocation and utilization by optimizing the supply-and-demand structure and making full use of idle and inefficient land. It also influences the utilization structure of capital, labor, and other production factors and improves the level of division and cooperation, thus improving the operative income of poor farmers. (3) Finally, the increment of land capital value can improve the capital gains and operating income. (a) The promotion of natural increment means that farmers can benefit from their value-added land. For example, farmers can attain more compensation for the acquisition of agricultural land to better improve their living conditions. (b) The enhancement of artificial increment means that farmers can attain more benefits from unit land investment and unit capital investment and improve their operating income. (c) The enhanced increment capacity of capital operations based on land will also enable farmers to obtain more funds, thus improving poverty [37,38].
On the basis of the above analysis, we propose Hypothesis 2:
Hypothesis 2.
Land resource endowment and capital endowment have a poverty-reduction effect.
2.3. Circulation Effect of Land Elements and Degree of Rural Poverty
In the economic system, the degree of rural poverty may interact with land factors, and there may be a vicious accumulation phenomenon of “lack of livelihood capital—aggravation of poverty—further scarcity of livelihood capital—further aggravation of poverty”. Farmers trapped in poverty will choose to increase their consumption and reduce their savings and investment. This will result in insufficient financial investment in land and input in land production, hindering land capitalization operations and expansion of land production, thus leading to the reduction in land resource endowment and capital endowment. Conversely, the improvement of rural poverty will have a positive impact on land resource endowment and capital endowment. Thus, rural poverty forms a circular relationship with land resource and capital endowment, which will continue to amplify the interaction between land endowment and rural poverty, resulting in a virtuous or vicious cycle (Figure 2) [39,40,41].
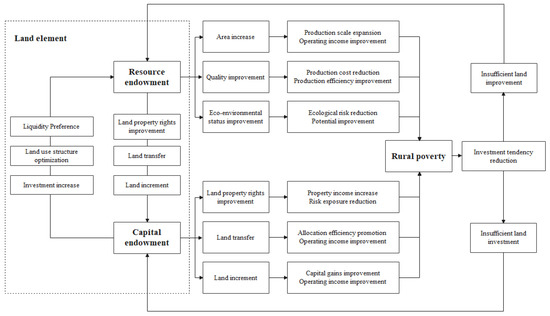
Figure 2.
Circulation effect of land elements and degree of rural poverty.
On the basis of the above analysis, we propose Hypothesis 3:
Hypothesis 3.
Interaction occurs between land resource endowment, capital endowment, and rural poverty.
3. Research Design and Variable Selection
3.1. Measurement Model Setting
In consideration of endogeneity, the PVAR model was adopted in this research. The panel vector autoregression (PVAR) model used in this paper was derived from the vector autoregression model (VAR). The PVAR model inherits the basic model settings of the VAR model, which sets all variables as endogenous variables, and reflects the dynamic correlation between variables by orthogonalizing the error term. The PVAR model can control unobservable individual heterogeneity, including the individual effect and the time effect. The PVAR model has been applied extensively in the field of macrolevel economic, financial, and ecological analyses [42,43]. Additionally, the generalized method of moments (GMM), an impulse response function analysis, and a variance decomposition analysis were carried out to better explain the interaction between land resource endowment, capital endowment, and rural poverty. The PVAR model can deal with short-term panel data well. When ( is the time length of panel data and is the lag order selected by the model), parameters can be estimated. When is satisfied, parameters of lag variables can be estimated under steady state. The PVAR model is set as follows:
In the equation, is a set of vectors, including rural poverty, land resource endowment, and land capital endowment; and represent observation individuals and observation time, respectively; is the observed value of lag period ; is a positive integer not exceeding m; represents the sum of the lag items in each period; represents the time effect, which is used to reflect the simultaneous, common impact on individuals; refers to the individual effect, which is used to express the individual differences that are difficult to explain.
3.2. Description of Variables and Data
3.2.1. Variable Selection
- (1)
- Rural poverty (): The problem of poverty measurement is relatively complex. Since poverty measurement is not the core content to be solved in this research, this research did not attempt to perfect the measurement of poverty from the perspectives of multidimensional poverty theory, ability poverty theory, relative poverty theory, etc., but only measures the incidence of absolute poverty in rural areas on the economic scale. This study used a rural poverty incidence rate to measure rural poverty [44,45].
- (2)
- Land resource endowment (): This research selected the evaluation index of land resource endowment from the three dimensions: quantity, quality, and eco-environmental status of land.
- Considering that agriculture is the main way for rural land to participate directly in production, this research used the proportion of household cultivated land area () to measure the quantity of land.
- It is common to measure the quality of land production factors in the evaluation of farmland adaptability. Common measure indexes include meteorological, water, soil quality, and topography. However, it is difficult to obtain provincial panel data for such indicators. In this study, the ratio of land affected by natural disasters () and the effective irrigated area ratio () were used to characterize the quality of land elements [46].
- Research usually uses direct land environmental indicators or an indirect index of ecological restoration to describe land eco-environmental status. As provincial-level data acquisition for the former is difficult, this research used two indirect indexes to measure the land eco-environmental status—namely, the land consolidation area ratio () and the proportion of water loss and soil erosion control areas () [47].
- (3)
- Land capital endowment (): Based on the definition of land capital endowment in this paper, the evaluation indexes were selected from three dimensions:
- The improvement of land property rights was measured mainly by the indicators related to the number of registrations and certificates issued. For the consideration of data availability, this research used the initial number of land registration per unit area () to measure the land property rights [36].
- Given the huge difference in the average farmland area among provinces, the household cultivated land transfer ratio () was used to represent the degree of household land participation in the land transfer. The calculation method was as follows:where represents the area of cultivated land operated and represents the area of cultivated land transferred.
- In view of the active level of land participation in the financial market, this study chose three indicators for measurement: the average annual price of land transfer (), the proportion of land acquisition area (), and the proportion of land transferred area () [48,49].
- (4)
- Control variables: Based on the macroscale factors affecting poverty and the characteristics of the PVAR model, road density () was selected as a control variable to represent location conditions [50].
3.2.2. Data Source and Processing
Owing to the lack of data in some provinces, the data used in this paper were the provincial panel data of 29 provinces from 2010 to 2016. The data were taken from the following 2009–2016 publications: China Statistical Yearbook, China Land Resource Statistical Yearbook, China Health Statistical Yearbook, China Agricultural Yearbook, China Regional Economic Statistical Yearbook, National Rural Economic Situation Statistical Data, and China Rural Economic Management Statistical Annual Report. Owing to the absence of macro data of some indicators, the research data were updated to 2016. At the same time—due to the change in statistical caliber of cultivated land in the second national land survey that started in 2007, and the data being collected at the end of 2009—the statistical results for the cultivated land area in 2009 was 2.031 billion mu, far more than the 1.824 billion mu in the statistical result in 2008, making them incomparable. Therefore, data from before 2009 were not used in this research. The research period was set from 2010 to 2016.
The short-term panel data used in this article can be dealt with effectively using the PVAR model. Some studies have shown that the PVAR model can analyze panel data with T = 5/6 on a relatively long-term scale [51,52]. Contrary to the usual understanding, the poverty alleviation policy of land factors can rapidly change the regional endowment conditions. In particular, the centralized investment poverty-alleviation model with government support enables impoverished people to enjoy the effect of poverty alleviation in a timely manner. Under this model, most land poverty alleviation policies in China can take effect within one year, and policies that take more than five years have clear long-term characteristics. Even the relocation of poverty alleviation and ecological renovation projects, that takes effect relatively slowly, often does not require too long to implement. At the national level, the Chinese government completed the poverty alleviation relocation of nearly 10 million rural poor people from 2016 to 2020. The large-scale land ecological improvement projects carried out by Guizhou Province from 2005 to 2015 showed clear poverty-alleviation effects in about 2 years [53,54]. For the research period from 2010 to 2016, this paper analyzes the short-term and relatively long-term effects of land resource endowment and land capital endowment on rural poverty.
The data are normalized and logarithmic. First of all, to eliminate the incompatibility caused by different dimensions of data, this study uses the minimax method (Formulas (3) and (4)) to standardize the data. To avoid subjectivity, it also uses an entropy weight method (Formulas (5) and (6)) to weigh the index.
where is the observed value; is the result of standardization; is the corresponding positive value obtained after adjustment of standardization results; and represent individual and indicator, respectively: , .
The spatial distribution of , , and at the provincial level is shown in Figure 3. From 2010 to 2016, the rural poverty level basically showed a state of low poverty in the east and high poverty in the west. The central region was the area showing the most significant poverty alleviation, and the poverty problem in Western China remained severe by 2016. Similarly, the central region showed clear improvement in land resource endowment and land capital endowment.
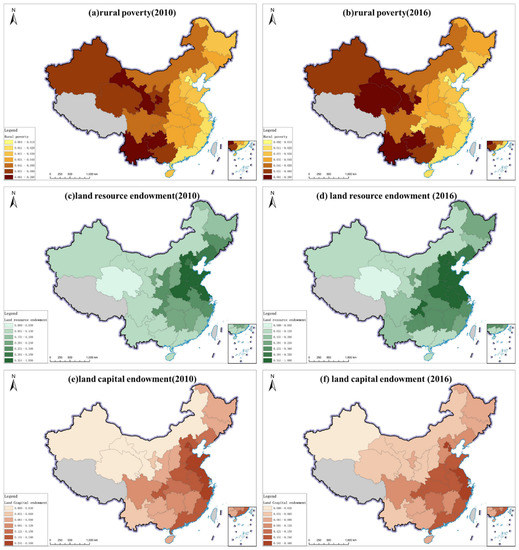
Figure 3.
Schematic diagram of , , and in 2010 and 2016: (a,b) illustrate the spatial distribution maps of rural poverty () in 2010 and 2016; (c,d) illustrate the spatial distribution maps of land resource endowment () in 2010 and 2016; (e,f) illustrate the spatial distribution maps of land capital endowment () in 2010 and 2016. The meaning and calculation method of , , and are described in Section 3.2.1. Among them, and are obtained by summing up the relevant indexes after standardization and weighting by the entropy method. In order to make the results of 2010 and 2016 more comparable, this study slightly adjusted the segmentation results of the natural breaks method.
To reduce the possible heteroscedasticity of the data, the natural logarithm was used, and the processed variables are expressed as , , and , respectively. The descriptive statistics of the variables are shown in Table 2. From 2010 to 2016, continued to decrease, and the standard deviation increased, which was related to the differences in poverty depth and poverty alleviation difficulty among provinces. Additionally, continued to increase. The Chinese government adopted strict policies to protect agricultural land and carried out various ecological and environmental protection projects on rural land, effectively curbing the destruction and waste of land resource. After the fluctuation, basically maintained stability, but the standard deviation clearly decreased. Due to the central government’s control of local land finance, the further capitalization process in areas with a higher level of land capitalization has been controlled, and the gap of land capital endowment between developing and developed areas had been narrowed.
Table 2.
Descriptive statistics of variables.
4. Empirical Research
4.1. Empirical Test
4.1.1. Unit Root Test
To avoid the estimation failure caused by “pseudo regression”, the PVAR model requires that a stationarity test be performed before model estimation. The stationarity test of panel data should match the data characteristics. The LLC test is mainly applicable to the same root conditions, while the IPS test is usually applicable to different root conditions. To improve the verification accuracy, both the LLC and IPS test methods were adopted in this research. Since the IPS test is too sensitive to the setting of limiting trends, which may affect the validity of the test, this study used the improved Breitung method to correct it. Therefore, LLC, IPS, and Breitung were adopted in this research to test the stationariness of panel data (Table 3), and the null hypothesis of each test was the existence of the unit root.
Table 3.
Stationarity test results of panel unit root.
The results showed that the variables could not completely pass the test. The results showed that all variables passed at least one test satisfactorily and, thus, not required to be differentiated [55]. The dlpr passes the stationarity test under the LLC and Breitung methods, and the test results of other variables in the three methods all showed that they reject the null hypothesis at the 1% level. Differential variables , , , and were introduced into the model.
4.1.2. Determination of Lag Order
The Table 4 reports the test results of the lag order based on three judgment criteria: AIC, BIC, and HQIC. The results of AIC and HQIC suggested choosing lag order 2, but the result of BIC suggested choosing lag order 1. In consideration of the sample size and model characteristics, this research selected the first-order lag, as supported by the BIC criterion.
Table 4.
Selection of lag order.
4.1.3. Granger Causality Test
After the lag order was determined, a Granger causality test of lag order 1 was carried out to verify the Granger causality among the variables. The results verify the following Granger causalities (Table 5): (1) Land resource endowment was found to be the Granger-determined reason of rural poverty. (2) A bidirectional Granger causality was found between rural poverty and land capital endowment. (3) A bidirectional Granger causality was found between land resource endowment and land capital endowment.
Table 5.
Granger causality test results.
4.2. GMM Estimation Results
The relationships among , , , and dlrd, as estimated by GMM, are shown in Table 6.
Table 6.
GMM estimation results.
The results showed the following: (1) Lag 1 land resource endowment had a positive impact on land capital endowment and lag 1 land capital endowment had a negative impact on land resource endowment. These findings verified Hypothesis 1—that is, an increase in land resource endowment leads to an increase in capital endowment; otherwise, an increase in land capital endowment is accompanied by a decrease in land resource endowment. (2) Both lag 1 land resource endowment and lag 1 land capital endowment were found to have a negative impact on rural poverty. This finding verified Hypothesis 2—that is, the improvement of land resource and capital endowment can play a positive role in improving rural poverty. (3) Lag 1 rural poverty was found to have has a significant negative impact on land capital endowment, which partially verifies Hypothesis 3. There is a two-way relationship between land capital endowment and rural poverty, and since the two-way relationships are both negative, they can form a circular effect.
4.3. Impulse Response Function
GMM estimation can only reflect the dynamic relationship between variables in a relatively macroscopic way. To further verify the dynamic interaction and conduction mechanism among variables, this research conducted an impulse response analysis on the relationship between the three variables and obtained the impulse response diagram among the variables through 500 Monte Carlo simulations. The specific results are shown in Figure 4. All the images converged within the period of 6, indicating that the data had stationarity and were of analytical significance. Figure 4 presents the impulse response diagram in the PVAR model, mainly showing the response of variable a to the impact of variable b. The horizontal axis indicates that the number of selection lag periods is 10; the vertical axis indicates the response degree of the variable to the impact. For example, Figure 4e, “irf of to ”, shows the change in ’s response to a standard deviation shock over time (red polyline) and the results estimated by 95% confidence bands (the other two lines).
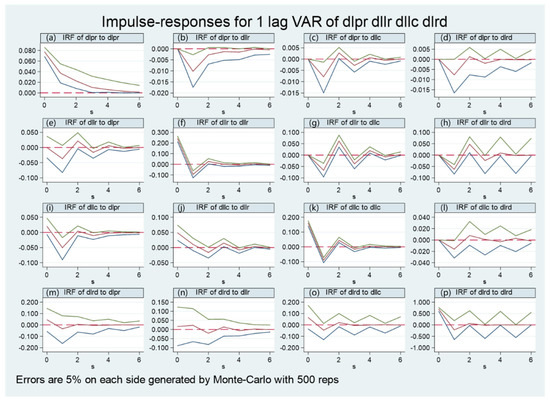
Figure 4.
Impulse responses for 1 lag VAR of , , , and .
- (1)
- Land capital endowment showed a positive response to the impact of land resource endowment in the analyzed period. The response amplitude reached 0.050 and rapidly declines to 0 in the lag 1, which conforms to the transformation relationship between the two. The improvement of land resource endowment will immediately affect the capital value. The impact of land resource endowment on land capital endowment has a negative response in lag 1, with the response amplitude of −0.070. This result indicated that the process of land capitalization still has a negative impact on land resource endowment. In the process of land capitalization, the improvement of property rights, land transfer, and land finance shows limited effects on the improvement of land resource endowment; additionally, the influence on land resource endowment is more manifested as the decline of land agricultural production capacity and eco-environmental quality. This outcome indicates that the unreasonable tendency of land resource utilization to quickly obtain high value-added benefits and maximize benefits at the cost of the decline in the quality of the natural environment and the decline in factor quality has not been reversed. Land resource endowment and capital endowment in the process of poverty reduction cannot interact benignly between each other.
- (2)
- The results showed that the degree of rural poverty has a significant negative response to the impact of land resource endowment and capital endowment in lag 1, reaching −0.010 and −0.008, respectively, and rapidly attenuating to 0 in the lag 2. However, the rural poverty degree shows a negative response to the impact of capital endowment in the third lag period—though the intensity is limited—and it decreases to 0 in the fourth lag period. The results of impulse response show some differences between the poverty reduction effects of land resource and capital endowment. The poverty reduction effect of resource endowment is stronger, but the effect of capital endowment is relatively long term, which is related to the circular effect which is discussed herein.
- (3)
- When rural poverty has a positive impulse, land capital endowment has a negative response in lag 1, with a response amplitude of −0.050, which decreases to 0 in lag 2. The response of land resource endowment is not significantly different from that of 0. This finding shows that the impulse of rural poverty on land factors is mainly reflected in land capital endowment. Impulse response results show that the cyclical cumulative effects of land capital endowment and rural poverty are relatively simple, and the interaction mainly occurs in the next period. Specifically, the current land capital endowment ascension will lead to the weakening of lag 1 rural poverty; then, lag 2 land capital endowment increases again; then, lag 3 rural poverty weakens again. Thus, a virtuous circle is formed. This condition can explain the negative response of rural poverty to the impact of land capital endowment in the lag 3 period. From the perspective of response strength, the reverse effect of rural poverty on land capital endowment (−0.050) is significantly stronger than that of land capital endowment on rural poverty (−0.008), indicating that the poverty reduction effect of land capital endowment will be continuously enhanced by this circular relationship.
4.4. Variance Decomposition Analysis
Table 7 gives the variance decomposition analysis results for the first, second, fifth, and tenth forecast periods. The vast majority of variables in the first period were found to be basically only affected by themselves; the impact of land resource and capital endowment on rural poverty was found to gradually increase from the second period, indicating a certain lag in land-based poverty alleviation. The variance decomposition results of the fifth and tenth periods were basically the same. The system can be considered as basically stable after the fifth period—that is, the interpretation degree of the variable error term is basically stable in the relatively long term. Therefore, the results of the fifth period were selected to illustrate the degree of mutual influence of various variables.
Table 7.
Results of variance decomposition analysis.
The results of variance decomposition analysis showed that the impact of land resource endowment on the degree of rural poverty (0.014) is slightly stronger than that of land capital endowment (0.009). Additionally, the direct poverty reduction effect of land resource endowment is more obvious, which is consistent with the results of impulse response.
4.5. Robustness Test
4.5.1. Robustness Test under Changing Variable Order
Since the GMM estimation, impulse response function, and variance decomposition analysis of the PVAR model are all affected by the order of variables, we changed the order of variables and carried out another empirical test. The main metrological test results were basically consistent with the results shown by the main model; therefore, the main conclusions of this research can be considered robust (Table 8 and Figure 5).
Table 8.
GMM estimation results.
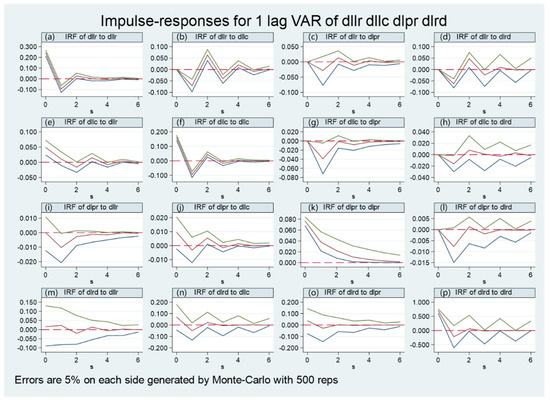
Figure 5.
Impulse responses for 1 lag VAR of , , , and .
4.5.2. Robustness Test under a Different Period and Index Measurement
First of all, to better verify the theory, the period of time was extended to 2005–2017. Second, some measurement indicators were changed: (1) The net income of rural residents was used to represent the rural poverty situation instead of the rural poverty incidence rate. (2) A single index was used to measure land resource endowment or capital endowment. Land consolidation area was used to measure land resource endowment, and the rural household farmland transfer ratio was used to represent land capital endowment. Data ware from National Rural Economic Statistics and China Rural Operation and Management Statistical Annual Report published from 2005 to 2017. (3) Road density was still used as the control variable.
The main metrological test results were found to be basically consistent with the results of the main model; therefore, the research conclusion can be considered robust (Table 9 and Figure 6).
Table 9.
GMM estimation results.
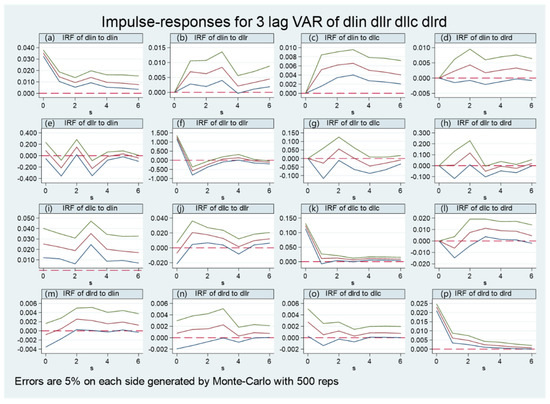
Figure 6.
Impulse responses for 3 lag VAR of , , , and .
5. Discussion
5.1. Synergy and Opposition between Land Resource Endowments and Capital Endowments
The study found that, in the field of poverty alleviation by land elements, the land resource of and capital endowments were both synergistic and opposed (Figure 7). On the one hand, land resource policy and capital policy were synergistic with each other in their role in poverty alleviation. The relevance of land resource endowment and capital endowment determined the complex nature of the policy’s effectiveness. In poverty alleviation, policymakers will not deliberately distinguish between resource-based and capital-based policies but will use a combination of these policy types to solve problems. For example, the core purpose of poverty alleviation relocation policies is to solve the problem of poor living conditions, especially in poverty-stricken areas. In essence, the purpose is to improve the level of land scale, land quality, and land eco-environmental status in areas where impoverished people live. However, at the same time, the policy implementation needs to allocate land resources sufficiently enough to maintain production activities and living standards for the relocated population in the resettlement area, which will promote land transfer and index allocation.
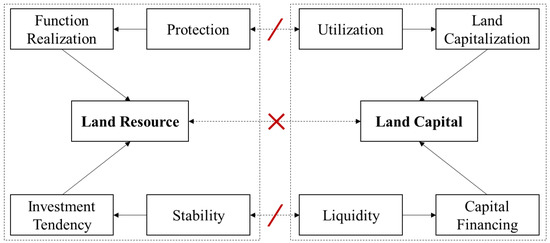
Figure 7.
Dilemma between resource and capital.
On the other hand, resource-based and capital-based policies are in opposition, and there is a dilemma between resource and capital. (1) There is a contradiction between protection and utilization. The ecological protection and agricultural production functions carried by land resources require the protection of land habitat environments, maintenance of land status, and control of utilization intensity. However, the improvement of land capital endowment must be accompanied by land utilization, such as land expropriation, land mortgage, and other land nonagricultural processes. (2) A contradiction also exists between stability and liquidity. The increment of land elements is based on circulation, which will inevitably affect the stability of land property rights. Stability is the basis for property owners to make continuous investments in their land. Therefore, with the improvement of capital circulation, owners will reduce the investment scale used to improve the quality of land resources. Especially in the case of asymmetric information and high profits in the land capital market of China, land capital circulation can very easily become excessive.
5.2. Immediacy of Poverty Alleviation by Land Elements
It is generally believed that land element poverty alleviation policies, especially the land resource-based policies, will show relatively long-term effects because it will take some time for the improvement of factor endowments to be transformed into income. However, the research results prove that the poverty reduction effect of improving land resources and capital endowments can produce short-term effects, which may be related to the campaign style of China’s poverty alleviation policies. Owing to the great pressure faced by China’s poverty alleviation work, the poverty alleviation policy must be timely. Therefore, the land-based poverty alleviation policy reflects the characteristics of a campaign style.
For deeply impoverished areas, the relationship between poverty alleviation investments and poverty alleviation processes is not a linear relationship with a fixed slope but is more akin to an exponential function with a gradually increasing slope (Figure 8). Given the weak infrastructure, management technology, scientific and technological strength, and other basic conditions in impoverished areas, the poverty reduction effect of unit investment is low in the first stage of the function, which is located in quadrant III. At this stage, a large number of capital and labor factors are invested, but the degree of poverty improvement is very little, which is unacceptable to the local government and to impoverished people. Therefore, compared with the slow-effect policy, the government prefers large-scale comprehensive land consolidation projects and plans, which can take effect rapidly. In other words, for performance considerations, the government tends to reach inflection point O of the function as soon as possible through large-scale investment to obtain a higher output–input ratio. Combined with the increase in scholars’ recognition of campaign-style governance models in recent years, this situation also shows that campaign-style governance is superior to conventional governance models in solving specific governance issues [56].
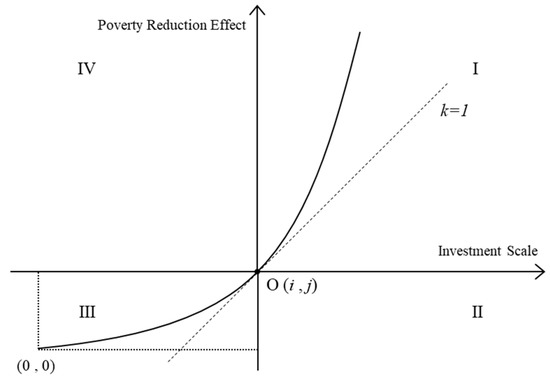
Figure 8.
Relationship between investment scale and potential reduction effect.
5.3. Negative Feedback of Rural Poverty on Land Elements and Circular Relationship
The poverty-alleviation effect brought about by using land elements is not only reflected in the direct poverty reduction effect of the improvement of land resources and capital endowments but is also indirectly affected by the feedback of poverty improvement. The research results show that rural poverty will have a negative impact on land capital endowment, and the deepening of poverty will inhibit the investment tendency of farmers and hinder the process of land capitalization. However, the negative impact on resource endowment has not been verified. The reason may be that there is external interference. When poverty intensifies, the impact of the government’s poverty-alleviation work will cover the reduction in the farmers’ own investment propensity. Furthermore, for regions with deeper poverty, the government will invest more. However, the goal of this investment is to ensure survival rather than to seek development. Therefore, this interference has a limited impact on capital endowments.
This negative impact will form a circular mechanism with the poverty reduction effect of land capital endowment, forming a circular cumulative impact chain: capital endowment increases (decreases)—rural poverty weakens (increases)—land capital endowment is affected and continues to increase (decrease)—rural poverty weakens (increases). This effect will gradually expand the initial shock. Therefore, this circular relationship shows the effectiveness and sustainability of land capital endowment in poverty alleviation. Although the effect of land capital endowment in poverty alleviation is limited in the initial stage, it can be accumulated and value-added through the circular mechanism to produce a greater and relatively longer-term impact.
6. Main Conclusions and Policy Recommendations
The research results show that: (1) The inhibitory effect of land on rural poverty can be understood from the two dimensions—land resources and land capital. Both land resources and capital endowment show significant poverty reduction effects, but both have differential poverty reduction effects. Comparatively speaking, land resource endowment has a stronger short-term poverty reduction effect; land capital endowment shows a relatively longer-term poverty reduction effect; the mechanism of poverty reduction in land capital endowment is more persistent under the influence of circular effect. (2) At the same time, changes in rural poverty will affect land factors in turn. The direction of mutual influence between rural poverty and land capital endowment has the same direction; thus, a circular relationship with a simple structure and continuous amplification is formed. The cyclical, cumulative effect expands the impact of initial changes, making the land capital endowments with relatively weak direct poverty reduction effect play a more effective role in the relatively longer term. From the results of impulse response, the impact of land capital endowment and rural poverty will also occur mainly in the next period, which makes this circular relationship form in a rapid and structurally stable manner. Thus, it has good applicability. (3) Note that there is a reverse-interaction relationship between land resources and capital endowment. Land resource endowment has a positive impact on land capital endowment in the current period, while land capital endowment has a negative impact on land resource endowment in the next period, which leads to some quality loss in the process of comprehensive poverty alleviation using land elements. It is not difficult to understand that high-quality land always contributes both high-quality production factors and high-quality ecological factors simultaneously. The process of capitalization is similar to that of the individual choices made by individual ranchers in the tragedy of the commons. The choices made by each individual based on the principle of their maximizing personal interests often lead to the loss of collective interest.
On the basis of the above conclusions, we put forward the following policy recommendations: (1) Improve the accuracy and pertinence of land factor poverty alleviation strategies. The research results showed that land resource and capital endowment have different poverty reduction effects on rural poverty. The poverty reduction effect of land resource endowment is strong but short-lived: the response reaches −0.010 and rapidly attenuates to 0 in stage 2. Additionally, the poverty reduction effect of land capital endowment has certain sustainability with the influence of the circular effect. Therefore, we can choose the modes of land poverty alleviation according to the actual situation of poverty-stricken areas and poverty-alleviation needs. For example, in areas with huge poverty pressure and high urgency of poverty alleviation, strategies such as land improvement and ecological restoration projects can be adopted to directly change the local land resources and environment; therefore, farmers will be able to directly obtain high-quality production factors. For impoverished areas with certain foundations but relatively slow development, a land finance system can be constructed to provide sustainable endogenous driving force for local development. (2) To improve the quality of poverty alleviation, we should consider the reverse impact of rural poverty on land factor endowment. The initial state of land capital endowment is found to have a very important impact on the improvement of rural poverty. When an initial land capital endowment changes, even if the subsequent system supply is no longer carried out, the circulation mechanism rapidly forms and expands the impact; thus, the continuous weakening of rural poverty is realized. However, once the land capital endowment deteriorates, it will lead to the persistent aggravation of poverty. Therefore, the poverty alleviation policy should increase input at the initial stage, promoting the formation of a benign initial development trend of local land capital endowment, improving the output quality of elements and policy inputs, and avoiding the adverse impact of a vicious circular system on the improvement of rural poverty. Specifically, when the policy allows the government to account for financial input and output over a longer period of time, the government can more actively invest in the early stages when the poverty-alleviation effect has not yet been shown, effectively relieving the financial pressure in the early stages of poverty alleviation and improving the poverty-alleviation effect. (3) Avoid overcapitalization: It was found that land resource endowment has a positive impact on land capital endowment; meanwhile, land capital endowment has a negative impact on resource endowment. This means that, when the policy improves the land resource and capital endowment at the same time, a positive relationship cannot be formed. The improvement of land capital endowment will reduce the land quality, and reduce the willingness to invest, leading to destructive and unsustainable land development and utilization processes; these have a negative impact on resource endowment and lead to the loss of effective poverty alleviation outcomes. Therefore, in poverty alleviation work utilizing land elements, it is necessary to adjust the poverty alleviation policy structure and improve the quality of poverty alleviation by means of precise investment and precise management. Therefore, although the improvement of land capital endowment can form a relatively long-term effects, the government must carefully use such policies when considering the negative impact on land resource endowment. Otherwise, there will be structural development problems, just as the current research reflects on the gains and losses of China’s local government’s land finance policy. It should be noted that, based on objective data constraints, the research data in this paper are macro statistical data from 2010 to 2016. Considering that the macro data at the provincial level are vulnerable to various factors, the characterization effect of rural poverty needs to be further improved. In the future, more micro data must be collected through questionnaires and surveys to verify the research results so as to improve the scientific validity of our findings.
Author Contributions
D.Z. was responsible for the conception of the paper, the data processing, the analysis of the results, and the writing of the manuscript; M.Y. and Z.W. made meaningful suggestions and revised the manuscript. All authors have read and agreed to the published version of the manuscript.
Funding
This study was supported by a grant from the Beijing Outstanding Young Scientist Program (JJWZYJH01201910003010), the National Natural Science Foundation of China (grant no. 72074217; grant no. 72134008), and the major project of national social science fund (grant no. 21&ZD121).
Data Availability Statement
Not applicable.
Acknowledgments
We thank Fangzhou Xia for giving their suggestions regarding this paper.
Conflicts of Interest
The authors declare no conflict of interest.
References
- Yang, Y.Y.; Liu, Y.S. The code of targeted poverty alleviation in China: A geography perspective. Geogr. Sustain. 2021, 2, 243–253. [Google Scholar] [CrossRef]
- Wang, C.; Wan, G.H. Income polarization in China: Trends and changes. China Econ. Rev. 2015, 36, 58–72. [Google Scholar] [CrossRef]
- National Bureau of Statistics of the People’s Republic of China (NBS). China Statistical Yearbook. 2019. Available online: http://www.stats.gov.cn/tjsj/ndsj/2019/indexch.htm (accessed on 1 August 2022).
- Ohlin, B. Interregional and International Trade; Harvard University Press: Cambridge, MA, USA, 1933. [Google Scholar]
- Varga, M. Poverty reduction through land transfers? The World Bank’s titling reforms and the making of “subsistence” agriculture. World Dev. 2020, 135, 105058. [Google Scholar] [CrossRef]
- Zhou, Y.; Guo, Y.; Liu, Y.; Wu, W.; Li, Y. Targeted poverty alleviation and land policy innovation: Some practice and policy implications from China. Land Use Policy 2018, 74, 53–65. [Google Scholar] [CrossRef]
- Li, Y.R.; Li, Y.; Karácsonyi, D.; Liu, Z.J.; Wang, Y.S.; Wang, J.Y. Spatio-temporal pattern and driving forces of construction land change in a poverty-stricken county of China and implications for poverty-alleviation-oriented land use policies. Land Use Policy 2020, 91, 104267. [Google Scholar] [CrossRef]
- Li, D.M.; Yang, Y.Y.; Du, G.M.; Huang, S.L. Understanding the contradiction between rural poverty and rich cultivated land resources: A case study of Heilongjiang Province in Northeast China. Land Use Policy 2021, 108, 105673. [Google Scholar] [CrossRef]
- Xiang, J.W.; Li, X.M.; Xiao, R.B.; Wang, Y. Effects of land use transition on ecological vulnerability in poverty-stricken mountainous areas of China: A complex network approach. J. Environ. Manag. 2021, 297, 113206. [Google Scholar] [CrossRef]
- Wu, Y.Z.; Mo, Z.B.; Peng, Y.; Skitmore, M. Market-driven land nationalization in China: A new system for the capitalization of rural homesteads. Land Use Policy 2018, 70, 559–569. [Google Scholar] [CrossRef]
- Cheng, X.; Chen, J.; Jiang, S.; Dai, Y.; Shuai, C.; Li, W.; Liu, Y.; Wang, C.; Zhou, M.; Zou, L.; et al. The impact of rural land consolidation on household poverty alleviation: The moderating effects of human capital endowment. Land Use Policy 2021, 109, 105692. [Google Scholar] [CrossRef]
- Ye, J. Land Transfer and the Pursuit of Agricultural Modernization in China. J. Agrar. Change 2015, 15, 314–337. [Google Scholar] [CrossRef]
- Gong, W.; Zhang, Q.F. Betting on the Big: State-Brokered Land Transfers, Large-Scale Agricultural Producers, and Rural Policy Implementation. China J. 2016, 77, 1–26. [Google Scholar] [CrossRef]
- Zhou, Y.; Guo, L.; Liu, Y. Land consolidation boosting poverty alleviation in China: Theory and practice. Land Use Policy 2019, 82, 339–348. [Google Scholar] [CrossRef]
- Chen, K.-q.; Long, H.-l. Impacts of land market on urban-rural integrated development in China. J. Nat. Resour. 2019, 34, 221–235. [Google Scholar]
- Guo, Y.; Liu, Y. Poverty alleviation through land assetization and its implications for rural revitalization in China. Land Use Policy 2021, 105, 105418. [Google Scholar] [CrossRef]
- Cheng, H.; Dong, S.; Li, F.; Yang, Y.; Li, Y.; Li, Z. A circular economy system for breaking the development dilemma of ‘ecological Fragility–Economic poverty’ vicious circle: A CEEPS-SD analysis. J. Clean. Prod. 2019, 212, 381–392. [Google Scholar] [CrossRef]
- Li, F.J.; Dong, S.C.; Li, F. A system dynamics model for analyzing the eco-agriculture system with policy recommendations. Ecol. Model. 2012, 227, 34–45. [Google Scholar] [CrossRef]
- Markovchick-Nicholls, L.; Regan, H.M.; Deutschman, D.H.; Widyanata, A.; Martin, B.; Noreke, L.; Ann Hunt, T. Relationships between Human Disturbance and Wildlife Land Use in Urban Habitat Fragments. Conserv. Biol. 2008, 22, 99–109. [Google Scholar] [CrossRef]
- Trodahl, M.I.; Jackson, B.M.; Deslippe, J.R.; Metherell, A.K. Investigating trade-offs between water quality and agricultural productivity using the Land Utilisation and Capability Indicator (LUCI)—A New Zealand application. Ecosyst. Serv. 2017, 26, 388–399. [Google Scholar] [CrossRef]
- Musacchio, L.R.; Grant, W.E. Agricultural production and wetland habitat quality in a coastal prairie ecosystem: Simulated effects of alternative resource policies on land-use decisions. Ecol. Model. 2002, 150, 23–43. [Google Scholar] [CrossRef]
- Fujii, Y. Putting the pieces together: How collaboration between land banks and community land trusts can promote affordable housing in distressed neighborhoods. Cities 2016, 56, 1–8. [Google Scholar] [CrossRef]
- Xia, F.Z.; Yang, Y.M.; Yan, J.M. Urban-Rural Land Bank System: An Exploration of New Urban-Rural Land Capitalization System. China Land Sci. 2020, 34, 48–57. [Google Scholar]
- Yan, J.M.; Yang, Y.M.; Xia, F.Z. Subjective land ownership and the endowment effect in land markets: A case study of the farmland “three rights separation” reform in China. Land Use Policy 2021, 101, 105137. [Google Scholar] [CrossRef]
- Chen, C.; Restuccia, D.; Santaeulàlia-Llopis, R. The effects of land markets on resource allocation and agricultural productivity. Rev. Econ. Dyn. 2021, 45, 41–54. [Google Scholar] [CrossRef]
- Xie, X.; Dries, L.; Heijman, W.; Zhang, A. Land value creation and benefit distribution in the process of rural-urban land conversion: A case study in Wuhan City, China. Habitat Int. 2021, 109, 102335. [Google Scholar] [CrossRef]
- Shi, Y.; Duan, W.; Fleskens, L.; Li, M.; Hao, J. Study on evaluation of regional cultivated land quality based on resource-asset-capital attributes and its spatial mechanism. Appl. Geogr. 2020, 125, 102284. [Google Scholar] [CrossRef]
- Fort, R. The homogenization effect of land titling on investment incentives: Evidence from Peru. NJAS-Wagening. J. Life Sci. 2008, 55, 325–343. [Google Scholar] [CrossRef]
- Baggio, J.A.; Barnett, A.J.; Perez-Ibara, I.; Brady, U.; Ratajczyk, E.; Rollins, N.; Rubinos, C.; Shin, H.C.; Yu, D.J.; Aggarwal, R.; et al. Explaining success and failure in the commons: The configural nature of Ostrom’s institutional design principles. Int. J. Commons 2016, 10, 417–439. [Google Scholar] [CrossRef]
- Burkhard, B.; Kroll, F.; Nedkov, S.; Mueller, F. Mapping ecosystem service supply, demand and budgets. Ecol. Indic. 2012, 21, 17–29. [Google Scholar] [CrossRef]
- Liu, Y.; Yang, Y.; Li, Y.; Li, J. Conversion from rural settlements and arable land under rapid urbanization in Beijing during 1985–2010. J. Rural Stud. 2017, 51, 141–150. [Google Scholar] [CrossRef]
- Ward, C.D.; Shackleton, C.M. Natural Resource Use, Incomes, and Poverty Along the Rural–Urban Continuum of Two Medium-Sized, South African Towns. World Dev. 2016, 78, 80–93. [Google Scholar] [CrossRef]
- Zhou, Y.; Li, Y.; Xu, C. Land consolidation and rural revitalization in China: Mechanisms and paths. Land Use Policy 2020, 91, 104379. [Google Scholar] [CrossRef]
- Haider, L.J.; Boonstra, W.J.; Peterson, G.D.; Schluter, M. Traps and Sustainable Development in Rural Areas: A Review. World Dev. 2018, 101, 311–321. [Google Scholar] [CrossRef]
- Liu, Y.; Liu, J.; Zhou, Y. Spatio-temporal patterns of rural poverty in China and targeted poverty alleviation strategies. J. Rural Stud. 2017, 52, 66–75. [Google Scholar] [CrossRef]
- Bu, D.; Liao, Y. Land property rights and rural enterprise growth: Evidence from land titling reform in China. J. Dev. Econ. 2022, 157, 102853. [Google Scholar] [CrossRef]
- Lawry, S.; Samii, C.; Hall, R.; Leopold, A.; Hornby, D.; Mtero, F. The impact of land property rights interventions on investment and agricultural productivity in developing countries: A systematic review. J. Dev. Eff. 2017, 9, 61–81. [Google Scholar] [CrossRef]
- Zhou, Y.; Li, X.; Liu, Y. Rural land system reforms in China: History, issues, measures and prospects. Land Use Policy 2020, 91, 104330. [Google Scholar] [CrossRef]
- Ding, W.; Hu, L. A research on the vicious-cycle of poverty, environmental degradation and disasters in Gansu province. In Strategy and Implementation of Integrated Risk Management; Qunyan Press: Beijing, China, 2007; pp. 159–160. [Google Scholar]
- Dong, S.; Wu, Y.; Wang, H. A study on the eco-economic development model in the eco-environmental vulnerable and needy region on Loess Plateau: The case of Dingxi Prefecture in Gansu Province. Geogr. Res. 2003, 22, 590–600. [Google Scholar]
- Wenguang, D. Analysis of Vicious Circle between Natural-social Environment and Poverty in Wen County of Gansu Province. J. Anhui Agric. Sci. 2007, 35, 7966–7967, 7976. [Google Scholar]
- Holtz-Eakin, D.; Newey, W.; Rosen, H.S. Estimating Vector Autoregressions with Panel Data. Econometrica 1988, 56, 1371–1395. [Google Scholar] [CrossRef]
- Arellano, M.; Bover, O. Another Look at the Instrumental Variable Estimation of Error-Components Models. J. Econom. 1995, 68, 29–51. [Google Scholar] [CrossRef]
- Rui, W.U. Construction of the Dynamic Indicator System for Measuring the Poverty Situation in Rural Areas of China. J. Anhui Agric. Sci. 2008, 36, 14311–14312, 14315. [Google Scholar]
- Sun, C.; Tang, W.; Zou, W. Measure of water poverty conditions and its spatial pattern mechanism in Chinas rural areas. Geogr. Res. 2012, 31, 1445–1455. [Google Scholar]
- van Wart, J.; Kersebaum, K.C.; Peng, S.; Milner, M.; Cassman, K.G. Estimating crop yield potential at regional to national scales. Field Crops Res. 2013, 143, 34–43. [Google Scholar] [CrossRef]
- Lal, R. Restoring Soil Quality to Mitigate Soil Degradation. Sustainability 2015, 7, 5875–5895. [Google Scholar] [CrossRef]
- Cheng, J. Analysis of commercial land leasing of the district governments of Beijing in China. Land Use Policy 2021, 100, 104881. [Google Scholar] [CrossRef]
- Fairbairn, M. ‘Like gold with yield’: Evolving intersections between farmland and finance. J. Peasant Stud. 2014, 41, 777–795. [Google Scholar] [CrossRef]
- Pereira, R.H.M.; Schwanen, T.; Banister, D. Distributive justice and equity in transportation. Transp. Rev. 2017, 37, 170–191. [Google Scholar] [CrossRef]
- Wang, M.; Zhou, T. Understanding the dynamic relationship between smart city implementation and urban sustainability. Technol. Soc. 2022, 70, 102018. [Google Scholar] [CrossRef]
- Erlando, A.; Riyanto, F.D.; Masakazu, S. Financial inclusion, economic growth, and poverty alleviation: Evidence from eastern Indonesia. Heliyon 2020, 6, e05235. [Google Scholar] [CrossRef]
- Yang, Y.; de Sherbinin, A.; Liu, Y. China’s poverty alleviation resettlement: Progress, problems and solutions. Habitat Int. 2020, 98, 102135. [Google Scholar] [CrossRef]
- Zhang, Z.; Jia, Z.; Zhou, Z. Can urban green space cure homesickness? Case study on China poverty alleviation migrants in Anshun, Guizhou. Urban. For. Urban. Green. 2022, 68, 127478. [Google Scholar] [CrossRef]
- Kim, M.; Cho, G.-H. Examining the causal relationship between bike-share and public transit in response to the COVID-19 pandemic. Cities 2022, 104024. [Google Scholar] [CrossRef]
- Jia, K.; Chen, S.W. Could campaign-style enforcement improve environmental performance? Evidence from China’s central environmental protection inspection. J. Environ. Manag. 2019, 245, 282–290. [Google Scholar] [CrossRef]
Publisher’s Note: MDPI stays neutral with regard to jurisdictional claims in published maps and institutional affiliations. |
© 2022 by the authors. Licensee MDPI, Basel, Switzerland. This article is an open access article distributed under the terms and conditions of the Creative Commons Attribution (CC BY) license (https://creativecommons.org/licenses/by/4.0/).