Article

Is Climate Change Restoring Historical Fire Regimes across Temperate Landscapes of the San Juan Mountains, Colorado, USA?

Program in Ecology, University of Wyoming, Laramie, WY 82071, USA
Land 2022, 11(10), 1615; https://doi.org/10.3390/land11101615
Submission received: 11 August 2022 / Revised: 13 September 2022 / Accepted: 19 September 2022 / Published: 21 September 2022
(This article belongs to the Section Land–Climate Interactions)

Abstract

:
Wildfires are increasing with human-induced climate change, but could this be ecologically beneficial in landscapes where recent fire is deficient relative to historical? I compiled 1980–2020 fire data for the San Juan Mountains, Colorado. I analyzed fire sizes and trends in area burned and fire severity, and compared fire density and rotations between 1980–2010 and 2011–2020 among ecosystem types and watersheds. I compared historical (pre-industrial) evidence from tree-ring, charcoal, and land-survey reconstructions to evaluate whether recent fire is outside the historical range of variability (HRV). Nearly all burned area was in the southwestern San Juans in 5 of 41 years and 35 of 4716 wildfires. Between 1980–2010 and 2011–2020, fire densities increased ∼200% and rotations shortened to ∼25%, similarly among ecosystems and watersheds, consistent with climatic effects. Fire rotations in 2011–2020 were within HRV for three ecosystems and deficient for four. Fire sizes and severities were within HRV. Moderate- and high-severity fire had no significant trend. Thus, reducing fire size or severity is currently ecologically unnecessary. Instead, incorporating fire from climate change, via wildland fire use, supplemented by prescribed burning, could feasibly restore historical fire regimes in most San Juan landscapes by 2050, the target of the Paris 1.5 °C goal.

1. Introduction

Increasing fire from climate change (e.g., [1]) is unnatural since temperatures are already well above historical levels, but could increasing fire be harnessed for ecologically beneficial landscape restoration? Restoring fire to its historical rates and patterns, for example, can be used to help achieve ecological restoration goals or to adapt ecosystems across landscapes to climate change [2]. Intentionally restoring historical fire (fire in the pre-industrial period) has become a common management goal in the western United States where large areas of natural forests, shrublands, and grasslands remain (e.g., [3]), so increasing fire might seem generally beneficial in these landscapes.
Wildfires in the western United States, the location of this study, were strongly controlled by climate fluctuations and directional climate change at the Pleistocene–Holocene transition [4]. Both modeling [5,6] and empirical studies [7] show that recent climate change is leading to more intense wildfires that spread more rapidly and burn more area. Past forest management logged large trees in drier forests, altered stand-level spatial patterns, and suppressed wildfires, which increased vulnerability to wildfires [8].
Unfortunately, increasing fires have also caused wildland–urban interface disasters for people, buildings, and infrastructure, particularly where these are located within 100 m of wildland vegetation [9]. Increasing fires also have been damaging to some ecosystems if too frequent or too severe (causing mortality or damaging biological processes), as in sagebrush landscapes where invasive grasses can take over [10]. Thus, it is essential to ask whether the current rate of fire during climate change is too much, sufficient, or insufficient for restoring fire across landscapes and also not ecologically damaging? If so, fewer resources may be needed and more could be spent where increasing fire is damaging to people or nature.
An essential step in analyzing this question from an ecological standpoint is to understand the relationship of recent rates and patterns of fires across landscapes relative to reference evidence on historical rates and patterns, often called the natural or historical range of variability, HRV [11], as applied, for example, in [12]. This step is often foregone; recent fires, particularly moderate- to high-severity fires, may be simply labeled bad fire while low-severity fire is labeled good fire (e.g., [1]). If fires are increasing or are burning at moderate or high severity, it is still essential to first determine whether they are burning inside or outside HRV. Severe fires are within the HRV for many ecosystems (e.g., [13]).
Pre-industrial fire histories, necessary to characterize the HRV, have been reconstructed around the world using tree-ring methods, e.g., [14], paleo-charcoal [15], early written records and photographs [16], and even amoeba and hydrology of peat deposits [17]. Recent fire histories for comparison have typically been compiled in geographic information systems from multiple sources, including maps, reports, online databases, and remote sensing [18].
Here I use some of these sources to spatially analyze the title question, is climate change restoring historical fire regimes across temperate landscapes of the San Juan Mountains, Colorado, USA? This is a case study in the San Juan Mountains of southwestern Colorado. This range contains a cross-section of ecosystem types and landscapes typical of parts of the montane southwestern United States and southern Rocky Mountains.

2. Materials and Methods
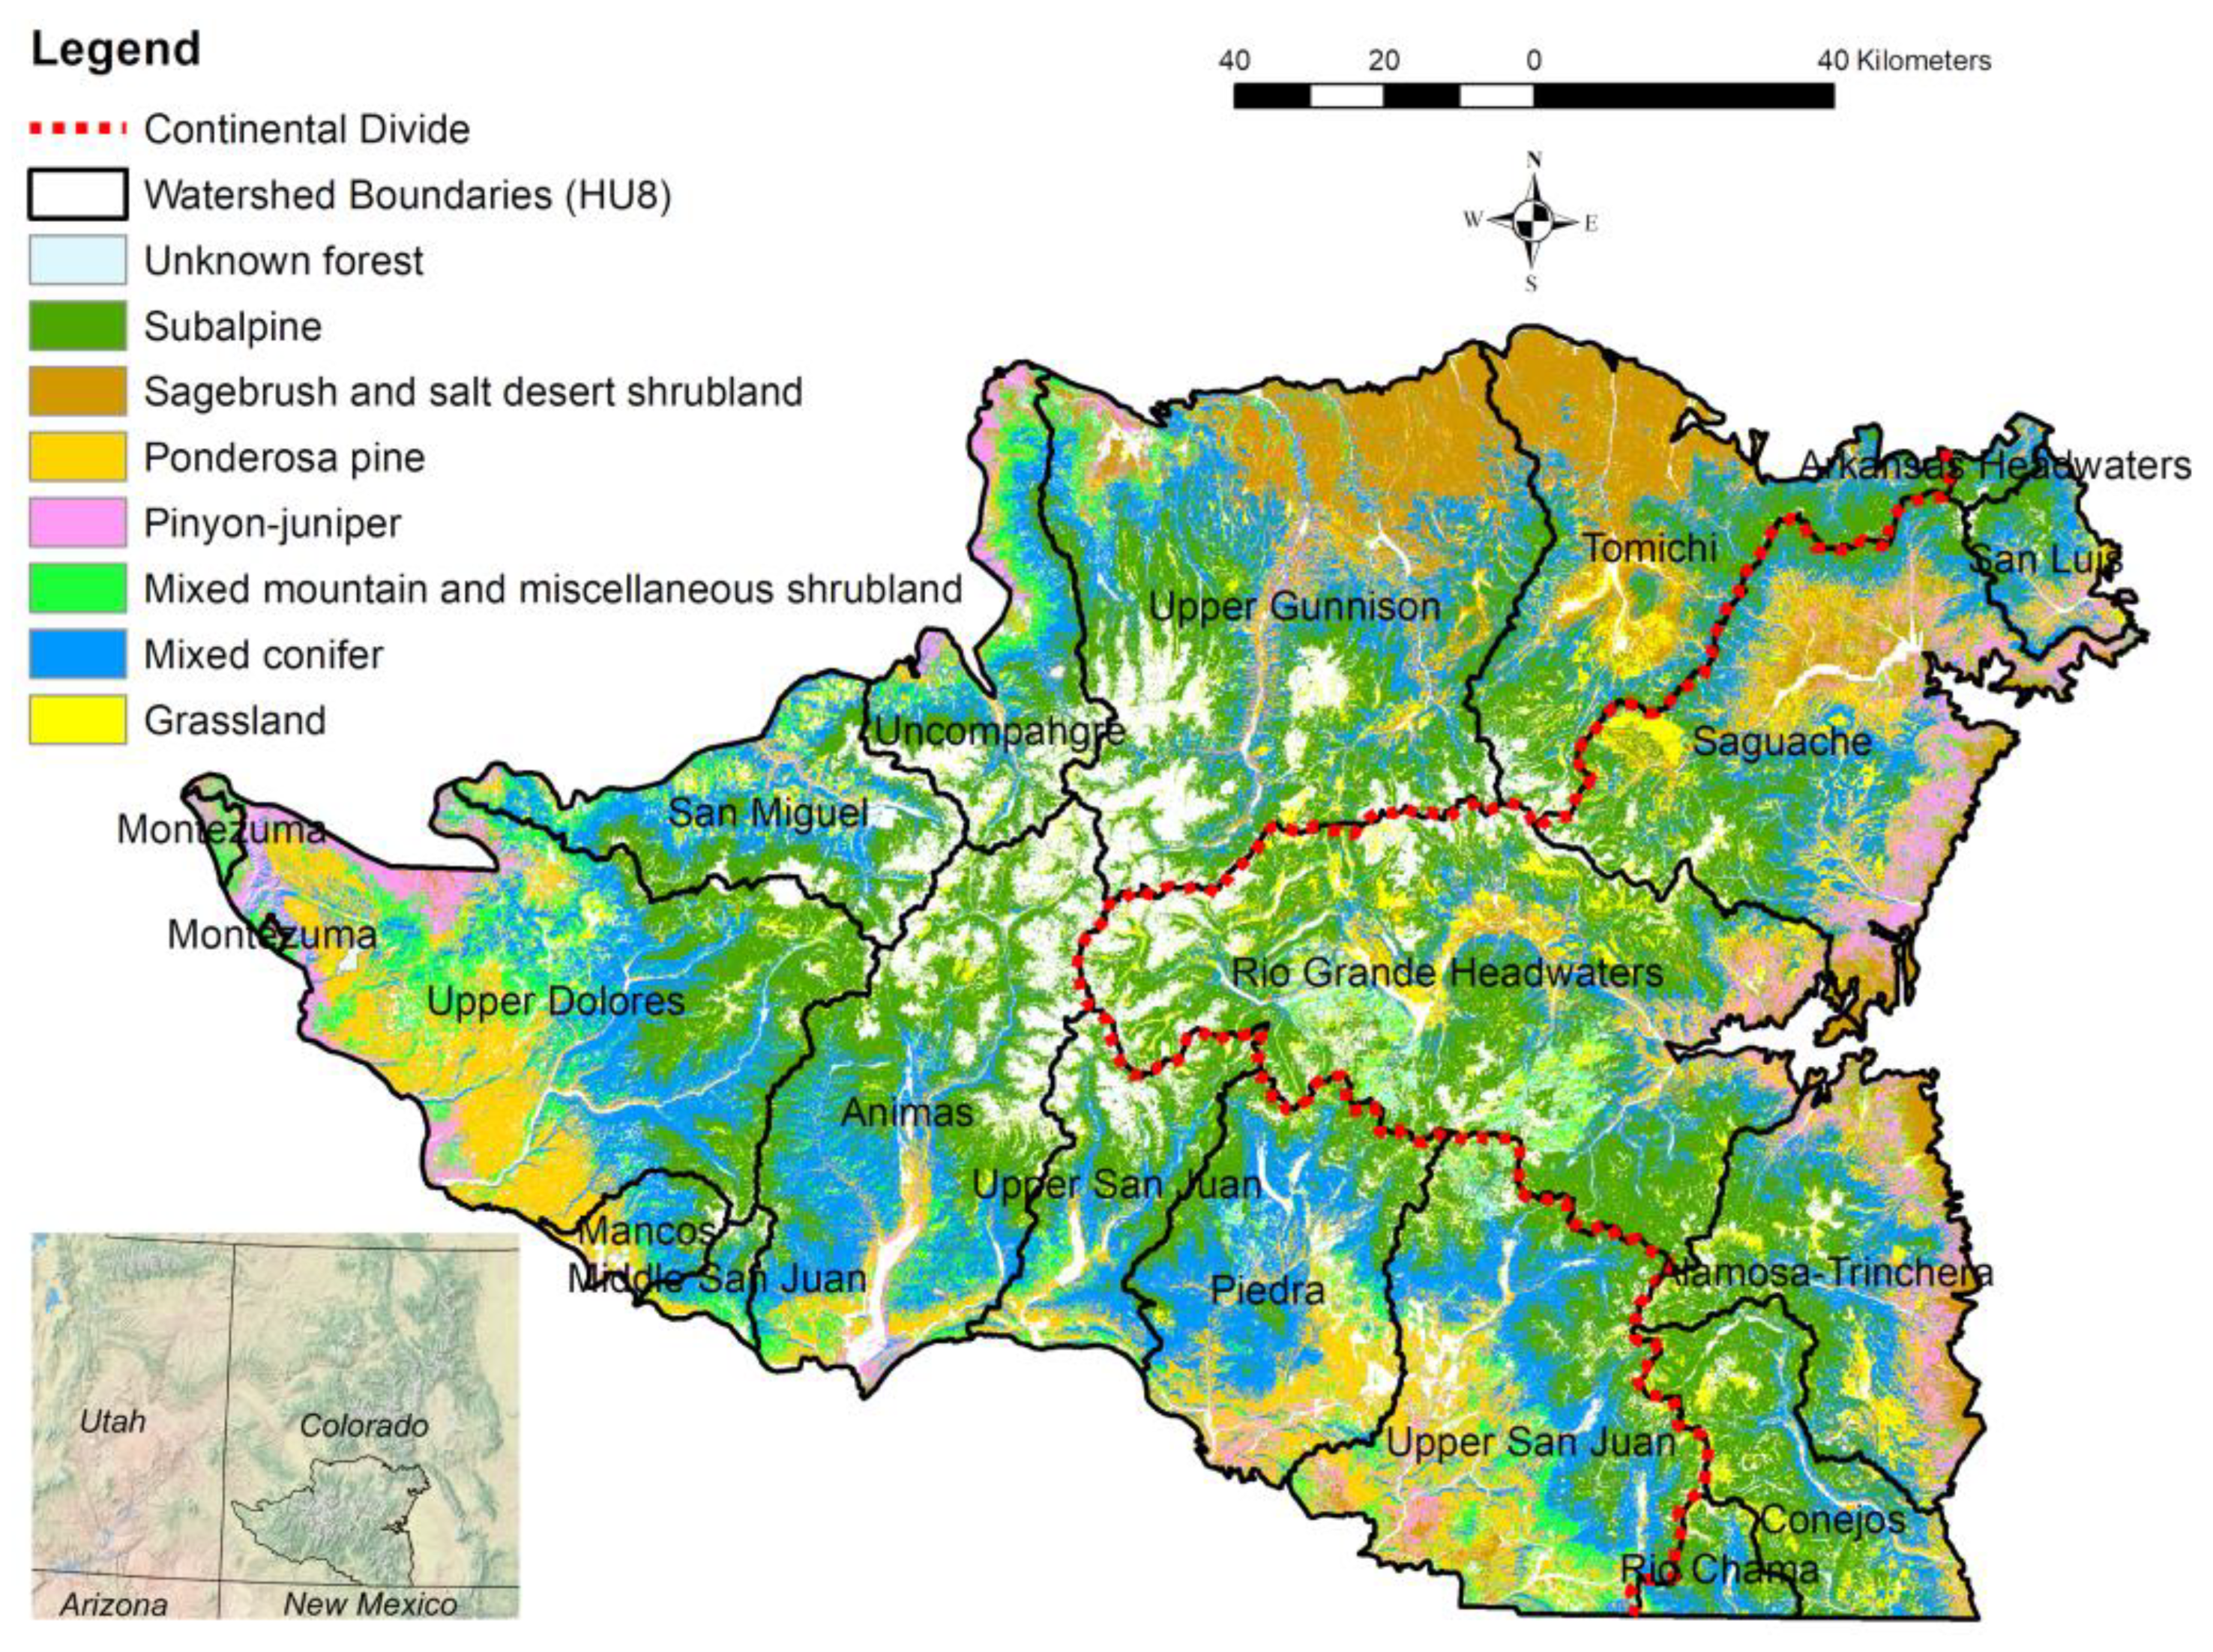
To analyze this title question, I outlined the San Juan Mountains, partitioned it into ecosystem types and watersheds, and gathered all available recent and historical fire data. I then calculated rates and patterns of recent fires and compared them over time and among ecosystem types and watersheds. I also compared recent fire data with historical fire data to determine whether recent fires are inside or outside the HRV. I used the ArcGIS 10.8 geographical information system (GIS) for analyzing maps and Minitab and R for statistical analysis.

2.1. Study Area

The study area is the San Juan Mountains in southwestern Colorado (Figure 1), a mountain range where landscape-scale ecological restoration may be more feasible than in other areas, because human population density is relatively low, many urban areas are concentrated on the margins, and a substantial fraction of public land is protected (e.g., wilderness, roadless etc.). This mountain range is being strongly affected by climate change, as it has the greatest warming trend in Colorado, and by 2015 had warmed by ∼2.0 °C since the pre-industrial period (before ca 1880 in the study area), based on station records [19,20]. However, PRISM data suggest only ∼1.6 °C of warming by 2015 [21]. Since global temperatures by 2015 had reached ∼1.0 °C of warming since the pre-industrial period, the expectation would be ∼2.1 °C of warming in the study area if the global Paris 1.5 °C goal, the most optimistic goal, is reached [21]. It is relevant to this study, as discussed later, that ∼2/3 of total warming, assuming this optimistic goal, has already occurred.
The San Juan Mountains are part of the southern Rocky Mountains. I could find no existing digital maps that delimit the San Juan Mountains, thus I created a boundary just for this analysis. I hand digitized the boundary in ArcGIS 10.8 (ESRI, Redlands, California), using backdrops of ArcGIS geology and elevation, and the southern boundary with New Mexico. The San Juan boundary in places is well defined by uplifted and distinct geologic formations and rock types, but in other areas is ambiguous and arbitrary. Area inside the digitized boundary, available in Data S1, is 2,642,606 ha. I used ArcGIS 10.8, all maps projected to NAD83 UTM Zone 13, for this and all subsequent mapping analysis.
To enable analysis by ecosystem, I created a map of ecosystem types from Landfire Existing Vegetation Type (EVT) data (https://www.landfire.gov; accessed on 25 January 2022) from Landsat satellite scenes ca 2016 (Figure 1). There were 86 types in the study area. Landsat-derived vegetation classifications have low to modest accuracy, but accuracy can be increased by pooling categories [22]. I pooled the 86 Landfire EVTs into eight ecosystem types for analysis (Figure 1, Table 1). Most abundant, forming a ring around a central alpine area, are subalpine forests dominated by subalpine fir (Abies lasiocarpa) and Engelmann spruce (Picea engelmannii). Mixed-conifer forests, forming another ring just below subalpine forests, are dominated by white fir (Abies concolor), blue spruce (Picea pungens), Douglas-fir (Pseudotsuga menziesii), ponderosa pine (Pinus ponderosa), and quaking aspen (Populus tremuloides). Purer forests of ponderosa pine, concentrated along the southwestern border, are third most abundant, followed closely by sagebrush (Artemisia spp.) and salt desert shrublands (Atriplex spp., Sarcobatus vermiculatus), concentrated along the northern border. Next are grasslands dominated by Festuca arizonica, F. thurberi, Danthonia parryi, and Muhlenbergia montana, which are most common in the eastern part of the study area.
Mixed mountain shrublands have Quercus gambelii most abundant. Piñon-juniper woodlands, which are scattered around the margins of the study area, particularly on the eastern border, are dominated by Pinus edulis, Juniperus osteosperma, and J. scopulorum. As a shorthand, here I use dry forests to mean ponderosa pine and dry mixed-conifer forests, that are mixed-conifer forests dominated by ponderosa, but with other tree species.
To facilitate analysis within smaller parts of the study area, I downloaded U.S. Geological Survey Watershed Boundaries at the subbasin (8th digit/4th level--HU8) scale from the National Map (https://viewer.nationalmap.gov/basic/#/; accessed on 13 March 2022), and clipped these with the San Juan Mountain boundary. There are 18 watersheds averaging about 147,000 ha (Figure 1), in three sectors: eastern, southwestern, and northern. The Continental Divide demarcates the eastern (Rio Grande River) San Juans. The southwestern San Juans include the San Juan, Piedra, Animas, Mancos, Dolores, and Montezuma watersheds. The northern San Juans include the San Miguel, Uncompahgre, Gunnison, and Tomichi watersheds.

2.2. Recent Fire Data

Modern digital fire maps, as perimeters, points, and rasters, were obtained from multiple sources (Table 2), projected to NAD83 UTM Zone 13, and analyzed in ArcGIS. Data reporting on fires in the USA has recently become systematized using consistent National Incident Feature Services (NIFS) datasets. These are available through the National Interagency Fire Center’s (NIFC) Open Data site (https://data-nifc.opendata.arcgis.com/; accessed on 9 January 2022) and by agency in the government data catalog (https://catalog.data.gov/; accessed on 9 January 2022) or from individual agency sources. However, older fire records are in flux; revised links and new or revised datasets appeared during this study, and digital sources or links may change further.
I downloaded source datasets, clipped them with the study-area boundary, and projected them to NAD 83 UTM Zone 13.
For fire perimeters, the compiled Interagency Fire Perimeter History dataset and the Bureau of Land Management (BLM) and U.S. Forest Service (USFS) National Fire Perimeter(s) datasets were primary sources, and a few fires came from the U.S.G.S. Wildland Fire Decision Support System. These used GPS, thermal imaging, aerial sketching, and other methods to develop fire maps. I used the Interagency Fire Perimeter History dataset as a starting dataset, as it was most complete. I removed many duplicate records in it. I also cross-checked and filled in missing contents of fields, based on archived Geomac records, from the NIFC Open Data site, and local datasets from USFS and BLM offices. I also added a few missing fires from these sources. I merged separate polygons for a single fire into one multi-part feature, so each record represents a fire in total. I recalculated fire area using calculate geometry in ArcGIS 10.8 (ESRI, Redlands, California). I extracted fields from these datasets useful for this study, which included the fire year, fire name, method of mapping the fire, miscellaneous comments, and the fire cause. I chose one perimeter where there were alternative perimeters. Perimeter choice and the reason for it are recorded in SOURCEID and MISC columns in the resulting geodatabase (Data S1).
Fire points are from four sources (Table 2). First, the Fire Program Analysis Fire-Occurrence Database (FPA FOD) provides standardized, cleaned fire records from multiple sources [23,24]. Second, the National USFS Fire Occurrence Point Feature Layer focuses on points of fire origin and includes USFS records and some records from private lands and other agencies. Third, the National Wildfire Coordinating Group’s Fire and Weather Data website has older data from multiple agencies. Fourth, the WFIGS-Wildland Fire Locations Full History, has cleaned, apparently comprehensive records from multiple sources, and appears to be the best available compilation, but only for 2014–2020. We can perhaps expect similarly improved data in the future for records prior to 2014. I used the WFIGS -Wildland Fire Locations Full History dataset and the National USFS Fire Occurrence Point Feature Layer as initial data for point fire records, as they appeared most complete, up-to-date, and closely matched. I compared 3186 point fire records in the FPA POD dataset to point fire records in this initial dataset, and found that fire names, years, and fire causes matched in all except seven cases, where only causes differed. FPA POD causes appeared more specific, so I used them. The resulting dataset is thus likely generally accurate, since the FPA POD dataset is known to be cleaned and cross-checked [23,24], and similar high-quality data are now available for 2014–2020 from WFIGS. I removed point fires that were “Rx” fires, since the dataset used in this analysis is focused on wildfires. I used a different source to obtain more comprehensive data on prescribed fires (see below). I supplemented this initial dataset with a few additional records from the National Wildfire Coordinating Group. Prior to its removal as an online source, I also obtained a few additional records from USGS Federal Wildland Fire Occurrence Data. Finally, since perimeters are better than points for this specific research, I kept all perimeter records, but only point records with no corresponding perimeter records. The point dataset is thus distinct from the perimeter dataset. I scanned the final point dataset and found only two duplicate records, which I corrected.
Raster data on fire severity are from Monitoring Trends in Burn Severity (MTBS; Table 2). These data cover 1984–2019. MTBS fire-severity data have some significant limitations [25], but remain the central federal source for fire-severity data, so I used these data. I also obtained data from the U.S. Geological Survey, that interprets Landsat data to detect burned area (BA; [26]). I found 91 fires in common with the final set of points and perimeters. Most BAs underestimated perimeter areas and point estimates. Perimeter areas could be overestimates, since they may include unburned areas. However, there is no independent source to determine which is more accurate, or how to make records commensurate, so I decided it is premature to use BA data.
Prescribed-fire data were from the Integrated Interagency Fuels Treatments dataset (Table 2): https://services/arcgis.com/40V0eRKiLAYkbH2J/arcgis (accessed on 23 January 2022). I selected Treatment Category = Fire, Actual Completion Date before 1 January 2021, and Treatment Type = Broadcast Burn. This yielded 221 records, the earliest in 2003. I searched but could find no sources of earlier prescribed fires, thus used this single dataset as the best available.
Source datasets spanned different periods (Table 2), but together covered 1980-2020 (n = 41 years), except for MTBS, which started in 1984 and prescribed-fire data starting in 2003. For wildfire perimeter data, the dataset is likely complete for 1980–2020. Wildfire point data also appear complete from 1980 to 2020, thanks to cleaned and thorough datasets from WFIGS and FPA-POD. The perimeter dataset has 26 fires < 4 ha in area, and the point dataset has 106 fires > 4 ha, so they overlap in their coverage of fire sizes. Fire-severity data from MTBS only covered from 1984 through 2019, but no fires of MTBS size (>405 ha) occurred in 2020.
Since many wildfires were on U.S. Forest Service land, I used, but modified their “Statistical Cause” reporting field [27], which was provided in several sources. I slightly adjusted categories and titles to better match the analysis here, then tallied the number and area of fires by cause across the study area, separately by points and perimeters, then merged these two sources. A significant limitation is the 2002 Missionary Ridge fire, the largest fire over the 41-year period, which FPA POD assigned a “miscellaneous” cause, which I record as “unknown.” I also analyzed causes considering this fire as human-set, given suspicions it might have been ignited by a vehicle.
Fire rotation is the best estimator of fire rates (area burned in a particular period) across landscapes, as fires vary in size, and earlier estimators, such as mean fire-return interval, just counted fires, which overestimates landscape-scale fire rates [28]. Fire rotation (FR) is defined as: Period of observation/fraction of area burned. For example, if an area is observed for 40 years, and total area burned, from summing the areas of fires, was 0.25 of the analysis area, then FR = 40/0.25 = 160 years. Fire rotation estimates how long it would take to burn an area equal to the whole analysis area one time, given current landscape rates of burning. I also calculated landscape fire density (number of point fires per year/100,000 ha). I calculated FR and fire density by ecosystem type (Table 1, Figure 1) and watershed (Figure 2) to understand how rates and patterns of fire vary spatially. FR and fire density were calculated by first summarizing burned area and number of fires by ecosystem type and watershed based on intersections in ArcGIS.
Since fires can vary substantially in area, and some historical evidence is available about fire sizes, I derived a fire-size distribution by tallying wildfires using bins of 250 ha and 1000 ha. To determine which recent fire sizes produced most of total burned area, I listed recent wildfires in order by decreasing area, and summed the cumulative area and number of fires as percentages of total burned area, up to 95%, and also total fires.
To understand trends in fire over the 1980–2020 period, I first compared fire rotation and fire density for the most recent 10-year period (2011–2020) and the preceding 31-year period (1980–2010) by both ecosystem type and watershed. The reason to break out the recent 2011–2020 period was that there has been an apparent increase in fire in this period, relative to 1980–2010, and I wanted to be able to separately characterize this most recent period of increased fire. There is a tradeoff here. Ten years is likely insufficient to fully characterize rates and patterns of fire, but may be a minimum period that includes variation and still allows detection of recent changes soon enough to alter course if needed. A ten-year period provides a necessary, if less precise, speedometer-like reading of fire rates during a period of acceleration in fire, and the best possible estimate of recent rates.
I also analyzed several annual trends over the full 41-year period. This required first testing a null hypothesis of no temporal autocorrelation, using Minitab 20.4 (Minitab Ltd., Coventry, U.K.). This is an assumption that must be met before testing a null hypothesis of no trend, which I did using a two-sided Mann-Kendall test in R 4.1.2 with alpha = 0.05. I tested null hypotheses of no trend in: (1) area burned by wildfires, (2) number of wildfires, (3) area burned by prescribed fires, (4) number of prescribed fires, (5) low-severity area burned, (6) low- to moderate-severity area burned, (7) moderate-high-severity area burned, (8) high-severity area burned, (9) fraction of total area burned at moderate-high severity, and (10) fraction of total area burned at high severity. These tests detect change in area burned and fire severity.
I based temporal autocorrelation and trend analysis for fire severity on MTBS data. MTBS severity classes include background and non-processing area (e.g., under clouds) and increased greenness (likely not burned), but burn severity is divided into four classes: 1 = unburned to low, 2 = low, 3 = moderate, and 4 = high. These roughly correspond with commonly used (e.g., [29]) fire-severity classes: Low = 1–20%, moderate = >20 to <70%, and high = ≥70% basal-area mortality. Unburned to low could overestimate low-severity fire area, since the unburned to low class may include some area that did not burn. Similarly, perimeter data for mapped fires, that typically include unburned area, also may overestimate burned area. However, unburned to low and low may also underestimate burned area, because some area that burned at low severity may not be visible from space. MTBS fire-severity data cover only 93.3% of total burned area here, as they focus on fires > 405 ha in area [30]. To make MTBS area and rotation estimates congruent with other estimates analyzed here, I divided summary MTBS estimates of area burned by 0.933. I summed these four severity classes across fires in a single year to estimate burned area by class and total burned area for that year. I also estimated the fraction of low to moderate severity as the sum of classes 1–3 divided by total burned area (classes 1–4), fraction of moderate to high severity as the sum of classes 3 and 4 divided by total burned area, and fraction of high-severity fire as class 4 divided by total burned area, as in previous analyses [12]. I used low- to moderate-severity fire as a key measure, as it is often considered generally restorative, and I also used moderate to high severity and high severity alone, since these are often of concern [31].

2.3. Historical Fire Data

Historical fire data provide essential reference evidence to evaluate the current state of landscape fire regimes, from 1980 to 2020 fire data, among the ecosystem types in the study area. Primary sources of historical evidence include: (1) a synthesis of multiple sources of evidence for the study area and adjoining areas [32], (2) nine published tree-ring reconstructions of fire at 33 sites over the pre-industrial period from 1700 to 1909 in montane forests spanning the study area, synthesized and updated in [31], (3) fires mapped in early forest atlases and documented by early historical records for the San Juan and Rio Grande National Forests, spanning the period from about 1850 to 1909 [31], (4) General Land Office reconstructions for sagebrush shrublands and montane forests in preindustrial landscapes over the period from the late-1700s to ca 1880 [33,34], (5) paleo-charcoal reconstructions over several centuries in the preindustrial period (e.g., [35]), and miscellaneous early scientific reports, newspaper accounts, journal articles, and other records, reporting on fires mostly from the preindustrial period in the 1800s [32,34]. These sources mainly provide estimates of rates of fire, fire severities, and fire sizes. I compiled estimates from these sources into a table or explained them directly in the results.
These data sources provide mainly spatial data that are commensurate with the spatial fire data from 1980 to 2020. Original spatial data include the mapped forest-atlas data and reconstructed General Land Office (GLO) data. These datasets were validated against early historical records, each other, and miscellaneous other sources [31,34]. In the tree-ring case, which is effectively from point locations, I created a regression equation to estimate the spatial measure, fire rotation, from these point fire data, which is documented in detail in [28]. Paleo-charcoal reconstructions are closer to point sources, but integrate fire over a larger area, thus were also used to roughly estimate fire rotation.
In the case of fire sizes, I made the only feasible comparison between 1980–2020 fire sizes and historical fire sizes: I tallied moderate- to high-severity parts of the 31 fires, with MTBS fire-severity data, from 1984 to 2020 (37 years) and 17 historical fires from 1850 to 1909 (60 years) in 1000 ha size classes. Only moderate- to high-severity parts of fires could be compared because that is all that is available for the San Juan Mountains from historical data [31,34]. Historical fire sizes are from early forest atlases, historical reports, and tree-ring studies (Figure 6 and Table 4 in [31]). This is also an imperfect comparison, because modern fires are for all ecosystem types including the subalpine, but historical fires are only for the montane. Furthermore, for statistical testing, I had to merge these 1000 ha classes into just three classes: 0–1000 ha, 1000–5000 ha, and 5000–22,000 ha, then I tested the null hypothesis that the distributions of these recent and historical fires do not differ, using a Chi-square test in Minitab at alpha = 0.05. Only three size classes could be used, because of the need for Chi-square classes to generally have n = 5 observations. However, it was also possible to qualitatively compare recent and historical total fire sizes.

3. Results

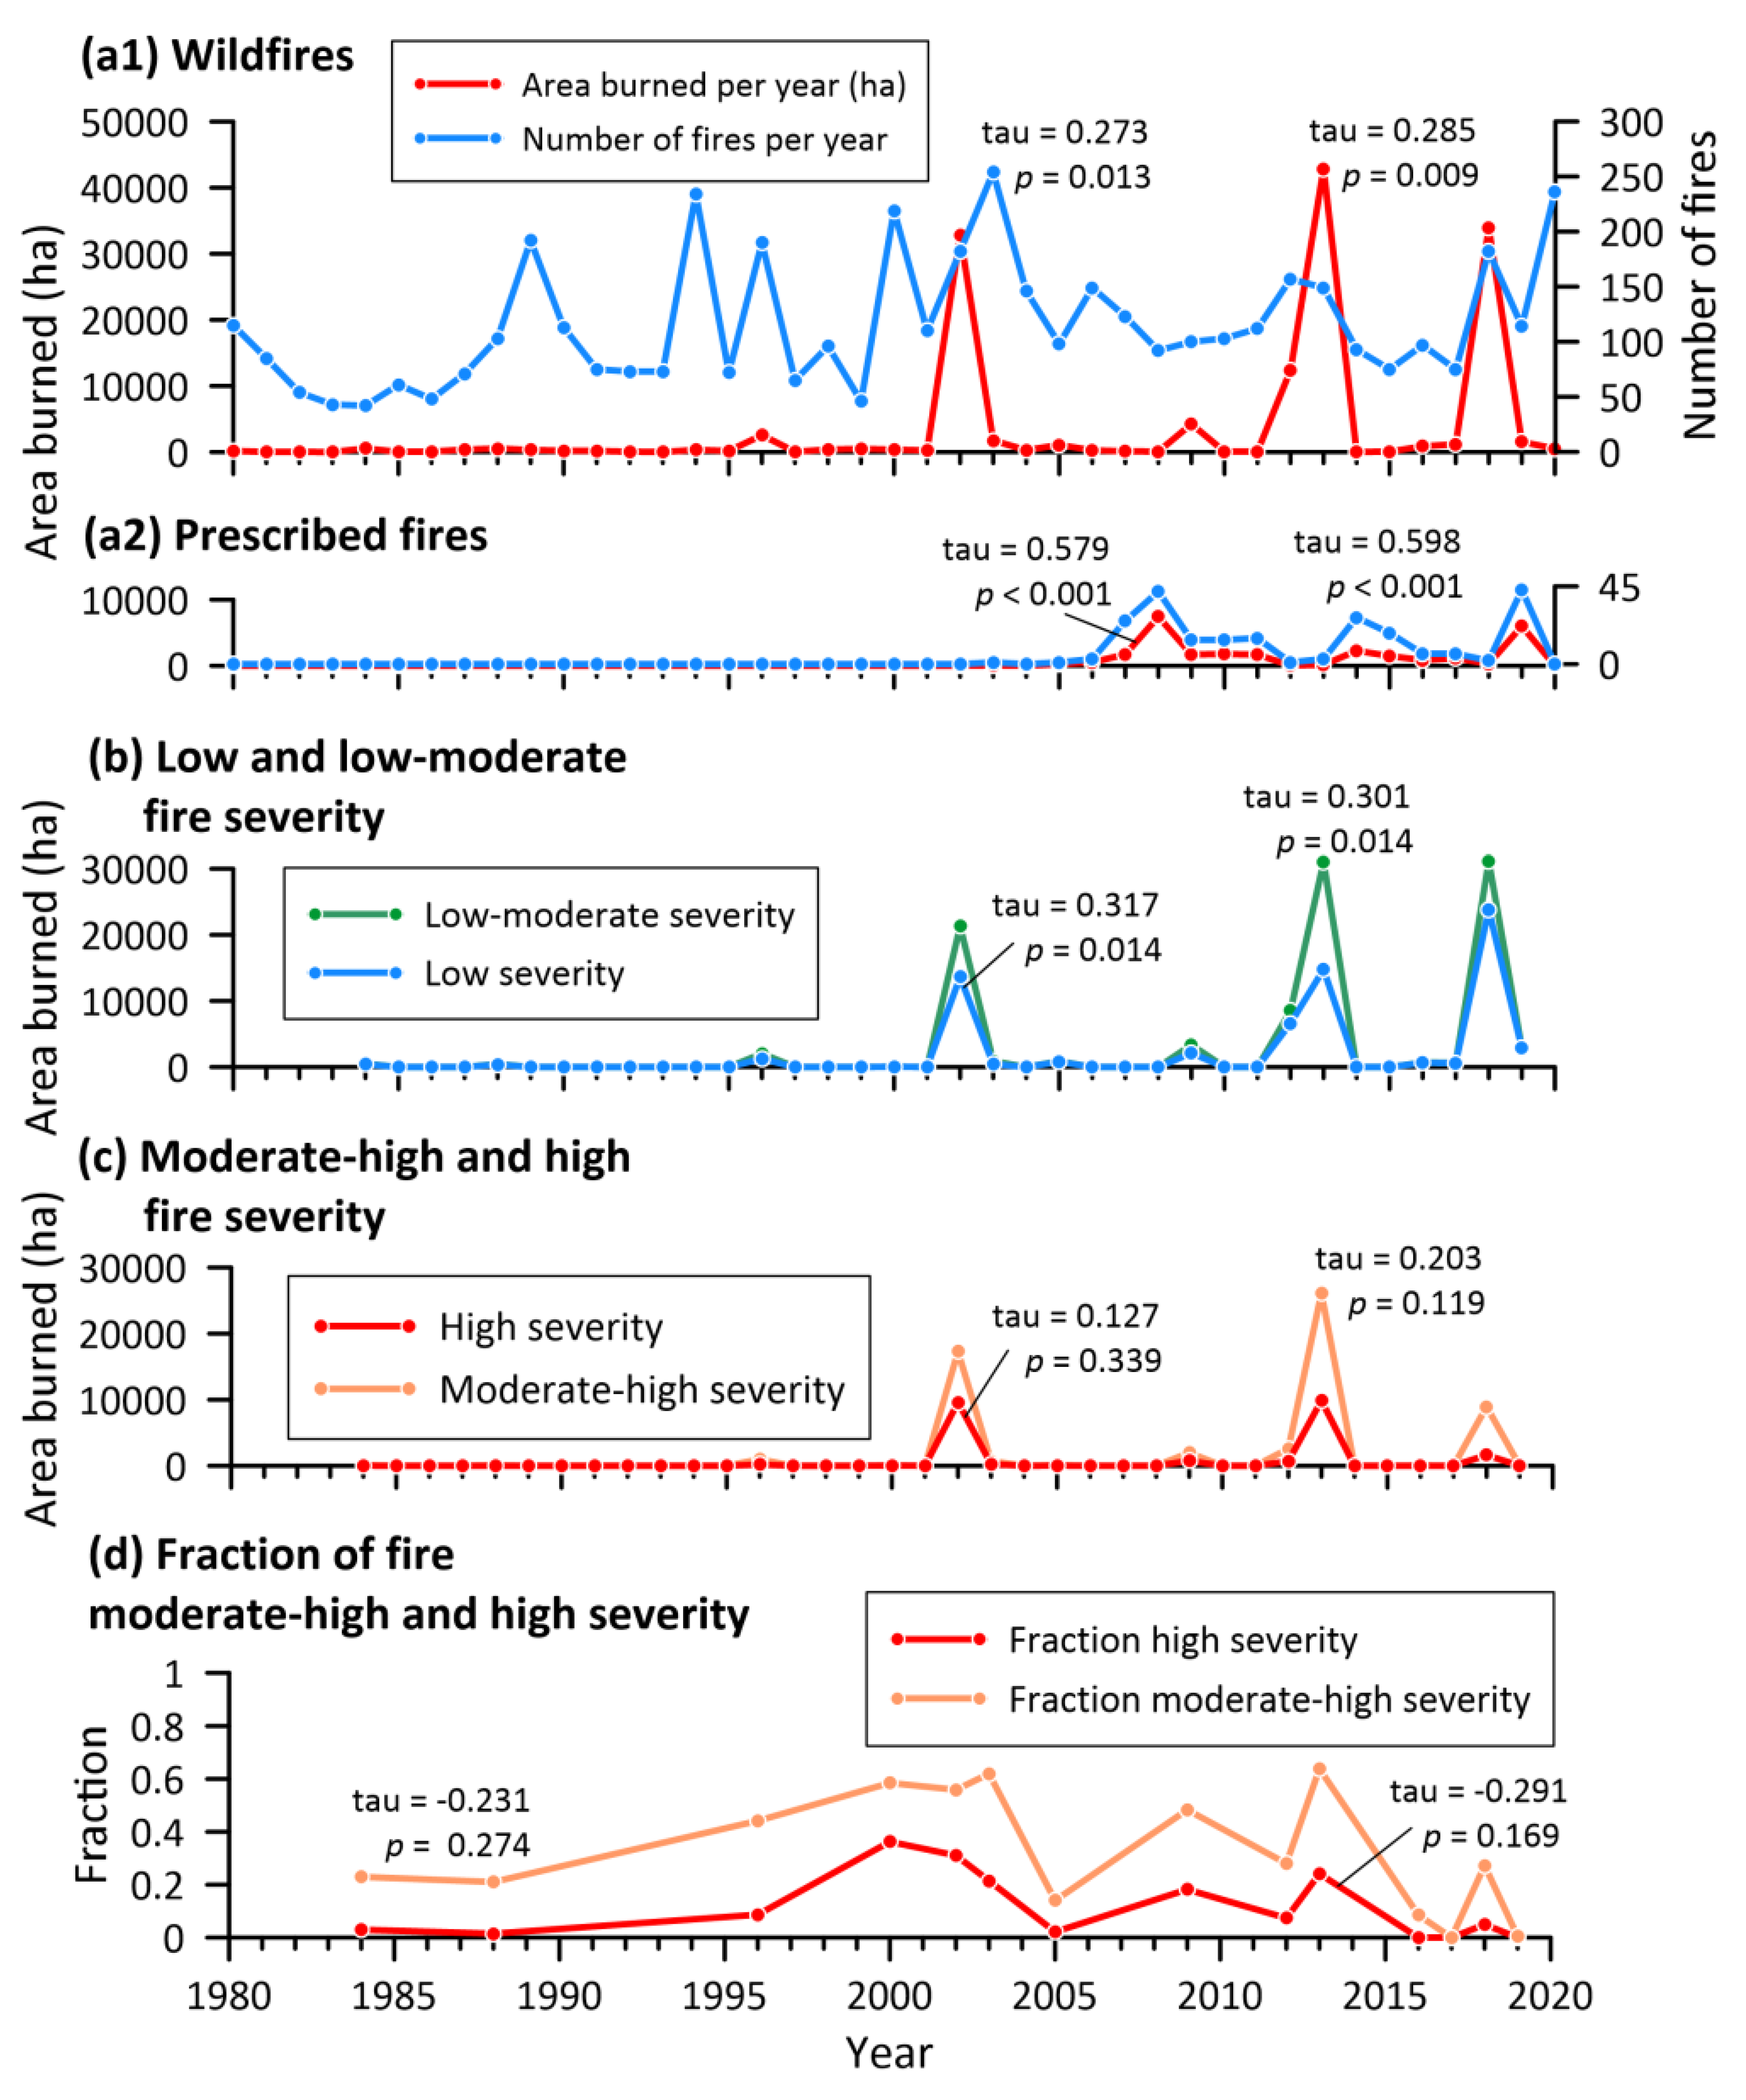
3.1. Recent Fire Patterns and Trends

Fire datasets for 1980–2020 (n = 41 years) contained 155 wildfire perimeters and 4561 wildfire points, for a total of 4716 wildfires, plus 221 prescribed-fire perimeters for a total of 4937 fires, or an average of 120 per year (Figure 2). Fires totaled 168,447 ha over the 41-year period (Table 3), an average of 4118 ha/year, so average fire size for perimeter data was 34.3 ha. Total wildfire area, from Table 3, is grand-total fire area (168,447 ha) minus prescribed-fire area (27,271 ha), thus 141,176 ha. Fire-severity data from MTBS include data for 31 fires that burned 131,736 ha (93.3%) of the 141,176 ha of total wildfire area, thus fire-severity data cover most of the burned area. The 27 largest fires > 405 ha in area, except 2012 Goblin, all have MTBS data. Four MTBS fires (1996 Archuleta Mesa, 2000 Hamilton, 2003 Hamilton, and 2017 Eight Four Two) burned mostly outside the study area, and have little area inside. MTBS fire areas often matched perimeters closely, and, in many cases, I adopted MTBS as the perimeter. Total MTBS area of 131,736 ha compares with 131,523 ha from perimeters for the same set of fires.
Among 131,280 ha of fires with known fire causes, lightning accounted for 60.2% of area burned, followed by prescribed fires (20.8%) and railroads (17.7%), with small amounts from camping/campfires (0.6%) and several other causes (0.7%) (Table 3). Across the whole burned area of 168,447 ha, unknown causes were significant at 22.3% and 37,548 ha, and a large part of the unknown is the 2002 Missionary Ridge fire at 27,907 ha. If that fire was human-caused, total human-set fires would be 80,135 ha (47.5%), slightly more than lightning at 79,052 ha (46.8%), with unknown reduced to 9641 ha (5.7%) of the 168,447 ha total burned area.
Wildfire density and fire rotation over the 41-year period from 1980 to 2020 suggest large physical effects (e.g., climate, geology, topography), not biological effects (e.g., fuels), on recent fire patterns in the San Juans (Figure 2). Fire densities were generally highest in the southwestern San Juans, varying from 6.50–13.00 fires per year per 100,000 ha. The highest fire density of 13.00 occurred in the Piedra watershed (see Figure 1 for watershed names) and lowest of 6.50 in the Upper Dolores, with the exception of the tiny Montezuma watershed with 2.50. Fire rotations were 225–533 years in large watersheds in the southwestern San Juans, except three small watersheds with fire rotations ≥16,258 years. In contrast, the northern and eastern San Juans had fire densities <25% as high, only from 1.38 to 3.48, except one small watershed with 6.38, and fire rotations were >12 times as long, from 6655-202,472 years. The consistency of these contrasting patterns across 41 years suggests strong physical effects on fires.
Wildfires also varied substantially from year-to-year, but generally appeared to increase over the 41-year period (Figure 3). Area burned was concentrated in large fire years (Figure 3a); 89% of total area burned by wildfires over the 41-year period was from 12.5% of fire years, just the five largest (from largest to smallest): 2013, 2018, 2002, 2012, and 2009. Both numbers of wildfires and areas burned annually by wildfires appear visually to have increased (Figure 3a1), and prescribed fires also became prominent after 2005 (Figure 3a2). There was no significant temporal autocorrelation, across the whole study area, in (1) area burned by wildfires, (2) number of wildfires, (3) area burned by prescribed fires, (4) number of prescribed fires, (5) low-severity area burned, (6) low- to moderate-severity area burned, (7) moderate-high severity area burned, (8) high-severity area burned, (9) fraction burned at moderate to high severity, or (10) fraction burned at high severity. Trends, based on the tau statistic, were significant for (1) area burned by wildfires, (2) number of wildfires, (3) area burned by prescribed fires, (4) number of prescribed fires, (5) low-severity area burned, and (6) low- to moderate-severity area burned, but not for any moderate- to high-severity trends (7–10). As with area burned, fire severity was largely shaped by severity in the five largest fire years (Figure 3b–d). The most recent of these, in 2018, had primarily low- to moderate-severity fire and little high-severity fire, partly because 2018 fires were more in ponderosa pine and mixed conifer. The highest fractions of high- severity fire, in years with large area burned, were in 2002 and 2013 (Figure 3d), which had more high-elevation burned area.
Over the 10-year recent (2011–2020) period, fire rotations varied substantially among ecosystem types (Table 4). Fire rotations were: (1) shortest in lower elevation (Figure 1) mixed-mountain shrublands (107 years) and ponderosa pine forests (140 years), (2) intermediate in grasslands (193 years), that are most common in the eastern San Juans, and in mid-elevation mixed-conifer forests (218 years), that circle the range, and (3) longest in the wettest and highest-elevation subalpine forests (549 years), and in the driest sagebrush and salt-desert shrublands (797 years), and piñon-juniper woodlands (470 years).
In spite of substantial differences in fire rotations, rotations declined and densities and fire rates increased generally consistently across ecosystem types by 2011–2020, relative to 1980–2010 (Table 4). Fire densities were 200% of earlier densities, on average, across ecosystem types, with higher increases in grasslands (295%) and mixed-mountain shrubs (246%) and less in subalpine forests (148%) and mixed-conifer forests (167%). Fire rotations in the 10 years from 2011 to 2020 were only 9–29% of fire rotations in the full 41 years. In five of the seven ecosystem types, three of four forest types and both shrubland types, shortening was very similar (24–29% of earlier rotations), with only grasslands (17%) and subalpine forests (9%) having larger shortening relative to earlier rotations. Fire rates thus increased about 3.5 to 4.2 times (348–423%) for the five, 602% for grasslands, and 1147% in subalpine forests. The increase in fire in the recent 10-year period was, on average, half from higher fire densities, and half from larger burned areas.
Similar decreases in fire rotations and corresponding increases in fire densities and fire rates were repeated across the 18 watersheds, but with somewhat more variability and less consistency (Table 5). Fire densities increased in 11 and decreased in seven water sheds, but fire rotations declined and fire rates increased in 15 of 18 watersheds, a largely consistent pattern, although magnitudes of change were more variable (Table 5). Exceptions, with longer rotations and reduced fire rates, occurred in the Middle San Juan, Rio Chama, and San Miguel watersheds, generally smaller watersheds that, likely by chance, just did not experience much fire in the recent 10-year period (Table 5). Watershed fire density and fire rotation over the 41-year period (Figure 2) were not correlated (p > 0.05) with changes in fire density and fire rotation.

3.2. Comparing Recent and Historical Fire

Fire rotations and severities from 2011 to 2020 by ecosystem type (Table 4), relative to their historical range of variability (HRV; Table 6), show fires mostly remain deficient. Rotations most of interest are for each fire severity in ponderosa pine and mixed-conifer forests. Low-severity fire in ponderosa pine, burning recently at a 204-year rotation, is deficient relative to the historical estimate of 34 years. Moderate-high-severity fire in ponderosa pine, burning recently at a 1544-year rotation, is also deficient relative to historical estimates of 135–688 years. High-severity fire in ponderosa pine, burning recently at a 9821-year fire rotation, is also deficient relative to historical estimates of 280–1145 years. Low-severity fire in mixed-conifer forests, burning recently at a 309-year rotation, is deficient relative to historical estimates of 106 years in dry mixed conifer and 133 years in moist mixed conifer. Moderate-high-severity fire in mixed conifer, burning recently at a 245-year rotation, is deficient relative to historical estimates of 120–156 years in dry mixed conifer and 94–144 years in moist mixed conifer. High-severity fire in mixed conifer, burning recently at a 4810-year rotation, is deficient relative to historical estimates of 184 to >471 years in dry mixed conifer and 121–224 years in moist mixed conifer.
Other ecosystem types do not have separate estimates by fire severity because high-severity fires characterized their historical variability. Fires in piñon-juniper woodlands, burning recently at a 470-year rotation at high severity, are within the HRV of a 400–600+ year rotation at high severity. Fires in subalpine forests, burning recently at a 549-year rotation at high severity, appear somewhat deficient relative to the most reliable HRV estimate of 300-year rotation at high severity. Other tree-ring estimates for historical fire rotation were “225–350 years in Wyoming and Colorado” ([13] pp. 285, 288), so the [39] estimate is exceptional. Fires in sagebrush (Artemisia tridentata) and salt-desert shrublands, burning recently at a 797-year rotation at high severity, appear deficient relative to the HRV estimate of a 90- to 178-year rotation at high severity in mountain big sagebrush (A. t. ssp. vaseyana) and a 160- to 692-year rotation in Wyoming big sagebrush (A. t. ssp. wyomingensis). No fire-rotation information is available for salt-desert shrublands, either recently or historically. Fires in mixed mountain and miscellaneous shrublands, burning recently at a 107-year rotation at high severity appear within the HRV, given the estimate of a 100-year historical rotation at high severity. Similarly, fires in grasslands, burning recently at a 193-year rotation appear within the HRV, given estimates of 90–300-year historical rotations in the Rocky Mountains.
Recent and historical fire sizes can also be compared quantitatively and qualitatively. The fire-size distribution from 1980 to 2020 was highly skewed, as most fires were small. Again, most of the total burned area was from the large fires. Of 4937 total fires from 1980 to 2020, 15 had unknown area, leaving 4922 with known area. Of these 4922 fires, 99.7% were ≤1000 ha in area, and only 15 fires (0.3%), consisting of 13 wildfires (Table 7) and 2 prescribed fires were >1000 ha in area. Only 62 fires (1.3%), consisting of 33 wildfires and 29 prescribed fires, were >250 ha in area. Thus, nearly all fires from 1980 to 2020 were < 250 ha, small in area relative to the largest fire, the 27,907 ha Missionary Ridge fire of 2002. Listing fires in decreasing order by area (Table 7) shows that the 13 wildfires > 1000 ha in area, accounted for 87.6% of total burned area. The 13 wildfires were <0.3% of the 4716 total wildfires. Similarly, only 35 wildfires ≥ 225 ha in area accounted for 95.0% of total burned area (Table 7). These are 0.7% of total fires. In contrast, 32 prescribed fires > 225 ha in area occurred from 1980 to 2020, and, though the largest was only 1240 ha, these 32 prescribed fires totaled 14,790 ha, about 10% of total wildfire area.
For comparison with historical fire sizes, the data are incomplete, but still important to consider. Little is known about small historical fires, as they leave little evidence, and size evidence is currently available for only the moderate- to high-severity parts of large historical fires [31]. Distribution of these parts of fire sizes (Figure 4) appears roughly similar between modern (1980–2020) and historical (1850–1909), although there are more of the smallest (<1000 ha) fires in the modern period than the historical, and historical had one very large fire (21,000–22,000 ha). The null hypothesis that the distribution (across three pooled size-classes) of moderate- to high-severity parts of modern (1980–2020) fires did not differ from those of historical (1850–1909) fires was not rejected (Χ2 (2, N = 48) = 1.18, p = 0.55). Qualitatively, the largest total size (all severities, not just moderate to high severity) of modern fires from 1980 to 2020 reached 27,907 ha (Table 7), but total areas of five historical fires could have reached 50,000–100,000 ha, based on analysis in [31].

4. Discussion

4.1. Patterns of Change in Fire

Recent fire rates (2011–2020) remain substantially deficient and need restoration relative to historical rates for all fire severities in ponderosa pine and mixed-conifer forest landscapes (Table 4 and Table 6). Ten years of recent data are insufficient to fully characterize current fire rates, so caution is needed, but 2011–2020 data are a key indicator at a time of changing fire regimes. Recent rates appear somewhat deficient for high-severity fire in subalpine forest and sagebrush landscapes. Subalpine forests have been heavily disturbed by a spruce beetle outbreak [41], and likely do not need intentionally added fire at this time. Sagebrush landscapes are likely deficient in fire, which could be restored, but sagebrush first needs active restoration of native grasses and forbs, and control of cheatgrass (Bromus tectorum), an invasive annual grass, to avoid the degradation documented in [10]. Recent rates are likely within HRV for piñon-juniper woodlands, mixed-mountain and miscellaneous shrublands, and grasslands. Thus, it is sensible to focus restoration in ponderosa pine landscapes, where a six-fold increase in fire is needed for restoration, and mixed-conifer landscapes, where a tripling is needed, based on Table 4 and Table 6.
There is no ecological restoration need to reduce moderate-high or high fire severity in ponderosa pine or mixed-conifer forest landscapes, or any other ecosystem type, through fuel reduction, since these severities are deficient relative to the HRV; doing so would be similar to fire suppression, since more fire with these severities, not less, is needed (Table 4 and Table 6). In ponderosa pine, recent rotations of moderate- to high-severity fire (1544 years) and high-severity fire (9821 years) remain substantially deficient relative to corresponding historical rates (135–688 and 280–1145 years). Similarly, in mixed-conifer forest landscapes, recent rotations of moderate-high-severity fire (245 years) and high-severity fire (4810 years) remain deficient relative to historical rates (94–156 and 121->471 years). Thus, the landscape ecological restoration need is increased fire of all severities, especially low- and low- to moderate-severity fire in ponderosa pine and mixed conifer landscapes, not fuel reduction or fire suppression.
Recent fire sizes in the San Juan Mountains do not appear to be outside their HRV, based on the available but incomplete evidence from this study. Most 1980–2020 fires were small, as 99.7% were ≤1000 ha in area and only 62 were >250 ha in area. The largest recent fire, the 27,907 ha 2002 Missionary Ridge fire, was relatively small compared to the likely historical potential for fires reaching 50,000–100,000 ha [31]. Moderate- to high-severity sizes of recent fires appear similar to historical fire sizes (Figure 4), and the null hypothesis of no difference could not be rejected. Similar findings were reported for moderate- to high-severity fire sizes in 624,156 ha of the nearby Colorado Front Range [42]. Thus, there is no ecological restoration need to reduce the moderate- to high-severity components of fire sizes in the San Juan Mountains and Colorado Front Range. Instead, it is important to be prepared for future fires possibly reaching or even exceeding historical fire sizes. However, this fire-size analysis is imperfect, because total fire sizes are not known; the low-severity component of fire regimes has not been reconstructed spatially. Additionally, climate fluctuations and change are strongly linked to changes in fire in the paleo record from 15 to 10 K before present in the western USA [4], but the role of other factors (e.g., fuels) in historical fires is not fully known. Similarly, reliable historical evidence about burning by Indians is scant, but the best supported hypothesis is that “Indians were a small part of a large Rocky Mountain wilderness, with a fire regime, in much of the mountains, essentially free of human influence for millennia” ([43] p. 70).
Recent and historical fire regimes in the San Juan Mountains, and most fire regimes globally [44], have the property that total burned area is primarily from a few large fires concentrated in a few exceptional fire years in particular areas. In the San Juan Mountains from 1980 to 2020, only 35 of 4716 wildfires (0.7%) accounted for 95% of total burned area (Table 7) and 89% of total burned area occurred in just 5 of the 41 fire years (Figure 3a1). Exceptional fires and fire years also were concentrated in montane landscapes in the southwestern San Juans and to a lesser extent in subalpine and montane landscapes in the Rio Grande Headwaters of the eastern San Juans, with none in the northern San Juans (Figure 2). This general pattern of more fire in the southwestern San Juans, found here (Figure 2), is consistent with evidence from early forest atlases that moderate- to high-severity fires burned historically at much longer rotations in ponderosa pine forests in the eastern San Juans than in the southwestern San Juans [31]. Ignitions and small fires were concentrated in the lower elevations of the southwestern San Juans (Figure 2) where flammable ponderosa pine and mixed-conifer forests dominate (Figure 1). This southwestern area faces into prevailing westerly winds that commonly favor southwestern- to northeastern fire spread in the Rocky Mountains [13], and also has multiple river valleys that trend in these directions, favoring fire spread. It is likely that exceptional fire years will continue to favor large fires, especially in the southwestern San Juans.
Fires likely increased between 1980–2010 and 2011–2020 (Table 4, Figure 3) not primarily because of past fire suppression and fuel buildup. According to a common theory, fuel buildup and past management have especially affected dry forests, where low-severity fires historically kept fuel loads low, leading now to larger fires, increased burned area, and increased higher-severity fires (e.g., [3,45]). However, ponderosa pine and mixed-conifer forests had increases in fire density (167–192%) below the 200% average across ecosystem types, and shared, among five of seven ecosystem types, similar declines in fire rotations to 24–29% of 1980–2010 values (Table 4), evidence this theory is not supported in the San Juan Mountains. The greatest increases in fire, indicated by larger declines in fire rotations, were in grasslands (to 17%) and subalpine forests (to 9%), where decades of fuel buildup were unlikely to have had much effect, given the naturally long historical fire rotations and few historical low-intensity fires in these ecosystem types. Finally, increased fire by 2011–2020 was not the result of increases in moderate-high and high-severity fire in dry forests, both of which had no significant trend over the 41-year period (Figure 3c,d). Instead, significant increase was only in low and low-moderate fire severity (Figure 3b), which is not attributed, by this theory, to fuel buildup and past management. The theory that fire suppression and past management led to increased fires and unnatural fire severity is not supported in this mountain range.
Instead, consistency in patterns of increased fire across ecosystem types and watersheds (Table 4 and Table 5) strongly suggests a dominant climatic effect, with added effect by ignitions of large fires by people and an unknown effect from fire suppression. The magnitude of climatic increase in fire appears to have been little affected by: (1) ecosystem differences, since five of seven ecosystem types shared similar percentages of change (Table 4), or (2) the pattern of physical effects that led to lower fire density and longer fire rotations in the northern and eastern San Juans (Figure 2), as similar rates of change in fire could be found in all areas. Ignitions by people played a role—the San Juans were dominated (60% of area burned) from 1980 to 2020 by natural ignitions by lightning, less so (47%) if the 2002 Missionary Ridge fire was human-set. Thus, human-set fires have been significant in determining, along with natural ignitions, which watersheds show the most increase in fire. Intentional fire suppression continues today, and likely also shaped patterns of change in fire, but data are insufficient to quantify this effect, since the area that would have burned, had no suppression occurred, is not known.

4.2. Restoring Fire across San Juan Mountain Landscapes

Fire warrants ecological restoration, as it is a key natural disturbance that strongly shapes landscape diversity and patterns of successional stages of vegetation, the mixture of ecosystem types, and the structure and functioning of ecosystems, all of which are primary sources of biological diversity [3,11,13,32,33] and also affect climate [45]. Suppression of fires reduced landscape diversity and patterns, and altered the structure and function of many ecosystems, particularly those at lower elevations, where fire was more frequent [31], but restoring fire can re-establish many structures and functions, and can help restore biological diversity. Restoring fires, which include some moderate- to high-severity fires that can restore historical landscape patterns, can help re-establish local patterns of albedo and snow cover that ultimately affect regional climate and hydrology [45].
How can historical fire regimes best be restored across the San Juan Mountains in congruence with climate change? Increase in fire by 2011–2020, largely from climate change, brought piñon-juniper woodlands, shrublands, and grasslands within their HRV for rates of fire and reduced the fire deficit for subalpine forests, sagebrush, ponderosa pine forests and mixed-conifer forests. Thus, climate change has effectively partly or fully restored historical fire rates in all these ecosystems. Since fire rates are still deficient for all fire severities in ponderosa pine and mixed-conifer forests, more of all severities is needed, if the goal is ecological restoration.
Fuel reduction and intentional fire suppression, which both reduce fires and reduce fire severity, are clearly ecologically deleterious for all ecosystem types in this mountain range, since more fire and all fire severities are ecologically needed, if the goal is restoration. From the perspective of restoring fire, there is no scientific basis for continuing these practices as a part of ecological restoration. The only significantly increasing fire severities over the 41-year analysis period were just low and low-moderate severity (Figure 3b), which are widely appreciated as restorative. From the standpoint of restoring fire, there is also no need to restore vegetation structure (e.g., tree density, shrub cover) before reintroducing fire, as current structure is not leading to uncharacteristic fire in any ecosystem type. Further climate change will likely continue to lead to more fires that will further reduce fire deficits without intentional action (e.g., active management, such as mechanical thinning or mastication) by people. However, increasing wildland fire use [46], which is managing natural fires for resource benefit, is the best way to use increasing fires from climate change to achieve further ecological restoration across San Juan ecosystem types and landscapes. Natural fires include all fire severities.
However, increased prescribed burning for ecological restoration could hasten recovery of low-severity fire in ponderosa pine and mixed-conifer forests in the limited settings where low-severity fire played a major ecological role [28,31,34]. This included only 32% of historical pine zones and 23% of dry mixed conifer, mostly at lower elevations and on southerly-facing slopes [34]. Low-severity fire in ponderosa pine forests, burning in 2011–2020 at a 204-year rotation (1297 ha/year) from wildfires, would need a six-fold increase to reach the historical 34-year rotation (7780 ha/year), thus an additional 6483 ha/year. Similarly, low-severity fire in mixed-conifer forests, burning in 2011–2020 at a 309-year rotation (1820 ha/year) from wildfires, would need a three-fold increase to reach the historical 106-year rotation (5306 ha/year), thus an additional 3486 ha/year. Some of the combined ∼10,000 ha/year addition needed is already coming from prescribed fires (Figure 3a2), which averaged ∼1500 ha/year since 2003. However, prescribed fires reached 7424 ha in 2008 and 6005 ha in 2019, showing they can already, at times, reach 60–75% of the ∼10,000 ha scale needed to fully accomplish restoration of low-severity fire in these forests. With modest further increase in prescribed burning, combined with increased fire use and more fire from climate change, full restoration of historical low-severity fire rates is within reach in this mountain range. Without question, increasing the pace and scale of prescribed burning and wildland fire use, together, could feasibly, in the next few decades, restore fire to its historical role in much of the San Juan Mountains, which would be a very significant ecological achievement at the landscape scale.
Some hurdles remain. First, warming has already pushed the lower temperature limit of the montane, above which ponderosa pine and mixed-conifer forests and relatively frequent fire historically occurred, up almost to the middle of the montane ([21] Figure 10b). However, extensive tree mortality from climate change below this line has not yet ensued. This temperature limit is likely to rise a little further in the next few decades ([21] Figure 10c), then stabilize, assuming the optimistic Paris 1.5 °C goal is reached. Above this line thus makes more sense as a priority for restoration and increased low-severity fire, in general. Below the line is effectively a trailing-edge forest [21] that could change, or might not, to another ecosystem type (e.g., sagebrush, piñon-juniper). Prescribed burning below the line could possibly enhance persistence of these forests, but also could just kill already-stressed trees; thus, controlled experimentation with monitoring of tree mortality is needed. Second, more evidence could substantiate that longer recent fire rotations in eastern and northern San Juan forests, relative to southwestern San Juan forests (Figure 2), occurred historically, and warrant replication in restoration. Landscape-scale spatial fire histories (e.g., [47]) in the north and east could further confirm this. In the meantime, the southwestern San Juans are a sensible focal area for fire restoration, as that is where the most fire is occurring (Figure 2). Finally, other ecosystem types are less in need of increased fire; it makes the most sense to focus prescribed fire in ponderosa pine and dry mixed-conifer ecosystem types, and enable wildland fire use to continue to restore other ecosystem types. Of course, it is important to avoid fire where invasive plant expansion may be favored by fire, to prevent further damaging ecosystems.
New awards under the Collaborative Forest Landscape Restoration Program (CFLRP) to restore dry forests, in parts of both the San Juan and Rio Grande National Forests provide funding for restoring fire. The Omnibus Public Land Management Act of 2008 that established the CFLRP requires these awards “reduce the risk of uncharacteristic wildfire, including through the use of fire for ecological restoration and maintenance and reestablishing natural fire regimes, where appropriate.” Evidence here shows that uncharacteristic wildfire has not occurred in the study area, and reduction would thus currently be fire suppression; instead reestablishing natural fire regimes remains the key need under the CFLRP. Wildland fire use is highlighted in the legislation, and here, as the key method, but CFLRPs also provide opportunity for expanded prescribed burning where low-severity fire historically dominated. Prescribed burning and fire use do not require prior thinning or mechanical fuel reduction, as fires are not burning outside HRV in current forests, and more, not less moderate- to high-severity fire is needed to reach HRV. CFLRPs can usually avoid thinning and mechanical fuel-reduction in forests, where they are not needed for restoration and have unnecessary, ecologically damaging effects [48].
However, if wildland fire use and prescribed burning are to be expanded, strategic thinning and other means of fuel reduction are essential in the wildland vegetation that is mostly on private property, not public land [49], within ∼100 m of buildings and other highly valued resources and assets. This limited area is where ∼95% of building loss in past wildland–urban interface fire disasters occurred [9], and fuel reduction is most needed to rapidly improve adaptation to increasing fire [2]. Note that 2011–2020 fire rotations were shortest in low-elevation mixed mountain shrublands and ponderosa pine forests, and intermediate in grasslands and mixed conifer, thus buildings and infrastructure near these are likely most at risk, although fires can occur in any natural vegetation.
The primary contribution of this research was to closely examine the common theory today that fires are burning at unnaturally high rates, severities, and sizes that are ecologically damaging to many ecosystems in the western USA. While this theory could hold elsewhere, this case study refutes this theory for the main ecosystems in this large San Juan Mountain range through 2020. This analysis establishes that fire was, up to 2020, within HRV or deficient in all ecosystems. Thus, fire is generally restorative; it is likely that further warming will continue to restore the structure and function of all ecosystems.
This study has limitations, some of which could possibly be resolved, but others that appear inherent. First, a limitation is the incomplete record of historical fires, which were mapped only for their moderate- to high-severity components. This limitation could possibly be overcome with newer spatial fire-history reconstruction methods (e.g., [47]). Another limitation that could be overcome is the absence of a direct analysis of which components of climate change are most causing increasing fire in this mountain range. An inherent limitation is the need to use a short period to characterize the most recent fire, knowing that short periods are inherently less accurate. Additionally, over such a large land area over 41 years only 35 fires were responsible for most of the burned area; it is an inherent limitation that a large sample of key large fires may require multiple mountain ranges. Evidence about factors, other than climate, influencing historical fire regimes is incomplete and may be difficult to reconstruct (e.g., fuels), possibly an inherent limitation. Finally, the unknown impact of intentional fire suppression is an inherent limitation.

5. Conclusions

A contribution of this study is the finding that fires have increased substantially since 1980–2010, but are not burning recently (2011–2020) at unnaturally high rates, severities, or sizes that are outside HRV or are ecologically damaging to ecosystems. Fires doubled in density and fire rates increased about 3.5–4.2 times, comparing 1980–2010 to 2011–2020. These increases were relatively consistent across seven ecosystem types and 18 watersheds, suggesting a climatic effect, rather than fuel buildup or fire suppression. Fuel buildup and fire suppression would have increased fire primarily in ponderosa pine and mixed-conifer forests, but similar increases in fire occurred in three other ecosystems, suggesting a climatic effect. The finding, that increasing fire is occurring relatively consistently across ecosystem types and watersheds, was unexpected, as was that fire is increasing as both higher density and shorter rotations. It also was unknown that recent fire is concentrated in the southwestern San Juans, mostly at lower elevations.
The result of recent fire increases is that fires are recently burning nearer to, or within historical rates and patterns. Recent rates remain somewhat deficient in subalpine forests and sagebrush shrublands and substantially deficient in ponderosa pine and mixed-conifer forests. Recent rates are within the historical range of variability for piñon-juniper woodlands, mixed mountain and miscellaneous shrublands, and grasslands. In ponderosa pine and mixed-conifer landscapes, there is no need to reduce moderate-to-high or high-severity fires, as these remain substantially deficient relative to their HRV. The main ecological restoration need for fire in this mountain range is increased fire of all severities, particularly in ponderosa pine and mixed-conifer landscapes, not fuel reduction or fire suppression. Both of these are ecologically damaging, if the goal is ecological restoration of fire. Fuel reduction and fire suppression are not needed generally, except for protection close to buildings and infrastructure.
Regarding the title question, yes climate change is currently restoring historical fire regimes across landscapes, ecosystem types, and watersheds in this 2.6 million ha temperate mountain range. Approximately 2/3 of expected warming, assuming the optimistic Paris 1.5 °C goal could be reached ca 2050–2060, has already occurred, yet fire remains deficient or is within HRV across ecosystems. Periodic (e.g., 10-year) re-evaluations, like this one, are essential as the climate continues to warm, because unanticipated changes or accelerated increases in fire could occur. It remains an open question whether people will adapt to fire burning at rates and patterns similar to historical rates and patterns, but climate change is moving fire in this direction. The evidence here shows that increased fire from expected remaining warming, supplemented by prescribed burning, could feasibly nearly fully restore fire regimes across landscapes and ecosystems in the San Juan Mountains by 2050–2060, which would be a significant ecological achievement.

Supplementary Materials

The following are available online at https://www.mdpi.com/article/10.3390/land11101615/s1. Data S1-GIS (geodatabase) maps of the study area boundary, fire points, and fire perimeters used in the analysis.

Funding

This research received no external funding.

Data Availability Statement

All original fire data are from publicly available data sources given in Table 2. My compilations of these data are in Data S1, in Supplementary Materials.

Acknowledgments

I appreciate assistance with local fire records by Mark Roper and Brad Pietruszka at the San Juan National Forest, Cheryl O’Brien at the Rio Grande National Forest, Tony Smith at the Grand Mesa, Uncompahgre, and Gunnison National Forests, and David Sinton at the BLM Uncompahgre Field Office. I am grateful to four peer-reviewers and the editor, whose helpful comments substantially improved the paper.

Conflicts of Interest

The author declares no conflict of interest.

References

  1. Parks, S.A.; Abatzoglou, J.T. Warmer and drier fire seasons contribute to increases in area burned at high severity in western US forests from 1985 to 2017. Geophys. Res. Lett. 2020, 47, e2020GL089858. [Google Scholar] [CrossRef]
  2. Schoennagel, T.; Balch, J.K.; Brenkert-Smith, H.; Dennison, P.E.; Harvey, B.J.; Krawchuk, M.A.; Mietkiewicz, N.; Morgan, P.; Moritz, M.A.; Rasker, R.; et al. Adapt to more wildfire in western North American forests as climate changes. Proc. Nat. Acad. Sci. USA 2017, 114, 4582–4590. [Google Scholar] [CrossRef] [PubMed]
  3. Allen, C.D.; Savage, M.; Falk, D.A.; Suckling, K.F.; Swetnam, T.W.; Schulke, T.; Stacey, P.B.; Morgan, P.; Hoffman, M.; Klingel, J.T. Ecological restoration of southwestern ponderosa pine ecosystems: A broad perspective. Ecol. Applic. 2002, 12, 1418–1433. [Google Scholar] [CrossRef]
  4. Marlon, J.R.; Bartlein, P.J.; Walsh, M.K.; Harrison, S.P.; Brown, K.J.; Edwards, M.E.; Higuera, P.E.; Power, M.J.; Anderson, R.S.; Briles, C.; et al. Wildfire responses to abrupt climate change in North America. Proc. Nat. Acad. Sci. USA 2009, 106, 2519–2524. [Google Scholar] [CrossRef] [PubMed]
  5. Fried, J.S.; Torn, M.S.; Mills, E. The impact of climate change on wildfire severity: A regional forecast for northern California. Clim. Change 2004, 64, 169–191. [Google Scholar] [CrossRef]
  6. Fried, J.S.; Gilless, J.K.; Riley, W.J.; Moody, T.J.; Simon de Blas, C.; Hayhoe, K.; Moritz, M.; Stephens, S.; Torn, M. Predicting the effect of climate change on wildfire behavior and initial attack success. Clim. Change 2008, 87 (Suppl. 1), S251–S264. [Google Scholar] [CrossRef]
  7. Goss, M.; Swain, D.L.; Abatzoglou, J.T.; Sarhadi, A.; Kolden, C.A.; Williams, A.P.; Diffenbaugh, N.S. Climate change is increasing the likelihood of extreme autumn wildfire conditions across California. Environ. Res. Lett. 2020, 15, 094016. [Google Scholar] [CrossRef]
  8. Hessburg, P.F.; Prichard, S.J.; Hagmann, R.K.; Povak, N.A.; Lake, P.K. Wildfire and climate change adaptation of western North American forests: A case for intentional management. Ecol. Applic. 2021, 31, e02432. [Google Scholar] [CrossRef]
  9. Caggiano, M.D.; Hawbaker, T.J.; Gannon, B.J.; Hoffman, C.M. Building loss in WUI disasters: Evaluating the core components of the wildland-urban interface definition. Fire 2020, 3, 73. [Google Scholar] [CrossRef]
  10. Mahood, A.L.; Balch, J.L. Repeated fires reduce plant diversity in low-elevation Wyoming big sagebrush ecosystems (1984–2014). Ecosphere 2019, 10, e02591. [Google Scholar] [CrossRef] [Green Version]
  11. Landres, P.B.; Morgan, P.; Swanson, F.J. Overview of the use of natural variability concepts in managing ecological systems. Ecol. Applic. 1999, 9, 1179–1188. [Google Scholar]
  12. Baker, W.L. Are high-severity fires burning at much higher rates recently than historically in dry-forest landscapes of the western USA? PLoS ONE 2015, 10, e0136147. [Google Scholar]
  13. Baker, W.L. Fire Ecology in Rocky Mountain Landscapes; Island Press: Washington, DC, USA, 2009; pp. 1–605. [Google Scholar]
  14. Pinto, G.A.S.J.; Niklasson, M.; Ryzhkova, N.; Drobyshev, I. A 500-year history of forest fires in Sala area, central Sweden, shows the earliest known onset of fire suppression in Scandinavia. Reg. Environ. Change 2020, 20, 130. [Google Scholar] [CrossRef]
  15. Williams, A.N.; Mooney, S.D.; Sisson, S.D.; Marlon, J. Exploring the relationship between Aboriginal population indices and fire in Australia over the last 20,000 years. Palaeogeogr. Palaeoclim. Palaeoecol. 2015, 432, 49–57. [Google Scholar] [CrossRef]
  16. Conedera, M.; Tinner, W.; Neff, C.; Meurer, M.; Dickens, A.F.; Krebs, P. Reconstructing past fire regimes: Methods, applications, and relevance to fire management and conservation. Quat. Sci. Rev. 2009, 28, 555–576. [Google Scholar] [CrossRef]
  17. Marcisz, K.; Tinner, W.; Colombaroli, D.; Kolaczek, P.; Slowiński, M.; Fialkiewicz-Koziel, C.; Lokas, E.; Lamentowicz, M. Long-term hydrological dynamics and fire history over the last 2000 years in CE Europe reconstructed from a high-resolution peat archive. Quat. Sci. Rev. 2015, 112, 138–152. [Google Scholar] [CrossRef]
  18. Hamilton, T.; Wittkuhn, R.S.; Carpenter, C. Creation of a fire history database for southeastern Australia: Giving old maps new life in a geographic information system. Conserv. Sci. W Aust. 2009, 7, 429–450. [Google Scholar]
  19. Rangwala, I.; Miller, J.R. Twentieth century temperature trends in Colorado’s San Juan Mountains. Arct. Antarct. Alpine Res. 2010, 42, 89–97. [Google Scholar] [CrossRef]
  20. Lukas, J.; Barsugli, J.; Doesken, N.; Rangwala, I.; Wolter, K. A report for the Colorado Water Conservation Board by Western Water Assessment, Cooperative Institute for Research in Environmental Sciences (CIRES). Climate change in Colorado: A Synthesis to Support Water Resources Management and Adaptation, 2nd ed.; University of Colorado: Boulder, CO, USA, 2014. [Google Scholar]
  21. Baker, W.L. Restoration of forest resilience to fire from old trees is possible across a large Colorado dry-forest landscape by 2060, but only under the Paris 1.5 °C goal. Global Change Biol. 2021, 27, 4074–4095. [Google Scholar] [CrossRef]
  22. Arendt, P.A.; Baker, W.L. Northern Colorado Plateau piñon-juniper woodland decline over the past century. Ecosphere 2013, 4, 103. [Google Scholar] [CrossRef]
  23. Short, K.C. A spatial database of wildfires in the United States, 1992–2011. Earth Syst. Sci. Data 2014, 6, 1–27. [Google Scholar] [CrossRef]
  24. Short, K.C. Sources and implications of bias and uncertainty in a century of US wildfire activity data. Int. J. Wildl. Fire 2015, 24, 883–891. [Google Scholar] [CrossRef]
  25. Kolden, C.A.; Smith, A.M.S.; Abatzoglou, J.T. Limitations and utilisation of Monitoring Trends in Burn Severity produces for assessing wildfire severity in the USA. Int. J. Wildl. Fire 2015, 24, 1023–1028. [Google Scholar] [CrossRef]
  26. Hawbaker, T.J.; Vanderhoof, M.K.; Schmidt, G.L.; Beal, Y.-J.; Picotte, J.J.; Takacs, J.D.; Falgout, J.T.; Dwyer, J.L. The Landsat burned area algorithm and products for the conterminous United States. Rem. Sens. Envir. 2020, 244, 111801. [Google Scholar] [CrossRef]
  27. U.S. Forest Service. Forest Service. Fire Statistics System (FIRESTAT) User Guide for the Individual Wildland Fire Report; FS-5100-29; USDA Forest Service: Washington, DC, USA, 2016.
  28. Baker, W.L. Restoring and managing low-severity fire in dry-forest landscapes of the western USA. PLoS ONE 2017, 12, e0172288. [Google Scholar] [CrossRef]
  29. Agee, J.K. Fire Ecology of Pacific Northwest Forests; Island Press: Washington, DC, USA, 1993; pp. 1–493. [Google Scholar]
  30. Eidenshink, J.; Schwind, B.; Brewer, K.; Zhu, Z.-L.; Quayle, B.; Howard, S. A project for monitoring trends in burn severity. Fire Ecol. 2007, 3, 3–21. [Google Scholar] [CrossRef]
  31. Baker, W.L. Historical fire regimes in ponderosa pine and mixed-conifer landscapes of the San Juan Mountains, Colorado, USA, from multiple sources. Fire 2018, 1, 23. [Google Scholar] [CrossRef]
  32. Romme, W.H.; Floyd, M.L.; Hanna, D. Historical Range of Variability and Current Landscape Condition Analysis: South-Central Highlands Section, Southwestern Colorado & Northwestern New Mexico; Colorado Forest Restoration Institute, Colorado State University: Fort Collins, CO, USA, 2009; pp. 1–186. [Google Scholar]
  33. Bukowski, B.E.; Baker, W.L. Historical fire in sagebrush landscapes of the Gunnison sage-grouse range from land-survey records. J. Arid Environ. 2013, 98, 1–9. [Google Scholar] [CrossRef]
  34. Baker, W.L. Variable forest structure and fire reconstructed across historical ponderosa pine and mixed conifer landscapes of the San Juan Mountains, Colorado. Land 2020, 9, 3. [Google Scholar] [CrossRef]
  35. Bigio, E.R. Late Holocene Fire and Climate History of the Western San Juan Mountains, Colorado, Results from Alluvial Stratigraphy and Tree-Ring Methods. Ph.D Dissertation, University of Arizona, Tucson, AZ, USA, 2013. [Google Scholar]
  36. Shinneman, D.J.; Baker, W.L. Historical fire and multidecadal drought as context for piñon-juniper woodland restoration in western Colorado. Ecol. Applic. 2009, 19, 1231–1245. [Google Scholar] [CrossRef]
  37. Floyd, M.L.; Hanna, D.D.; Romme, W.H. Historical and recent fire regimes in piñon-juniper woodlands on Mesa Verde, Colorado, USA. For. Ecol. Manage. 2004, 198, 269–289. [Google Scholar] [CrossRef]
  38. Fitch, E.P. Holocene fire-related alluvial chronology and geomorphic implications in the Jemez Mountains, New Mexico. Master’s Thesis, University of New Mexico, Albuquerque, NM, USA, 2013. [Google Scholar]
  39. Toney, J.L.; Anderson, R.S. A postglacial palaeoecological record from the San Juan Mountains of Colorado USA: Fire, climate and vegetation history. Holocene 2006, 16, 505–517. [Google Scholar] [CrossRef]
  40. Floyd, M.L.; Romme, W.H.; Hanna, D.D. Fire history and vegetation pattern in Mesa Verde National Park, Colorado, USA. Ecol. Applic. 2000, 10, 1666–1680. [Google Scholar] [CrossRef]
  41. Hart, S.J.; Veblen, T.T.; Schneider, D.; Molotch, N.P. Summer and winter drought drive the initiation and spread of spruce beetle outbreak. Ecology 2017, 98, 2698–2707. [Google Scholar] [CrossRef]
  42. Williams, M.A.; Baker, W.L. Comparison of the higher-severity fire regime in historical (A.D. 1800s) and modern (A.D. 1984-2009) montane forests across 624,156 ha of the Colorado Front Range. Ecosystems 2012, 15, 832–847. [Google Scholar] [CrossRef]
  43. Baker, W.L. Indians and fire in the Rocky Mountains: The wilderness hypothesis renewed. In Fire, Native Peoples, and the Natural Landscape; Vale, T.R., Ed.; Island Press: Washington, DC, USA, 2002; pp. 41–76. [Google Scholar]
  44. Moritz, M.A.; Morais, M.E.; Summerell, L.A.; Carlson, J.M.; Doyle, J. Wildfires, complexity, and highly optimized tolerance. Proc. Nat. Acad. Sci. USA 2005, 102, 17912–17917. [Google Scholar] [CrossRef]
  45. Pielke, R.A.; Marland, G.; Betts, R.A.; Chase, T.N.; Eastman, J.L.; Niles, J.O.; Niyogi, D.S.; Running, S.W. The influence of land-use change and landscape dynamics on the climate system: Relevance to climate-change policy beyond the radiative effect of greenhouse gases. Philos. Trans. R Soc. A Math. Phys. Eng. Sci. 2002, 360, 1705–1719. [Google Scholar] [CrossRef]
  46. Ingalsbee, T. Ecological fire use for ecological fire management: Managing large wildfires by design. In Proceedings of the Large Wildland Fires Conference, Missoula, MT, USA, 19–23 May 2014; Keane, R.M., Jolly, J., Parsons, R., Riley, K., Eds.; USDA Forest Service Proceedings RMRS-P-73, Rocky Mountain Research Station: Fort Collins, CO, USA, 2015; pp. 120–127. [Google Scholar]
  47. Dugan, A.J.; Baker, W.L. Sequentially contingent fires, droughts and pluvials structured a historical dry forest landscape and suggest future contingencies. J. Veg. Sci. 2015, 26, 697–710. [Google Scholar] [CrossRef]
  48. DellaSala, D.A.; Baker, B.C.; Hanson, C.T.; Ruediger, L.; Baker, W. Have western USA fire suppression and megafire active management approaches become a contemporary Sisyphus? Biol. Cons. 2022, 268, 109499. [Google Scholar] [CrossRef]
  49. Downing, W.M.; Dunn, C.J.; Thompson, M.P.; Caggiano, M.D.; Short, K.C. Human ignitions on private lands drive USFS cross-boundary wildfire transmission and community impacts in the western US. Sci. Rep. 2022, 12, 2624. [Google Scholar] [CrossRef]
Figure 1. The study area in southwestern Colorado, showing the Continental Divide, the 18 watersheds, and the eight pooled ecosystem types.
Land 11 01615 g001
Figure 2. Wildfire perimeters and points, and prescribed-fire perimeters, for 1980–2020, showing the 18 watersheds and the Continental Divide (dashed red line). Numbers shown for each watershed are the fire density for the 41-year period (No. fires per year per 100,000 ha) on top and the fire rotation (years) on the bottom.
Land 11 01615 g002
Figure 3. Trends in (a1) wildfires, (a2) prescribed fires, and (b) low and low-moderate fire severity, (c) moderate-high and high fire severity, and (d) fraction of fire that was moderate-high and high severity in wildfires from 1980 to 2020 in the San Juan Mountains.
Land 11 01615 g003
Figure 4. Comparison of distributions of modern (1980–2020) and historical (1850–1909) sizes of the moderate- to high-severity parts of wildfires.
Land 11 01615 g004
Table 1. Eight pooled ecosystem types in the San Juan Mountains, derived from modern Landfire existing vegetation type (EVT) data ca 2016.
Pooled TypesLandfire ValuesArea (ha)Area (%)
FORESTS AND WOODLANDS
Piñon-juniper7016, 7059, 7102, 7115115,6454.4
Ponderosa pine7054, 7117264,53610.0
Mixed conifer7011, 7051, 7052, 7061 562,42721.3
Subalpine7050, 7055–7057759,50628.7
Unknown forest7191–7193, 7197, 720019,9020.8
Total forest 1,722,01665.2
GRASSLANDS/SHRUBLANDS
Grassland7135, 7145, 7146, 7195, 7198164,1196.2
Sagebrush and salt desert shrubland7064, 7066, 7080, 7081, 7126, 7127, 7153, 9009240,6439.1
Mixed mountain and misc. shrubland7086, 7093, 7107, 7196, 7199157,5636.0
Total grasslands and shrublands 562,32521.3
Total forests, grasslands, shrublands 2,284,34186.4
Excluded: alpine, exotics and ruderal, human features, rock, water and ice, wetlands and riparian7070, 7143–4, 7292, 7295–9, 7735, 7900–4, 7920–4, 7942–4, 7961–8, 9001, 9004, 9011, 9016–9, 9021–2, 9307–9, 9327–9, 9336, 9519, 9827–9 358,26413.6
Total study area 2,642,606100.0
Table 2. Sources of modern digital fire-history evidence in the San Juan Mountains.
Dataset Type and NameSource 1Fire Years
Wildfire perimeters
BLM National Fire Perimeters
Polygon
https://data.doi.gov/dataset/blm-national-fire-perimeter-polygon11980–2020
Interagency Fire Perimeter History-All Yearshttps://data-nifc.opendata.arcgis.com(1966, 1974) 1980–2020
National USFS Fire Perimeter Feature Layerhttps://catalog.data.gov/dataset/national-usfs-fire-perimeter-feature-layer-bb844(1956, 1974) 1980–2020
USGS Wildland Fire Decision Support Syst.https://wfdss.usgs.gov/wfdss/WFDSS_Data_Downloads.shtml1980–2020
Wildfire points
Fire Program Analysis Fire
Occurrence Data
https://www.fs.usda.gov/rds/archive/Catalog/RDS-2013-0009.4/1992–2015
National USFS Fire Occurrence Point Feature Layerhttps://data-usfs.hub.arcgis.com/datasets/national-usfs-fire-occurrence-point-feature-layer/1970–2020
National Wildfire Coordinating Group: Fire and Weather Datahttps://ftp.wildfire.gov/public/weatherfirecd/data/co/1972–2017
WFIGS-Wildland Fire Locations
Full History
https://data-nifc.opendata.arcgis.com/search?collection=Dataset2014–2020
Prescribed fire perimeters
Integrated Interagency Fuels
Treatments
https://services.arcgis.com/4OV0eRKiLAYkbH2J/arcgis/rest/services/Integrated_Interagency_Fuels_Treatments_View/FeatureServer2003–2020
Fire-severity rasters
Monitoring Trends in Burn Severityhttps://www.mtbs.gov1984–2019
1 All datasets accessed on 19 January 2022.
Table 3. Causes of vegetation fires in the San Juan Mountains from 1980 to 2020.
CauseArea (ha)% of Human% of Human + Natural% of Grand Total
Human
Arson470.10.00.0
Camping/campfires5941.10.40.4
Children190.00.00.0
Debris burning2450.50.20.1
Equipment use300.10.00.0
Miscellaneous5441.00.40.3
Railroad23,22444.617.713.8
Smoking1300.30.10.1
Prescribed fires27,27152.320.816.2
Total human52,103100.039.730.9
Natural (lightning)79,052 60.346.9
Human + natural known131,155 100.077.9
Unknown cause37,292 22.1
Grand total168,447 100.0
Table 4. Estimated wildfire density and rotations for 1980–2010 (31 years) compared to 2011–2020 (10 years) by ecosystem type and overall. Alternative fire-severity estimates are given for ponderosa pine and mixed conifer, where fire severity was especially historically variable.
Ecosystem Type 1Area (ha)1980–2010 (31 yr)2011–2020 (10 yr)10 yr vs. 31 yr (%)
Density 2Rotation2Density 2Rotation 2Density 3Rotation 3
Piñon-juniper115,64511.60163526.8947023229 and 348
Ponderosa pine264,53614.5752828.0114019227 and 376
Low severity 1297 204 16 and 636
Low-moderate severity 956 182 19 and 525
Moderate-high severity 2552 1544 61 and 165
High severity 8566 9821 115 and 87
Mixed conifer562,4277.7692412.9421816724 and 423
Low severity 2199 309 14 and 712
Low-moderate severity 1528 240 16 and 637
Moderate-high severity 1756 245 14 and 717
High severity 3130 4810 154 and 65
Subalpine forests759,5062.7462994.065491489 and 1147
Unknown forest19,902------
Total forest1,722,0166.95130312.6722218217 and 586
Grassland164,1197.49116022.0619329517 and 602
Sagebrush/salt desert240,6434.2229489.6879722927 and 370
Mixed mountain shrubs157,56310.7742026.5310724626 and 392
Total grass/shrub562,3257.0193918.0121425723 and 439
Grand total2,284,3416.971,19013.9922020119 and 540
1 Ecosystem types are abbreviated here; see Table 1 for full titles. 2 Density = Fire density (Fires per year per 100,000 ha area), Rotation = Fire rotation (years). 3 Ratio of rotations from the two time periods, in %. For Density, only the 10 yr./31 yr. ratio is given, showing the percent increase in fire density, but rotations actually declined from an increase in burned area. The two forms are shown as the 10 yr./31 yr. ratio, then as the 31 yr./10 yr. ratio, both as a percent. The first ratio shows what percentage the 10-year fire rotation is of the previous 31-year fire rotation, and the second shows the percent increase in the 10-year mean annual area burned relative to the previous 31-year mean annual area burned.
Table 5. Estimated fire densities and fire rotations for 1980–2010 (31 years) compared to 2011–2020 (10 years) by watershed and overall.
Watershed 1Area (ha)1980–2010 (31 yr)2011–2020 (10 yr)10 yr vs. 31 yr (%)
Density 2Rotation 2Density 2Rotation 2Density 3Rotation 3
Alamosa-Trinchera145,2591.53202,9302.1392551395 and 2193
Animas226,1616.203549.249714927 and 366
Arkansas Headwaters87926.60106,05523.881563620 and 67952
Conejos88,6193.5336652.8221148058 and 173
Mancos24,2345.9915,6259.4910,42315867 and 150
Middle San Juan13,6867.0712,97826.3175,196372579 and 17
Montezuma58514.9664794.00518951 and 12994
Piedra150,07813.03147619.92731535 and 2028
Rio Chama21,2221.52150,5420.94326,48562217 and 46
Rio Grande Headw.346,4382.1724901.4799684 and 2515
Saguache240,0081.6438282.2557713715 and 664
San Luis34,7662.6035613.4564913318 and 548
San Miguel106,2542.8266151.8819,64067297 and 34
Tomichi175,7242.6328721.8212726944 and 226
Uncompahgre95,8913.7783192.7127427233 and 303
Upper Dolores298,6616.577939.8111414914 and 697
Upper Gunnison359,2202.0280721.8446599158 and 173
Upper San Juan301,9377.4463511.0632714952 and 194
Grand total2,642,7994.3713396.0119613815 and 682
1 Watersheds are abbreviated here; see Figure 1 for full titles. 2 Density = Fire density (Fires per year per 100,000 ha area), Rotation = Fire rotation (years). 3 Ratio of rotations from the two time periods, in %. For Density, only the 10 yr./31 yr. ratio is given, showing the percent increase in fire density. For Rotation, they actually declined from an increase in burned area, and the two forms are shown as the 10 yr./31 yr. ratio, then as the 31 yr./10 yr. ratio, both as a percent. The first ratio shows what percentage the 10-year fire rotation is of the previous 31-year fire rotation, and the second shows the percent increase in the 10-year mean annual area burned relative to the previous 31-year mean annual area burned.
Table 6. Historical fire rotations in and near the San Juan Mountains by ecosystem type and fire severity.
Ecosystem Type 1Fire SeverityFire Rotation (years)Source(s)Location(s)Type of Evidence
Piñon-juniperHigh400–600+[36]Uncompahgre PlateauTree-ring reconstr.
High400+[37]Mesa VerdeTree-ring reconstr.
Ponderosa pineLow34[31] Table 5Southwestern San JuansTree-ring reconstr.
Moderate-high135[34] Table 12Southwestern San JuansGLO reconstr.
Moderate-high185[31] Table 1Southwestern San JuansForest atlases
Moderate-high688[31] Table 1Eastern San JuansForest atlases
High280[34] Table 12Southwestern San JuansGLO reconstr.
High358[31] Table 1Southwestern San JuansForest atlases
High>471 2[35]Southwestern San JuansCharcoal reconstr.
High1145[31] Table 1Eastern San JuansForest atlases
Dry mixed coniferLow106[31] Table 5Southwestern San JuansTree-ring reconstr.
Moderate-high120[34] Table 12Southwestern San JuansGLO reconstr.
Moderate-high145[31] Table 1Southwestern San JuansForest atlases
Moderate-high156[31] Table 1Eastern San JuansForest atlases
High184[34] Table 12Southwestern San JuansGLO reconstr.
High265[31] Table 1Southwestern San JuansForest atlases
High267[31] Table 1Eastern San JuansForest atlases
High>471 2[35]Southwestern San JuansCharcoal reconstr.
High500? 2[38]Jemez Mts. 200 km SECharcoal reconstr.
Moist mixed coniferLow133[31] Table 5Southwestern San JuansTree-ring reconstr.
Moderate-high94[34] Table 12Southwestern San JuansGLO reconstr.
Moderate-high144[31] Table 1Southwestern San JuansForest atlases
Moderate-high133[31] Table 1Eastern San JuansForest atlases
High121[34] Table 12Southwestern San JuansGLO reconstr.
High254[31] Table 1Southwestern San JuansForest atlases
High224[31] Table 1Eastern San JuansForest atlases
SubalpineHigh300[32]Southwestern San JuansTree-ring reconstr.
High95[39]Southwestern San JuansCharcoal reconstr.
GrasslandsHigh90–300 3[13]Rocky MountainsAdjacent forests
Sagebrush/salt desert shrubl.
Mountain big sagebrushHigh90–178[33]Southwestern ColoradoGLO reconstr.
Wyoming big sagebrushHigh160–692[33]Southwestern ColoradoGLO reconstr.
Mixed/misc. shrubl.High100[40]Mesa VerdeTree-ring reconstr.
1 Ecosystem types, abbreviated here, are listed in Table 1. 2 Estimates shown for [35,38] are my rough estimates ([12] Table 1) from using their data. Note that the estimate for [35] is a combined estimate for ponderosa pine and mixed-conifer forests. 3 Historical grassland fire rotations are relatively unknown and difficult to study; these are very rough estimates for the Rocky Mountains based on estimated fire rotations in adjoining forests. A general lack of charcoal in these grasslands suggests these are in the ballpark.
Table 7. Largest wildfires in the San Juan Mountains from 1980 to 2020 in order by decreasing area, also showing cumulative area, cumulative percentage (%) of 141,146 ha of total fire area, as well as the cumulative percentage of 4716 total wildfires.
Cumulative AreaCumulative %
No.YearFire NameArea (ha)(ha)%Of 4716 Total FiresOf 379 Fires > 4 ha
12002Missionary Ridge27,90727,90719.8
22013West Fork22,89550,80236.0
3201841622,32673,12851.8
42013Papoose19,01892,14665.30.11.0
52012Little Sand10,621102,76772.8
62018Plateau8003110,77078.5
72009Narraguinnep3161113,93180.7
82002Million3003116,93482.8 2.0
92018Burro2124119,05884.30.2
101996Disappointment1476120,53485.4
112012Vallecito1119121,65386.2 3.0
122019Doe Canyon1036122,68986.9
132009Bradfield1033123,72287.6
142002Unnamed769124,49188.20.3
152003Bear Creek756125,24788.7 4.0
161996Unnamed746125,99389.2
172016Long Draw702126,69589.7
182003Bolt595127,29090.2
192013Windy Pass574127,86490.60.45.0
202017Draw572128,43691.0
212018Horse Park546128,98291.4
221984Unnamed541129,52391.7
231988Unnamed492130,01592.1 6.0
242005Far Draw473130,48892.40.5
252005Rio Blanco438130,92692.7
262012Goblin435131,36193.0
272018West Guard425131,78693.3 7.0
281999Sandoval3355132,14193.60.6
292019Cow Creek348132,48993.8
302018Horse298132,78794.1 8.0
311998House Creek281133,06894.3
322017East Rim269133,33794.4
332002West Beaver258133,59594.60.7
342020Ice242133,83794.8 9.0
352002Schaff II225134,06295.0
Publisher’s Note: MDPI stays neutral with regard to jurisdictional claims in published maps and institutional affiliations.

