Article

Spatial Patterns and Driving Factors of Rural Population Loss under Urban–Rural Integration Development: A Micro-Scale Study on the Village Level in a Hilly Region

College of Resources and Environment, Shandong Agricultural University, Taian 271018, China
*
Author to whom correspondence should be addressed.
Land 2022, 11(1), 99; https://doi.org/10.3390/land11010099
Submission received: 13 December 2021 / Revised: 1 January 2022 / Accepted: 5 January 2022 / Published: 8 January 2022
(This article belongs to the Special Issue Efficient Land Use and Sustainable Urban Development)

Abstract

:
Under the background of urban–rural integration, balanced development between urban and rural areas has been increasingly advocated. Rural population loss (RPL) is not only due to the laws of social and economic development but also the comprehensive action of natural, social, and economic factors. Taking 774 administrative villages in Laiyang County, which is in a hilly region, as our research area, we comprehensively used spatial analysis and geographic detectors to explore the spatial characteristics and driving factors of RPL, which was significantly correlated with rural planning. The research demonstrated that: (1) The rural population in Laiyang County generally had a low level of RPL (1.9%), but each village varied greatly. The village with the greatest RPL had a rate of 56%. The RPL between urban and rural areas, towns and streets, and villages and villages were unbalanced, and rural population flow mainly occurred between urban and rural areas. (2) RPL in Laiyang County was generally low in the central urban area and high in the northern and southern areas. Population loss presents agglomeration globally and high–low agglomeration locally. (3) The distance from village to county, elevation, cultivated land quantity, collective economic income, village area, and ecological service value were the key factors influencing RPL in Laiyang County. When comparing the dominant factors, the interaction between collective income and elevation was the strongest. Exploring the spatial characteristics and influencing factors of RPL provided us with ideas for the classified promotion of rural revitalization, preparation of rural development planning, and promotion of the integrated development of urban and rural areas.

1. Introduction

Human migration, a demographically geographic phenomenon, is defined as the movement of people from one place to another, permanently or temporarily, and often includes immigration and emigration, particularly caused by natural hazards, infectious diseases, civil disturbance, better living conditions, or healthcare needs. Since the rapid advancement of industrialization and urbanization, industrial agglomeration tends to bring about population decrease in many non-metropolitan counties, especially in rural areas, as has happened in many developed countries such as the United States of America [1] and most of Europe [2], as well as in developing countries and regions such as China, India, and Brazil [3]. Additionally, it causes many problems such as rural poverty, farmland abandonment, food insecurity, and an aging rural population, which are now receiving the attention of the international community.
Along with the occurrence of these crises, a wide range of studies concerning rural population emigration, also called rural population loss (RPL), have been conducted to discuss its origins and solutions across the world. Numerous studies have revealed the links between natural conditions and rural emigration. For example, natural landscapes such as high altitude [4], drought [5], and soil infertility [6] curb cultivation and damage food security. Climate change, in particular extreme weather events such as intense precipitation [7] and rising sea levels [8], happens more frequently in eco-fragile regions, which has a negative impact on human livelihoods. Under such circumstances, it may be that only emigration can help people to escape from poor living conditions. Moreover, some researchers have concluded that socioeconomic factors play a crucial role in rural depopulation. The concentration of investment has reshaped urban–rural integrated development, reallocated production factors, and created new job opportunities that have attracted workers and caused population decreases in rural areas [9]—even in some regions with strong economies like Jiangsu province, China [10]. Consequently, the development gulf has been constantly widening between rural and urban areas and rural poverty has increased as a result of this economic situation. There is a consensus that advocacy for agricultural and rural development is the best way to address the root cause of rural population loss [11].
China is no exception to this pattern. Over the past four decades of reform and opening up, China has become the second largest economy and the most populous country, whose economy has shown robust and resilient growth. The creation of millions of job opportunities in cities has propelled urbanization. According to the National Bureau of Statistics, the urbanization rate between 2010 and 2020 showed a 14.21% increase on average, which means that rural depopulation occurred. However, people are the core and driving force of social and economic development and rural revitalization, the absence of which is likely to accelerate the trend of farmland abandonment by which land is left uncultivated and economically damaged and the limited access to infrastructure and effective investment leads to rural ruins in which “village-hollowing” occurs. Strictly speaking, the result of population emigration is the loss of population. RPL is the inevitable result of socio-economic development and urbanization [12], as well as the combination of rural natural, social, economic, and other factors. Under different natural, social, and economic conditions rural population transfer is different, and its development path may be different in the future. In response to RPL, the Chinese government proposed rural revitalization at the 19th CPC Conference and has taken a series of actions to reverse this trend and use policy instruments to tackle the issue of rural poverty and depopulation by encouraging rural tourism and industry and promoting rural revitalization and sustainable rural development [13]. Rural development is the common goal of the world, an important aspect of which is scientific rural spatial planning. The loss of the rural population in the process of industrialization and urbanization is a consequence of social development. Rural areas with different natural, social, and economic conditions have different levels of RPL and different spatial characteristics. Low mountainous and hilly areas have poor natural conditions and primitive social economies, which may be the root cause of rural depopulation. At the same time, geographical location is also one of the important reasons for rural population loss. Spatial analysis is a general term for methods of analyzing spatial data. It is driven by geospatial data and uses various mathematical means to emphasize the discovery of the distribution of spatial data. It is used to calculate the relationship between geographical elements and quantitatively describe the spatial pattern and can be used to solve practical geospatial problems. Therefore, spatial analysis is required to explain why this trend happens and how to curb it, which is crucial to spatial planning in rural areas. To be more specific, there is a direct need to explore how emigration is spatially distributed and what factors can explain it, which would be conducive to addressing these challenges. With the help of powerful spatial analysis methods, it is necessary to deeply study the spatial distribution, cold and hotspots, influencing factors, and spatial interaction of rural population loss. It has important scientific value for achieving comprehensive, in-depth, quantitative, and spatial visualization to help reveal the mechanisms of rural population loss. It also has important application value for scientifically carrying out rural spatial planning and promoting rural development and urban–rural integration.

2. Literature Review and Theoretical Framework

Human migration is a universal law of development in human society. Different countries have produced different studies on population migration. For instance, the United States is a country that has experienced many waves of immigration. However, in recent years, the migration rate within the United States has shown a downward trend. The reason for this phenomenon is that the influence of non-economic factors is now greater than that of economic factors [14]. Li et al. present an empirical analysis of population migration between American states and found that the human and natural environments and other non-economic factors had greater impacts on promoting population flow than economic factors [15]. These non-economic factors include health and quality of life, air pollution, and climate change [16,17]. Due to political instability, the population of North Africa flowed into Europe [18]. Through the study of long-term and short-term population mobility in European countries (e.g., Greece), other scholars have determined that the spatial mobility of populations increasingly depends on the internal characteristics of the local environment and that the local socioeconomic conditions affect the direction and intensity of population mobility [19,20]. In particular, a reduction in the rural population has a huge impact on the relationship between humans and the natural environment, which then affects the sustainable development of rural areas [21]. At the same time, climate-related natural disasters are triggered by environmental change, resulting in long-term population mobility or urban–rural mobility in the rural areas of Bangladesh [22,23]. In fact, climate change has become the main driving force of population migration in Bangladesh [24]. Population mobility patterns in rural areas of sub-Saharan Africa (Namibia, Kenya, Burkina Faso, and Zambia) are mainly affected by geographical, sociodemographic, and infrastructure differences [25]. To sum up, countries all over the world have carried out research on population mobility. The research scale ranges from international to urban and rural. At the same time, it was found that the driving factors affecting population emigration were natural disasters, political instability, climate conditions, social population, and infrastructure. Population emigration in different countries has a common feature. Developed countries with relatively balanced development have less population mobility, while developing countries with large differences in development conditions have more population mobility. Emigration usually occurs from areas with serious natural disasters, air pollution, political instability, and imperfect social infrastructure to areas with better conditions. Compared with cities, rural areas are relatively backward. In the coming years, research on rural population emigration will become an important topic all over the world.
In China it can be seen when combing the relevant literature that the research on population loss mainly focuses on the spatial distribution of population flow [26,27], the willingness of the population to stay [28], the fractal characteristics of the population flow [29], the mechanism effect between rural population flow and sustainable development [30], the integration of population flow and urbanization [31], the spatial difference and driving force of rural population change [32], population hollowing [33], etc. Other studies have discussed the inter-provincial migration of the rural population in China in detail based on qualitative analysis [34]. Through empirical research on the health effects of rural population migration from rural to urban areas, it was found that rural–urban migration can improve the health level of the rural outflow population [35], and the causes, effects, and countermeasures of population loss have been discussed [36,37,38]. In addition, some scholars try to explain the urban contraction phenomenon of population loss and spatial expansion through calculating the population loss and spatial expansion index [39]. The above research helps to deepen our understanding of the current situation, as well as the spatial distribution of the rural population. However, there are few targeted quantitative discussions on the spatial characteristics and impact mechanism of RPL in the abovementioned studies.
At present, relevant studies on rural population loss are most likely to focus on qualification evaluations from a macrocosmic view—intra-city, intra-provincial, or intra-national, thereby revealing the RPL [40]. There are also individual studies based on the township scale [41]. By analyzing the evolution patterns of population loss [42] and the spatial pattern and driving factors of rural population migration in China [43], it was found that rural population outflow has significantly exacerbated the aging of the rural population [44]. However, it is still unclear what influence this is having on the spatial structure of population emigration. Based on system theory, any geographic phenomenon is the result of interactions between multiple factors, both external and internal. The village, as the minimum unit, is the basis of agricultural production and human livelihood. Population decrease is occurring here and has a much stronger reaction to spatial heterogeneity than county or city. Regrettably, research at the village level is rare. Therefore, research on population loss at the village level, as a supplement to the research on population loss at the provincial, county, and town levels, is indispensable, and the small-scale research taking the administrative village as the unit needs to be strengthened.
Most research on the influencing factors of RPL focuses on the external attractions or factors affecting population loss, such as natural conditions, society, the economy, or infrastructure [45,46,47,48], and pay less attention to the impact of landscape ecological value factors. The ecological value of rural landscapes is not only an important part of rural ecological construction but also a major problem to be solved urgently to improve the quality of rural ecological environments, promote ecological rural construction, develop rural tourism and industry, improve living environments, and allow farmers to live and work in peace and contentment [49,50]. The spatial exploration analysis method was a model used to explore the characteristics and driving forces of spatial differentiation, mainly including spatial autocorrelation analysis and geographic detection. In recent years, it has been widely used in the analysis of the temporal and spatial changes and influencing factors of PM 2.5 [51], quantitative analysis of driving factors of soil and water loss [52], spatial distribution and influencing factors of tourism resources [53], the temporal and spatial evolution and driving factors of rural settlements [54], the temporal and spatial differences and driving factors of construction land [55], and in natural science and social sciences. The spatial scale is large for the country and small for the township and has achieved good application results.
Due to RPL in low mountainous and hilly areas and large spatial variation, research in this area needs to be strengthened, and this study took Laiyang County, Shandong Province as the research area and the administrative village as the unit. Based on land use data, socio-economic data, and field survey data, this study comprehensively used landscape analysis, spatial autocorrelation, and a geographic detector model to analyze the spatial characteristics of RPL (looking at factors such as high value, low value, and agglomeration), quantitatively explore the influencing factors (including single role and interaction of RPL), reveal the key influencing factors and mechanisms (in order to provide reference for the research on the spatial characteristics and influencing causes of RPL at a fine scale), and provide a theoretical basis for scientifically determining the path of rural development and formulating rural revitalization policies.
Population loss is the result of population migration. RPL is a phenomenon of local population reduction caused by the migration of the rural population from the locality to other places. With the acceleration of urbanization, the general trend of population migration has not changed. During the process of urbanization in many countries all over the world RPL has occurred—and it is leading to the decline of rural areas. If China wants to realize the integrated development of urban and rural areas, it needs to adhere to the new urbanization strategy of urban–rural integration and promote rural revitalization. The core of rural revitalization lies in people. Therefore, exploring the characteristics and influence mechanisms of rural population mobility is conducive to grasping the laws of rural and social development, promoting rural revitalization by classification, actively promoting urban–rural interaction, and realizing urban–rural integration.
In this context, we constructed a theoretical framework for RPL (Figure 1). The framework includes the following three perspectives: level of RPL, spatial characteristics of RPL, and driving factors. Firstly, to clarify the connotation of RPL, the rate of RPL was calculated on the three scales of county, town, and village, and the levels of RPL were obtained to judge the severity of RPL. Secondly, the distribution characteristics of RPL in space was analyzed to assess the distribution of different degrees of RPL in rural areas using hotspot analysis and spatial autocorrelation. Finally, considering the factors affecting RPL, we analyzed the influence intensity between various factors and the interaction intensity between them so as to judge the leading factors affecting RPL. Geographic detectors were used to screen the dominant factors at the village level, measure the action intensity, and detect the interaction mechanism of RPL.

3. Study Area and Data Sources
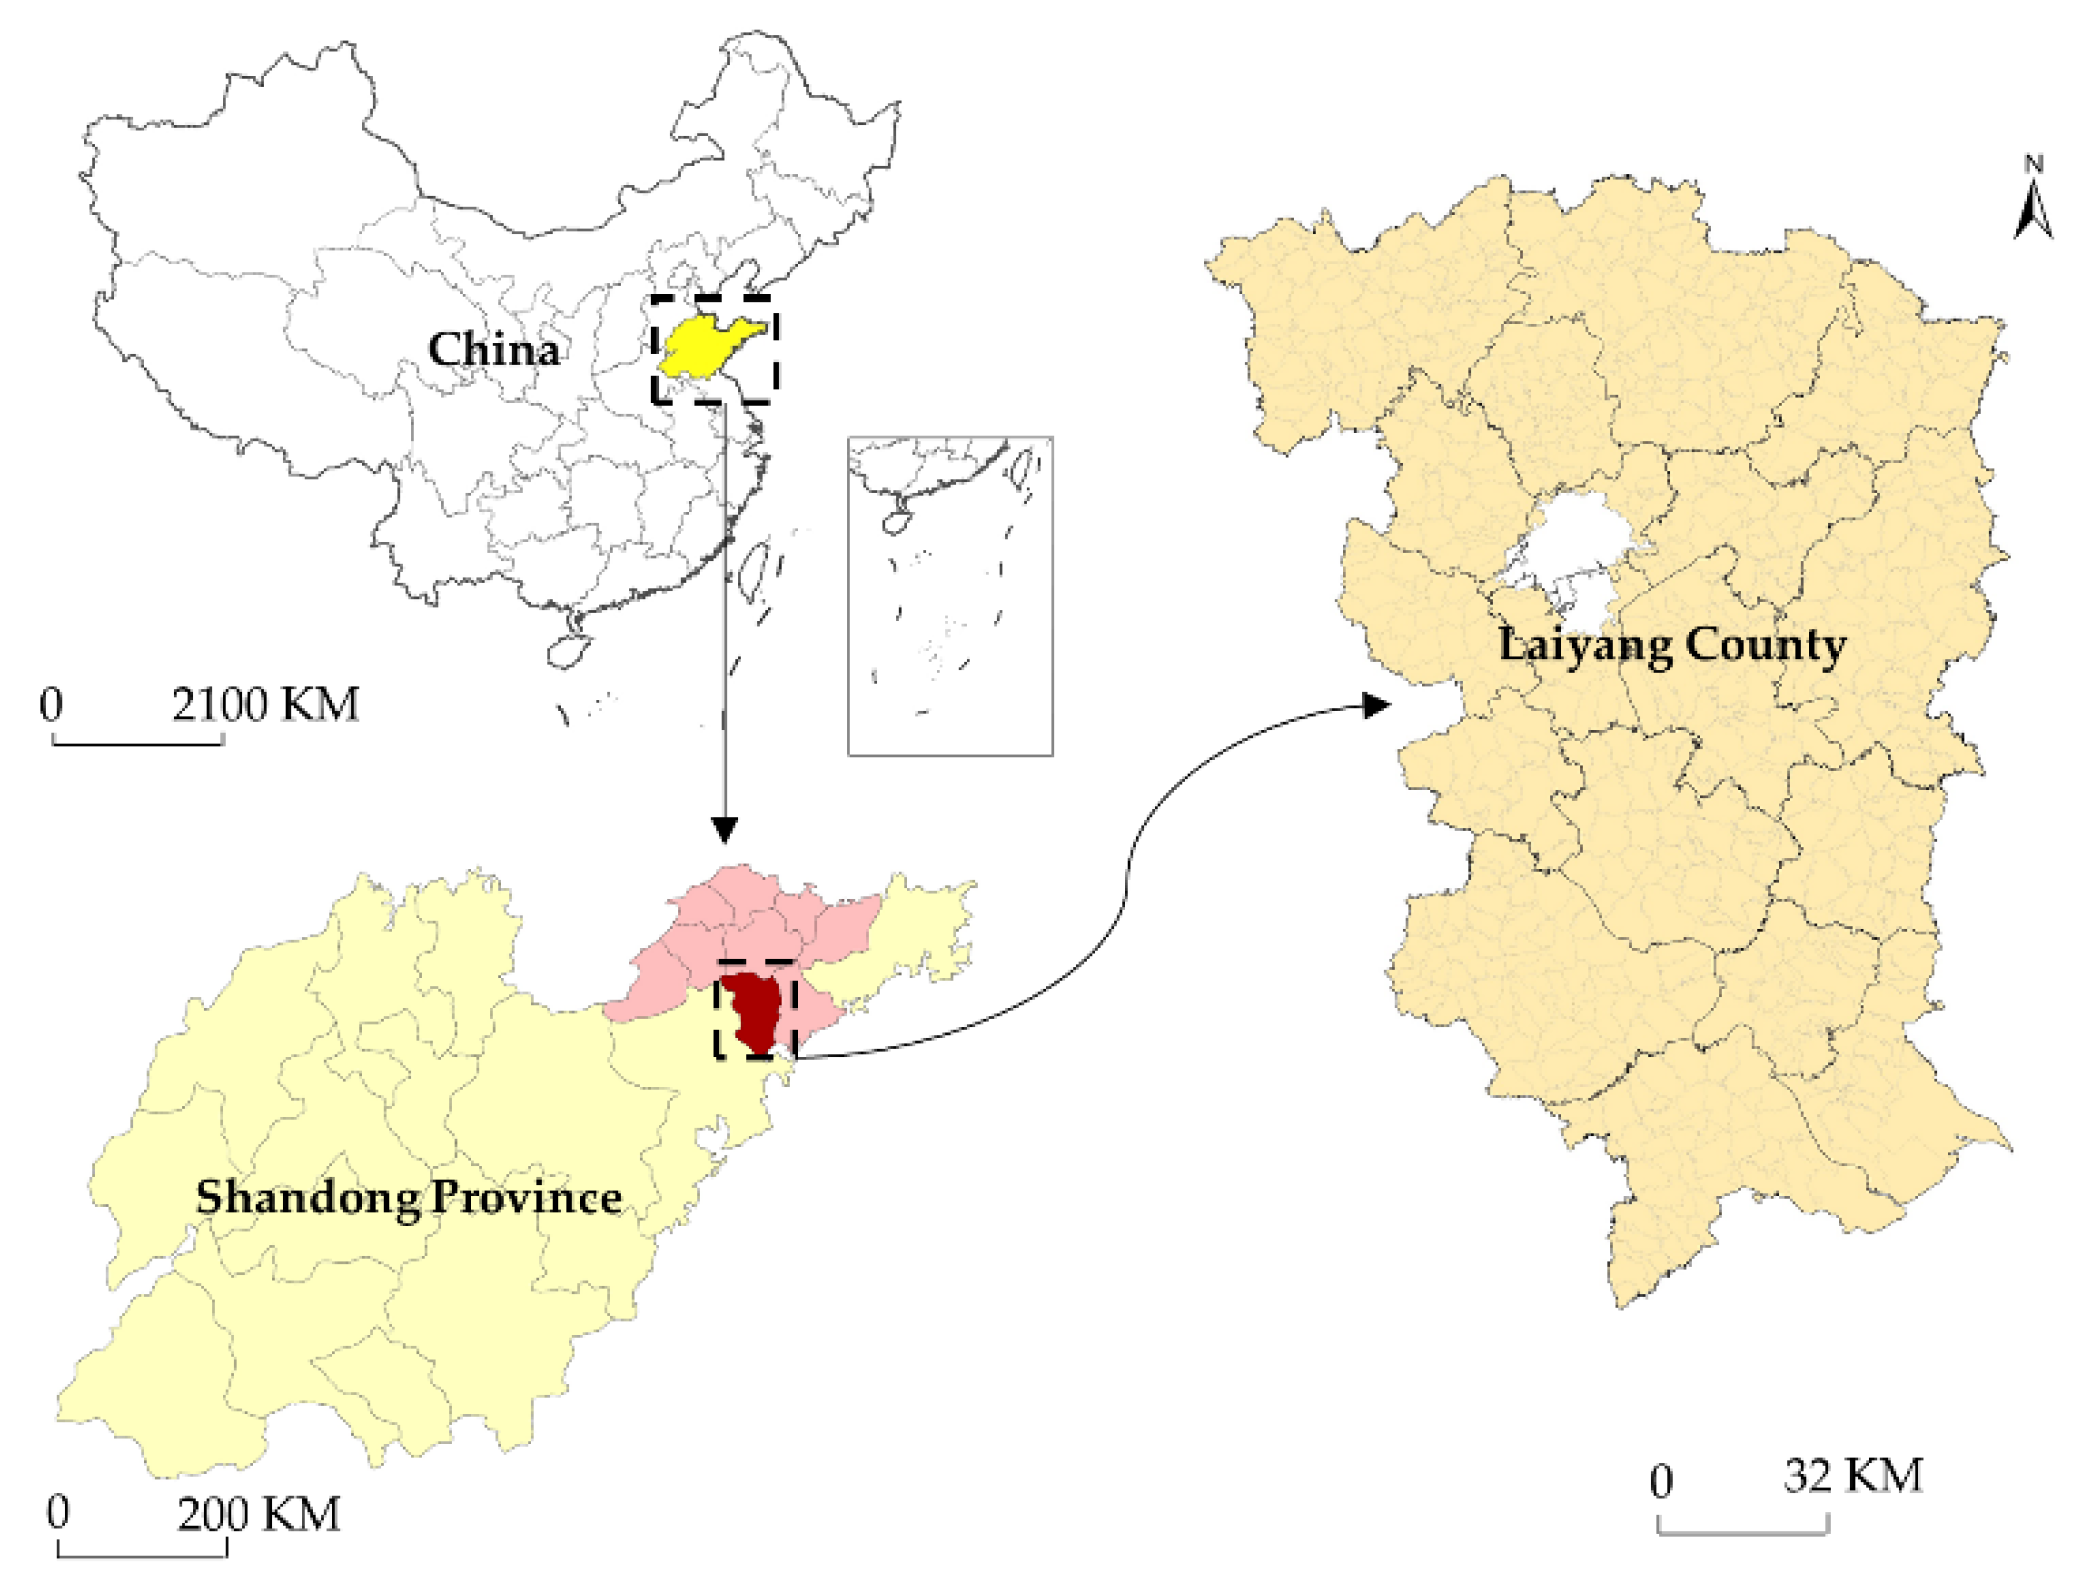
3.1. Study Area

Laiyang County (120°31′06″–120°59′12″ E, 36°34′25″–37°09′46″ N) is located in the east of Shandong province, eastern China (Figure 2). It is a hilly area with a maximum elevation of 375 m. The terrain slopes from north to south. The land area comprises 68.7% low-mountainous and hilly and 31.3% flat surface. It is a hub node in the Qingdao–Yantai–Weihai metropolitan area and an ecologically viable and healthy county. It is rich in mineral resources, among which the reserves of bentonite and zeolite rank second in the province. It is known as the hometown of Chinese pears, Chinese dinosaurs, calligraphy, and peanut oil. Laiyang County enjoys a favorable geographical position, outstanding location advantages, and abundant resources. The study area contains 18 towns (784 villages) with a total population of 871,600, of which the permanent population was 856,800 in 2018. It has an area of 1732 km2, of which the cultivated land comprises 830 km2. In 2018, the GDP was 43.84 billion CNY, the per capita disposable income of residents was 27,654 CNY, and the economy was relatively developed.
Laiyang County is relatively developed in terms of agriculture. In 2018, the total output value of agriculture, forestry, animal husbandry, and fisheries was 9.89 billion CNY, of which the agricultural output value was 5.08 billion CNY. It mainly grows wheat, corn, peanuts, and other crops. In 2018, the sown area of crops was 99,000 hectares and the agricultural power consumption was 48.7 million kwh. The registered population in rural areas was 488,400. Due to urbanization, a large number of farmers have transferred jobs and moved into towns, leaving fewer and fewer rural residents and more RPL. Laiyang County is committed to building a model for the Jiaodong Peninsula’s rural revitalization, and RPL has become a key issue affecting the integrated development of urban and rural areas. Since ten villages were villages-within-cities, they were not within the scope of this study. Therefore, Laiyang County was selected as the study area, and 774 villages were identified as the research objects.

3.2. Data Source

We obtained slope and elevation data from the geospatial data cloud of the Chinese Academy of Sciences. We collected remote sensing images of Laiyang County’s geographical national conditions survey 5–6 in 2019, land use change data in 2018, and a geological disaster prevention map of Laiyang County from the Laiyang Natural Resources and Planning Bureau. We further collected demographic and socioeconomic data from the Laiyang Bureau of Statistics, the Statistical Yearbook of Laiyang County, Social and Economic Statistical Bulletin of Laiyang County, and a field questionnaire. Luojia1-01 nighttime light images, which were taken from the Hubei data and application center of high-resolution earth observation system, were processed by ENVI 5.3 and ArcGIS 10.7. Landscape ecological data, including rural land use data, were obtained from the Natural Resources and Planning Bureau. The ecosystem service value was obtained by referring to the value equivalent factor method [56], while other landscape ecological indicators were calculated by FRAGSTATS.

4. Methodology

4.1. Rate of RPL

Population loss refers to the phenomenon whereby local residents move to other places and thus the local population is decreased [57]. The D-value between the permanent population and the registered resident population can be used to measure the level of RPL. If the resident population is less than the registered resident population, this means a net loss. Otherwise, there may be no net loss of population, that is the inflow of a migrant population. In this study, the RPL was used to measure its level, which is shown in Formula 1. If the resident population is equal to or larger than the registered resident population, the population will incur no loss and the population loss rate will be 0. On the contrary, the rate of RPL is the D-value between the registered resident population and the permanent resident population, which accounts for the percentage of registered resident population.
P j = {                   0 ,         T j     R j R j T j T j × 100 ,         T j     R j
where Pj represents the RPL of the administrative region (county, town, or village) j; Rj indicates the registered resident population in the administrative area j, and Tj indicates the resident population in the administrative region j. The population loss rate is between 0 and 100. The greater the value, the more serious the level of RPL. Using the uniform distribution method, the level of RPL is divided into five levels: none, low, medium, superior, and high (Table 1).

4.2. Spatial Characteristics of RPL

4.2.1. Hotspot Analysis

Hotspot analysis is a clustering distribution mapping tool that is used to identify the spatial clustering of high value (hotspot) and low value (cold spot) elements with statistical significance, expressed by Getis-Ord Gi* statistics. This study used hotspot analysis to analyze the spatial clustering position of high-value and low-value elements of RPL and explore the cold–hotspot pattern of the population loss distribution. The calculation formula is as follows:
G i * = j = 1 t W i j X j x ¯ j = 1 t W i j [ t j = 1 t W i j 2 ( j = 1 t W i j ) 2 ] ( t   1 ) s
where Xj is the value of the spatial unit j, Wij represents the spatial weight between spatial units i and j (adjacent is 1, non-adjacent is 0), t is the number of spatial units,   x ¯ is the mean value, and S is the standard deviation. Gi* statistics are Z values. When the Z value is positive, the higher the Z value the closer the clustering of high values (hotspots). When the Z value is negative, the lower the Z value the closer the clustering of low values (cold spots).

4.2.2. Spatial Autocorrelation Analysis

Spatial autocorrelation is divided into global and local spatial autocorrelation, which is mainly used to reflect the overall trend of spatial autocorrelation and the degree of difference in local space [58]. Global spatial autocorrelation is applied to judge whether spatial phenomena have aggregation characteristics, and the index is the Moran I index. Local autocorrelation is used to reflect the correlation between agglomeration spatial units and adjacent units, and the index is the Moran Ii index. Firstly, this study makes a global spatial autocorrelation analysis of the RPL in Laiyang County to judge whether it has agglomeration in space. If there is agglomeration, then we conduct local spatial autocorrelation to judge the correlation between the RPL of a village and the population loss of adjacent villages and then analyze its significance. The calculation formula of the Moran index is shown in Equations (3) and (4):
I = i = 1 n j = 1 n w i j ( x i x ¯ ) ( y i y ¯ ) S 2 i = 1 n j = 1 n w i j
I i = ( x i x ¯ ) S 2 j w i j ( x j x ¯ )
where I is the global Moran’s I index, Ii is the local Moran’s I index, n is the number of villages, xi and xj represent the population loss rate of villages i and j, x ¯ is the mean value of RPL, S2 is the mean square deviation, and Wij represents the proximity relationship between villages i and j. The value range of I is [−1,1] where greater than 0 indicates a positive spatial correlation, showing an agglomeration trend; equal to 0 indicates no spatial correlation and a random distribution; and less than 0 indicates a negative spatial correlation, showing a discrete situation. The value range of Ii is [−1,1] where greater than 0 indicates homogeneous agglomeration (HH indicates that the rate of RPL of this village and surrounding villages is high; LL indicates that the rate of RPL of this village and surrounding villages is low, and the two agglomeration types are positively correlated); equal to 0 indicates that spatial agglomeration is not significant; and less than 0 indicates heterogeneous agglomeration (LH indicates that the rate of RPL of the village is low, but the rate of RPL of the surrounding villages is high; HL is the opposite, and the two types are negatively correlated).

4.3. Driving Force Model of Influencing Factors

4.3.1. Index Selection and Quantification

The loss of rural population is affected by many factors, such as natural conditions, the economy, society, ecology, etc. The production and life of the rural population shall be based on the natural environmental conditions of villages. In areas with flat terrain, rich resources, a superior traffic situation, good economic development, and ecological security, the more convenient the production and life in the villages the larger the population is and the lower the RPL will be [59]. If the villages have poor natural conditions and ecological environment quality, scarce resources, inconvenient transportation, imperfect infrastructure, and limited development they are not suitable for production and life. There will be more population loss, and the villages will gradually decline or even go extinct.
Natural conditions include slope, elevation, and geological disasters. First, within a certain range, the smaller the slope and elevation, the more convenient people’s production and life and the less the population loss will be. The more prone geological disasters are, the more unsafe people’s living environment and the greater population loss will be. Therefore, we chose slope (X1), elevation (X2), and geological hazards (X3) as the influencing factors of natural conditions.
Resource endowment mainly includes cultivated land resources, water resources and mineral resources. Firstly, cultivated land resources are measured in terms of quantity and quality. For rural areas, the majority of economic income is derived from agriculture, and cultivated land resources are our preferred main resource factor. The more cultivated land farmers have, the better the quality and the better the benefits of the cultivated land. The study area is close to the Yellow Sea and contains many rivers, rich water, and mineral resources, which are conducive to people’s productivity and quality of life, meaning that we should expect to see relatively little population loss. Therefore, the four indicators of cultivated land quantity (X4), cultivated land quality (X5), water resources (X6), and mineral resources (X7) were selected as the influencing factors of resource endowment.
The traffic location mainly includes the distance between the village and the town center, the distance between the village and the county center, and the highest level of village travel road. A good traffic location is conducive to the flow of population and resources. The closer the village is to the county and town centers, the higher the travel road grade and the more conducive it is to travel. The more vulnerable the village is to the radiation of the county and town center, the more conducive it is to village development, and the lower the population loss will be. Therefore, the distance between the village and the town center (X8), the distance between the village and the county center (X9), and the highest level of village travel road (X10) were selected as the influencing factors of traffic location.
The cluster scale includes village economy and village area. The cluster scale is the symbol of rural development level. The higher the collective economic income and the economic level of farmers, the larger the village area, the higher the village development level, and the lower the population loss. Therefore, collective economic income (X11), farmers’ economic level (X12), and village area (X13) were selected as the influencing factors of agglomeration scale.
Basic facilities include public service facilities and infrastructure. It is mainly reflected in the village’s education, medical treatment, road hardening, and water supply conditions. The better the infrastructure, the more comfortable people’s lives and the lower the population loss. Therefore, the distance between the nearest hospital and the village committee (X14), the distance between the nearest primary school and the village committee (X15), the distance between the nearest junior middle school and the village committee (X16), water supply grade (X17), and village road hardening rate (X18) were selected as the influencing factors of basic facilities.
Landscape ecology includes ecological service value (ESV), landscape shape index (LSI), landscape combination index (COHESION), and aggregation index (AI). Landscape ecology is an important index of rural ecological construction. The higher the value of ecological services is, the better the development of villages and the lower the population loss. The larger the landscape shape index, the more irregular the village and the greater the population loss. The larger the landscape integration index, the stronger the connectivity between the patches in the village, the more concentrated the patch distribution, and the lower the population loss. The larger the aggregation index, the higher the aggregation degree between patches and the lower the population loss. Therefore, ecological service value (X19), landscape shape index (X20), landscape combination index (X21), and aggregation index (X22) are selected as the influencing factors of landscape ecology.
Therefore, in order to comprehensively analyze the spatial characteristics and driving factors of RPL in Laiyang County, based on the scientific, representative, and quantifiable principles of index selection, taking 774 administrative villages in Laiyang County as our research units, from the aspects of natural conditions, resource endowment, traffic location, and the agglomeration scale [60,61], 22 indicators were selected belonging to six categories of infrastructure and landscape ecology as the driving factors to detect spatial differentiation of RPL (Table 2).

4.3.2. Geographic Detector

Geographic detector is a tool for detecting spatial differentiation, including four detectors: factor detection, interaction detection, risk detection, and ecological detection [70]. Factor detection is used to detect the degree of spatial differentiation of a factor explanatory dependent variable. The factor detection is to evaluate the impact of each factor on RPL by calculating the q value. The larger the q value, the greater the impact of this factor on the RPL. The calculation formula is as follows:
q = 1 h = 1 L N h σ h 2 N σ 2
where h = 1,…, L is the classification of the rate of RPL (P) or factor X; Nh and N are the number of villages in category h and Laiyang County, respectively; and σ h 2 and σ 2 are the variance of the rate of RPL (P) of category h and Laiyang County, respectively. The value range of q is [0,1]. The larger the value, the more obvious the spatial differentiation of P. Interaction detection is used to identify the interaction between different risk factors. This paper uses interaction detection to explain the impact on RPL from two aspects: the interaction between two factors and the sum of the interaction of individual factors. Firstly, the q values of two factors on the rate of RPL are calculated as q (A) and q (B). Then, the interactive q value, q (A∩B), is calculated and compared to q (A) and q (B). The specific interaction types are shown in Table 3:

5. Results

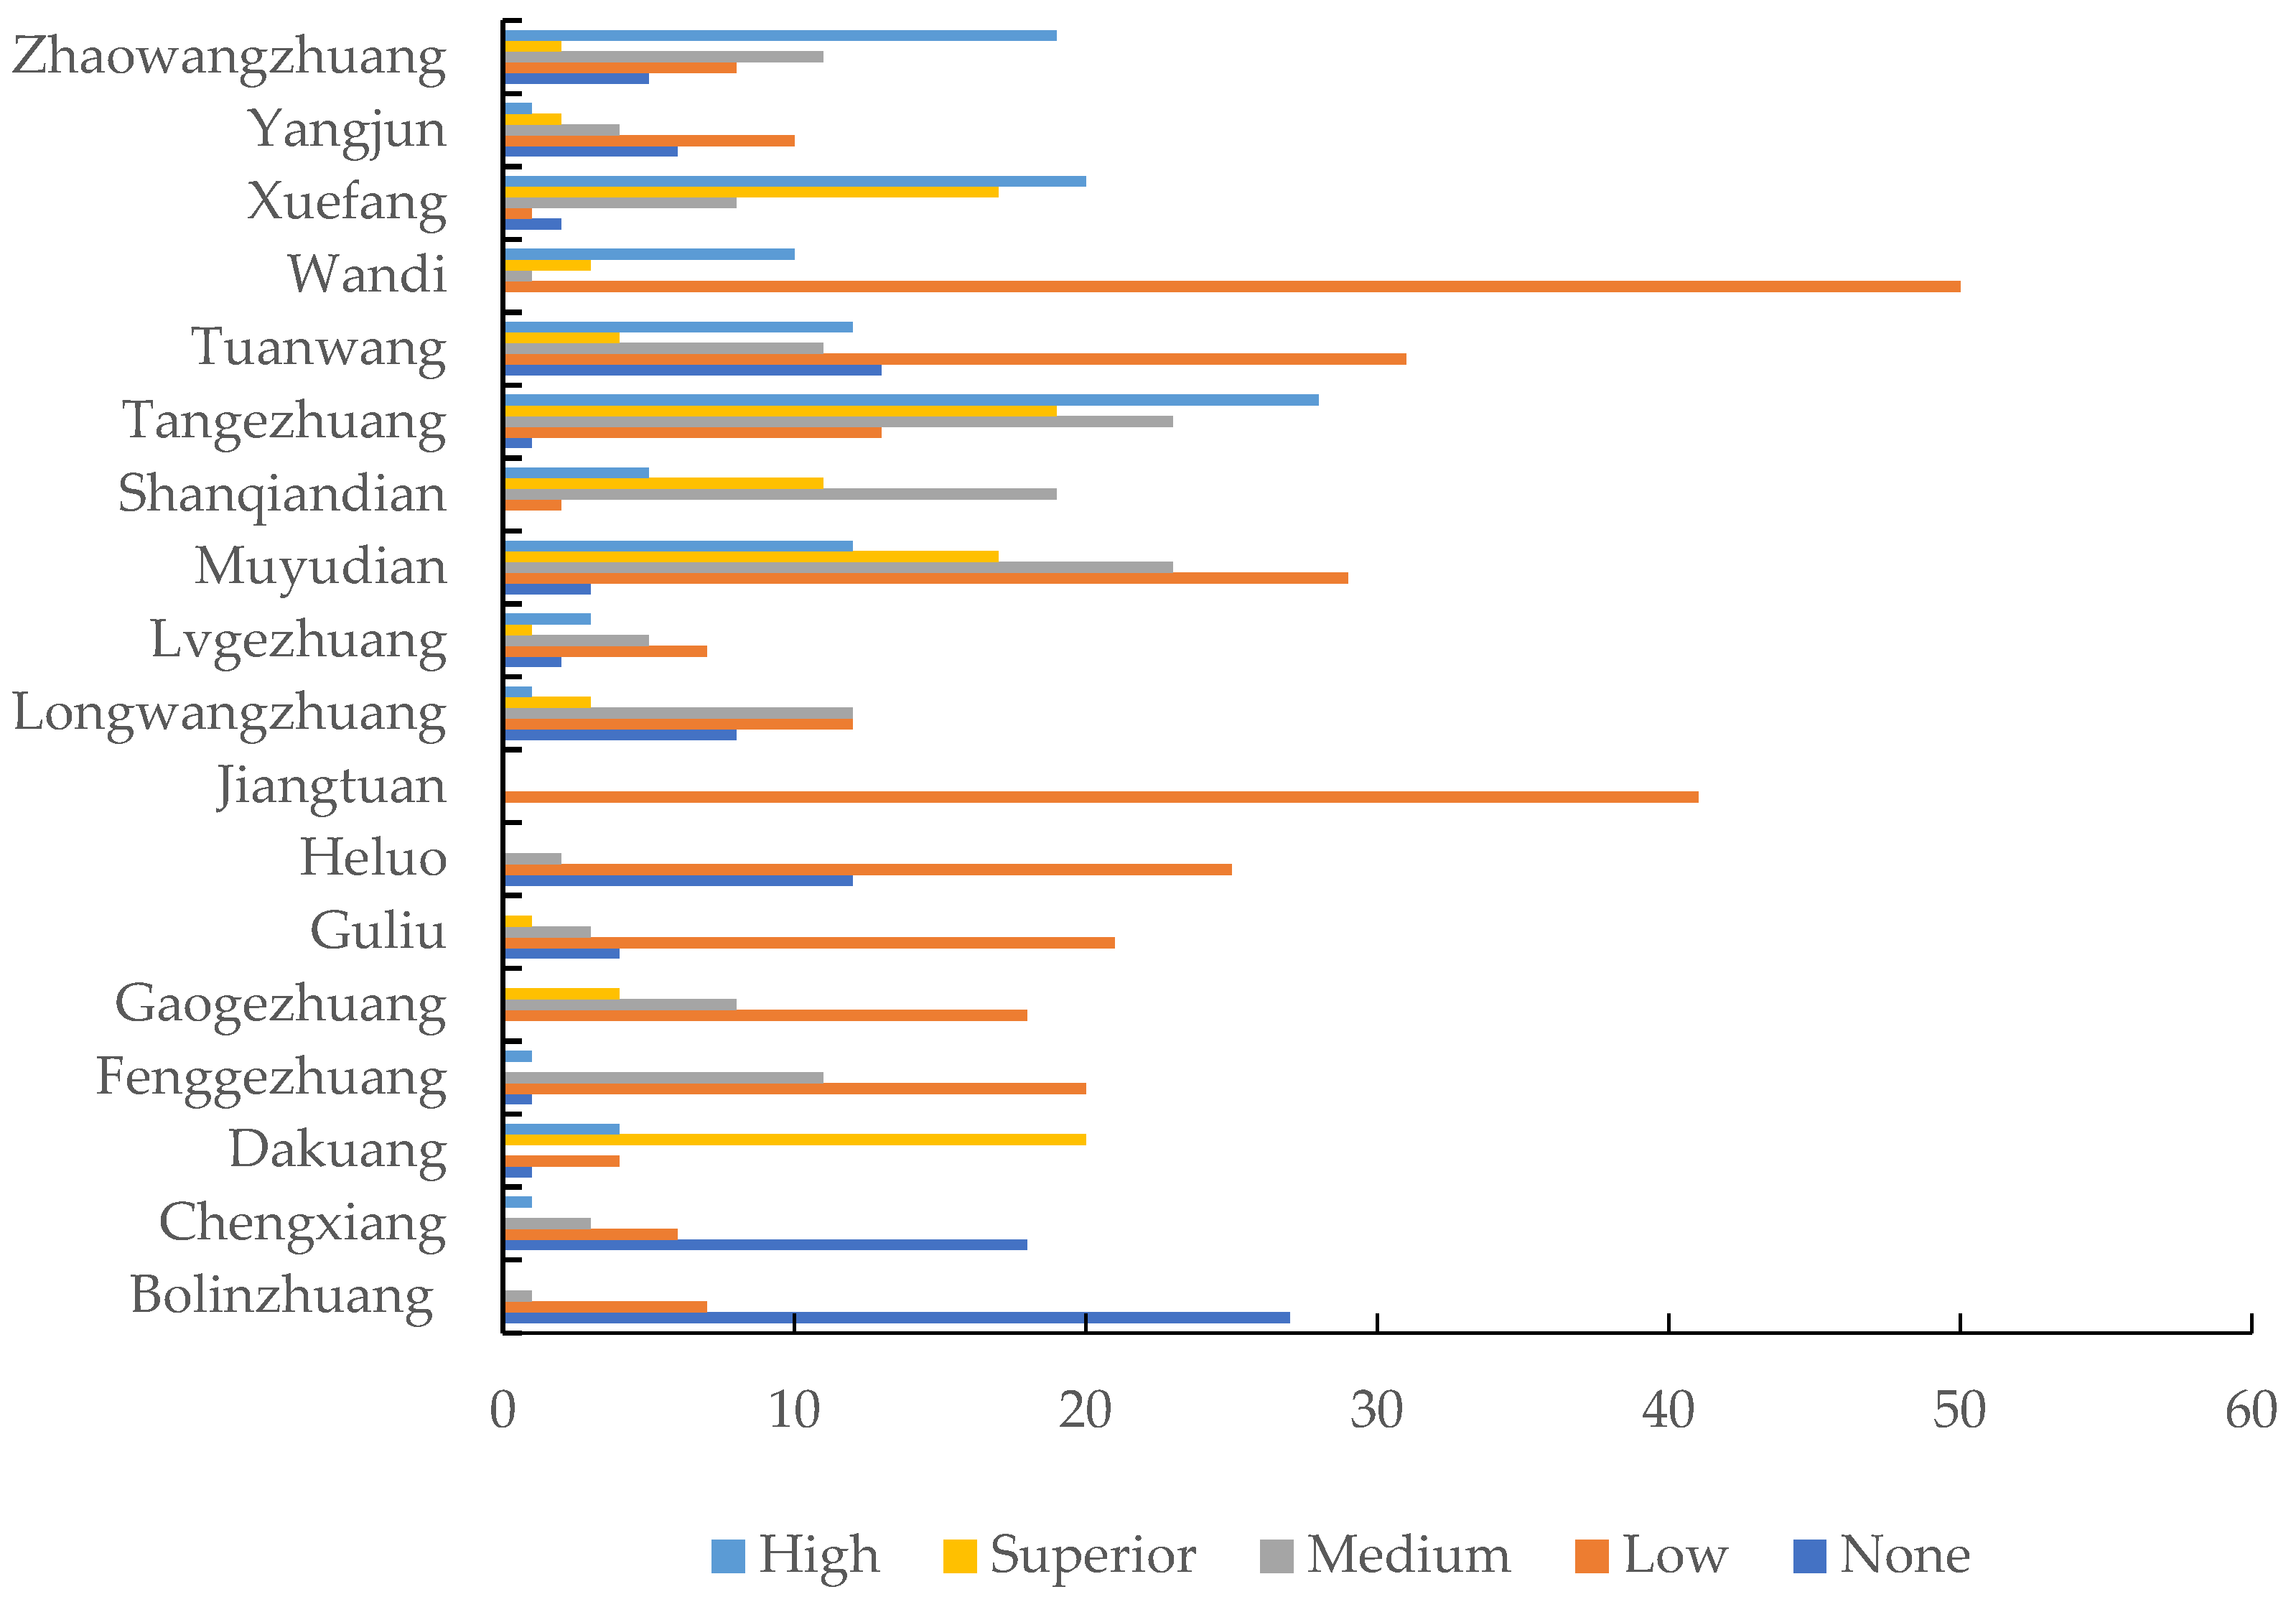
5.1. Analysis on the Level of RPL

The rate of RPL in Laiyang County was 1.7%, and that of the whole rural population was 1.9%, which was a low level on the whole. The former suggests that there was no massive rural emigration; in other words, it was internal population flow happening within Laiyang County. The latter was higher but not by much, which may indicate that the internal flow happened between rural and urban areas. At the town level, the rate of RPL ranged from 0 to 12.03%. Among them, there was no loss of rural population in Chengxiang, Bailinzhuang, and others where urban areas were located. The rate of RPL in Jiangtuan, Wandi, and other towns were at a low level. Muyudian, Shanqiandian, and other towns were at a medium level. The towns far from the urban area and with poor natural conditions, such as Tangezhuang and Xuefang, had a superior level, which reached 12.03%. By comparing the difference in RPL with rural and urban populations, the migration flow can be inferred by unidirectional depopulation. Therefore, we can draw the conclusion that the RPL in Laiyang County was mainly caused by internal flow between urban and rural areas.
In addition, in the selection of research objects, only areas other than the central village near the urban area were considered the research objects, and the villages in each town were not considered separately. This is one of the reasons for the low level of RPL in Laiyang County. At the village level, the rate of RPL ranged from 0 to 56%. Among them, the rate of RPL in Heshangou Village was as high as 56%, while some villages in Bailinzhuang and Chengxiang exhibited no loss. There were great differences between villages. The villages with a low level of RPL were the most common, accounting for 39.41%. The second was the villages with a medium level of RPL, accounting for 18.73%. The villages with none, a superior level, and a high level of RPL were relatively balanced, accounting for 13.31%, 13.44%, and 15.12%, respectively. Laiyang County is a low mountain and hilly landform with high terrain in the north and low terrain in the south. Unstable natural conditions, unbalanced resource distribution, and restricted traffic have directly affected the development of villages and have induced population loss. The villages with a superior level of RPL were mainly distributed in Tangezhuang, Muyudian, Xuefang, and other towns. However, these villages had large topographic fluctuations, were far away from urban areas, had a relatively low level of economic development, and experienced serious population loss (Table 4 and Figure 3).
To sum up, the rate of RPL in Laiyang was low on the whole but the RPL between cities and villages, towns and streets, and villages and villages were unbalanced. The population flow in Laiyang County mainly occurred between urban and rural areas.

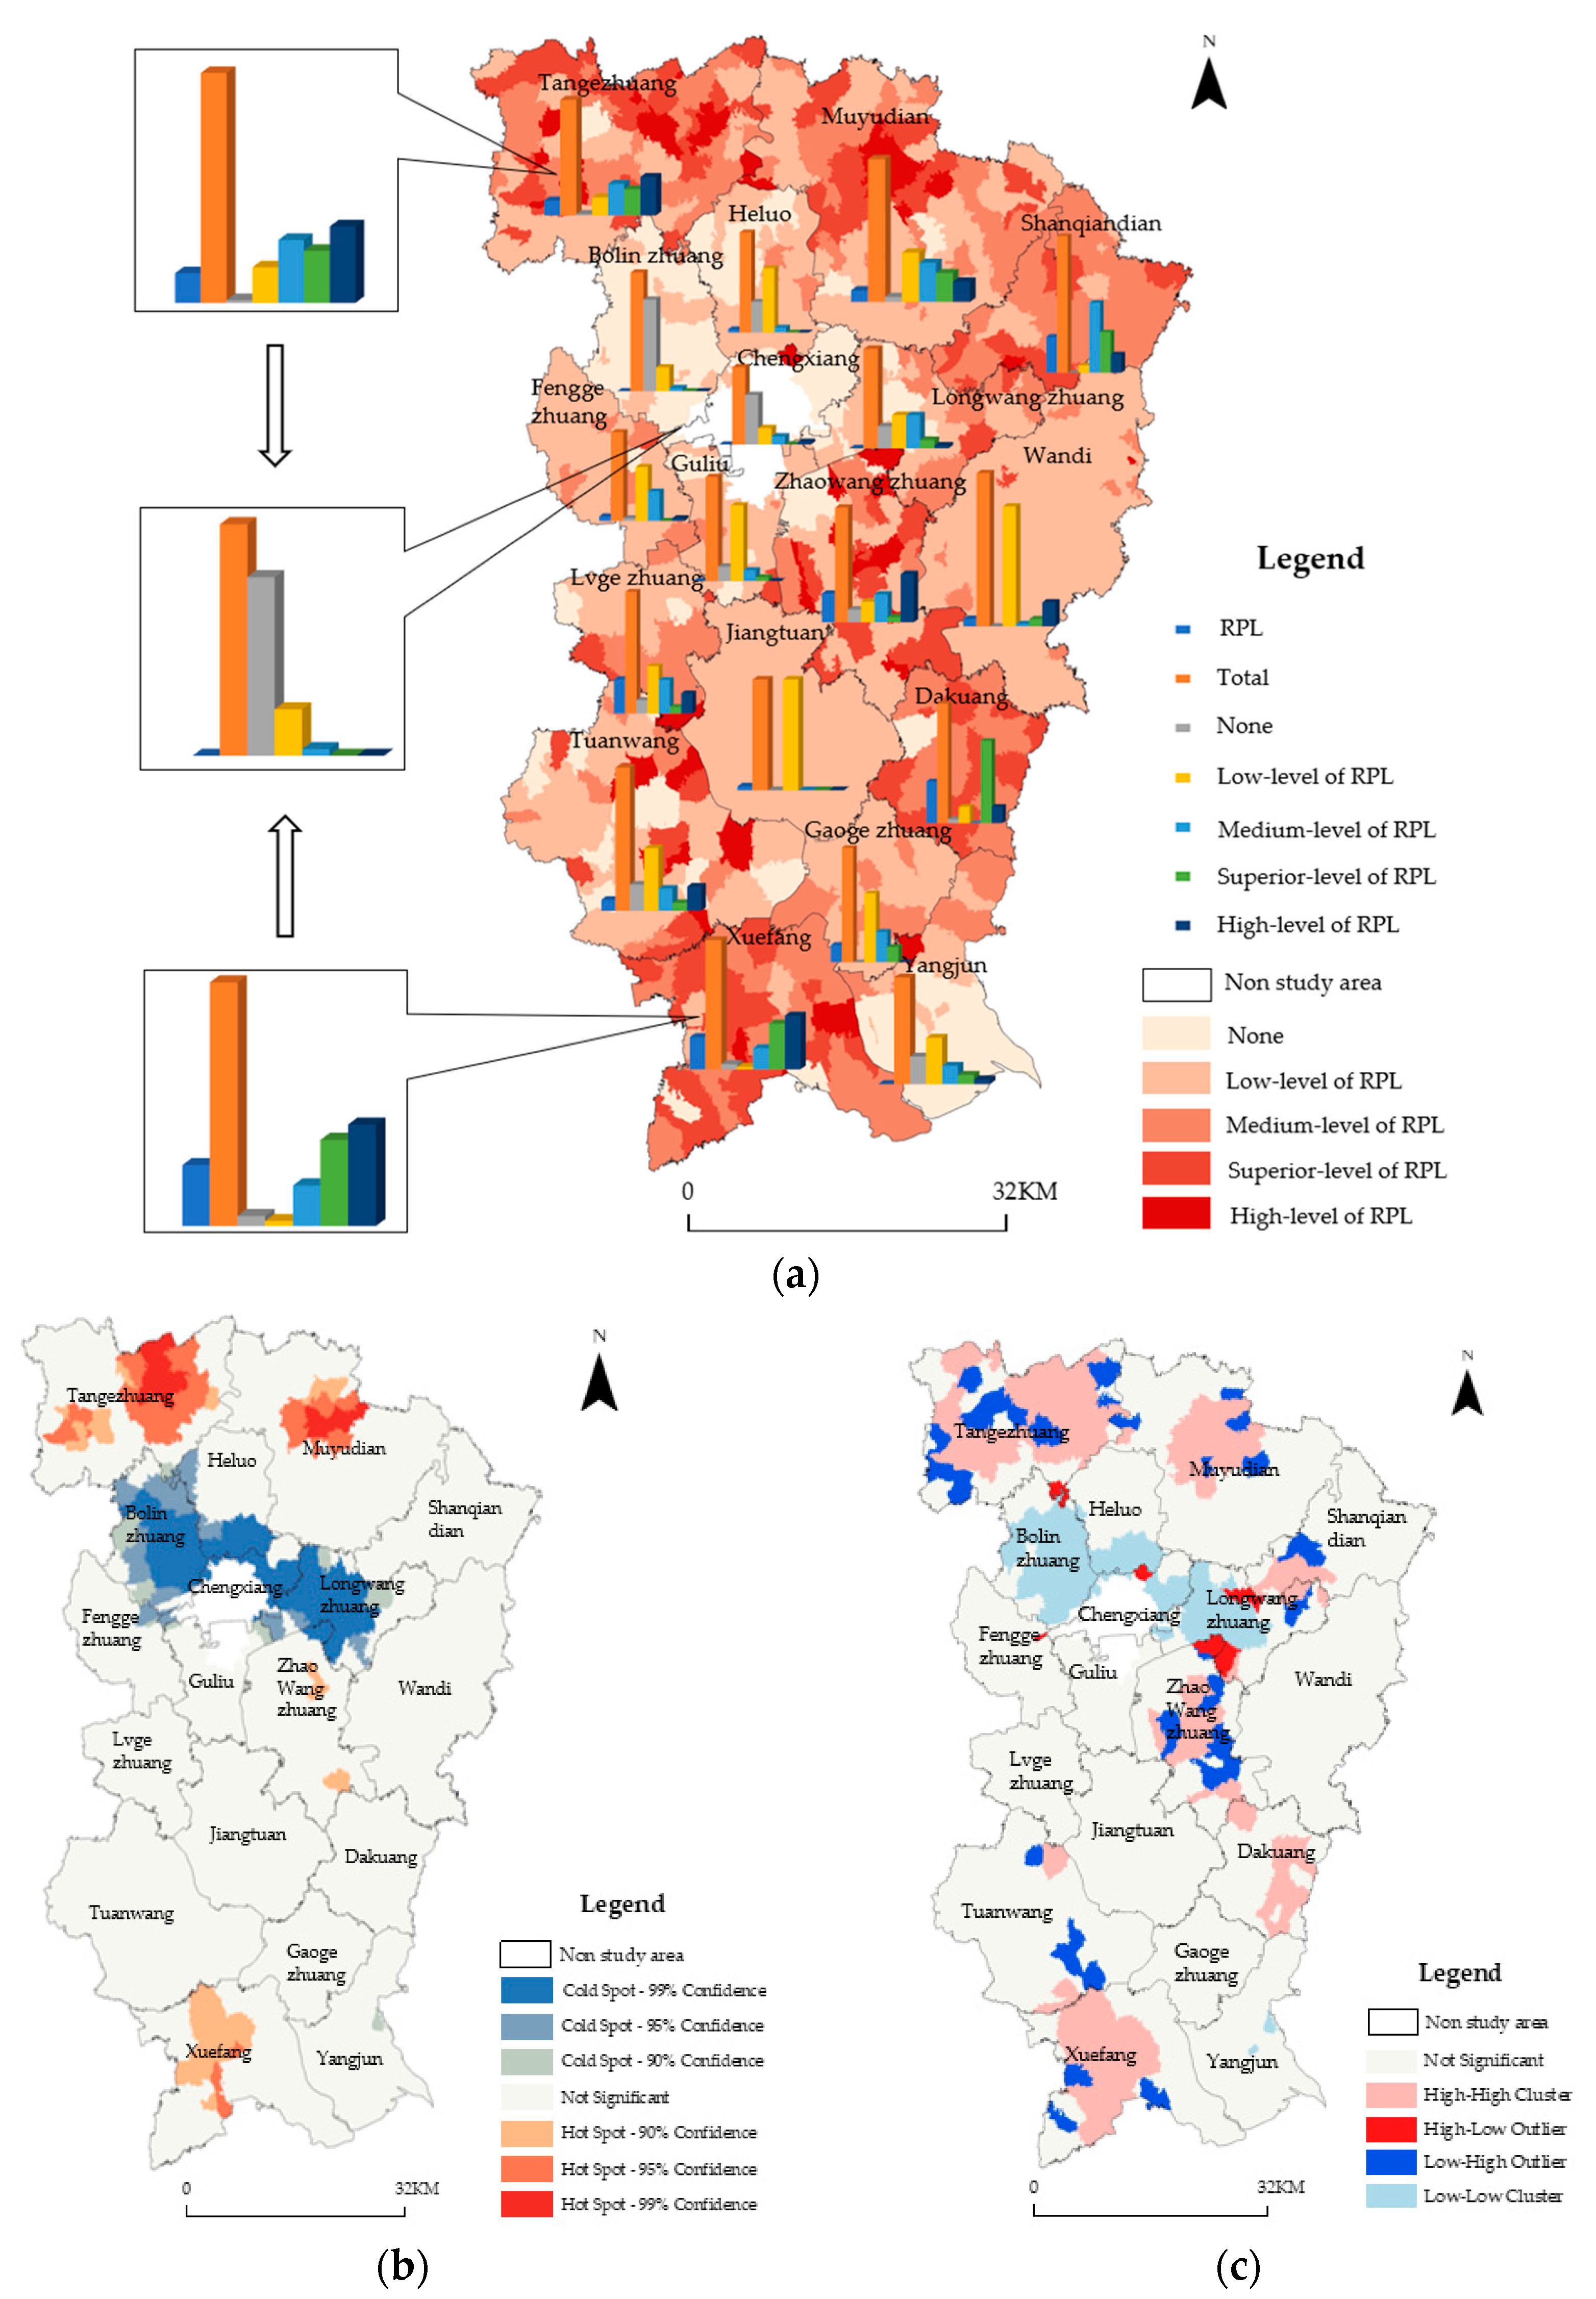
5.2. Analysis on Spatial Characteristics of RPL

The RPL in Laiyang County generally presents the overall characteristics of low in the central urban area and high in the northern and southern areas (Figure 4a). Areas with high and superior levels of RPL were concentrated in the villages of Tangezhuang, Muyudian, Xuefang, Dakuang, and other towns. The areas with medium RPL levels were mainly distributed in the villages of Tuanwang, Lvgezhuang, Wandi, Jiangtuan, Gaogezhuang, and other towns. Areas with no and low levels of RPL were mainly centered around the streets near the central urban area and the villages of Yangjun. From the central urban area to the northern and southern areas, we can see that the distance from rural to county and collective economic income were closely related to the loss and differentiation of the rural population.
It can be seen that the hotspots of RPL in Laiyang County (Figure 4b) were scattered and the degree of agglomeration was low. Hotspots were mainly distributed in Tangezhuang and Muyudian with high altitude in the north and relatively inconvenient production and life, as well as the villages of Xuefang, which was far away from the central urban area in the South and driven by the radiation of the central urban area. The difference between natural conditions and traffic location conditions was the main reason for this phenomenon. The cold spot area was mainly distributed in the villages of the streets around the central urban areas such as Bolinzhuang and Longwangzhuang. As some villages were greatly affected by the radiation of the central urban area and had developed economies, they were more suitable for the survival and development of the population and became cold spots for population loss.
The global Moran’s I index of RPL in Laiyang County was 0.2791 (p < 0.01). The significance test suggested that the spatial features of RPL showed global agglomeration and local high–low agglomeration (Figure. 4c). There were 42 villages that belonged to the HH cluster and they were basically consistent with high level RPL, superior level RPL, and hotspots, and were mainly distributed in the villages of Tangezhuang, Muyudian, Xuefang, Dakuang, and other towns. There were 57 villages belonging to the LL cluster, and they were consistent with the none, low-level, and cold spot area of RPL. It was mainly distributed in the villages of Bolinzhuang and Longwangzhuang near the central urban area. This area has superior natural conditions, convenient transportation, perfect infrastructure, prosperous economic development, and small local differences in the spatial distribution of population loss among villages. A few villages of HL and LH were scattered in the villages of Zhaowangzhuang, Tangezhuang, and other towns. To sum up, the villages with high level RPL, superior level RPL, and hotspots maintain good spatial consistency with HH, while the villages with no or low levels of RPL and cold spots are consistent with LL. The local spatial autocorrelation results better reflect the spatial agglomeration characteristics of RPL.

5.3. Analysis on Driving Factors of RPL

Factor detection was carried out with a geographic detector, and the results are shown in Table 5. In addition to infrastructure, the six factors of the other five dimensions were significant, indicating that the RPL was the result of the comprehensive action of many factors, such as natural conditions, resource endowment, traffic location, cluster scale, and landscape ecology. The p values of five factors (X4, X9, X11, X13, X2) were less than 0.01, which shows a significant impact, while the q value of x4 was the largest and has the strongest explanatory power, indicating that cultivated land safeguards for the survival of a rural population. In order to develop rural agriculture, we must have a certain number of cultivated land resources to meet the food problem of the population, and thus cultivated land resources are a key factor in population loss. The transportation location represented by X9 directly affects people’s travel distance and was a significant factor in RPL. The factor explanatory power of X11, X13, and X2 was relatively close, all between 0.047 and 0.066; the p value of X19 was less than 0.1, which passed the 10% significance level test. Therefore, these six indicators were considered the leading factors in the spatial change of RPL.
On the basis of single factor detection, the interaction detection of dominant factors was carried out and the results are shown in Table 6. The influence of two-factor interaction was greater than that of single factor independent interaction. The interaction between influencing factors can be divided into two types: two factors enhanced and nonlinear enhanced. There were no independent factors, and it was mainly nonlinear enhanced. From the perspective of interaction types, the interaction of two factors showed the effect of nonlinear enhancement. It can be seen that the effect of the superposition of the two factors on the spatial pattern of RPL was very significant. Among them, the interaction between X11 and other factors was more likely to show an enhancement effect, indicating that farmers’ living standards were higher in villages with better collective income conditions, which helps to stimulate rural economic vitality, and the economic development potential of the whole countryside was closely related to other aspects.
The explanatory power of two-factor interaction was reordered. The maximum explanatory power of the interaction between elevation and collective income was 0.4474, which was significantly greater than the sum of X2 (0.2283) and X11 (0.0960), indicating that the interaction and synergy between them has the closest relationship with population loss. This showed that the elevation condition was the primary factor in the production and life of rural populations. The lower the elevation, the more convenient the production and the more suitable the area is for the development of the rural population. Collective income was the driving force behind population production and quality of life. The more collective income was, the better rural development conditions and the more comfortable people’s lives were. When they had a synergistic effect, appropriate conditions more easily drove the development of villages.
According to the identification results of influencing factors, the formation of the spatial pattern of RPL in Laiyang County was not the result of the independent and direct action of six leading factors but the product of the enhanced effect formed by the interaction of different influencing factors under the comprehensive action of natural conditions, resource endowment, traffic location, cluster scale, and landscape ecology. Among them, there was a significant synergistic interaction between the natural conditions represented by X2 and the cluster scale factors represented by X11.
First of all, natural conditions are the basis for the survival of humans. Areas with better natural conditions, e.g., places with lower altitudes, lower gradients, or fewer geological disasters, are more suitable for population survival and rural development. For Laiyang County in low mountain and hilly areas, natural conditions are particularly vital. Villages with better natural conditions have better economic development at a larger scale, which makes it easier to attract people, meaning less population loss. For villages with poor natural conditions, it may not meet people’s survival needs, and more people will move out of such areas to places with low and flat terrains.
Secondly, the traffic location factor was the dynamic support for the survival of rural populations. The convenience of transportation determines population flow. Traffic location factors, such as the distance from the village to the county center, directly affect the travel range of the population, resulting in the spatial differentiation of population loss. The natural conditions were good, and the villages near the urban area and town residence had convenient transportation and more efficient exchange of population and resources. Remote villages, far away from urban areas, had poor natural conditions and extremely inconvenient transportation, which limits their communication with the outside.
Resource endowment and cluster scale were important for the survival and development of a rural population. In Shandong Province, as a major agricultural hub in China, agriculture is still the main source of rural income, so the income of cultivated land resources have been dominant. The quantity and quality of it directly affect the economic benefit intensity of cultivated land resources. Villages with obvious traffic location advantages, a developed economy, and a large area were more inclined to develop non-agricultural industries to drive the development of the village’s collective economy. The increase in farmers’ income was more attractive to the population and the population was more likely to gather in such areas.
Finally, landscape ecosystem was an effective predictor of the survival and development of a rural population. Ecology is an important supporting point for rural revitalization. A good landscape ecosystem plays a vital role in building an ecologically livable and beautiful countryside. The coordinated development of an ecologically livable and social economy is the key to promoting rural sustainable development. With the development of society and the economy and the improvement of urbanization level, production, and living conditions, people have higher requirements for human settlements. A good living environment attracts more people to live in concentrated communities.
Therefore, the formation of the spatial pattern of population loss was not the result of the independent action of various factors but the product of the combined action of natural conditions, resource endowment, traffic location, cluster scale, and landscape ecology. Villages with better natural conditions had obvious traffic location advantages, rich resources, large areas, good landscape living environments, and fairly good social and economic development, making them attractive to the population and decreasing RPL.

6. Discussions and Conclusions

6.1. Discussions

RPL is an important component of population geography and rural geography. There have been few studies on rural population loss during the process of urbanization, especially when quantifying the level of rural population loss on the different levels of counties, towns, and villages and exploring the spatial characteristics and impact mechanism of RPL. A rural population is easier to lose in areas with poor natural conditions and an underdeveloped social economy, so research on RPL should be carried out. Taking Laiyang County, a low mountainous and hilly area in eastern China, as our research area, this paper carried out research on RPL on the three spatial scales of county, town, and village; explored the spatial characteristics and action mechanisms; and enriched the theory of population geography and rural geography. At present, China’s social economy is developing, the process of urbanization is still accelerating, population mobility is strengthening, and RPL has become an inevitable consequence of this process. A large amount of the rural population flow into more economically developed areas due to poor natural conditions, inconvenient transportation, lack of resources, and backward economic development [71]. RPL is accompanied by population hollowing, abandonment of cultivated land, and rural decline [72]. In order to solve the problem of rural recession, China has put forward the national strategy of implementing rural revitalization, conforming to the law of village development and evolution trend, and promoting rural revitalization by classification. People are the main ingredient of rural revitalization. Research on the spatial characteristics and key influencing factors of RPL not only provides a basis for scientifically and reasonably dividing the types of village development but also provides ideas for solving the key problems of “rural hollowing”.
The path of rural revitalization should be based on the evolution trend of villages and the laws of population flow. The villages experiencing greater population loss in the study area had high terrain (which was not suitable for living), were far away from urban areas, and had underdeveloped economies. Such villages should adapt to the law of village development, merge with better developed towns and central villages, with full respect for the wishes of the villagers and integrate local economic development. For other lost villages, through the guidance and implementation of the rural revitalization strategy, policies can be used to give a “blood transfusion” to rural areas, stimulate rural vitality, and realize rural self-” hematopoiesis”. They should actively promote the development of various industrial chain clusters benefiting rural areas, provide a large number of jobs, and attract the rural population to return to the villages for further development.
RPL at different research scales needs the support of corresponding data. In our study, 22 indicators from the six aspects were preliminarily selected on the village level to detect the leading factors of RPL, but there was no significant factor detection related to infrastructure, which may be related to the relatively uniform nature of rural infrastructure in Laiyang County. In the future, on the basis of the further refinement of our research objectives, a more accurate definition of villages and a more perfect consideration of influencing factors should be considered and we should explore the spatial characteristics of RPL, fully tap the key influencing factors and driving mechanism of RPL, and then take relevant measures to promote rural revitalization according to the situation so as to provide good theoretical support for sustainable rural development.

6.2. Conclusions

The development of urbanization is accompanied by RPL, which is the result of the interaction of many factors. Taking a hilly region as our research area, this paper analyzed the level and spatial distribution of RPL, measured the spatial agglomeration characteristics of RPL through spatial autocorrelation analysis, used geographic detectors to identify the leading influencing factors of RPL, and deeply analyzed the action mechanism of each leading factor on the spatial pattern of RPL. The results can provide a practical reference for counties, cities, and districts in developing countries, especially in the low mountain and hilly areas of Shandong Province, which are implementing “hollow village” renovation and rural planning. The conclusions are as follows:
(1)
RPL in Laiyang was generally low, but RPL between cities and villages, towns and streets, and villages and villages were unbalanced. At the town level, the rate of RPL ranged from 0 to 12.03%. At the village level, the rate of RPL ranged from 0 to 56%. There were great differences between villages, which showed that there was internal population flow happening within Laiyang County. Additionally, the internal population flow mainly happened between rural and urban areas.
(2)
RPL in Laiyang County generally presented the overall characteristics of low in the center and high in the northern and southern areas. From the central urban area to the northern and southern areas, the distance from rural area to county center and collective economic income were closely related to the loss and differentiation of the rural population. The spatial features of RPL in Laiyang County showed agglomeration globally and high–low value agglomeration locally. The HH areas were basically the same as the high, superior level of RPL areas and hotspots of population loss. LL areas maintained spatial consistency with low RPL areas and cold spots of RPL.
(3)
The distance from village to county, elevation, quantity of cultivated land, collective economic income, village scale, and ecological service value were the leading factors affecting the RPL in Laiyang County. The spatial pattern of RPL in Laiyang County was not affected by a single factor. There was a nonlinear enhancement and mutual enhancement between two factors, which was the result of the joint action of multiple factors. Compared with its dominant factor, the interaction between collective income and elevation was the strongest.

Author Contributions

Conceptualization, A.W.; data analysis, Y.L.; investigation, Y.L., M.X., X.Z. (Xinghao Zhang) and B.S.; methodology, Y.L.; funding acquisition, A.W.; writing—original draft, Y.L., X.Z. (Xiaoqian Zhang) and A.W.; review and editing, Y.L., X.Z. (Xiaoqian Zhang) and A.W. All authors have read and agreed to the published version of the manuscript.

Funding

This research was funded by the National Social Science Fund of China, grant number (20&ZD090); Shandong Natural Science Foundation, grant number (ZR2019MD014); and Shandong Natural Science Foundation, grant number (ZR2013DM006).

Institutional Review Board Statement

Not applicable.

Informed Consent Statement

Not applicable.

Data Availability Statement

The data used to support the findings of this study are available from the corresponding author upon request.

Acknowledgments

The authors would like to thank the editors and reviewers for their helpful comments.

Conflicts of Interest

The authors declare no conflict of interest.

References

  1. Preston, J.C.; Dillman, D.A.; Hobbs, D.J. Rural society in the U.S. issues for the 1980s. Contemp. Sociol. 1982. [Google Scholar] [CrossRef]
  2. Steve, H. Migration and industrialization in Germany, 1815-1977. Soc. Sci. Hist. 1981, 5, 445–468. [Google Scholar] [CrossRef]
  3. Kojima, R. Introduction: Population migration and urbanization in developing countries. Dev. Econ. 1996, 34, 349–369. [Google Scholar] [CrossRef] [Green Version]
  4. Milan, A.; Ho, R. Livelihood and migration patterns at different altitudes in the Central Highlands of Peru. Clim. Dev. 2013, 6, 69–76. [Google Scholar] [CrossRef] [Green Version]
  5. Gray, C.; Mueller, V. Drought and population mobility in rural Ethiopia. World Dev. 2012, 40, 134–145. [Google Scholar] [CrossRef] [PubMed] [Green Version]
  6. Zhang, H.; Zhuang, L.; Xue, B. The impact of soil erosion on internal migration in China. PLoS ONE 2019, 14, e0215124. [Google Scholar] [CrossRef] [PubMed]
  7. Carrico, A.R.; Donato, K. Extreme weather and migration: Evidence from Bangladesh. Popul. Environ. 2019, 41, 1–31. [Google Scholar] [CrossRef]
  8. Hauer, M. Migration induced by sea-level rise could reshape the US population landscape. Nat. Clim. Change 2017, 7, 321–325. [Google Scholar] [CrossRef] [Green Version]
  9. Zhang, K.H.; Song, S.F. Rural–urban migration and urbanization in China: Evidence from time-series and cross-section analyses. China Econ. Rev. 2003, 14, 386–400. [Google Scholar] [CrossRef]
  10. Lyu, H.; Dong, Z.; Roobavannan, M.; Kandasamy, J.; Pande, S. Rural unemployment pushes migrants to urban areas in Jiangsu Province, China. Palgrave Commun. 2019, 5. [Google Scholar] [CrossRef] [Green Version]
  11. Lucas, R.E.B. Migration and rural development. Electron. J. Agric. Dev. Econ. Food Agric. Organ. United Nations 2007, 4, 99–122. [Google Scholar]
  12. Zhu, M.; Zhang, X.L.; Wang, K.; Yuan, S.F.; Yang, L.X.; Skitmore, M. Urban–rural construction land transition and its coupling relationship with population flow in China’s urban agglomeration region. Cities 2020, 101, 102701. [Google Scholar] [CrossRef]
  13. Qu, Y.B.; Jiang, G.H.; Ma, W.Q.; Li, Z.T. How does the rural settlement transition contribute to shaping sustainable rural development? Evidence from Shandong, China. J. Rural. Stud. 2021, 82, 279–293. [Google Scholar] [CrossRef]
  14. Partridge, M.D.; Rickman, D.S.; Olfert, M.R.; Ali, K.; Dwindling, U.S. internal migration: Evidence of spatial equilibrium or structural shifts in local labor markets? Reg. Sci. Urban Econ. 2012, 42, 375–388. [Google Scholar] [CrossRef] [Green Version]
  15. Li, X.M.; Huang, S.Y.; Chen, J.W.; Chen, Q.H. Analysis of the driving factors of U.S. domestic population mobility. Phys. A: Stat. Mech. Its Appl. 2020, 539, 122984. [Google Scholar] [CrossRef]
  16. Jane, P.; Eleonora, D.G.; Christine, R.; Amy, P.; Abernethy, D.C.; Currow, A. Population-Based Cross-Sectional Study That Defined Normative Population Data for the Life-Space Mobility Assessment-Composite Score. J. Pain Symptom Manag. 2015, 49, 885–893. [Google Scholar] [CrossRef]
  17. Oxana, T.; Dias, D. Quantification of health benefits related with reduction of atmospheric PM10 levels: Implementation of population mobility approach. Int. J. Environ. Health Res. 2011, 21, 189–200. [Google Scholar] [CrossRef]
  18. Hassène, K.; Diaa, M.; Wagida, A.; Anwar; Chérifa, L.; Kari, H.; Meriem, K. Emigration flows from North Africa to Europe. Eur. J. Public Health 2014, 24, 2–5. [Google Scholar] [CrossRef] [Green Version]
  19. Luca, S. Residential mobility and the local context: Comparing long-term and short-term spatial trends of population movements in Greece. Socio-Econ. Plan. Sci. 2020, 72, 100910. [Google Scholar] [CrossRef]
  20. Kerstin, K.; Zander, S.T.; Garnett. The importance of climate to emigration intentions from a tropical city in Australia. Sustain. Cities Soc. 2020, 63, 102465. [Google Scholar] [CrossRef]
  21. Ünal, H.E.; Birben, Ü.; Bolat, F. Rural population mobility, deforestation, and urbanization: Case of Turkey. Environ. Monit. Assess. 2018, 191, 21. [Google Scholar] [CrossRef]
  22. Clark, L.; Gray; Valerie, M. Natural disasters and population mobility in Bangladesh. Proc. Natl. Acad. Sci. USA 2012, 109, 6000–6005. [Google Scholar] [CrossRef] [Green Version]
  23. Ishtiaque, A.; Nazem, N.I. Household-level disaster-induced losses and rural–urban migration: Experience from world’s one of the most disaster-affected countries. Nat. Hazards 2017, 86, 315–326. [Google Scholar] [CrossRef]
  24. Mizan, R.K.; Saleemul, H.; Adeeba, N.R.; Sarder, S.A. High-density population and displacement in Bangladesh. Science 2021, 372, 1290–1293. [Google Scholar] [CrossRef]
  25. Hannah, R.M.; John, R.G.; Javier, P.; Théophile, M.; Andrea, R.; Simon, M.; Elliot, N.K.; Kabondo, M.; Caroline, O.B. Characterizing human mobility patterns in rural settings of sub-Saharan Africa. Elife 2021, 10. [Google Scholar] [CrossRef]
  26. Zhang, W.; Chong, Z.H.; Li, X.J.; Nie, G.B. Spatial patterns and determinant factors of population flow networks in China: Analysis on Tencent Location Big Data. Cities 2020, 99, 102640. [Google Scholar] [CrossRef]
  27. Wang, X.X.; Gao, X.D. The evolution of China’s floating population and its impact on urbanization: A comparative Analysis based on Inter- and Intra-provincial Perspectives. Sci. Geogr. Sin. 2019, 39, 1866–1874. [Google Scholar] [CrossRef]
  28. Gu, H.Y.; Meng, X.; Shen, T.Y.; Cui, N. Spatial variation of the determinants of China’s urban floating population’s settlement intention. Acta Geogr. Sin. 2020, 75, 240–254. [Google Scholar] [CrossRef]
  29. Zhao, S.; Wang, X.; Ma, Z. Study on fractal characteristics of migration-population flow—evidence from Egypt. ISPRS Int. J. Geo-Inf. 2021, 10, 45. [Google Scholar] [CrossRef]
  30. Deng, X.H.; Gong, L.; Gao, Y.F.; Cui, X.Q.; Xu, K. Internal differentiation within the rural migrant population from the sustainable Urban Development Perspective: Evidence from China. Sustainability 2018, 10, 4839. [Google Scholar] [CrossRef] [Green Version]
  31. Wang, F.; Fan, W.; Lin, X.; Liu, J.; Ye, X. Does Population Mobility Contribute to Urbanization Convergence? Empirical Evidence from Three Major Urban Agglomerations in China. Sustainability 2020, 12, 458. [Google Scholar] [CrossRef] [Green Version]
  32. Liu, Z.; Liu, S.H.; Jin, H.R.; Wei, Q. Rural population change in China: Spatial differences, driving forces and policy implications. J. Rural. Stud. 2017, 51, 189–197. [Google Scholar] [CrossRef]
  33. Chen, T.; Chen, C.B. Analysis on Coupling between County Level Urbanization and Rural Population Hollowing under the Background of Escaping Migration. Issues Agric. Econ. 2017, 4, 58–66. [Google Scholar] [CrossRef]
  34. Gao, G.H.; Luo, Q.; Fan, X.S.; Li, E.L.; Li, X.J. China’s rural population inter-provincial flow: Based on the sixth nationwide population census data. Sci. Geogr. Sin. 2015, 35, 1511–1517. [Google Scholar]
  35. Cheng, Q.; Li, Y. Study on the health effects of rural population mobility between rural and urban areas. Mod. Econ. Res. 2020, 10, 104–111. [Google Scholar] [CrossRef]
  36. Wang, H.L. A study of the causes, effects and countermeasures of the rural population outflow in Henan Province. J. Manag. 2018, 31, 46–56. [Google Scholar]
  37. Wang, P.A. Migration trends and migration studies in China’s New Era. Popul. Res. Policy Rev. 2019, 43, 3–5. [Google Scholar]
  38. Xie, D.; Li, Z.Q. Urban and rural population migration under the background of urbanization and rural revitalization: Theory, contradiction and outlet. Reform Econ. Syst. 2020, 3, 39–45. [Google Scholar]
  39. Yang, D.F.; Long, Y.; Yang, W.S.; Sun, H. Losing population with expanding space: Paradox of urban shrinkage in China. Mod. Urban Res. 2015, 9, 20–25. [Google Scholar] [CrossRef]
  40. Zhang, S.W.; Zhu, Y.; Jin, X.L.; Tian, P.P. The spatial patterns of intra-provincial migration and their determinants in Anhui Province. Econ. Geogr. 2013, 33, 23–30. [Google Scholar] [CrossRef]
  41. Bai, Z.Q.; Wang, J.L.; Yang, Y.P.; Sun, J.L. Characterizing spatial patterns of population distribution at township level across the 25 provinces in China. Acta Geogr. Sin. 2015, 70, 1229–1242. [Google Scholar] [CrossRef]
  42. Zhao, F.; Liu, Y.J. A study on the causes of population loss in Northeast China -based on time-varying coefficient factor model. Popul. J. 2018, 40, 82–91. [Google Scholar] [CrossRef]
  43. Qi, W.; Abel, G.J.; Liu, S.H. Geographic transformation of China’s internal population migration from 1995 to 2015: Insights from the migration centerline. Appl. Geogr. 2021, 135, 102564. [Google Scholar] [CrossRef]
  44. Li, W.S.; Li, J.F.; Cui, J.X. Exploring rural decline with the perspective of demographics: Case study of Hubei, China. Phys. Chem. Earth 2020, 120, 102917. [Google Scholar] [CrossRef]
  45. Qi, W.; Deng, Y.; Fu, B.J. Rural attraction: The spatial pattern and driving factors of China’s rural in-migration. J. Rural. Stud. 2019, 3. [Google Scholar] [CrossRef]
  46. Yang, J.; Zhao, X.X. The impact of education on income inequality between urban and rural migrants. J. Beijing Technol. Bus. Univ. (Soc. Sci.) 2018, 33, 103–115. [Google Scholar] [CrossRef]
  47. Guo, Y.Z.; Zhou, Y.; Liu, Y.S. Spatial-temporal evaluation of rural population outflow and its mechanism in China. Sci. Geogr. Sin. 2020, 40, 50–59. [Google Scholar] [CrossRef]
  48. Wei, Y.; Song, W.; Xiu, C.L.; Zhao, Z.Y. The rich-club phenomenon of China’s population flow network during the country’s spring festival. Appl. Geogr. 2018, 96, 77–85. [Google Scholar] [CrossRef]
  49. Yan, Y.; Zhao, C.L.; Quan, Y.; Lu, H.T.; Rong, Y.; Wu, G. Interrelations of ecosystem services and rural population wellbeing in an ecologically-fragile area in North China. Sustainability 2017, 9, 709. [Google Scholar] [CrossRef] [Green Version]
  50. Yu, M.Y.; Xu, Y.; Li, J.Q.; Lu, X.C.; Xing, H.Q.; Ma, M.L. Geographic Detector-based spatiotemporal variation and influence factors analysis of PM2.5 in Shandong, China. Pol. J. Environ. Stud. 2021, 30, 463–475. [Google Scholar] [CrossRef]
  51. Pascual, F.M.; Mónica de, C.; Víctor, M.B.; João, C. Azevedo. Assessing sustainable rural development based on ecosystem services vulnerability. Land 2020, 9, 222. [Google Scholar] [CrossRef]
  52. Liang, S.Z.X.; Fang, H.Y. Quantitative analysis of driving factors in soil erosion using geographic detectors in Qiantang River catchment, Southeast China. J. Soils Sediments 2021, 21, 134–147. [Google Scholar] [CrossRef]
  53. Zuo, Y.; Chen, H.; Pan, J.; Si, Y.; Law, R.; Zhang, M. Spatial distribution pattern and influencing factors of sports tourism resources in China. ISPRS Int. J. Geo-Inf. 2021, 10, 428. [Google Scholar] [CrossRef]
  54. Tan, S.; Zhang, M.; Wang, A.; Ni, Q. Spatio-Temporal evolution and driving factors of rural settlements in Low Hilly Region—A case study of 17 cities in Hubei Province, China. Int. J. Environ. Res. Public Health 2021, 18, 2387. [Google Scholar] [CrossRef] [PubMed]
  55. Li, J.T.; Sun, Z.F. Urban function orientation based on spatiotemporal differences and driving factors of urban construction land. J. Urban Plan. Dev. 2020, 146. [Google Scholar] [CrossRef]
  56. Costanza, R.; Arge, R.; Groot, R. The value of the world’s ecosystem services and natural capital. Nature 1997, 386, 253–260. [Google Scholar] [CrossRef]
  57. Qi, W.; Liu, S.H.; Jin, F.J. Calculation and spatial evolution of population loss in Northeast China. Sci. Geogr. Sin. 2017, 37, 1795–1804. [Google Scholar] [CrossRef]
  58. Marc, S.; Florent, D. Improvement of spatial autocorrelation, kernel estimation, and modeling methods by spatial standardization on distance. ISPRS Int. J. Geo-Inf. 2019, 8, 199. [Google Scholar] [CrossRef] [Green Version]
  59. Qu, Y.B.; Jiang, G.H.; Zhao, Q.L.; Ma, W.Q.; Zhang, R.J.; Yang, Y.T. Geographic identification, spatial differentiation, and formation mechanism of multifunction of rural settlements: A case study of 804 typical villages in Shandong Province, China. J. Clean. Prod. 2017, 166, 1202–1215. [Google Scholar] [CrossRef]
  60. Liu, Y.; Liu, J.; Guo, C.; Zhang, T.; Wang, A.; Yu, X. Identification of villages’ development types using a comprehensive natural–socioeconomic framework. Sustainability 2021, 13, 7294. [Google Scholar] [CrossRef]
  61. Qu, Y.B.; Jiang, G.H.; Yang, Y.T.; Zheng, Q.Y.; Li, Y.L.; Ma, W.Q. Multi-scale analysis on spatial morphology differentiation and formation mechanism of rural residential land: A case study in Shandong Province, China. Habitat Int. 2018, 71, 135–146. [Google Scholar] [CrossRef]
  62. Cheng, G.B.; Ju, X.Q. Response of ecosystem service value to land use change based on RS and GIS technology: Taking Urumqi County circle as an example. Ecol. Econ. 2021, 37, 169–175. [Google Scholar]
  63. Xie, G.D.; Xiao, Y.; Zhen, L.; Lu, C.X. Study on ecosystem services value of food production in China. Chin. J. Eco-Agric 2005, 13, 10–13. [Google Scholar]
  64. Wu, J.; Shen, W.; Sun, W.; Tueller, P.T. Empirical patterns of the effects of changing scale on landscape metrics. Landscape Ecol 2002, 17, 761–782. [Google Scholar] [CrossRef]
  65. Liu, J.; Guo, C.; Liu, Y.Q.; Hou, Y.X.; Wang, A.L. Rural spatial reconstruction based on coupling and coordination of suitability-intensive in plain agricultural areas. J. Agric. Resour. Environ. 2021. [Google Scholar] [CrossRef]
  66. Li, W.B.; Fang, J.P.; Xing, Z.; Hao, W.Y.; Zhao, W.T. Ecological Vulnerability Evaluation of Nyingchi County Based on Landscape Patern. Bangladesh J. Bot. 2020, 49, 743–755. [Google Scholar]
  67. Gong, J.Z.; Xia, B.C. Response to classification numbers of vegetation types on correlative coefficients among landscape metrics. Acta Ecol. Sinica. 2007, 27, 4075–4085. [Google Scholar] [CrossRef]
  68. Wu, J.G. Landscape Ecology; Higher Education Press: Beijing, China, 2001. [Google Scholar]
  69. Sun, L.R.; Zhou, D.M.; Cen, G.Z.; Ma, J.; Dang, R.; Ni, F.; Zhang, J. Landscape ecological risk assessment and driving factors of the Shule River Basin based on the geographic detector model. Arid Land Geogr. 2021, 44, 1384–1395. [Google Scholar] [CrossRef]
  70. Wang, H.; Gao, J.B.; Hou, W.J. Quantitative attribution analysis of soil erosion in different geomorphological types in karst areas: Based on the geodetector method. J. Geogr. Sci. 2019, 29, 271–286. [Google Scholar] [CrossRef] [Green Version]
  71. Liu, J.K. Migration cost: Problems in the village and reflection on governance—Microscopic perspective on a village case. J. China Agric. Univ. (Soc. Sci. Ed.) 2019, 36, 53–68. [Google Scholar]
  72. Yang, M.H.; Yao, Z.H.; Cao, L.H.; Zhang, H.P.; Huang, J. Spatial-temporal evolution characteristics and influencing factors of county rural hollowing in Henan. Cienc. Rural Maria 2019, 49, 1–15. [Google Scholar] [CrossRef]
Figure 1. Theoretical framework of RPL.
Land 11 00099 g001
Figure 2. Location of the study area.
Land 11 00099 g002
Figure 3. Level of RPL in Laiyang County and its towns and subdistricts.
Land 11 00099 g003
Figure 4. Spatial patterns of RPL in Laiyang County. (a) Spatial distribution. (b) Hotspot analysis and distribution. (c) Spatial autocorrelation distribution.
Land 11 00099 g004
Table 1. Criteria for determining the level of RPL.
Rate of RPL/%≤00–55–1010–15≥15
Level of RPLnonelowmediumsuperiorhigh
Table 2. Index system of RPL.
CategoryIndicatorsDescriptionCode
Dependent variableRPLFormula 1Y
Natural
conditions
Slope<2° = 4, 2–6° = 3, 6–15° = 2, 15–25° = 1X1
ElevationClassification by elevation valueX2
Geological disastersNo risk = 1, low risk = 2, medium risk = 3, high risk = 4X3
Resources
endowment
Cultivated land resourceQuantity of cultivated land (cultivated land per capita)X4
Quality of cultivated land (grade)X5
Water resources500–1000 m = 1, 1000–1500 m = 2, 1500–2000 m = 3, >2000 m = 4X6
Mineral resourcesPotassium feldspar and iron ore = 4, soil ore = 3, rock brick and stone = 2, none = 1X7
Traffic
location
The distance
between the village and the center of the town
Calculated using the NEAR tool in ArcGISX8
The distance
between the village and the county seat
Calculated using the NEAR tool in ArcGISX9
High-grade roadNational road = 1, provincial road = 2, county and township road = 3, other = 4X10
Cluster scaleEconomic situationCollective incomeX11
Average light density at nightX12
Village areaVillage areaX13
Basic
facilities
Public service facilitiesDistance between the nearest hospital and the village committeeX14
Distance between the nearest primary school and the village committeeX15
The nearest junior high school and this village (residence) committee distanceX16
InfrastructureTap water = 1, bottled water = 2, purified water = 3, mineral water = 4, water purifier = 5X17
Village road hardening rate = road hardening length/total road lengthX18
Landscape ecologyESVValue equivalent method, note ① [62,56,63]X19
LSIActual value, note ② [64,65]X20
COHESIONActual value, note ③ [66,67]X21
AIActual value, note ④ [68,69]X22
Note: ① ESV = S i × V C i ;   V C i j = E c × f i j ;   E c = 1 7 × U a × U b   (ESV is total value of ecological services, V C i is the value coefficient of ecological services, V C i j is the coefficient of ecological service value of the i-th land use type and the j-th type, f i j is the equivalent factor of ecological service value of the i-th land use type and the j-th type ,   E c is the economic value of grain production, U a is the average grain base unit yield, and U b is the grain unit price.) ② LSI = a 4 S (LSI is the landscape morphology index, a is the patch side length, and S is the patch area. Measure the regularity of the village. The larger the value, the more irregular the shape.) ③ COHESION = [ 1 j = 1 m p i j j = 1 m p i j a i j ] [ 1 1 A ] 1 × 100 (aij is the area of the j-th patch in class i landscape, pij is the perimeter of the j-th patch in the class i landscape, and A is the total area of the landscape. It reflects the degree of natural landscape connectivity. The greater the value, the stronger the connectivity and the more concentrated the patch distribution.) ④ AI =   [ g i i m a x g i i ] ( 100 ) (gii is the number of similar adjacent patches of the corresponding landscape type. Measure the connectivity between patches. The higher the value is, the higher the degree of aggregation will be).
Table 3. Interaction types.
Judgment BasisInteraction
q(A∩B) < Min(q(A), q(B))Nonlinear weakening
Min(q(A), q(B)) < q(A∩B) < Max(q(A), q(B))Single-factor nonlinear weakening
q(A∩B) > Max(q(A), q(B))Two-factor enhancement
q(A∩B) = q(A) + q(B)Independent
q(A∩B) > q(A) + q(B)Nonlinear enhancement
Table 4. Level of RPL in Laiyang County and its towns and subdistricts.
Administrative RegionRPLLPLTotalPct. (%)
No.Pct. (%)NoneLowMediumSuperiorHigh
Total rural population1.90Low77410013.3139.4118.7313.4415.12
Bolinzhuang0.00None354.5277.1420.002.860.000.00
Chengxiang0.00None283.6264.2921.4310.710.003.57
Dakuang10.16Superior293.753.4513.790.0068.9713.79
Fenggezhuang1.65Low334.263.0360.6133.330.003.03
Gaogezhuang4.53Low303.880.006026.6713.330.00
Guliu0.00None293.7513.7972.4110.343.450.00
Heluo1.34Low395.0430.7764.15.130.000.00
Jiangtuan1.38Low415.300.00100.000.000.000.00
Longwangzhuang0.00None364.6522.2233.3333.338.332.78
Lvgezhuang5.08Medium182.3311.1138.8927.785.5616.67
Muyudian6.86Medium8410.853.5734.5227.3820.2414.29
Shanqiandian9.80Medium374.780.005.4151.3529.7313.51
Tangezhuang10.86Superior8410.851.1915.4827.3822.6233.33
Tuanwang5.47Medium719.1718.3143.6615.495.6316.90
Wandi3.17Medium648.270.0078.131.564.6915.63
Xuefang12.03Superior486.204.172.0816.6735.4241.67
Yangjun0.00None232.9726.0943.4817.398.704.35
Zhaowangzhuang11.28Superior455.8111.1117.7824.444.4442.22
Table 5. Results of factor detection.
IndexesFactorsq Statisticp ValueRanking
Resource endowmentX40.18130.00001
Traffic locationX90.11950.00002
Cluster scaleX110.06600.00003
X130.04910.00004
Natural conditionX20.04700.00005
Landscape ecologyX190.03330.03356
Table 6. Results of dominant factor interaction detection.
q = A∩BA + BComparison
Results
InteractionRanking
X2∩X4 = 0.320.23q > A + BNonlinear enhancement9
X2∩X9 = 0.270.17q > A + BNonlinear enhancement15
X2∩X11 = 0.450.11q > A + BNonlinear enhancement1
X2∩X13 = 0.380.10q > A + BNonlinear enhancement5
X2∩X19 = 0.280.08q > A + BNonlinear enhancement13
X4∩X9 = 0.370.30q > A + BNonlinear enhancement6
X4∩X11 = 0.360.25q > A + BNonlinear enhancement8
X4∩X13 = 0.400.23q > A + BNonlinear enhancement4
X4∩X19 = 0.320.21q > A + BNonlinear enhancement10
X9∩X11 = 0.320.19q > A + BNonlinear enhancement11
X9∩X13 = 0.370.17q > A + BNonlinear enhancement7
X9∩X19 = 0.280.15q > A + BNonlinear enhancement14
X11∩X13 = 0.410.12q > A + BNonlinear enhancement2
X11∩X19 = 0.400.10q > A + BNonlinear enhancement3
X13∩X19 = 0.290.08q > A + BNonlinear enhancement12
Publisher’s Note: MDPI stays neutral with regard to jurisdictional claims in published maps and institutional affiliations.

