Abstract
Selecting an appropriate model for simulating ecosystem respiration is critical in modeling the carbon cycle of terrestrial ecosystems due to their magnitude and high variations in time and space. There is no consensus on the ideal model for estimating ecosystem respiration in different ecosystems. We evaluated the performances of six respiration models, including Arrhenius, logistic, Gamma, Martin, Concilio, and time series model, against measured ecosystem respiration during 2014–2018 in four grassland ecosystems on the Mongolian Plateau: shrubland, dry steppe, temperate steppe, and meadow ecosystems. Ecosystem respiration increased exponentially with soil temperature within an apparent threshold of ~19.62 °C at shrubland, ~16.05 °C at dry steppe, ~16.92 °C at temperate steppe, and ~15.03 °C at meadow. The six models explained approximately 50–80% of the variabilities of ecosystem respiration during the study period. Both soil temperature and soil moisture played considerable roles in simulating ecosystem respiration with R square, ranging from 0.5 to 0.8. The Martin model performed better than the other models, with a relatively high R square, i.e., R2 = 0.68 at shrubland, R2 = 0.57 at dry steppe, R2 = 0.74 at temperate steppe, and R2 = 0.81 at meadow. These models achieved good performance for around 50–80% of the simulations. No single model performs best for all four grassland types, while each model appears suitable for at least one type of ecosystem. Models that oil moisture include models, especially the Martin model, are more suitable for the accurate prediction of ecosystem respiration than Ts-only models for the four grassland ecosystems.
1. Introduction
Carbon loss to the atmosphere through respiration in terrestrial ecosystems is the second-largest flux factor after gross primary productivity [1,2,3]. Consequently, accurate estimates of ecosystem respiration have been a major focus in carbon cycle studies. Various ecosystem respiration models have been applied in conjunction with in situ measurements to predict ecosystem respiration at different temporal scales (e.g., hours to annual), including simple linear regression based on temperature and complex forms based on multiple drivers [4,5,6,7,8,9,10], although they are all empirically constructed with in situ measurements of respiration rate and the corresponding drivers. These models have been applied to reflect the underlying mechanism, under different climatic conditions (e.g., marine vs. Mediterranean climate), or after disturbances such as fire, harvesting, and grazing that can shift the magnitude and changes of respiration [11,12,13]. Model selections based on their performances in simulating ecosystem respiration remain limited.
The exponential relationship between temperature and respiration proposed by van ’t Hoff and modified by Arrhenius [14], assumes that respiration increases without limitation with temperature [6]. The logistic model with a sigmoid shape assumes that respiration peaks at a specific temperature because of heat stress [6,15]. However, neither of these models allow respiration to decrease at high soil temperatures. Khomik et al. [16] presented a Gamma model that allows respiration to decrease at a high soil temperature and that can incorporate additional factors to help interpret the relationship between temperature and respiration. The Gamma model is better or comparable to the exponential Q10, Lloyd-Taylor, and logistic models in five forest ecosystems, with an R2 ranging from 0.25 to 0.69. In addition to temperature, soil moisture also plays a significant role in respiration by affecting oxygen availability and substrate diffusion [11]. Several models that include soil moisture have been proposed that show the interaction of temperature and soil moisture in ecosystem respiration in different ecosystems. Gulledge and Schimel [17] explored the effect of soil moisture on respiration rates using three different models (i.e., linear, quadratic, and asymptote models). They demonstrated that the asymptote model, which assumes that respiration reaches the maximum rate asymptotically as soil moisture increases, but that soil moisture does not change the temperature sensitivity of biota directly, performed better than the other two models in Alaskan taiga forests. The incorporation of soil moisture into the asymptote model increased the overall model R2 from 0.25 to 0.51. Reichstein et al. [18] selected different regression models to analyze the response of ecosystem respiration to soil water content and temperature in two Mediterranean evergreen forests; they found that ecosystem respiration was more sensitive to soil moisture in dry soil, ecosystem respiration was additionally sensitive to soil moisture in dry soils, and that the incorporation of soil moisture into Lloyd-Taylor model can explain 54–83% of the change in ecosystem respiration. To describe the relationship between soil respiration and environmental variables such as soil temperature and soil water content, Lee et al. [19] constructed a multiple polynomial regression model, which explains about 96% of the variance of daily soil CO2 flux based on soil temperature and soil water content on sunny days.
A change in respiration is related not only to biophysical variables but also to the instantaneous or lag effects of environmental conditions, especially under disturbances or extreme climate [20]. The Fourier model, a second-order Fourier regression that considers day of year, was used by Richardson and Hollinger [21] to simulate respiration and contrast with the Q10 and Lloyd-Taylor models. Considering the effects of phenological changes on respiration, the temperature, soil moisture, and day of year were integrated into a non-linear model that showed a quadratic relationship between day of year and soil respiration from May to August in oak forests [11]. Moreover, the dataset of half-hourly net ecosystem exchange (NEE) may include 50% or more gap following the data quality check [22]. An ideal model may help to account for the data loss. In sum, comparisons of various ecosystem respiration models with uncertainty analysis for different ecosystem types are essential steps toward accurate predictions of ecosystem respiration.
Here, we used the long-term in situ measurements of ecosystem respiration from a cluster of four eddy-covariance (EC) towers in Mongolia to examine the performance of widely used respiration models. Grassland covers about 80% of Mongolia, and it is the dominant cover type in East Asia [23]. In this study, we used observational data during the night of ecosystem respiration, soil temperature, soil moisture, and other meteorological measures in the following four types of grasslands: shrubland, dry steppe, temperate steppe and meadow during 2014–2018. The objectives of this study are: (1) exploring the relationship between ecosystem respiration and potential drivers, (2) comparing the performances of six respiration models, (3) selecting an appropriate model for gap-filling in four contrasting grasslands. Lessons from this study will provide a scientific basis for selecting ecosystem respiration models for different climate conditions and disturbances (e.g., grazing).
2. Materials and Methods
2.1. Study Area
The following four eddy covariance towers were installed at our study sites in Mongolia [24]: shrubland (SHB), dry steppe (DRY), temperate steppe (TEMP), and meadow (MDW) (Figure 1). The study area has a typical temperate continental climate with clear seasonal changes. The mean annual temperature and precipitation are −2.9 °C and 200 mm, respectively. The growing season length is about 90–110 days from June through September, with approximately 70% of precipitation during July through August, while the other months are dry, cold, and windy. Drought is an important factor restricting plant growth, and heatwaves are becoming increasingly influential on the ecosystem functions and dynamics in this area [25,26]. The vegetation at the four study sites is relatively homogenous [27]. The SHB site is dominated by Caragana stenophylla, with mean daily temperatures −18.2 and 24.6 °C for January and July; the DRY site is dominated by Achnatherum splendens, with mean daily temperatures −21 and 21.5 °C for January and July; the TEMP is dominated by Stipa krylovii and Artemisia frigida, with mean daily temperatures −17.2 and 19.8 °C for January and July; and the MDW site is dominated by Leymus chinensis, with mean daily temperatures −11.5 and 12.6 °C for January and July. The dominant species accounts more than 80% of the land at all four sites [24].
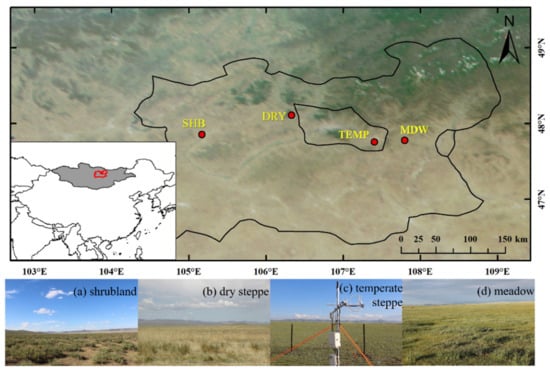
Figure 1.
Locations of four eddy covariance measurement sites in Mongolia: (a) shrubland (SHB), (b) dry steppe (DRY), (c) temperate steppe (TEMP), and (d) meadow (MDW).
2.2. Data Collection and Treatment
Flux and microclimate measurements were conducted since 2014. In this study, the data we used were processed for DRY during 2014–2017 and for the other three sites during 2014–2018. The four EC systems were mounted at 2.0 m aboveground, and each open-path EC system consisted of a CSAT3 three-dimensional sonic anemometer (Campbell Scientific Inc., Logan, UT, USA) and an infrared gas analyzer (IRGA, LI-7500, LI-COR, Lincoln, NE, USA). The IRGA was calibrated before field setup and at the beginning of the annual growing season. The micrometeorological variables included air temperature and relative humidity (HMP45C; CSI), photosynthetically active radiation (LI-190, LI-COR), net radiation (CNR4, Kipp & Zonen, Delft, The Netherlands), soil temperatures at depths of 0.05 and 0.10 m (CS107 probes; CSI), average soil moisture at top 0.30 m (CS616 probes; CSI) and rainfall (TE525, CSI) [24]. The raw data were sampled at high-frequency (10 Hz) and logged at half-hour intervals using a CR5000 data logger (CSI). Instrument maintenance was mostly conducted every two weeks.
The half-hourly NEE was calculated using EdiRe (University of Edinburgh, v1.5.0.32) [24]. The time series of NEE data often contained spikes and errors due to instrument malfunction and rain events. All errors were filtered, and spikes were removed. After a series of necessary corrections were made for time lags (FCO2), coordinate rotation (planar-fit) [28], and air density fluctuation (Webb-Pearman-Leuning) [29] and nighttime data were filtered and assessed. The negative nighttime FCO2 was deleted because there is no photosynthesis at night. Friction velocity (u*) was used as a criterion to filter out FCO2 with low turbulent development. Using the average values test (AVT) method [30], the u* threshold was set at 0.13 m s−1 at site SHB, 0.16 m s−1 at site DRY, 0.17 m s−1 at site TEMP, and 0.19 m s−1 at site MDW, respectively. Only nocturnal data ([31]) were used to construct the six respiration models in this study.
2.3. Respiration Models
The six respiration models we applied in this study fall into the following three groups: (1) temperature-only model, (2) soil moisture–included model, and (3) day of year (DOY)–included model. Among these models, the Arrhenius, logistic, and Gamma models have temperature (i.e., soil temperature, Ts) as the sole independent variable; the Martin and Concilio models include soil moisture; and DOY is incorporated in the time series model (Table 1). The Arrhenius model has been widely used for predicting respiration. Görres et al. [32] modified the Lloyd-Taylor model, where R10 is the reference respiration at 10 °C, E0 is the temperature sensitivity coefficient (K), and T is soil temperature at a 5 cm depth (K). Barr et al. [15] modified the logistic model to a simple form to fill gaps in NEE during nighttime and estimate the ecosystem respiration during daytime. Based on the Gamma function, Khomik et al. [16] proposed the Gamma model to predict respiration, in which α, β0 and β1 are estimated coefficients and T is soil temperature in °C. The Gamma model allows respiration to decrease at high soil temperature, and Khomik et al. [16] demonstrated that the Gamma model has two special useful features—exponentiality and power—and it can easily incorporate other explanatory factors. Martin et al. [9] developed a log model of multiple variables to simulate respiration, in which the terms β0–β5 are estimated coefficients. T is soil temperature in °C, and θ is soil moisture in m3 m−3 at 5 cm depth. Concilio et al. [33] used a regression model including both temperature and moisture to explore the main influences on respiration at each site, in which R0, β0, β1 and β2 are coefficients estimated by regression analysis. By considering the temporal effects on ecosystem respiration, Xu et al. [11] expanded a quadratic model incorporating day of year (DOY) that works well for modeling respiration. Temperature sensitivity of ecosystem respiration (Q10) was calculated using the following equation:
where Q10 is the ecosystem respiration rate increase for a 10 °C rise in temperature, which is widely used to describe the temperature dependence of ecosystem respiration, and β is the regression coefficient.

Table 1.
Respiration models used in this study, including Arrhenius, logistic, Gamma, Martin, Concilio and time series models. R, ecosystem respiration in mg mol−1 m−2 s−1; Ts, soil temperature, which is in °C except for Arrhenius model in Kelvin units; θ, soil moisture in m3 m−3; DOY, day of year; R10, E0, R0, α, β0, β1, β2, β3, β4, β5 are parameters to be fitted according to measurements. R10, respiration at 10 °C.
2.4. Model Validation
We used nonlinear least-squares regression to estimate the empirical coefficients of all models. The quality of fit between the observations and predicted ecosystem respiration values from different models was evaluated by the correlation coefficient of determination (R2) and root mean square error (RMSE). Due to the different number of input parameters, Akaike information criterion (AIC) was used to evaluate model performance. All calculations and visualizations were performed using Python 3.7.
3. Results
3.1. Changes in Ecosystem Respiration, Soil Temperature and Moisture
Ecosystem respiration increased at the beginning of May and peaked in July and August (Figure 2(a1–d1)). As expected, ecosystem respiration rates were significantly higher in the growing season than in the non-growing season, with the maximum value of 0.2 mg mol−1 m−2 s−1 in July 2014 at SHB, 0.16 mg mol−1 m−2 s−1 in July 2014 at DRY, 0.44 mg mol−1 m−2 s−1 in July 2018 at TEMP, and 0.22 mg mol−1 m−2 s−1 in August 2014 at MDW. However, ecosystem respiration rates varied by site and by year. The annual average ecosystem respiration rates ranged from 0.03 to 0.05 mg mol−1 m−2 s−1 at SHB, with the lowest value found in 2017 (Figure 2(a1)), from 0.04 to 0.05 mg mol−1 m−2 s−1 at DRY, and from 0.05 to 0.11 mg mol−1 m−2 s−1 at TEMP, with the lowest mean rate found in 2016 (Figure 2(c1)), and from 0.07 to 0.09 mg mol−1 m−2 s−1 at MDW. It was notably high in 2018 at TEMP (>0.35 mg mol−1 m−2 s−1 (Figure 2(c1))) and low in 2018 (~0.07 mg mol−1 m−2 s−1), compared to other years at MDW (Figure 2(d1)).
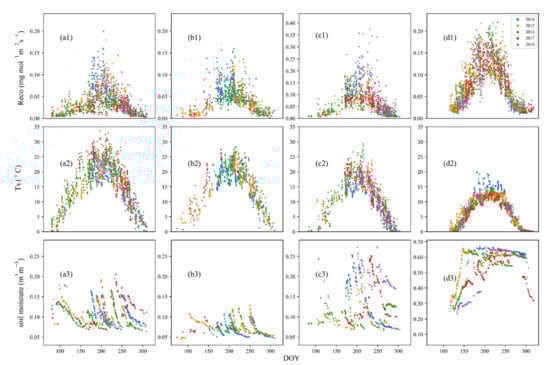
Figure 2.
Changes in ecosystem respiration (Reco), soil temperature (Ts) and soil moisture at four sites in different years: (a1–a3) are for site SHB in 2014–2018; (b1–b3) are for site DRY in 2014–2017; (c1–c3) are for site TEMP in 2014–2018; and (d1–d3) are for site MDW in 2014–2018. The measurements in each year are represented by a unique color.
A single peak of soil temperature over a year occurred during the five-year study period at the beginning of July at all four sites, with a relatively higher value in summer at SHB (~33.7 °C) (Figure 2(a2)) and a lower value in summer at MDW (~20 °C) (Figure 2(d2)). The annual mean temperature at MDW was 7.47 °C, which is lower than 16.46 °C at SHB, 16.25 °C at DRY and 11.83 °C at TEMP. The soil temperature was relatively high during growing season in 2014 at MDW (Figure 2(d2)) than that at the other three sites. In addition, the soil temperature was higher in 2016 at TEMP (Figure 2(c2)) and in 2017 at SHB (Figure 2(a2)). Notably, the seasonal variation in ecosystem respiration does not match well with that of soil temperature, indicating that soil temperature alone cannot fully explain the changes in ecosystem respiration.
The soil moisture showed multiple peaks during the study period at SHB, DRY, and TEMP, but a steady high value during the growing season at MDW—a site with permafrost (Figure 2(a3–d3)). The annual mean soil moisture during the study period appeared different among the four sites and varied from 0.07 m3 m−3 to 0.54 m3 m−3, with the highest value found at MDW and the lowest at DRY. The soil moisture at DRY was lower than 0.13 m3 m−3 throughout the years, suggesting that plants may have experienced water stress during the study period, whereas the soil moisture at MDW exceeded 0.23 m3 m−3, with a maximum value of about 0.67 m3 m−3. At the SHB site, soil moisture was found to be low from May to July in 2017 (Figure 2(a3)), likely due to a lack of precipitation. We found relatively low soil moisture at MDW in 2018 (Figure 2(d3)), at the beginning of growing season. However, the soil moisture during growing season in 2018 was mostly >0.15 m3 m−3 at TEMP (Figure 2(c3)).
3.2. Response of Ecosystem Respiration to Environmental Factors
Exponential changes in ecosystem respiration with soil temperature (Ts) were observed during the five-year study period, albeit the relationship varied by site and by year (R2 = 0.51 to 0.79) (Table 2) and with apparent temperature thresholds at SHB and TEMP (Figure 3). The ecosystem respiration at MDW was more sensitive to Ts, with the highest changing rate at 0.14 (Figure 3d). In addition, the ecosystem respiration was more sensitive to Ts in 2014, 2015 and 2018 at SHB, with a corresponding changing rate of 0.11, 0.10 and 0.11, respectively (Figure 3a). A changing rate of 0.16, and 0.12 (Figure 3c), was estimated at TEMP in 2014 and 2018. The Q10 value varied from 2.26 to 4.18, with the highest value at site MDW and the lowest value at site SHB. However, the exponential rise appeared to level off at temperatures of ~16.05 °C at DRY, ~15.03 °C at MDW, ~19.62 °C at SHB, and ~16.92 °C at TEMP (Table 3). This trend was more obvious in 2016 and 2017 at SHB and in 2015, 2016 and 2017 at TEMP. However, the correlation of ecosystem respiration with soil moisture was much weaker than the correlation with soil temperature (Figure 4). The coefficient R2 between ecosystem respiration and soil moisture ranged from 0.016 to 0.207, with the maximum value at TEMP and the minimum at SHB.
Table 2.
Performance of six respiration models based on correlation coefficients of determination (R2), Root Mean Square Error (RMSE), and Akaike information criterion (AIC). A K value of 2, 3, 3, 6, 4, and 6 to calculate AIC was set for Arrhenius, logistic, Gamma, Martin, Concilio and time series model, respectively.
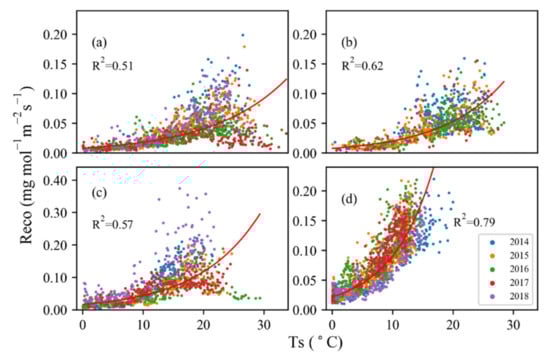
Figure 3.
Response of nighttime ecosystem respiration (Reco) to soil temperature (Ts) for four sites in different years: (a) SHB, 2014–2018, (b) DRY, 2014–2017, (c) TEMP, 2014–2018, (d) MDW, 2014–2018. The R-squares were obtained considering the whole years. According to exponential function, the regressions are 0.008e0.0814Ts for site SHB, 0.0077e0.0967Ts for site DRY, 0.0163e0.0998Ts for site TEMP and 0.0217e0.1431Ts for site MDW.
Table 3.
Comparison of percentage of predicted values outside the 95% confidence intervals. OE, percentage of overestimated values (%); UE, percentage of underestimated values (%); TP, threshold point (°C), when Ts exceeds this value, Reco tends to decrease.
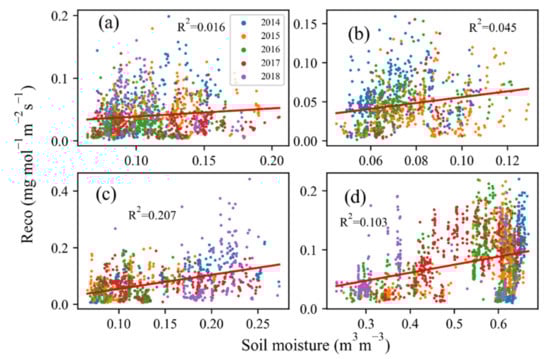
Figure 4.
Response of nighttime ecosystem respiration (Reco) to soil moisture for the four study sites in different years: (a) SHB in 2014–2018, (b) DRY in 2014–2017, (c) TEMP in 2014–2018, and (d) MDW in 2014–2018.
3.3. Model Performances
The simulated Reco from three temperature only models (Arrhenius, logistic and Gamma models) agreed well with the observed Reco at MDW (Figure 5(d1–d3)), though all of the models produced some clear overestimations or underestimations (with sum of 10–18%) for the four grassland ecosystems (Table 3) and had varied success in their performances. For all four sites, the Gamma model performed the best compared to the other two models, as indicated by both R2 and AIC (e.g., high R2 of 0.62 and 0.72 and low AIC values of −10928 and −7413 at SHB and TEMP, respectively) (Table 2). The Arrhenius model performed better at DRY, with R2, RMSE, and AIC of 0.53, 0.02, and −5652, respectively. A high R2 of 0.63 in 2014 was found at DRY. The logistic model performed slightly better at MDW, with R2, RMSE, and AIC being 0.80, 0.02, and −14545, respectively, particularly in 2014 when R2 reached 0.87. Surprisingly, some underestimations occurred when respiration exceeded ~0.07 mg mol−1 m−2 s−1 at DRY. In addition, overestimations appeared at low observed values and underestimations appeared at high observed ranges, suggesting that soil temperature was not the only factor affecting ecosystem respiration at both high and low ranges. In summation, no single model consistently performed better than the other two at any of the four ecosystems; all three models performed the best for MDW and the worst for DRY. This suggests that model selection is important for simulating ecosystem respiration.
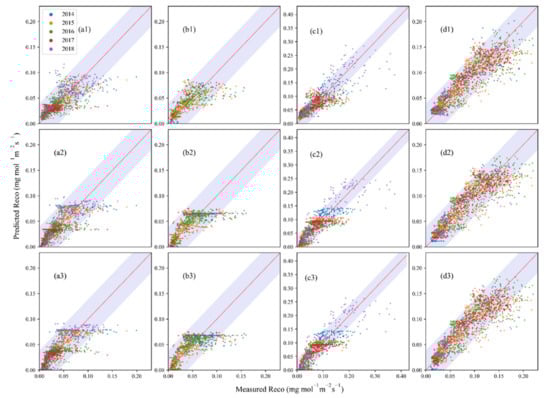
Figure 5.
Performance of three temperature-only models at the four grasslands in different years. (a1–d1) are for Arrhenius model; (a2–d2) are for logistic model; (a3–d3) are for Gamma model; (a1–a3) are for SHB; (b1–b3) are for DRY; (c1–c3) are for TEMP; (d1–d3) are for MDW. The red solid lines are the 1:1 line. The shaded areas are the envelopes of confidence intervals at 95%.
The simulations from the two models that included soil moisture (the Martin and Concilio models) agreed better with measured Reco than those of temperature-only models, demonstrating that the consideration of soil moisture is necessary when simulating Reco in these water-stressed grasslands, although the Concilio model performed more poorly than temperature only models at MDW (Figure 6). The performance of the Martin model was better than that of the Concilio model in all four ecosystems, as shown by R2, RMSE, and AIC (i.e., higher R2 ranged from 0.57 to 0.81, RMSE ranged from 0.02 to 0.03, and lower AIC ranged from −14608 to −7551) (Table 2); the sum of overestimated and underestimated values of the Martin model (9–16%) were also lower than those of the Concilio model (9–19%) (Table 3). R2, RMSE and AIC of the Martin model and Concilio model were 0.68, 0.02, −11152 and 0.66, 0.02, −11081, respectively, for SHB, 0.57, 0.02, −7569 and 0.54, 0.02, −7524 for DRY, 0.81, 0.02, −14608 and 0.79, 0.02, −14291 at MDW and 0.74, 0.03, −7551 and 0.72, 0.03, −7447 for TEMP.
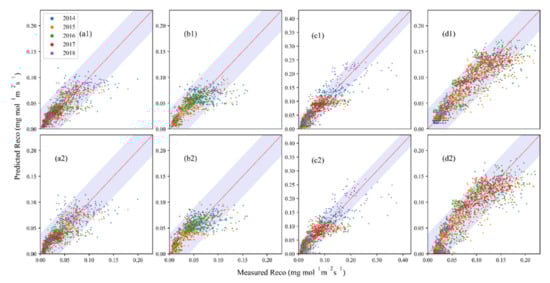
Figure 6.
Performance of soil moisture–included models, including the Martin model (a1–d1) and the Concilio model (a2–d2) at four sites in different years. (a1–a2) are for SHB; (b1–b2) are for DRY; (c1–c2) are for TEMP; and (d1–d2) are for MDW.
The time series model with six parameters (α, β0, β1, β2, β3, β4) includes DOY as an additional variable to simulate ecosystem respiration. Surprisingly, it did not significantly improve performance compared with models including soil moisture (Figure 7), indicating no significant seasonal variations in temperature-moisture regulations at all the four sites. However, compared with the Concilio model, the time series model showed slightly better performance (R2 = 0.80, RMSE = 0.02 AIC = −14533) at MDW (Table 2).
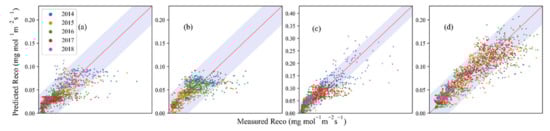
Figure 7.
Performance of time series model at four study sites in different years. (a–d) is for SHB, DRY, TEMP, and MDW, respectively.
4. Discussion
4.1. Driving Factors on Ecosystem Respiration
Ecosystem respiration exhibited a single-peaked seasonal change for meadow, temperate steppe, dry steppe, and shrubland ecosystems in Mongolia, which have been widely reported (e.g., [10]). Relatively high levels of ecosystem respiration occurred during the growing season from May through to August. We found strong exponential relationships between respiration and soil temperature, with 50–79% of the variations in ecosystem respiration explained by soil temperature. The correlation coefficient values were 0.59, 0.67, 0.63, and 0.86 (p < 0.01) for SHB, DRY, TEMP, and MDW, respectively (Figure 8). This exponential relationship between soil temperature and respiration has been widely reported for the majority of terrestrial ecosystems, indicating a predominant role of temperature regulating ecosystem respiration. However, ecosystem respiration began to decrease with soil temperature at high levels, especially at SHB (~19.62 °C), DRY (~16.05 °C), and TEMP (~16.92 °C), which is in agreement with many studies conducted in arid and semi-arid regions [11,13]. A consensus from the literature is that that ecosystem respiration is suppressed by high temperature, at which water stress (i.e., low moisture) is often high due to elevated evapotranspiration [4,5,33,34].
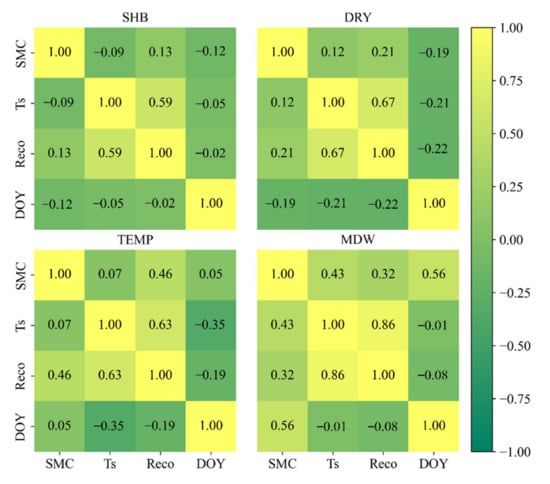
Figure 8.
The correlation coefficient (r) values among variables of soil moisture content (SMC), soil temperature (Ts), day of year (DOY) and ecosystem respiration (Reco) at SHB, DRY, TEMP, and MDW.
In arid and semi-arid regions, water availability is an influencing factor for ecosystem processes [35]. The relationship between respiration and soil moisture was weak, with correlation coefficient values of 0.13, 0.21, 0.46, and 0.32 (p < 0.01) for SHB, DRY, TEMP, and MDW, respectively (Figure 8). Integrating temperature and soil moisture can substantially improve our predictions in all four grassland ecosystems [4]. In semi-arid climates (e.g., lower precipitation), drought may limit the activities of microorganisms [36]. Skopp et al. [37] conducted an incubation experiment and showed that respiration increased with soil moisture up to nearly 0.7 m3 m−3 before declining. In our study, respiration increased with soil moisture at SHB, DRY, and TEMP, but not at MDW (Figure 2), suggesting that site-specific models are needed when considering moisture and other drivers in the models. Soil moisture during the growing season was fond to be consistently high, often exceeding 0.6 m3 m−3 in 2014 at site MDW, although the respiration was slightly lower in 2014 than in other years. This may be because higher soil moisture slowed oxygen diffusion and limited anaerobic decomposition [38,39].
In this study, the temperature sensitivity of respiration was relatively low at moisture-limited sites, except at MDW. On one hand, low soil moisture may limit respiration by constraining root and microbial activities; on the other hand, the diffusion of soluble substrates may be limited during dry seasons [40]. When respiration was overestimated or underestimated, the soil temperature values were often higher than the threshold point of temperature at the target site in our study grasslands. Because the increase in soil temperature will cause a decrease in soil moisture due to elevated evapotranspiration (i.e., water loss from the soils), the reduced soil moisture will restrain respiration by declining the interaction between microbial and substrate and by causing dormancy and/or death of microorganisms [41].
A previous study showed that DOY affected the relationship between soil respiration and soil temperature when soil temperature was >19 °C [11]. Due to changes in plant phenology, time is an important explanatory variable in the respiration model [6]. Root phenology might also play an important role in the relationship between respiration and soil temperature [7,8,11,42]. Many studies have shown the differences in temporal variability between heterotrophic and autotrophic respiration [43,44]. In our study, however, the correlation between respiration and DOY was weak (r value of −0.02, −0.22, −0.19, and −0.08 at SHB, DRY, TEMP, and MDW, respectively) (Figure 8). The introduction of DOY into the time series model did not significantly improve the accuracy of simulated respiration. This means root-growth phenology did not play a great role in respiration in our study regions, which is consistent with the results reported in previous research showing that no seasonal lag existed in grassland ecosystems [35,45].
4.2. Model Performance and Uncertainty
Our first finding in this study is that selecting the right algorithms for modeling respiration is crucial. A strong exponential relationship between respiration and soil temperature was apparent at SHB and TEMP, suggesting that a simple exponential model can be reliably applied. The Arrhenius model has been widely used to model respiration from soil temperature, with only two parameters [6]. However, it cannot be correct in high temperatures because it does not allow respiration to decrease [46]. The logistic model, which is symmetric to the inflection point, can predict respiration that may be constrained by water stress because of its sigmoid property [47]. Although effective under various conditions and for many ecosystems, the predicted accuracy of these two models was affected by the inhibition of respiration exceeding temperature optima [48]. The Gamma model can take on the shape of the above two models and allows respiration to decrease when the temperature exceeds a threshold point [16]. Even though they have been widely used in previous studies, these three models did not perform well in our study, because they only describe the response of respiration to soil temperature. In general, it seemed that respiration did not increase exponentially with soil temperature when soil moisture became a constraining factor [49]. To overcome this problem, a log linear model was developed for multiple variables, which contains a parabolic function for temperature and an interaction term of temperature and soil moisture [9]. The Martin model performed best among the six models in our study (R2 varied from 0.567 to 0.806, RMSE ranged from 0.016 to 0.03 and AIC ranged from −14,608 to −7551). Concilio et al. [33] also employed a regression model that incorporated both soil temperature and soil moisture, which showed a better performance than Ts-only models. The inclusion of soil moisture and the T·θ term in the respiration model substantially increased the R2 value and decreased the RMSE and AIC values in all four ecosystems [50]. Finally, DOY is also a crucial factor because the changes in plant phenology may affect respiration [6]. To adjust the respiration sensitivity to soil temperature, soil moisture and DOY were incorporated into the respiration model [11]. However, the time series model did not improve the performance compared to moisture-included models, which means DOY is not the main factor affecting the ecosystem respiration in our study areas. The sum of overestimated and underestimated values accounted for 11–18%, 10–18%, and 11–18% of the measurements using the Arrhenius, logistic, and Gamma models, respectively, with the lowest percentage found at SHB (Table 3). The proportions of overestimated and underestimated values were 9–16% with the Martin model, and 9–19% with the Concilio model; and those from the time series model were 10–16% (Table 3), with the lowest percentage found at SHB. The ecosystem respiration estimated from all six models was always underestimated at high observed values (Figure 5, Figure 6 and Figure 7). There are three possible reasons for this. First, some high ecosystem respiration values may be caused by atmospheric turbulence rather than ecological process [51]. Second, we constructed our models with half-hourly data that were processed through a series of data processing (e.g., coordinate rotation, air density fluctuation, u* filtering). As a result, the measured values are not continuous, which may not fully reflect the extreme weather events influencing ecosystem respiration that occurred during this period [52]. Third, the temporal and spatial variations of ecosystem respiration were affected by productivity and site structure [53]. According to a previous study, the RMSE of the models in this study (0.02–0.03) is lower than that of the widely used gap-filling techniques (1.75–2.36), e.g., the look-up table (LUT), marginal distribution sampling (MDS), etc. [54], which means the models we used can make up the missing data to a certain extent, especially at MDW.
Although the models we selected can explain 50–80% of the variation of ecosystem respiration, this study indicates that respiration is affected interactively by many other factors. Since the nature of these interactions is not clear, it is necessary to incorporate other variables, such as production, canopy photosynthesis, litter depth, etc. [4,5,7,8]. For example, soil respiration is the largest component of ecosystem respiration, which may also be strongly affected by other factors such as soil organic carbon, photosynthesis, litter input, and root biomass [8,11,55]. The main control factors affecting ecosystem respiration of grassland ecosystems, and the feedback mechanism between them and climate factors still require further study. Finally, we may consider other biophysical models [4], and other empirical or semi-empirical models such as those applied in machine learning [56].
5. Conclusions
We applied six widely used models (Arrhenius, logistic, Gamma, Martin, Concilio, and time series models) for simulating ecosystem respiration (Reco) in four grassland ecosystems in Central Mongolia. Our results showed that soil moisture–included models simulated Reco in all four grasslands fairly well, with the Martin model performing best (R2 of 0.57–0.81; RMSE of 0.02–0.03). These models achieved good performance for approximately 50–80% of the simulations. At MDW, where water stress is less pronounced, there was no significant difference among the six models (R2 of 0.79–0.81). The exponential relationships between respiration and soil temperature no longer exist when soil temperature exceeds a certain value (~19.62 °C at SHB, ~16.05 °C at DRY, ~16.92 °C at TEMP, ~15.03 °C at MDW), which is often coupled with low soil moisture. In our study, we found that soil temperature and soil moisture are two crucial factors that affect the variation of respiration. The time-series model did not improve the accuracy of respiration simulations except at the MDW site. In sum, no single model performs best for all four grassland types, while each model appears suitable for at least one type of ecosystem. Overall, Reco can be reliably and best simulated with the Martin model, which integrates soil temperature and moisture for these dominant grasslands in the region. Nevertheless, our models have a confidence level of up to 80%. Future studies may be needed to investigate other biological (e.g., phenology) and physical (e.g., grazing) factors, and soil properties, either by advancing these models, or by using machine learning.
Author Contributions
Conceptualization, J.C. and X.L.; methodology, H.Z.; software, H.Z.; validation, H.Z.; formal analysis, H.Z.; investigation, H.Z., M.D. and Q.Z.; data curation, C.S. and G.D.; writing—original draft preparation, H.Z.; writing—review and editing, H.Z.; visualization, H.Z.; supervision, J.C. and X.L.; project administration, X.L.; funding acquisition, X.L. All authors have read and agreed to the published version of the manuscript.
Funding
This research was funded by National Key Research and Development Program of China, grant number 2018YFC1406906).
Institutional Review Board Statement
Not applicable.
Informed Consent Statement
Not applicable.
Data Availability Statement
No new data were created or analyzed in this study. Data sharing is not applicable to this article.
Conflicts of Interest
The authors declare no conflict of interest.
References
- Johnston, A.S.A.; Meade, A.; Ardö, J.; Arriga, N.; Black, A.; Blanken, P.D.; Bonal, D.; Brümmer, C.; Cescatti, A.; Dušek, J.; et al. Temperature thresholds of ecosystem respiration at a global scale. Nat. Ecol. Evol. 2021, 5, 487–494. [Google Scholar] [CrossRef] [PubMed]
- Davidson, E.A.; Janssens, I.A.; Luo, Y. On the variability of respiration in terrestrial ecosystems: Moving beyond Q10. Glob. Chang. Biol. 2006, 12, 154–164. [Google Scholar] [CrossRef]
- Ryan, M.G.; Law, B.E. Interpreting, measuring, and modeling soil respiration. Biogeochemistry 2005, 73, 3–27. [Google Scholar] [CrossRef]
- Chen, J. Biophysical Models and Applications in Ecosystem Analysis; Higher Education and MSU Press: Beijing, China, 2021. [Google Scholar]
- Luo, Y.; Zhou, X. Soil Respiration and the Environment. In Soil Respiration and the Environment; Luo, Y., Zhou, X., Eds.; Academic Press: Burlington, MA, USA, 2006; pp. 257–305. [Google Scholar]
- Richardson, A.D.; Braswell, B.H.; Hollinger, D.Y.; Burman, P.; Davidson, E.A.; Evans, R.S.; Flanagan, L.B.; Munger, J.W.; Savage, K.; Urbanski, S.P.; et al. Comparing simple respiration models for eddy flux and dynamic chamber data. Agric. For. Meteorol. 2006, 141, 219–234. [Google Scholar] [CrossRef]
- Deforest, J.L.; Noormets, A.; Mcnulty, S.G.; Sun, G.; Tenney, G.; Chen, J. Phenophases alter the soil respiration–temperature relationship in an oak-dominated forest. Int. J. Biometeorol. 2006, 51, 135–144. [Google Scholar] [CrossRef] [PubMed]
- Deforest, J.L.; Chen, J.; Mcnulty, S.G. Leaf litter is an important mediator of soil respiration in an oak-dominated forest. Int. J. Biometeorol. 2009, 53, 127–134. [Google Scholar] [CrossRef]
- Martin, J.G.; Bolstad, P.V.; Ryu, S.-R.; Chen, J. Modeling soil respiration based on carbon, nitrogen, and root mass across diverse Great Lake forests. Agric. For. Meteorol. 2009, 149, 1722–1729. [Google Scholar] [CrossRef]
- Nakano, T.; Nemoto, M.; Shinoda, M. Environmental controls on photosynthetic production and ecosystem respiration in semi-arid grasslands of Mongolia. Agric. For. Meteorol. 2008, 148, 1456–1466. [Google Scholar] [CrossRef]
- Xu, J.Y.; Chen, J.Q.; Brosofske, K.; Li, Q.L.; Weintraub, M.; Henderson, R.; Wilske, B.; John, R.; Jensen, R.; Li, H.T.; et al. Influence of timber harvesting alternatives on forest soil respiration and its biophysical regulatory factors over a 5-year period in the Missouri Ozarks. Ecosystems 2011, 14, 1310–1327. [Google Scholar] [CrossRef]
- Law, B.E.; Ryan, M.G.; Anthoni, P.M. Seasonal and annual respiration of a ponderosa pine ecosystem. Glob. Chang. Biol. 1999, 5, 169–182. [Google Scholar] [CrossRef] [Green Version]
- Ma, S.Y.; Chen, J.Q.; Butnor, J.R.; North, M.; Euskirchen, E.S.; Oakley, B. Biophysical controls on soil respiration in the dominant patch types of an old-growth, mixed-conifer forest. For. Sci. 2005, 51, 221–232. [Google Scholar]
- Lloyd, J.; Taylor, J.A. On the temperature dependence of soil respiration. Funct. Ecol. 1994, 8, 315–323. [Google Scholar] [CrossRef]
- Barr, A.G.; Griffis, T.J.; Black, T.A.; Lee, X.; Staebler, R.M.; Fuentes, J.D.; Chen, Z.; Morgenstern, K. Comparing the carbon budgets of boreal and temperate deciduous forest stands. Can. J. For. Res. 2002, 32, 813–822. [Google Scholar] [CrossRef] [Green Version]
- Khomik, M.; Arain, M.A.; Liaw, K.-L.; McCaughey, J.H. Debut of a flexible model for simulating soil respiration–soil temperature relationship: Gamma model. J. Geophys. Res. 2009, 114. [Google Scholar] [CrossRef]
- Gulledge, J.; Schimel, J.P. Controls on soil carbon dioxide and methane fluxes in a variety of taiga forest stands in Interior Alaska. Ecosystems 2000, 3, 269–282. [Google Scholar] [CrossRef]
- Reichstein, M.; Tenhunen, J.D.; Roupsard, O.; Ourcival, J.M.; Rambal, S.; Dore, S.; Valentini, R. Ecosystem respiration in two Mediterranean evergreen Holm Oak forests: Drought effects and decomposition dynamics. Funct. Ecol. 2002, 16, 27–39. [Google Scholar] [CrossRef] [Green Version]
- Lee, M.-S.; Nakane, K.; Nakatsubo, T.; Mo, W.-H.; Koizumi, H. Effects of rainfall events on soil CO2 flux in a cool temperate deciduous broad-leaved forest. Ecol. Res. 2002, 17, 401–409. [Google Scholar] [CrossRef]
- Besnard, S.; Carvalhais, N.; Arain, M.A.; Black, A.; Brede, B.; Buchmann, N.; Chen, J.; Clevers, J.G.P.W.; Dutrieux, L.P.; Gans, F.; et al. Memory effects of climate and vegetation affecting net ecosystem CO2 fluxes in global forests. PLoS ONE 2019, 14, e0211510. [Google Scholar] [CrossRef] [Green Version]
- Richardson, A.D.; Hollinger, D.Y. Statistical modeling of ecosystem respiration using eddy covariance data: Maximum likelihood parameter estimation, and Monte Carlo simulation of model and parameter uncertainty, applied to three simple models. Agric. For. Meteorol. 2005, 131, 191–208. [Google Scholar] [CrossRef]
- Wutzler, T.; Lucas-Moffat, A.; Migliavacca, M.; Knauer, J.; Sickel, K.; Šigut, L.; Menzer, O.; Reichstein, M. Basic and extensible post-processing of eddy covariance flux data with REddyProc. Biogeosciences 2018, 15, 5015–5030. [Google Scholar] [CrossRef] [Green Version]
- Chen, J.; John, R.; Zhang, Y.; Shao, C.; Brown, D.G.; Batkhishig, O.; Amarjargal, A.; Ouyang, Z.; Dong, G.; Wang, D.; et al. Divergences of two coupled human and natural systems on the Mongolian Plateau. BioScience 2015, 65, 559–570. [Google Scholar] [CrossRef] [Green Version]
- Shao, C.; Chen, J.; Chu, H.; Lafortezza, R.; Dong, G.; Abraha, M.; Batkhishig, O.; John, R.; Ouyang, Z.; Zhang, Y.; et al. Grassland productivity and carbon sequestration in Mongolian grasslands: The underlying mechanisms and nomadic implications. Environ. Res. 2017, 159, 124–134. [Google Scholar] [CrossRef] [PubMed]
- John, R.; Chen, J.; Giannico, V.; Park, H.; Xiao, J.; Shirkey, G.; Ouyang, Z.; Shao, C.; Lafortezza, R.; Qi, J. Grassland canopy cover and aboveground biomass in Mongolia and Inner Mongolia: Spatiotemporal estimates and controlling factors. Remote Sens. Environ. 2018, 213, 34–48. [Google Scholar] [CrossRef]
- Qu, L.; Chen, J.; Dong, G.; Shao, C. Heavy mowing enhances the effects of heat waves on grassland carbon and water fluxes. Sci. Total Environ. 2018, 627, 561–570. [Google Scholar] [CrossRef] [PubMed]
- Giannico, V.; Chen, J.; Shao, C.; Ouyang, Z.; John, R.; Lafortezza, R. Contributions of landscape heterogeneity within the footprint of eddy-covariance towers to flux measurements. Agric. For. Meteorol. 2018, 260–261, 144–153. [Google Scholar] [CrossRef]
- Wilczak, J.M.; Oncley, S.P.; Stage, S.A. Sonic anemometer tilt correction algorithms. Bound.-Layer Meteorol. 2001, 99, 127–150. [Google Scholar] [CrossRef]
- Webb, E.K.; Pearman, G.I.; Leuning, R. Correction of flux measurements for density effects due to heat and water-vapor transfer. Q. J. R. Meteorol. Soc. 1980, 106, 85–100. [Google Scholar] [CrossRef]
- Zhu, Z.; Sun, X.; Wen, X.; Zhou, Y.; Tian, J.; Yuan, G. Study on the processing method of nighttime CO2 eddy covariance flux data in ChinaFLUX. Sci. China Ser. D Earth Sci. 2006, 49, 36–46. [Google Scholar] [CrossRef]
- Gorsel, E.V.; Delpierre, N.; Leuning, R.; Black, A.; Munger, J.W.; Wofsy, S.; Aubinet, M.; Feigenwinter, C.; Beringer, J.; Bonal, D.; et al. Estimating nocturnal ecosystem respiration from the vertical turbulent flux and change in storage of CO2. Agric. For. Meteorol. 2009, 149, 1919–1930. [Google Scholar] [CrossRef]
- Görres, C.M.; Kammann, C.; Ceulemans, R. Automation of soil flux chamber measurements: Potentials and pitfalls. Biogeosci. Discuss. 2015, 12, 14693–14738. [Google Scholar] [CrossRef] [Green Version]
- Concilio, A.; Ma, S.; Li, Q.; LeMoine, J.; Chen, J.; North, M.; Moorhead, D.; Jensen, R. Soil respiration response to prescribed burning and thinning in mixed-conifer and hardwood forests. Can. J. For. Res. 2005, 35, 1581–1591. [Google Scholar] [CrossRef]
- Lai, L.; Zhao, X.; Jiang, L.; Wang, Y.; Luo, L.; Zheng, Y.; Chen, X.; Rimmington, G.M. Soil respiration in different agricultural and natural ecosystems in an arid region. PLoS ONE 2012, 7, e48011. [Google Scholar] [CrossRef] [PubMed]
- Roby, M.C.; Scott, R.L.; Barron-Gafford, G.A.; Hamerlynck, E.P.; Moore, D.J.P. Environmental and vegetative controls on soil CO2 efflux in three semiarid ecosystems. Soil Syst. 2019, 3, 6. [Google Scholar] [CrossRef] [Green Version]
- Drake, J.E.; Oishi, A.C.; Giasson, M.-A.; Oren, R.; Johnsen, K.H.; Finzi, A.C. Trenching reduces soil heterotrophic activity in a loblolly pine (Pinus taeda) forest exposed to elevated atmospheric [CO2] and N fertilization. Agric. For. Meteorol. 2012, 165, 43–52. [Google Scholar] [CrossRef]
- Skopp, J.; Jawson, M.D.; Doran, J.W. Steady-State aerobic microbial activity as a function of soil water content. Soil Sci. Soc. Am. J. 1990, 54, 1619–1625. [Google Scholar] [CrossRef] [Green Version]
- Davidson, E.A.; Janssens, I.A. Temperature sensitivity of soil carbon decomposition and feedbacks to climate change. Nature 2006, 440, 165–173. [Google Scholar] [CrossRef]
- Oikawa, P.Y.; Grantz, D.A.; Chatterjee, A.; Eberwein, J.E.; Allsman, L.A.; Jenerette, G.D. Unifying soil respiration pulses, inhibition, and temperature hysteresis through dynamics of labile soil carbon and O2. J. Geophys. Res. Biogeosci. 2014, 119, 521–536. [Google Scholar] [CrossRef]
- Yan, T.; Song, H.; Wang, Z.; Teramoto, M.; Wang, J.; Liang, N.; Ma, C.; Sun, Z.; Xi, Y.; Li, L.; et al. Temperature sensitivity of soil respiration across multiple time scales in a temperate plantation forest. Sci. Total Environ. 2019, 688, 479–485. [Google Scholar] [CrossRef]
- Yu, X.; Zha, T.; Pang, Z.; Wu, B.; Wang, X.; Chen, G.; Li, C.; Cao, J.; Jia, G.; Li, X.; et al. Response of soil respiration to soil temperature and moisture in a 50-year-old oriental arborvitae plantation in China. PLoS ONE 2011, 6, e28397. [Google Scholar] [CrossRef]
- Asensio, D.; Peñuelas, J.; Llusià, J.; Ogaya, R.; Filella, I. Interannual and interseasonal soil CO2 efflux and VOC exchange rates in a Mediterranean holm oak forest in response to experimental drought. Soil Biol. Biochem. 2007, 39, 2471–2484. [Google Scholar] [CrossRef]
- Högberg, P.; Nordgren, A.; Buchmann, N.; Taylor, A.F.S.; Ekblad, A.; Högberg, M.N.; Nyberg, G.; Ottosson-Löfvenius, M.; Read, D.J. Large-Scale forest girdling shows that current photosynthesis drives soil respiration. Nature 2001, 411, 789–792. [Google Scholar] [CrossRef] [PubMed]
- Lee, M.-S.; Nakane, K.; Nakatsubo, T.; Koizumi, H. Seasonal changes in the contribution of root respiration to total soil respiration in a cool-temperate deciduous forest. Plant. Soil 2003, 255, 311–318. [Google Scholar] [CrossRef]
- Vargas, R.; Baldocchi, D.D.; Allen, M.F.; Bahn, M.; Black, T.A.; Collins, S.L.; Yuste, J.C.; Hirano, T.; Jassal, R.S.; Pumpanen, J.; et al. Looking deeper into the soil: Biophysical controls and seasonal lags of soil CO2 production and efflux. Ecol. Appl. 2010, 20, 1569–1582. [Google Scholar] [CrossRef] [PubMed]
- Tuomi, M.; Vanhala, P.; Karhu, K.; Fritze, H.; Liski, J. Heterotrophic soil respiration—Comparison of different models describing its temperature dependence. Ecol. Model. 2008, 211, 182–190. [Google Scholar] [CrossRef]
- Rodeghiero, M.; Cescatti, A. Main determinants of forest soil respiration along an elevation/temperature gradient in the Italian Alps. Glob. Chang. Biol. 2005, 11, 1024–1041. [Google Scholar] [CrossRef]
- Scandellari, F.; Zanotelli, D.; Ceccon, C.; Bolognesi, M.; Montagnani, L.; Cassol, P.; Melo, G.W.; Tagliavini, M. Enhancing prediction accuracy of soil respiration in an apple orchard by integrating photosynthetic activity into a temperature-related model. Eur. J. Soil Biol. 2015, 70, 77–87. [Google Scholar] [CrossRef] [Green Version]
- Chang, C.T.; Sabaté, S.; Sperlich, D.; Poblador, S.; Sabater, F.; Gracia, C. Does soil moisture overrule temperature dependence of soil respiration in Mediterranean riparian forests? Biogeosciences 2014, 11, 6173–6185. [Google Scholar] [CrossRef] [Green Version]
- Euskirchen, E.S.; Chen, J.; Gaustafson, E.J.; Ma, S. Soil respiration at dominant patch types within a managed northern Wisconsin landscape. Ecosystems 2003, 6, 595–607. [Google Scholar] [CrossRef]
- Gu, L.; Baldocchi, D.; Verma, S.B.; Black, T.A.; Vesala, T.; Falge, E.M.; Dowty, P.R. Advantages of diffuse radiation for terrestrial ecosystem productivity. J. Geophys. Res. Atmos. 2002, 107, ACL-2. [Google Scholar] [CrossRef] [Green Version]
- Zhu, X.; He, H.; Ma, M.; Ren, X.; Zhang, L.; Zhang, F.; Li, Y.; Shi, P.; Chen, S.; Wang, Y.; et al. Estimating ecosystem respiration in the grasslands of northern China using machine learning: Model evaluation and comparison. Sustainability 2020, 12, 2099. [Google Scholar] [CrossRef] [Green Version]
- Migliavacca, M.; Reichstein, M.; Richardson, A.D.; Colombo, R.; Sutton, M.A.; Lasslop, G.; Tomelleri, E.; Wohlfahrt, G.; Carvalhais, N.; Cescatti, A.; et al. Semiempirical modeling of abiotic and biotic factors controlling ecosystem respiration across eddy covariance sites. Glob. Chang. Biol. 2011, 17, 390–409. [Google Scholar] [CrossRef]
- Moffat, A.M.; Papale, D.; Reichstein, M.; Hollinger, D.Y.; Richardson, A.D.; Barr, A.G.; Beckstein, C.; Braswell, B.H.; Churkina, G.; Desai, A.R.; et al. Comprehensive comparison of gap-filling techniques for eddy covariance net carbon fluxes. Agric. For. Meteorol. 2007, 147, 209–232. [Google Scholar] [CrossRef]
- Raich, J.W.; Schlesinger, W.H. The global carbon dioxide flux in soil respiration and its relationship to vegetation and climate. Tellus B 1992, 44, 81–99. [Google Scholar] [CrossRef] [Green Version]
- Camps-Valls, G.; Tuia, D.; Zhu, X.X.; Reichstein, M. Deep Learning for the Earth Sciences: A Comprehensive Approach to Remote Sensing, Climate Science and Geosciences; John Wiley & Sons: Hoboken, NJ, USA, 2021. [Google Scholar]
Publisher’s Note: MDPI stays neutral with regard to jurisdictional claims in published maps and institutional affiliations. |
© 2022 by the authors. Licensee MDPI, Basel, Switzerland. This article is an open access article distributed under the terms and conditions of the Creative Commons Attribution (CC BY) license (https://creativecommons.org/licenses/by/4.0/).