1. Introduction
The development of cities has always been a key topic within the field of urban economics [
1]. In the face of increasing marketization and globalization, cities are facing tremendous competitive pressure across the world. In order to take advantage of structural adjustments in global trade and the industrial division of labor, more and more countries are choosing to adopt the location-oriented policy of establishing development zones (DZs) [
2]. DZs are usually delineated areas within a city that provide special incentives to introduce advanced technologies and absorb foreign investments, with the ultimate aim of stimulating economic development and increasing income levels [
3]. According to the different types of economic activities that occur within them, DZs have been given different names, including “bonded zones”, “export processing zones”, “economic and technological development zones”, or “science and technology parks” [
4]. Regardless of their label, however, they all have similar goals with respect to increasing regional competitiveness.
A consensus has not been reached within academic circles regarding the economic effects of DZs [
5]. The preferential policies that are offered to attract investments and stimulate industrial agglomeration and capital accumulation within DZs have been shown to be effective at the regional scale and, thus, as being capable of promoting regional economic growth [
6]. Despite this, the results of empirical studies on the economic benefits of DZs in different countries and regions differ greatly. Some scholars are optimistic about the economic effects of DZs [
7]. For instance, the research by Busso et al. using census and business data found that, in the United States, DZs were effective in increasing local employment and wages [
8]. Similarly, Ambroziak found that the establishment of DZs in poor areas of Poland had a significant role in promoting local economic development [
9]. However, a considerable number of empirical results have shown the opposite—namely, that the establishment of DZs does not aid regional development. For instance, one study from California in the United States showed that the establishment of DZs did not increase local employment [
10]. Similarly, research into Indiana’s DZs also supported this view [
11]. Studies of South Africa have shown that the establishment of DZs did not solve South Africa’s economic development problems, achieving only limited success [
12,
13]. Canadian research has also confirmed that the establishment of DZs does not clearly promote regional employment growth [
14].
For China, the construction of DZs has been an important strategic measure in opening up the country to the rest of the world. In the decades following the establishment of the first batch of DZs in 1984, they have developed rapidly [
15]. By 2018, China had established 2544 DZs, including 552 state-level DZs and 1992 provincial-level DZs (the China Development Zone Audit Announcement Catalogue). While this has led to a number of problems [
16,
17,
18,
19], there is no doubt that DZs have played a pivotal role as a growth pole driving China’s rapid economic growth [
20]. DZs are important spatial policies with respect to China’s industrialization and urbanization; they are also closely related to the surrounding cities and the regions in which they are located [
21,
22]. Especially in the context of new urbanization, the relationship between DZs and cities has become an important research topic in urban economics. New urbanization is a regional development strategy proposed by the Chinese government in recent years that aims to improve the quality of urbanization and achieve sustainable development. Investigating the interactive relationship between DZs and cities is of great significance to promote regional coordination and achieve new urbanization strategies [
23].
The research has found that the host city plays an incentive and support role in the formation and development of DZs. The development of DZs cannot be separated from the resource and environmental backgrounds of the region and the social and economic foundations provided by the host city [
24]. The city’s traffic accessibility, industrial structure characteristics, economic development vitality, and urban environmental quality all have a profound impact on the development of a DZ [
25]. Especially in the site selection stage, the influence of the city that will host the DZ is significant [
26]. As a special policy area, the DZ can make a far-reaching effect on the surrounding areas. The academic community summarizes this effect as the diffusion effect and polarization effect [
27]. Some scholars believe that a DZ, as a regional growth pole of a city, can bring about polarization effects whereby they deprive the host city of development opportunities [
28]. However, other scholars believe that, while attracting large amounts of foreign direct investments, China’s DZs also bring knowledge spillover effects to their surrounding areas [
29].
While abundant studies exist with respect to the relationship between DZs and their host cities, such research has tended to focus independently on either DZs or host cities. When addressing the relationship between the two, research has mainly considered the influence of the DZ on the city; studies on the influence of the city on the DZ are, as a result, scarce. In addition, most of the existing studies are case studies, lacking general research on laws. To fill the above knowledge gaps, this paper constructs an econometric analysis framework and investigates the causal relationship between DZs and their surrounding host cities (SHCs). Its results reveal not only the spillover effect of the DZ on the SHC but also identifies a supporting role with respect to the SHC’s influence on the DZ. This research points to clarifying our views of the correlation between DZ construction and central city development and to providing a theoretical reference that can aid in achieving the mutually beneficial interactive development of DZs and cities.
2. Theoretical Support and Mechanism Analysis
For China, the goal of establishing a DZ is to attract foreign investments and introduce advanced technology and management experience. After decades of development, the economic vitality and output of a DZ represents the highest level of its host city. Therefore, we regard the DZ as the “growth pole” of a city. The Growth Pole Theory proposed by Perroux and the Core and Periphery Theory proposed by Friedman can explain the interactive relationship between a DZ and the SHC.
French economist Perroux put forward the Growth Pole Theory in the 1950s. He believes that the growth pole is a center of economic activity formed by the agglomeration of a leading sector or innovative enterprises. The growth pole has polarization and spillover effects in the process of regional economic development. The polarization effect leads to the accumulation of production factors at the growth pole, sacrificing the development of the surrounding areas. Correspondingly, the spillover effect is the diffusion of production factors in the growth pole to the surrounding areas, promoting the development of the surrounding underdeveloped areas.
American planning scholar Friedman put forward the Core and Periphery Theory in his representative book “Regional Development Policy” (1966). He pointed out that development comes from relatively few centers of change. Innovation spreads through these centers to the areas of interaction. The “core area” is the main center of innovation and change, and the “peripheral area” relies on the “core area”. Through multiple feedback effects, such as the dominance effect, information effect, linkage effect, etc., innovation will be diffused from the “core area” to the “peripheral area” and promote the economic growth of the “peripheral area”.
According to the above theories, the growth of a DZ in the forming stage mainly depends on the concentration of the production factors, so it shows a strong polarization effect. Where development opportunities in the region are limited, DZs can also bring about polarization effects whereby they deprive their SHCs of development opportunities. However, the DZ also conducts technical exchanges with the host city in the development process. Through the combined effect of access standards, elimination mechanisms, and agglomeration effects, a group of enterprises with higher productivity also tend to concentrate in DZs, resulting in the spillover effect [
30,
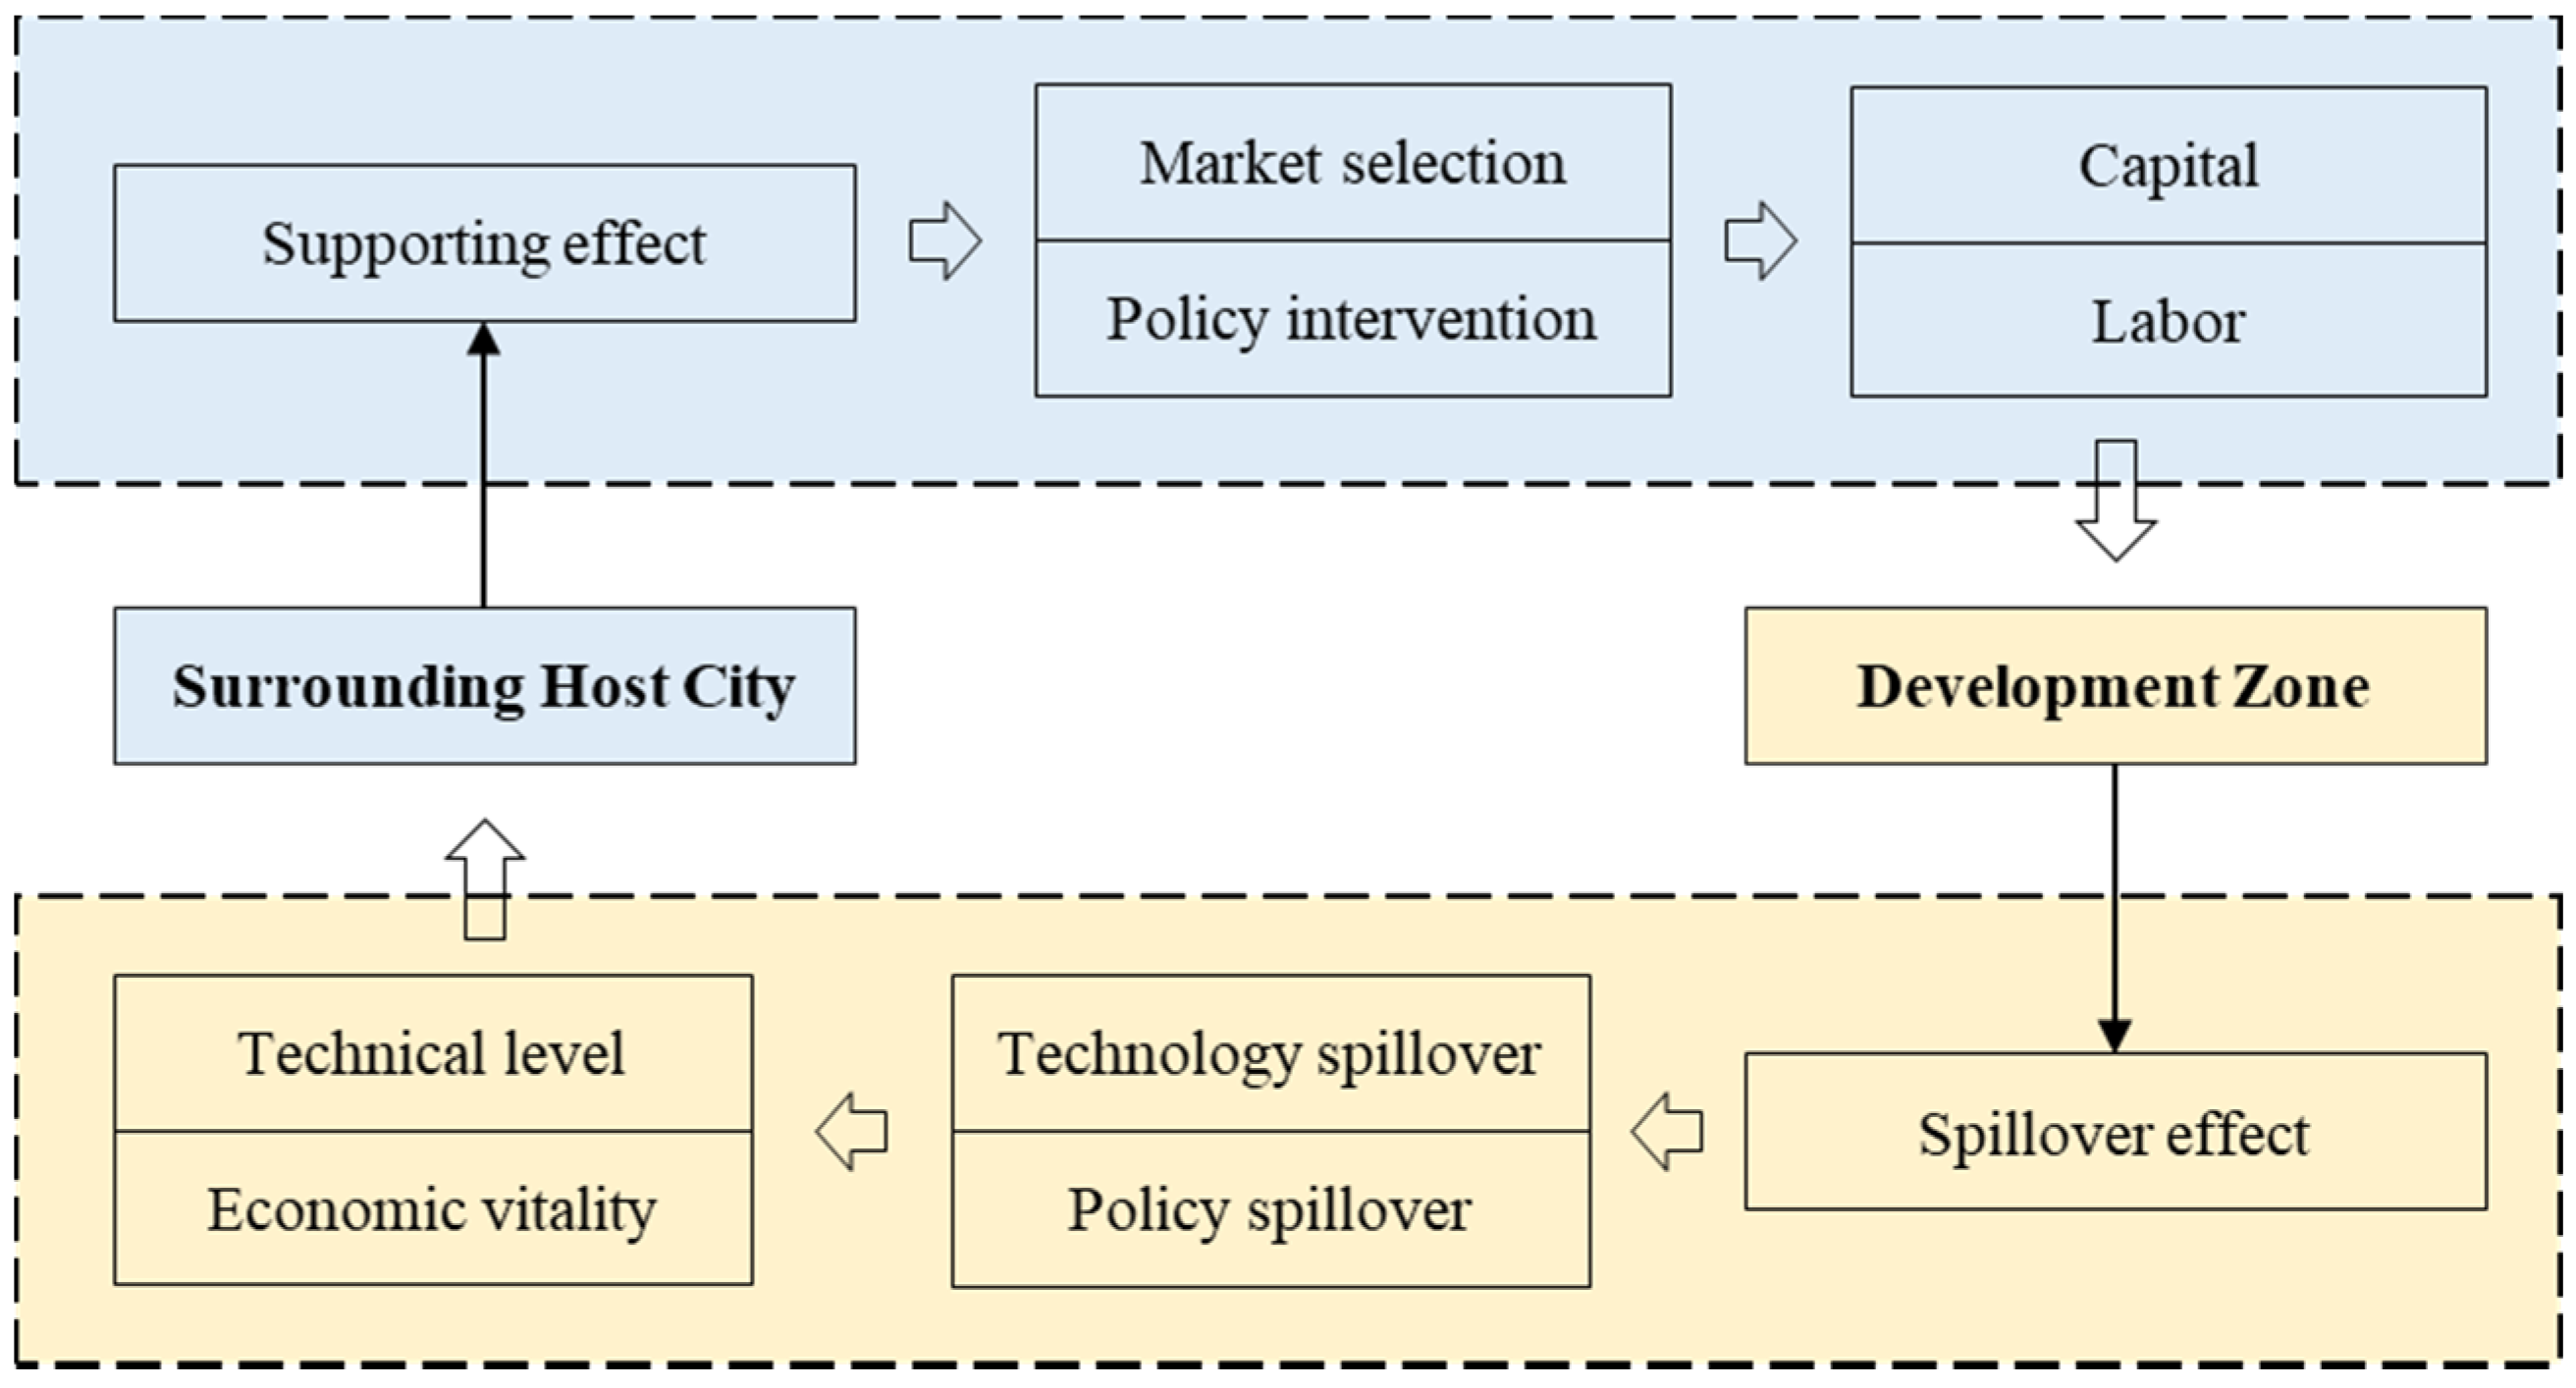
31]. When the DZ matures, it will begin to provide economic back-feeding to the SHC. Based on the development logic of the DZ, we believe that the interactive relationship between the DZ and the SHC is dynamic and has phase characteristics. In this process, the SHC provides an impetus for the development of the DZ, and the DZ has spillover and radiation effects on the development of the SHC.
The SHC provides a supporting effect on the development of the DZ through market selection and policy intervention. The creation of a suitable market environment in host cities is of great significance to the allocation of production factors in DZs. Since market selection cannot achieve the accumulation of production factors in a short period of time, it needs government policy promotion. Especially for China, the establishment of DZs has obvious policy interventions. First, the government provides preferential policies to guide foreign capital and multinational enterprises to invest in the DZ [
32]. Second, the SHC carries out a series of institutional reforms to promote the free flow of production factors between the host city and the DZ. Third, the SHC government formulates access standards and elimination mechanisms to make real-time adjustments to enterprises in the DZ [
33].
The DZ will also affect the development of the SHC through spillover effects. On the one hand, the DZ promotes the improvement of the technical level of the SHC through technology spillover effects [
34]. On the other hand, the SHC has to learn DZ’s efficient management model, which greatly improves the economic vitality of the host city [
35]. The further growth of the host city requires reconfiguration of the production factors. At this stage, the production factors such as capital and labor flow in two directions between the SHC and the DZ. This paper summarizes the interaction mechanism between the DZ and the SHC (
Figure 1).
3. Data Sources and Methods
3.1. Data Sources
The research object of this article is national economic and technological DZs, which are gradually established, and a considerable part of them were established after 2005. In order to balance the sample size and the research period, this article selected panel data from 2004 to 2018 for analysis. The research sample included 46 national economic and technological DZs. Since Ningbo, Hangzhou, Guangzhou, and Fuzhou each have two DZs, we merged the DZs of these four cities in order to eliminate the impact of cross-analysis. The final research sample comprised 42 national economic and technological DZs. The number of DZs in the eastern, central, and western regions were 22, 9, and 11, respectively (
Table 1).
Adopting an input–output perspective, we used the Malmquist index to evaluate the economic level of the DZs and their HCs. Based on the strategic positioning and development goals of the DZ, this paper selected fixed capital stock (FCS), foreign direct investment (FDI), and total imports (TI) as the input indicators and selected GDP and total exports (TE) as the output indicators. The strategic positioning of the DZ in China is to focus on the industry, foreign investments and exports, and is dedicated to the development of high technology. The GDP can comprehensively reflect the industrial added value and total industrial output value of the DZ. FDI can directly reflect the situation of foreign investment attraction. TE can reflect the DZ’s contribution to foreign exports. FCS and TI can basically represent the development of high-tech industries. Since the FCS cannot be obtained directly, the “perpetual inventory method” is used to estimate the annual FCS in this study. Data on the DZs came from the China Development Zone Yearbook [
36]. In addition, we used statistical yearbooks and statistical bulletins of the relevant DZ to supplement the data. The data for the host city (HC) came from the China City Statistical Yearbook [
37]. Data on the nonzone area of the host city, which we refer to as the “surrounding host city” (SHC), were obtained by subtracting the value of the DZ from the HC.
3.2. Method
3.2.1. Malmquist TFP Index Method
This study selected the Malmquist TFP index method to estimate the economic efficiency of the DZ and its SHC. Compared with the traditional static production efficiency, TFP as the dynamic efficiency can reflect the evolution trend of the production efficiency. The TFP index also has advantages in continuity, accumulation, and cross-cyclicality. Both the data envelopment analysis (DEA) and stochastic frontier analysis (SFA) can be used to evaluate the TFP. The DEA model is more flexible and more effective than the SFA and maintains several advantages when dealing with multiple input and output indicators. Caves first proposed the Malmquist TFP index method based on the DEA [
38]. Färe et al. developed a nonparametric linear programming algorithm based on this [
39], which is expressed as follows:
where
and
are the 2 single periods investment distance functions, and
and
are the 2 inter-period investment distance functions. A TFP value greater than 1 indicates that the comprehensive efficiency has effectively improved; if the index is less than 1, the efficiency has been reduced [
40].
3.2.2. Panel Econometric Methodology
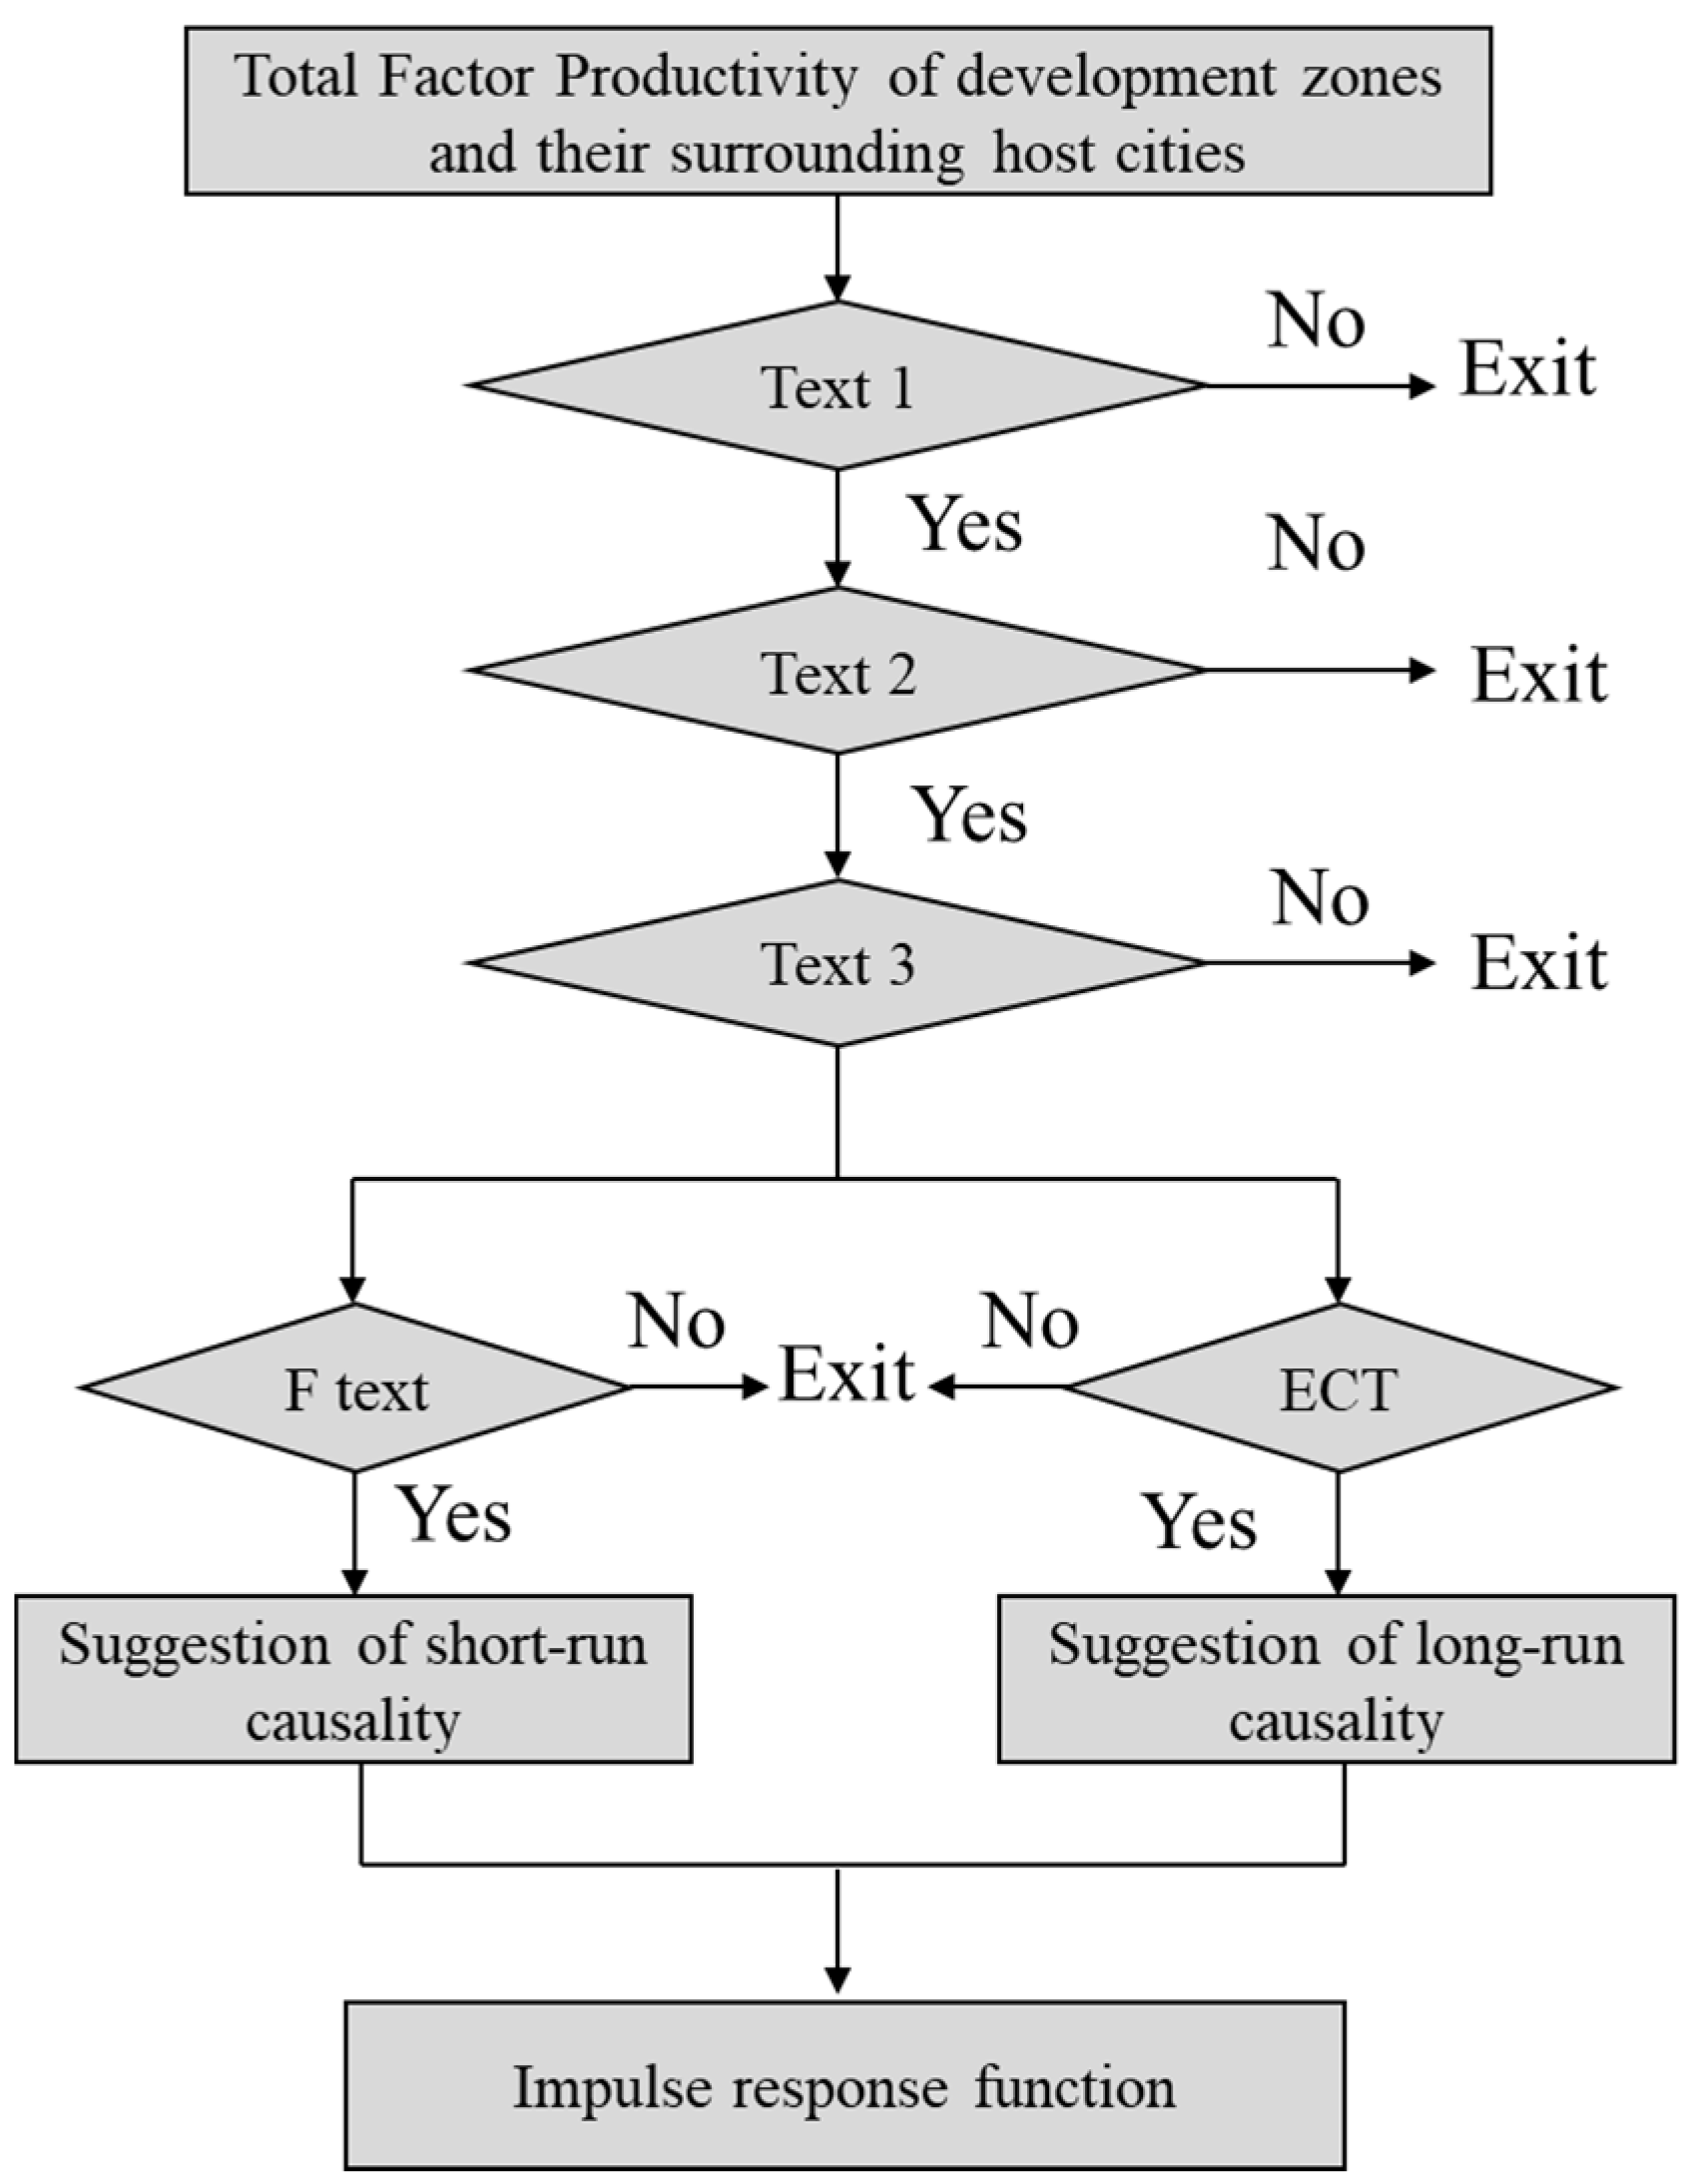
In order to test whether DZs exert external effects on regional economic development and whether the regional economic environment affects the economic growth of DZs, we calculated the TFP of the DZ and the SHC and conducted a causal analysis on the TFP of the development of the DZ and the SHC. Drawing on existing research [
41], the causality test in this paper consisted of the following parts (
Figure 2).
The panel unit root test is widely selected to test the stability of variables to prevent pseudo-regression phenomena [
42,
43]. This research adopted the widely used ADF unit root test method to determine whether the variables were stable [
44]. The ADF test contains several independent unit root tests, and its model is expressed as follows [
45]:
where
is the first-order difference,
is the test variable,
is the column vector of the deterministic variable,
is the column vector of the regression coefficient, and
is the random error. The null hypothesis is that the variables have unit roots.
This article employed the Pedroni panel cointegration test so as to assess the cointegration relationship among the variables [
46]. The cointegration test allowed us to identify whether a long-term stable relationship existed between the TFP of DZs and SHCs. The expression of the model is as follows [
47]:
where
is the test variable,
is the intercept term,
t is time,
m is the number of independent variables, and
is the random error. The null hypothesis is that there is no cointegration relationship among the variables. To test the estimated residuals, we ran the following regression for each group:
Granger causality was first proposed by C. W. J. Granger [
48], and after theoretical improvement [
49,
50], it has been widely adopted to test the causal relationship among variables [
51,
52]. The rationale of the Granger causality test is to define causality from the perspective of prediction. If the variable
X can predict variable
Y, it means that variable
X is the Granger cause of variable
Y. This study introduced a panel Granger causality test to determine the causal relations between the TFP of DZs and their SHCs. If the variables are cointegrated, a Granger causality test can identify the direction of the causal relationship between variables. The Granger causality test can identify short-term causality based on F statistics and long-term causality based on error correction terms (ECT). The expression of model is as follows [
53]:
where
is the first-order difference,
is a constant term,
and
are undetermined parameters,
is the lag length, and
is the white noise error.
The impulse response function can describe the influence of one variable on other variables [
54]. Specifically, when the random disturbance term impacts the model variables, it can have an impact on the current and future values of all the variables in the vector autoregressive model. The expression of the model is as follows [
55]:
where
is innovation, and
is the order of lag. When
changes, the current and future values of
and
in the model will also change.
is the response function of the variable
when a random disturbance item of the variable
is impacted, and
is the response function of the variable
when a random disturbance item of the variable
is impacted.
4. Results and Discussion
4.1. Total Factor Productivity (TFP) of DZs and SHCs
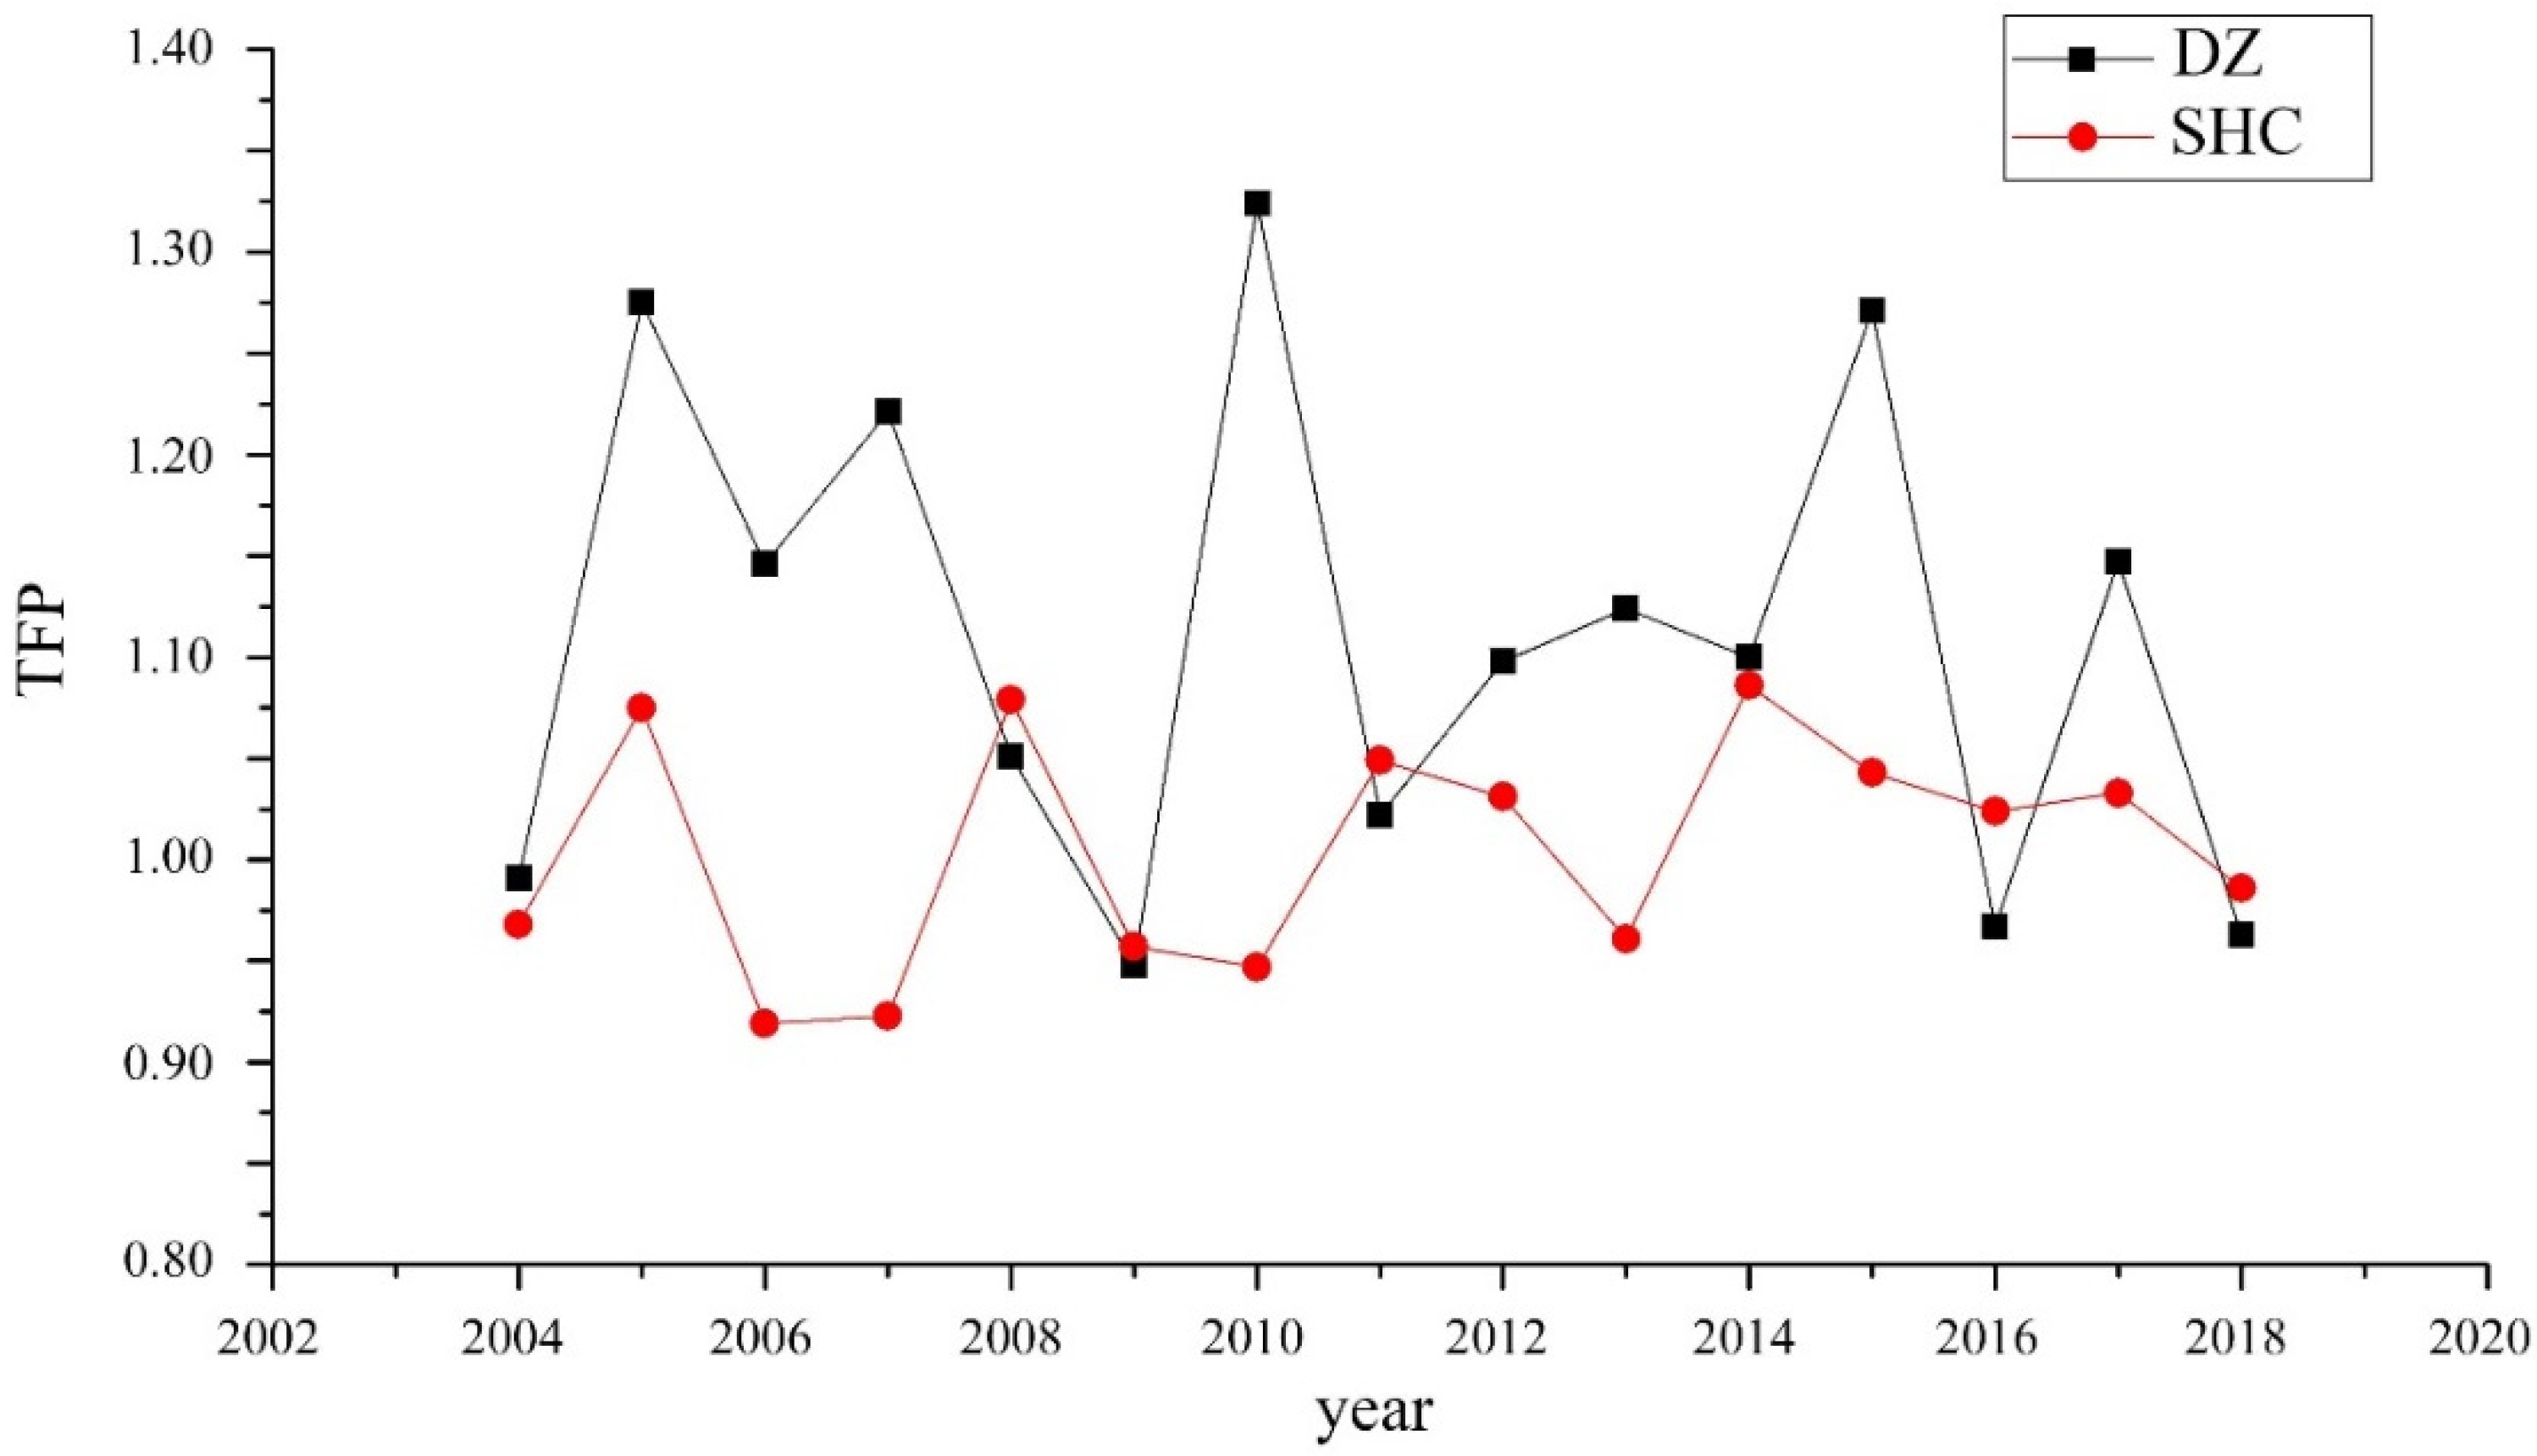
In this study, we selected FAI, FDI, and TI as the input indicators, and GDP and TE were selected as the output indicators to measure the TFP of China’s major national DZs and their surrounding host cities from 2004 to 2018 (
Figure 2). As shown in
Figure 3, the total TFP value of the DZs making up the study sample was found to fluctuate greatly over the course of the study period but generally showed an upward trend. In most years, the DZs maintained a total TFP value greater than 1, with an average of 1.109, which indicates that the efficiency of the DZs greatly improved during the study period. Compared with the TFP values of the DZs, the total TFP value of the SHCs did not maintain as optimistic an outlook. In many years, the SHCs maintained TFP values that were less than 1, indicating that their efficiency declined in these years. On the whole, their average TFP was 1.005, and although the efficiency improved during the study period, to some degree, the rate was relatively small and only 0.5%.
In addition, we divided the TFP values for the DZs and their related SHCs into four panels: namely, the whole country and the eastern, central, and western regions.
Table 2 provides the descriptive statistical results of the data. As shown in
Table 2, the TFP of the DZs was higher than that of the SHCs in each panel, which indicates that, compared with their surrounding cities, the development zones maintained a higher technical level and a more reasonable production scale and allocation of the production factors. The average TFP of DZs in the western region was the highest at 1.243, which means that the efficiency of DZs in the western region has increased by 24.3% annually. In comparison, the average annual growth rate of DZs in the central region was only 3.3%. It is worth mentioning that the variance of the TFP in the DZs in the western region was also the largest.
4.2. Panel Unit Root and Cointegration Test
Before undertaking a causal analysis, this paper performed a unit root test on the panel data to identify the stationarity of the variables. In this study, we used the ADF unit root test method to determine the stationarity of the data. The results are shown in
Table 3. Except for the TFPshc in the eastern region panel, all the other variables passed the 1% significance test, rejecting the null hypothesis with unit roots. This means that most of the variables were stable. After a difference, the TFPshc in the eastern panel also passed the 1% significance test, which indicated that it was stable at the first difference.
After proving the stationarity of all the panel data, we select the Pedroni cointegration test method to test the cointegration relationships among the panel variables.
Table 4 reports the test results of seven cointegration statistics. It can be seen from
Table 4 that the seven cointegration statistics of the whole country and eastern, central, and western region panels all passed the 1% significance test, rejecting the null hypothesis that the variables are cointegrated. There is ample evidence to confirm the TFP of the DZs and that of their SHCs kept a long-term cointegration in all four panels.
4.3. Panel Granger Causality Test
The cointegration test showed a long-run stable relationship among the TFP of the DZs and that of their SHCs. We used a panel Granger causality test method to investigate the causality among the variables. Long-term causality was estimated by the error correction term (ECT) in the panel Granger test, while short-term causality was estimated by the F test of the difference terms. The causality test results are displayed in
Table 5. From the results, we found that the ECT of each panel passed the significance test, which confirms that a long-term causality existed among the TFP of the DZs and that of their SHCs. Specifically, when the explanatory variable deviates from a long-term equilibrium relationship, the explained variable is adjusted quickly to correct the deviation.
In addition to the long-term Granger causality obtained through the ECT, this research also tested the short-run Granger causality between variables (
Table 5). In the whole country and the central region panels, no short-term causality was found among the TFP of the DZs and that of their SHCs. For the whole country panel, we attributed this to the significant differences in the current situations of DZs in the various regions making up the panel. Existing studies have proven that the interactive relationship between the DZ and the SHC has a phase characteristic [
34]. In the early stage of development of the DZ, relying on the preferential policies, the DZ had a strong advantage in the competition for funds, talent, and technical resources. At this stage, the DZ exerted a polarization effect and deprived the development opportunities of the SHC [
56]. When the DZ was mature, its production mode and technical level had comparative advantages compared with the SHC, which drove the upgrading of the SHC’s industrial structure. In addition, while attracting large amounts of foreign direct investment, the DZs also brought knowledge spillover effects to their surrounding areas [
57]. Due to the natural advantages of opening up the eastern region of China, the first batch of DZs in China were all established in the eastern region [
32]. The DZs in the eastern region have taken the lead in realizing capital accumulation, which may exert a spreading effect in relation to the surrounding regions [
58]. In contrast, the DZs in the central and western regions have been established for a short time and have a relatively backwards foundation. These DZs are still in the stage of rapid growth during the research period, which can have a polarizing effect with respect to the surrounding areas. Opposite effects can easily offset each other at the national scale, leading to a lack of short-run causation [
41].
A short-term bidirectional Granger causality was identified among the TFP of the DZs and that of their SHCs in the eastern area. The DZs in this area exhibit a significant spillover effect on the development of their surrounding host city. At the same time, the cities with DZs in the eastern region, such as Beijing, Shanghai, and Guangzhou, have relatively perfect supporting industrial facilities and infrastructures, which play an important role in promoting the further development of the DZs. For example, in order to attract foreign investment, Guangzhou invested 51.6 billion CNY in infrastructure construction from 1996 to 2000, which enabled the Guangzhou DZ to achieve rapid economic growth [
59]. A short-term unidirectional Granger causality was identified between the TFP of the DZs and that of the SHCs in the western region; here, the DZ was shown to exhibit Granger causality in relation to the TFP of the SHC, but conversely, the SHC did not exhibit Granger causality regarding the TFP of the DZ. The DZs of the western region were thus found to have a positive influence on the development of their surrounding host cities [
60]. However, due to the overall economic strength of the western cities still being weak, the infrastructure and market environment are not sufficient enough to drive the development of the DZs. Economic development can provide financial guarantees for investments in infrastructure construction [
61]. The economic development of cities in the western region cannot effectively support the expansion of the DZs.
4.4. The Impulse Response Analysis
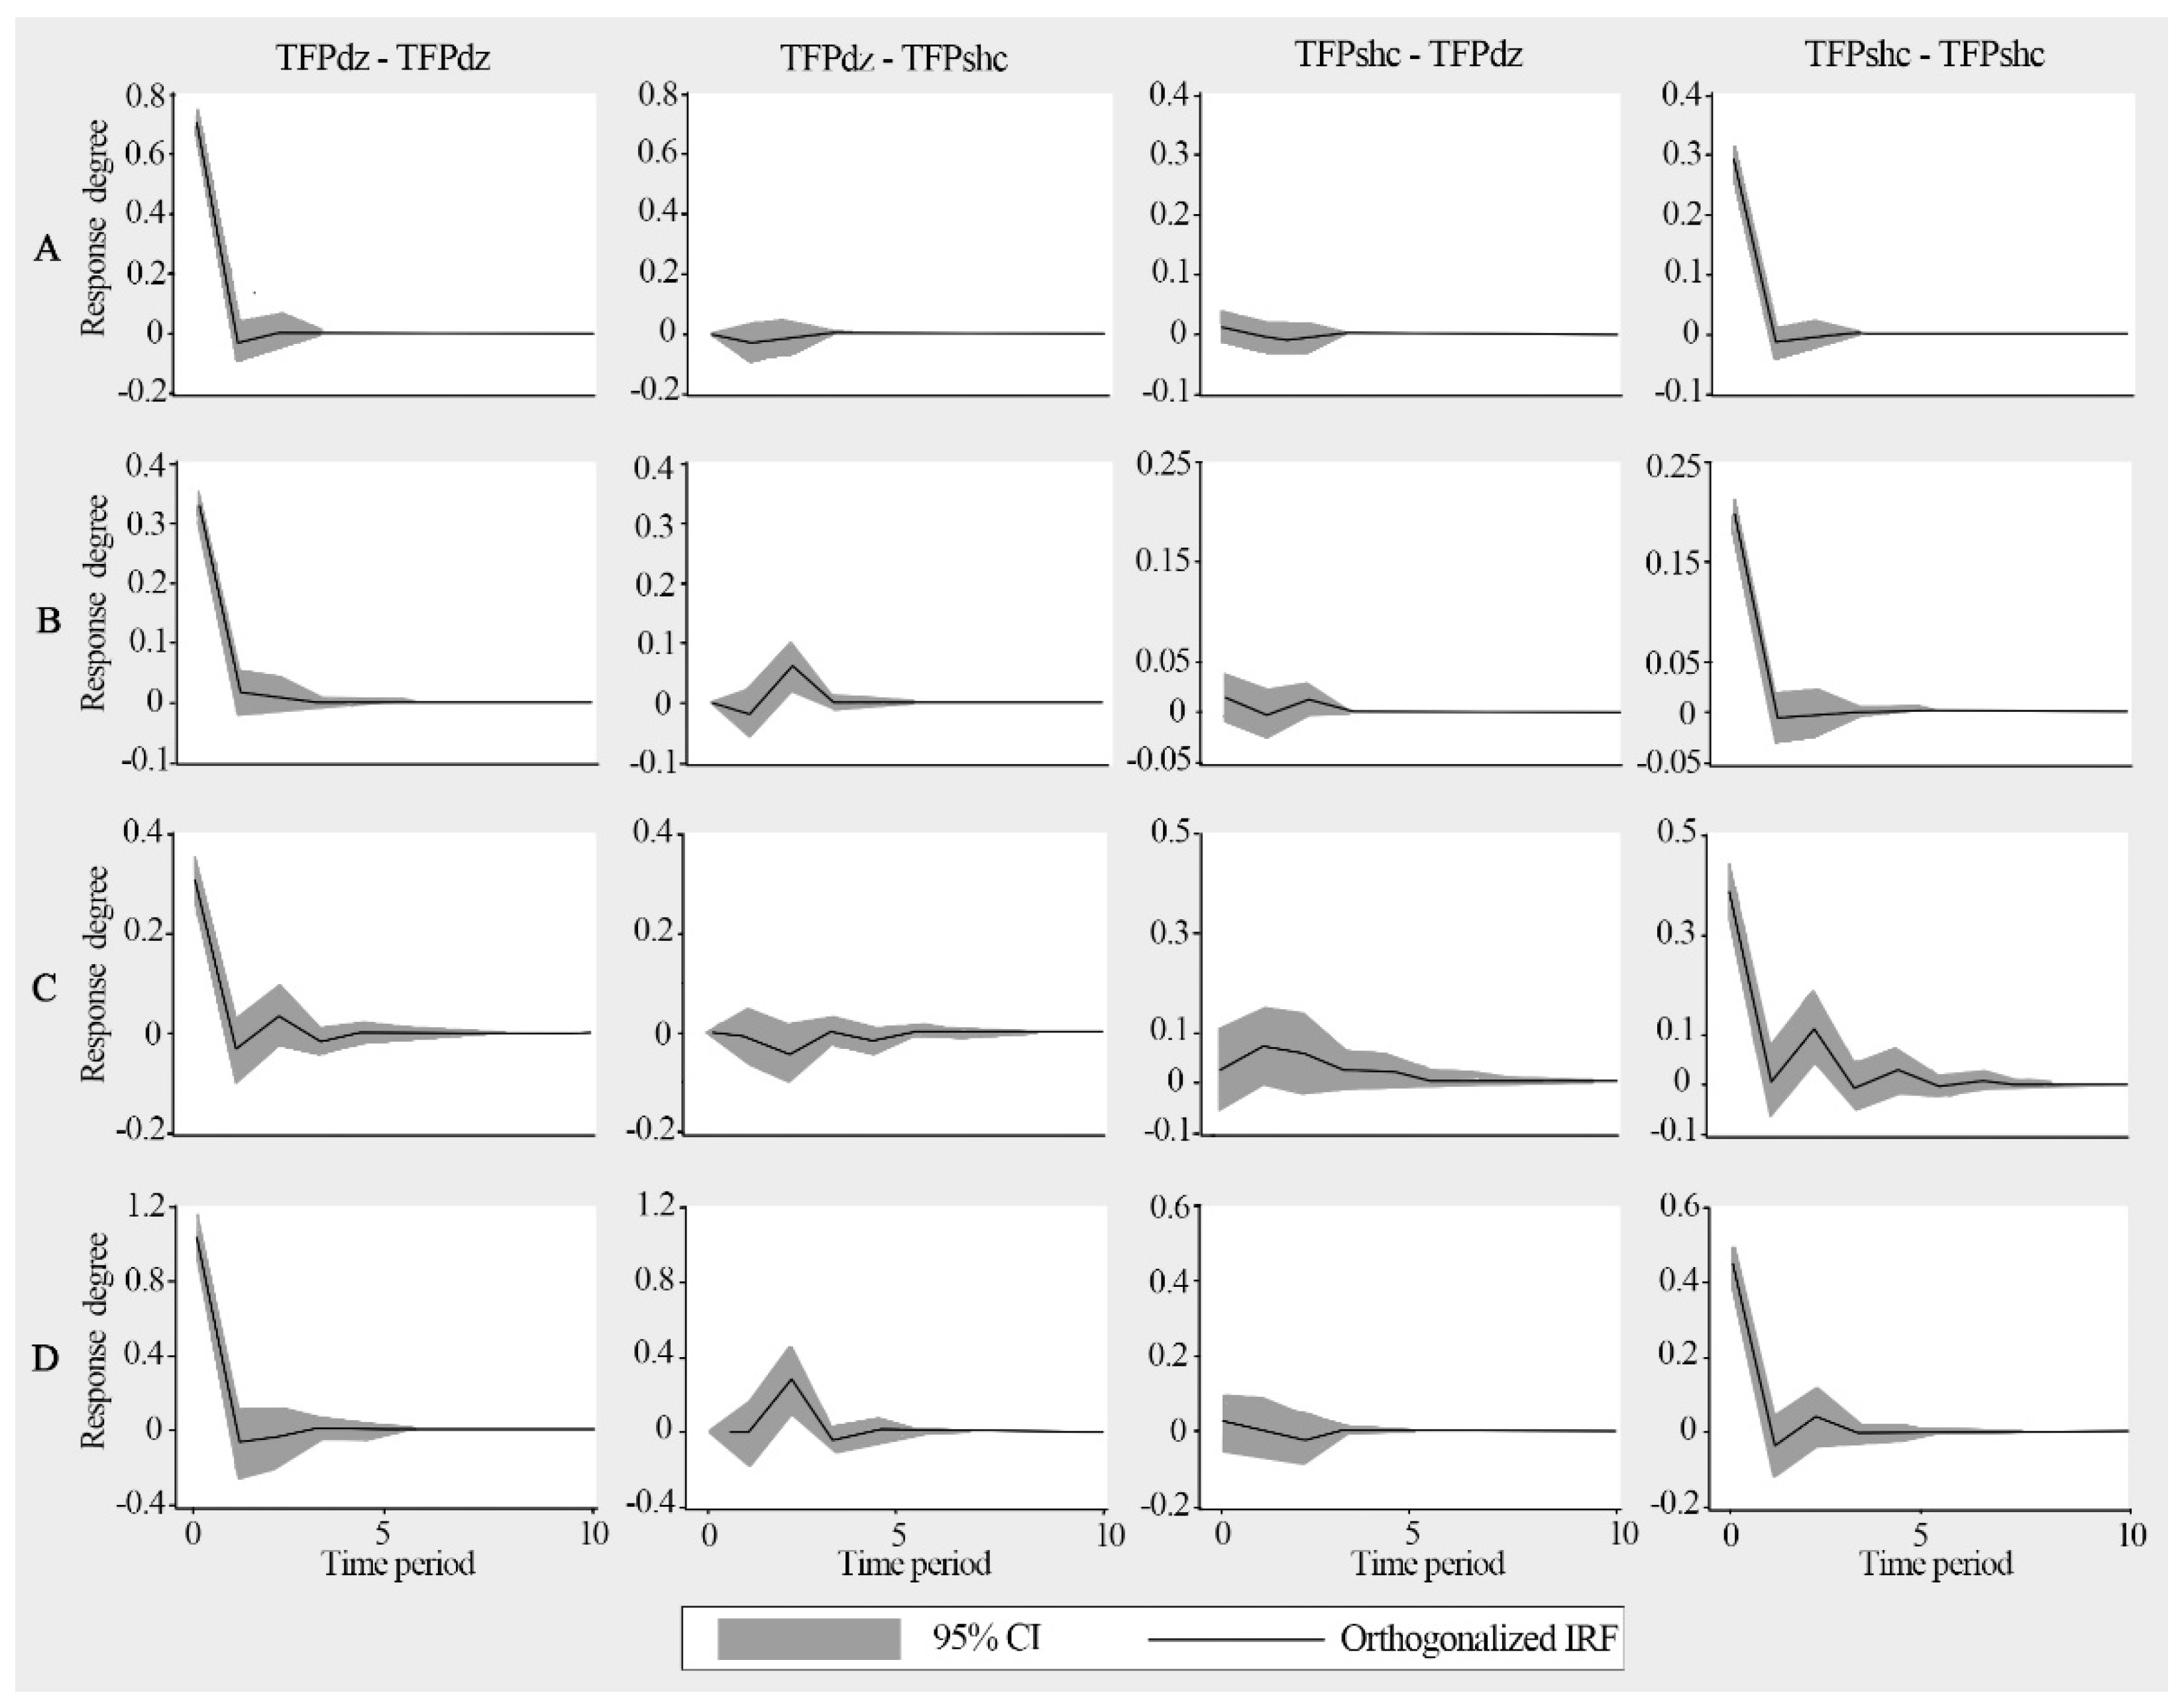
The impulse response function can simulate the long-run dynamic trajectory of one variable in relation to the impact from another variable. Hence, this research utilized the impulse response function to analyze the long-run interaction effects and regional differences between the TFP of the DZs making up the study sample and that of their SHCs.
Figure 4 describes the estimated results of the impulse response function in the whole country and the eastern, central, and western regions within a 10-year time period. The gray area in
Figure 4 represents the 95% confidence interval.
From
Figure 4, it can be seen that the two variables responded quickly and significantly to the impacts of their own variables, indicating the presence of a certain economic inertia in the TFP of the DZs and the SHCs. The impact of the whole country and eastern region and western region panels can be expected to stabilize after 2 years. However, the response of the central region will have a fluctuating effect that will stabilize after 5 years. This indicates that the development of DZs and their SHCs is relatively unstable in the central region and that they will take a longer time to recover when affected by external influences.
For the whole country panel, the TFP of the SHCs did not respond significantly to shocks from the DZs. However, in the eastern and western areas panels, the TFP of the SHCs was significantly positive in response to shocks from the DZs after 1 year, reaching a peak after 2 years. In these regions, the DZs exhibited a marked positive influence on the progress of the SHCs, and the impacts had a certain lag effect (1 year). For the central region panel, when the TFP of the DZs was impacted, the responses of the SHCs showed a weak fluctuation trend. This provides a basis for the conclusion that the DZs and the SHCs operate separately in the central region.
The DZs did not respond strongly to the impacts of the TFP of the SHCs. After 1 year, the TFP of the DZs showed a weak positive response and then gradually stabilized. Although the results of the causality test confirmed that the SHCs had a marked positive influence on the progress of the DZs, this impact was not strong. On the one hand, the DZs had sound infrastructure facilities. When the surrounding environment changed drastically, the DZs showed strong stability. On the other hand, the TFP of the SHCs exhibited a weak impact on the DZs, indicating that the supporting role of the SHCs in relation to the DZs remains weak.
5. Conclusions
Although much scholarly literature exists that has addressed the influence of DZs on urban development, few literatures have focused on the relationship between a DZ and its host city. Filling this gap, this article attempted to explore the causality between DZs and their SHCs from the perspective of TFP. To do this, the study adopted the DEA-based Malmquist production efficiency index method to estimate the TFP of DZs and their SHCs from 2004 to 2018 in China, constructing a quantitative analysis to explore the causality between the two.
The results of the panel unit root test showed that variables were stable at the first differences in all the panels. From the results of the cointegration test, we also found a long-term cointegration relationship among the TFP of the DZs and that of their SHCs. Given this, we then used the panel Granger causality test method to identify the causality among the variables. A long-term causal relationship was found between the TFP of the DZs and that of the SHCs in all the panels. Short-run causality, however, only existed in the eastern and western regions. Specifically, we identified a short-term bidirectional causal relationship between the TFP of the DZs and that of the SHCs in the eastern region and a short-term unidirectional causality in the western region. Furthermore, our test results confirmed that, in the central region, no short-run causality was found between the TFP of the DZs and that of the SHCs. We have reason to believe that the DZs in the central region are relatively isolated and do not have close contact with the surrounding areas.
The impulse response analysis was used to identify the dynamic relationship among the variables. We drew the following conclusions from the results of that analysis. First, the development of the DZs and the SHCs was unstable in the central region, and they will take a long time to recover when subjected to shocks from the outside world. Second, the DZs exhibited a marked positive influence on the progress of their SHCs, and this impact showed a certain lag effect. Third, the DZs’ responses to the impacts exerted by the TFP of the SHCs were not strong, which means that the current support function of the SHCs remains weak.
By providing preferential policies, improving the investment environment, and innovating in terms of the systems and mechanisms, national DZs continue to attract factors of production and innovation and act as the growth pole of regional development [
62,
63]. However, with further development, the DZs also face problems with transformation and upgrading. Enhancing the connection between a DZ and its host city is the key to upgrading DZs’ functions. Based on the existing research, this paper constructed a research framework for the interaction between DZs and their SHCs. We found that, although a long-term causality exists between the economic development of DZs and that of SHCs, the short-run connection is still insufficient. In particular, the development of DZs in the eastern region has not established close enough ties with the surrounding areas. The overall environment of the cities in the western region was also shown to not be able to support further development of the region’s DZs. Our research results provide a new theoretical perspective on realizing mutually beneficial interactions between DZs and SHCs.
In addition, this article puts forward a number of targeted suggestions. First, the industrial connection between DZs and SHCs must be strengthened so as to ensure that the spillover effect of the DZs is felt. On the premise of respecting the laws of the market, the government should engage carefully in the industrial planning of DZs and their SHCs, as well as encouraging more extensive cooperation between enterprises inside and outside of DZs in order to form complementary upstream and downstream industrial chains, in this way strengthening the degree of connection between DZs and the surrounding areas. Second, the government needs to improve the construction of urban infrastructures and supporting services to enhance the supporting functions provided by host cities in relation to DZs. For example, the “islanding effect” of DZs can be broken by improving the transportation infrastructure connecting a DZ to its host city. Furthermore, increasing the number of medical and educational facilities that are located in a DZ is also critical to promoting the integrated development of a DZ and its SHC. Finally, to realize the integrated development of DZs and SHCs, system reform is indispensable. The development of Chinese cities is inseparable from the guidance provided by urban planning. Hence, it is necessary to treat DZs and their SHCs as a whole at the level of urban planning. Through unified planning, regional cooperation and the division of labor can be strengthened, and the industrial functions of DZs can be coordinated with the urban functions of their host cities.
Due to the difficulty of data acquisition of a DZ, this article abandoned the DZs established in recent years when selecting samples. Moreover, the research results of this article only focused on the interactions between DZs and their SHCs, without in-depth discussion on their mechanisms. On the basis of this study, it might prove fruitful to further investigate how to optimize the data and perfect the method. Several potential future extensions of the direction of this work are thus proposed as follows. Firstly, it is necessary to obtain enterprise-level data to conduct research in the future. Other microscopic data are expected to be found in future studies so that this research topic can be addressed much better. Moreover, other models and methods can also be applied to future research to explore the interactive mechanisms between DZs and their SHCs.
Author Contributions
Conceptualization, S.G. and S.W.; methodology, S.G., S.W., and D.S.; software, S.G.; validation, S.G.; formal analysis, S.G.; investigation, S.G.; resources, S.G.; data curation, S.G.; writing—original draft preparation, S.G.; writing—review and editing, S.G., S.W., and D.S.; visualization, S.G.; supervision, S.W. and D.S.; project administration, S.W.; funding acquisition, S.W. All authors have read and agreed to the published version of the manuscript.
Funding
This study was funded by the Humanities and Social Science Foundation of the Ministry of Education of China (no. 21YJAZH087).
Institutional Review Board Statement
Not applicable.
Informed Consent Statement
Not applicable.
Data Availability Statement
The data is contained within the article.
Conflicts of Interest
The authors declare no conflict of interest.
References
- Brenner, N.; Schmid, C. Towards a new epistemology of the urban? City 2015, 19, 151–182. [Google Scholar] [CrossRef]
- Ortega, A.A.; Acielo, J.M.A.E.; Hermida, M.C.H. Mega-regions in the Philippines: Accounting for special economic zones and global-local dynamics. Cities 2015, 48, 130–139. [Google Scholar] [CrossRef]
- Chou, T.L.; Lin, Y.C. Industrial park development across the Taiwan strait. Urban Stud. 2007, 44, 1405–1425. [Google Scholar] [CrossRef]
- Deng, F.F. Development zones and urban land reform in China. Asian Geogr. 2003, 22, 5–25. [Google Scholar] [CrossRef]
- Brun, J.F.; Combes, J.L.; Renard, M.F. Are there spillover effects between coastal and noncoastal regions in China? China Econ. Rev. 2002, 13, 161–169. [Google Scholar] [CrossRef] [Green Version]
- Xie, L.; Swerts, E.; Pumain, D. Economic Development Zones and Urban Growth in China. Cybergeo 2018, 880. [Google Scholar] [CrossRef]
- Oakley, D.; Tsao, H.S. Socioeconomic gains and spillover effects of geographically targeted initiatives to combat economic distress: An examination of Chicago’s Empowerment Zone. Cities 2007, 24, 43–59. [Google Scholar] [CrossRef]
- Busso, M.; Gregory, J.; Kline, P. Assessing the incidence and efficiency of a prominent place based policy. Am. Econ. Rev. 2013, 103, 897–947. [Google Scholar] [CrossRef] [Green Version]
- Ambroziak, A.A. Income tax exemption as a regional state aid in special economic zones and its impact upon development of Polish districts. Oeconomia Copernic. 2016, 7, 245–267. [Google Scholar] [CrossRef] [Green Version]
- Neumark, D.; Kolko, J. Do enterprise zones create jobs? Evidence from California’s enterprise zone program. J. Urban Econ. 2010, 68, 1–19. [Google Scholar] [CrossRef]
- Papke, L.E. Tax policy and urban development: Evidence from the Indiana enterprise zone program. J. Public Econ. 1994, 54, 37–49. [Google Scholar] [CrossRef]
- Coetzee, S.F. Regional development in the Southern African development area. Dev. S. Afr. 1986, 3, 380–398. [Google Scholar] [CrossRef]
- Jauch, H. Export processing zones and the quest for sustainable development: A Southern African perspective. Environ. Urban. 2002, 14, 101–113. [Google Scholar] [CrossRef]
- Shearmur, R.; Doloreux, D. Science parks: Actors or reactors? Canadian science parks in their urban context. Environ. Plan A 2000, 32, 1065–1082. [Google Scholar] [CrossRef]
- Ma, L.J.C. China’s coastal cities: Catalysts for modernization. Geogr. Rev. 1993, 83, 103–104. [Google Scholar] [CrossRef]
- Cartier, C. ‘Zone fever’, the arable land debate, and real estate speculation: China’s evolving land use regime and its geographical contradictions. J. Contemp. China 2001, 10, 445–469. [Google Scholar] [CrossRef]
- Zhang, T. Land market forces and government’s role in sprawl: The case of China. Cities 2000, 17, 123–135. [Google Scholar] [CrossRef]
- Sun, Y.; Ma, A.; Su, H.; Su, S.; Chen, F.; Wang, W.; Weng, M. Does the establishment of development zones really improve industrial land use efficiency? Implications for China’s high-quality development policy. Land Use Policy 2020, 90, 104265. [Google Scholar] [CrossRef]
- Song, M.L.; Wang, J.; Wang, S.H.; Zhao, D.Q. Knowledge accumulation, development potential and efficiency evaluation: An example using the Hainan free trade zone. J. Knowl. Manag. 2019, 23, 1673–1690. [Google Scholar] [CrossRef]
- Zhang, J.F. Interjurisdictional competition for FDI: The case of China’s “development zone fever”. Reg. Sci. Urban Econ. 2011, 41, 145–159. [Google Scholar] [CrossRef]
- Cheng, H.; Liu, Y.; He, S.; Shaw, D. From development zones to edge urban areas in China: A case study of Nansha, Guangzhou City. Cities 2017, 71, 110–122. [Google Scholar] [CrossRef]
- Zhuang, L.; Ye, C. Changing imbalance: Spatial production of national high-tech industrial development zones in China (1988-2018). Land Use Policy 2020, 94, 104512. [Google Scholar] [CrossRef]
- Diez-Vial, I.; Fernandez-Olmos, M. Knowledge spillovers in science and technology parks: How can firms benefit most? J. Technol. Transf. 2015, 40, 70–84. [Google Scholar] [CrossRef]
- Coe, N. A hybrid agglomeration? The development of a satellite-marshallian industrial district in Vancouver’s film industry. Urban Stud. 2001, 38, 1753–1775. [Google Scholar] [CrossRef]
- Staber, U. Accounting for variations in the performance of industrial districts: The case of Baden-Wurttemberg. Int. J. Urban Reg. Res. 1996, 20, 299–316. [Google Scholar] [CrossRef]
- Wei, Y.D.; Leung, C.K. Development zones, foreign investment, and global city formation in Shanghai*. Growth Change 2010, 36, 16–40. [Google Scholar] [CrossRef]
- Alder, S.; Shao, L.; Zilibotti, F. Economic reforms and industrial policy in a panel of Chinese cities. J. Econ. Growth 2016, 21, 305–349. [Google Scholar] [CrossRef]
- Wei, Y.D.; Yuan, F.; Liao, H. Spatial mismatch and determinants of foreign and domestic information and communication technology firms in urban China. Prof. Geogr. 2013, 65, 247–264. [Google Scholar] [CrossRef]
- Zheng, S.; Sun, W.; Wu, J.; Kahn, M.E. The birth of edge cities in China: Measuring the spillover effects of industrial parks. J. Urban Econ. 2017, 100, 80–103. [Google Scholar] [CrossRef]
- Huang, Z.; He, C.; Wei, Y.H.D. A comparative study of land efficiency of electronics firms located within and outside development zones in Shanghai. Habitat Int. 2016, 56, 63–73. [Google Scholar] [CrossRef]
- Marshall, A. Principles of economics. Political Sci. Q. 1961, 31, 430–444. [Google Scholar] [CrossRef]
- Wong, S.W.; Tang, B.S. Challenges to the sustainability of ‘development zones’: A case study of Guangzhou Development District, China. Cities 2005, 22, 303–316. [Google Scholar] [CrossRef]
- Huang, Z.; He, C.; Zhu, S. Do China’s economic development zones improve land use efficiency? The effects of selection, factor accumulation and agglomeration. Landsc. Urban Plan. 2017, 162, 145–156. [Google Scholar] [CrossRef]
- Luo, D.; Liu, Y.; Wu, Y.; Zhu, X.; Jin, X. Does development zone have spillover effect in China? J. Asia Pac. Econ. 2015, 20, 489–516. [Google Scholar] [CrossRef]
- Yeung, Y.M.; Lee, J.; Kee, G. China’s special economic zones at 30. Eurasian Geogr. Econ. 2009, 50, 222–240. [Google Scholar] [CrossRef]
- China Association of Development Zones. China Development Zone Yearbook; Chinese Financial & Economic Publishing House: Beijing, China, 2019. (In Chinese) [Google Scholar]
- National Bureau of Statistics. China City Statistical Yearbook; China Statistics Press: Beijing, China, 2019. (In Chinese)
- Caves, R.E. Multinational Enterprise and Economic Analysis; Cambridge University Press: Cambridge, UK, 1982. [Google Scholar]
- Färe, R.; Grosskopf, S.; Lindgren, B.; Roos, P. Productivity changes in Swedish pharamacies 1980–1989: A non-parametric Malmquist approach. J. Product. Anal. 1992, 3, 81–97. [Google Scholar] [CrossRef]
- Färe, R.; Grosskopf, S.; Zhang, N.Z. Productivity growth, technical progress, and efficiency change in industrialized countries. Am. Econ. Rev. 1994, 84, 66–83. [Google Scholar]
- Bai, X.; Chen, J.; Shi, P. Landscape urbanization and economic growth in China: Positive feedbacks and sustainability dilemmas. Environ. Sci. Technol. 2012, 46, 132–139. [Google Scholar] [CrossRef] [PubMed]
- Choi, I. Unit root tests for panel data. J. Int. Money Financ. 2001, 20, 249–272. [Google Scholar] [CrossRef]
- Maddala, G.S.; Wu, S. A comparative study of unit root tests with panel data and a new simple test. Oxf. Bull. Econ. Stat. 1999, 61, 631–652. [Google Scholar] [CrossRef]
- Feng, T.; Sun, L.; Zhang, Y. The relationship between energy consumption structure, economic structure and energy intensity in China. Energy Policy 2009, 37, 5475–5483. [Google Scholar] [CrossRef]
- Wang, S.; Wang, J.; Zhou, Y. Estimating the effects of socioeconomic structure on CO2 emissions in China using an econometric analysis framework. Struct. Change Econ. Dyn. 2018, 47, 18–27. [Google Scholar] [CrossRef]
- Pedroni, P. Purchasing power parity tests in cointegrated panels. Dep. Econ. Work. Pap. 2001, 83, 727–731. [Google Scholar] [CrossRef] [Green Version]
- Al-Mulali, U.; Fereidouni, H.G.; Lee, J.Y.M.; Sab, C.N.B.C. Exploring the relationship between urbanization, energy consumption, and CO2 emission in MENA countries. Renew. Sustain. Energy Rev. 2013, 23, 107–112. [Google Scholar] [CrossRef]
- Granger, C.W.J. Investigating causal relations by econometric models and cross-spectral methods. Econometrica 1969, 37, 424–438. [Google Scholar] [CrossRef]
- Granger, C.W.J. Testing for causality: A personal viewpoint. J. Econ. Dyn. Control 1980, 2, 329–352. [Google Scholar] [CrossRef]
- Granger, C.W.J. Some recent development in a concept of causality. J. Econom. 1988, 39, 199–211. [Google Scholar] [CrossRef]
- Achour, H.; Belloumi, M. Investigating the causal relationship between transport infrastructure, transport energy consumption and economic growth in Tunisia. Renew. Sustain. Energy Rev. 2016, 56, 988–998. [Google Scholar] [CrossRef]
- Wang, S.; Li, G.; Fang, C. Urbanization, economic growth, energy consumption, and CO2 emissions: Empirical evidence from countries with different income levels. Renew. Sustain. Energy Rev. 2018, 81, 2144–2159. [Google Scholar] [CrossRef]
- Wang, S.; Fang, C.; Guan, X.; Pang, B.; Ma, H. Urbanisation, energy consumption, and carbon dioxide emissions in China: A panel data analysis of China’s provinces. Appl. Energy 2014, 136, 738–749. [Google Scholar] [CrossRef]
- Liddle, B. Demographic dynamics and per capita environmental impact: Using panel regressions and household decompositions to examine population and transport. Popul. Environ. 2004, 26, 23–39. [Google Scholar] [CrossRef]
- Zhang, C.; Zhou, K.; Yang, S.; Shao, Z. Exploring the transformation and upgrading of China’s economy using electricity consumption data: A VAR–VEC based model. Phys. A Statal Mech. Its Appl. 2017, 473, 144–155. [Google Scholar] [CrossRef]
- Kwan, C.Y.K. What are the determinants of the location of foreign direct investment? The Chinese experience. J. Int. Econ. 2000, 51, 379–400. [Google Scholar] [CrossRef]
- Howell, A. Heterogeneous impacts of China’s economic and development zone program. J. Reg. Sci. 2019, 59, 797–818. [Google Scholar] [CrossRef]
- Wang, J. The economic impact of Special Economic Zones: Evidence from Chinese municipalities. J. Dev. Econ. 2013, 101, 133–147. [Google Scholar] [CrossRef]
- Anoverview of Technology. GDD Planning, Science and Technology Bureau; GDD Administration Committee: Guangzhou, China, 2003. (In Chinese)
- Zheng, Z.; Yeerken, W.; Liang, Y.; Zhang, R.; Liu, W. The impact of economic and technological Development Zone on China’s economic pattern. Econ. Geogr. 2019, 39, 26–35. (In Chinese) [Google Scholar]
- Hu, S.; Zhou, L.; Teng, T.; Zhuang, L. Spatial pattern and influencing factors of national and provincial Development Zones in China. Econ. Geogr. 2019, 39, 21–28. (In Chinese) [Google Scholar]
- Cheng, F.; Oort, F.V.; Geertman, S.; Hooimeijer, P. Science parks and the co-location of high-tech small- and medium-sized firms in China’s Shenzhen. Urban Stud. 2013, 51, 1073–1089. [Google Scholar] [CrossRef]
- Walcott, S.M. Chinese industrial and science parks: Bridging the gap. Prof. Geogr. 2002, 54, 349–364. [Google Scholar] [CrossRef] [Green Version]
| Publisher’s Note: MDPI stays neutral with regard to jurisdictional claims in published maps and institutional affiliations. |
© 2021 by the authors. Licensee MDPI, Basel, Switzerland. This article is an open access article distributed under the terms and conditions of the Creative Commons Attribution (CC BY) license (https://creativecommons.org/licenses/by/4.0/).


